Embed Size (px)
Citation preview
2013
Report to the Legislature
Pennsylvania
Commission
on
Sentencing
Harrisburg Office:
408 Forum Building
Capitol Complex
Mail:
PO Box 1045
Harrisburg, PA
17108-1045
Phone:
717.772.3776
Fax:
717.772.8892
URL: http://pasentencing.us
Professor Steven L.
Chanenson
Chair
Judge Sheila A. Woods-
Skipper
Vice Chair
Mark H. Bergstrom
Executive Director
Pennsylvania’s Recidivism Risk Reduction
Incentive Program
January 2013
The Commission is an agency of the General Assembly affiliated with The Pennsylvania State University.
Todd Stephens
Montgomery County
Judge
Royce L. Morris
Defense Attorney
Dauphin County
Francis J. Schultz
District Attorney
Crawford County
The Pennsylvania Commission on Sentencing was created in 1978 for the primary purpose of creating
a consistent and rational statewide sentencing policy to promote fairer and more uniform sentencing practices.
John P. Sabatina, Jr.
COMMISSION MEMBERS
Representative (R)
Daylin B. Leach
Senator (D)
Delaware/Montgomery Counties
Linda K. M. Ludgate
Judge
Berks County
Members selected by the Chief Justice of
Pennsylvania
Vacant
Senator (R)
Jill E. Rangos
Judge
Allegheny County
Rita Donovan Hathaway
Westmoreland County
Professor Steven L. Chanenson, Chair
Judge Sheila A. Woods-Skipper, Vice Chair
Members selected by the President pro
tempore of the Senate
Sheila A. Woods-Skipper
Judge
Philadelphia County
Members selected by the Governor of
Pennsylvania
Members selected by the Speaker of the
House of Representatives
Villanova University School of Law
Professor of Law
Steven L. Chanenson
Philadelphia County
Representative (D)
John E. Wetzel
PA Board of Probation and Parole
Secretary
PA Department of Corrections
Ex officio Members
Carol L. Lavery
PA Victim Advocate
Michael C. PotteigerChairman
Pennsylvania Commission on Sentencing
1
PENNSYLVANIA’S RECIDIVISM RISK REDUCTION INCENTIVE PROGRAM 2013 LEGISLATIVE REPORT
Executive Summary
This is the Pennsylvania Commission on Sentencing’s second Legislative Report on the Recidivism Risk Reduction Incentive [RRRI] Program. The RRRI Program has been in effect since November 2008 and is designed to enhance public safety by encouraging eligible non-violent offenders to participate in programs intended to reduce recidivism. Those offenders who successfully complete the program serve
a reduced minimum sentence. Major findings from the report are as follows:
About 25% of the offenders sentenced to the Department of Corrections had a RRRI sentence.
The RRRI offender was more likely than the non-RRRI offender to be convicted of drug, theft and DUI offenses, and had lower [regular] minimum sentences imposed.
Most RRRI offenders were approved for parole under their RRRI minimum sentence. While only a small percentage of offenders were released at their RRRI minimum [8%], most [62%] were released prior to the expiration of their regular minimum sentence.
Short minimum sentences resulting in the inability of offenders to complete their programming was a major reason that offenders could not be released at the expiration of their RRRI minimum sentence. About 25% of the RRRI sentences were six months or less; 49% were less than one year.
In looking at overall recidivism [new arrest and technical violations combined], the recidivism rate of RRRI offenders was slightly higher than a comparison group after six months [16% vs. 14%]; one year [30% vs. 27%]; and two years [44% vs. 42%]. However, in looking at the specific type of recidivism, RRRI offenders were more likely to have technical violations resulting in a return to prison, while the non-RRRI offender was more likely to have a new arrest.
In the recidivism study, we controlled for other predictors of recidivism and found that RRRI offenders were significantly more likely to recidivate than non-RRRI offenders but only with respect to technical violations resulting in a return to prison, not for new arrests.
The higher technical violation rate of RRRI offenders may be due to closer supervision of these offenders, particularly since the RRRI program is relatively new, and most were released prior to the expiration of their minimum sentence.
Offenders were also more likely to recidivate [both technical violations and re-arrest] if they were convicted of property offenses, had more prior arrests, had higher risk assessment scores, were younger, and from urban counties other than Allegheny County.
Pennsylvania Commission on Sentencing
2
PENNSYLVANIA’S RECIDIVISM RISK REDUCTION INCENTIVE PROGRAM
2013 LEGISLATIVE REPORT
This is the Pennsylvania Commission on Sentencing’s second Legislative Report on the Recidivism Risk Reduction Incentive [RRRI] Program. The RRRI Program has been in effect since November 2008. In this report, we provide information on: 1) offenders sentenced to RRRI; 2) offenders released with a RRRI sentence; and 3) findings from our first recidivism study on RRRI offenders. 1
LEGISLATIVE BACKGROUND OF RECIDIVISM RISK REDUCTION INCENTIVE [RRRI]
The Recidivism Risk Reduction Incentive [RRRI] is a relatively new program designed to enhance public safety by providing eligible non-violent offenders the opportunity to participate in programs intended to reduce recidivism. Those offenders who successfully complete the program serve a reduced minimum sentence. The RRRI program, which became effective on November 24, 2008, was part of a broader correctional reform package signed by Governor Rendell on September 25, 2008 [Act 81 of 2008]. The legislation’s stated purpose for RRRI was ”to create a program that ensures appropriate punishment for persons who commit crimes, encourages prisoner participation in evidence-based programs that reduce the risks of future crime and ensures the openness and accountability of the criminal justice process while ensuring fairness to crime victims” [61 Pa. C.S. §4502].
STATUTORY ELIGIBILITY CRITERIA FOR RRRI
Act 81 of 2008 required that offenders receiving the Recidivism Risk Reduction Incentive must meet certain eligibility criteria [61 Pa. C.S. §4503]:
Sentenced to state confinement. No history of present or past violent behavior. Not convicted for an offense involving a deadly weapon or under the Firearms and Other
Dangerous Articles Statute [18 Pa. C.S. Ch. 61]. Has no current or prior conviction or juvenile adjudication for a personal injury crime as defined
in the Crime Victims Act [P.L. 882, No. 111]. Has no current or prior conviction or juvenile adjudication for the following:
o incest [18 Pa.C.S. §4302] o open lewdness [18 Pa.C.S. §5901] o internet child pornography [18 Pa.C.S. Ch. 76 Subch. C] o any offense that requires sex offender registration [42 Pa.C.S. §9795.1] o certain drug trafficking offenses subject to a mandatory sentence [18 Pa.C.S. §7508 (a)
(1) (iii), (a) (2) (iii), (a) (3) (iii), (a) (4) (iii), (a) (7) (iii), or (a) (8) (iii)
o receive a criminal sentence for 42 Pa. C.S. § 9712.1 (drug offense with firearm]]
Not awaiting trial or sentencing for other charges involving an ineligible offense.
1 The Pennsylvania Commission on Sentencing would like to acknowledge the tremendous assistance provided by the staff at
the Pennsylvania Department of Corrections, the Pennsylvania Board of Probation and Parole, and the Pennsylvania State Police in the preparation of this report.
Pennsylvania Commission on Sentencing
3
2012 LEGISLATIVE CHANGES TO RRRI
Act 122 of 2012 enacted a number of correctional reforms intended to reduce the prison population, while at the same time reducing recidivism. Included in this legislation were changes to the RRRI eligibility criteria. First, any sex offense included in Megan’s Law (as amended by the Adam Walsh Act) was added to the list of ineligible offenses for RRRI [as well as for the State Motivational Boot Camp, the State Intermediate Punishment Program, and the County Intermediate Punishment Program]. Second, it clarified that RRRI shall be used even if a mandatory minimum sentence is otherwise provided by law. Third, it removed simple assault - misdemeanor 3 as an excluded offense for RRRI eligibility. It is estimated that there would be about 5% fewer offenders eligible for RRRI as a result of these changes due to the additional Megan’s Law offenses excluded under the Walsh Act 2 [effective September 4, 2012].
There were two legislative provisions aimed at reducing the number of offenders sentenced to the Department of Corrections with short minimum sentences. These would impact the number of RRRI offenders, as offenders with short minimum sentences have difficulty completing the required programming in order to be released under their RRRI sentences.
First, Act 122 of 2012 prohibits sentences to state incarceration for aggregate sentences comprised exclusively of offenses classified as less than a misdemeanor 2 unless otherwise approved by the Secretary of Corrections [effective August 12, 2012]. During 2011 there were 161 offenders sentenced to DOC whose most serious offense was a M3 [n=40] or M [n=122]. 3 These offenders may currently also be eligible for RRRI sentences.
Second, Act 196 of 2012 permits diversion of short or mid-minimum offenders from state incarceration to county incarceration. A short-minimum offender is defined as an offender who at the time of sentencing has less than one year remaining to be served to reach the minimum sentence, including any RRRI minimum. A mid-minimum offender is defined as an offender who at the time of sentencing has at least one but no more than 2 years remaining to reach the minimum sentence, including a RRRI minimum. It should be noted that this provision conflicts with the correctional reforms of 2008. Statute was modified to require sentences with a maximum sentence of 2 years or more to be served in a state facility unless the county facility is certified less than 110% of the rated capacity or the offense is a DUI and the offender is subject to the extended supervision of the court.
2 This is based upon analysis using offenders sentenced during 2011. Based upon the most serious offense in the judicial
proceeding, the pool of eligible RRRI offenders decreased from 6,365 to 6,061 [-306]. The decrease was attributed to the
inclusion of the expanded list of Megan’s Law offenses; the allowance of M3 simple assault offenses had no impact as these
offenders were sentenced to county jail rather than state prison. [Impact Analysis of Act 122 of 2012 and Act 196 of 2012 by the
Pennsylvania Commission on Sentencing]
3 These numbers are based upon the most serious offense in a judicial proceeding. Aggregation of sentences for some cases
would result in a reduction in this number.
Pennsylvania Commission on Sentencing
4
SENTENCING TO RRRI
Statute requires that the sentencing judge makes the determination whether an offender is eligible for the RRRI incentive. The district attorney can elect to waive the eligibility requirements upon notification to the victim, though the court has the right to refuse the waiver.4 For those offenders deemed eligible for RRRI, the court imposes two sentences: 1) the ‘regular’ minimum and maximum sentence and 2) the RRRI minimum sentence [61 Pa. C.S. §4505]. The RRRI minimum sentence is based upon a percentage of the ‘regular’ minimum sentence: for minimum sentences three years or less, the RRRI sentence is three fourths of the minimum sentence; for minimum sentences over three years the RRRI is five-sixths of the minimum sentence. [The Sentencing Guidelines software, SGS WEB, was revised to automatically calculate the RRRI sentence for eligible offenders.] After a RRRI offender has been sentenced to the Department of Corrections [DOC], the DOC utilizes validated assessment tools to determine the needs and risks of the offender. Based upon these assessment tools, a program plan is developed for the offender that is designed to lower the risk of recidivism.
PAROLE OF THE RRRI OFFENDER The offender is paroled upon expiration of the RRRI sentence upon the following conditions [61 Pa. C.S. §4506]:
The DOC has certified that it conducted an appropriate assessment of the offender’s needs and risks.
The DOC has certified that a program plan designed to reduce recidivism was developed for the
offender.
The DOC informed the offender that he/she must successfully complete the program.
The offender has successfully completed his/her program plan.
The offender has maintained good conduct.
The offender’s reentry program is adequate.
Conditions and requirements for parole have been established for the offender.
Notice was provided by the Board of Probation and Parole to the sentencing judge and district attorney.
The DOC certifies that the offender continues to be RRRI eligible.
The offender poses no reasonable risk to public safety.
4 Ineligibility is waived in less than 1% of the cases [Impact Analysis of Act 122 of 2012 and Act 196 of 2012 by the Pennsylvania
Commission on Sentencing].
Pennsylvania Commission on Sentencing
5
LEGISLATIVE REPORTS
Act 81 of 2008, which provided for the RRRI program, included a mandate that the Department of Corrections, Board of Probation and Parole, and the Pennsylvania Commission on Sentencing monitor and evaluate the RRRI program to ensure that the goals and objectives of the legislation are being fulfilled. Additionally, in odd-numbered years, the Department of Corrections provides a report of its evaluation to the Judiciary Committees. In even-numbered years, the Commission on Sentencing provides its report to the Judiciary Committees. Act 95 of 2010 revised the reporting requirement so that the Department of Corrections provides its report in even numbered years, and the Commission on Sentencing provides its report in odd numbered years [61 Pa. C.S. §4510]. The Department of Correction’s report is to include:
(i) “The number of offenders determined by the department to be eligible offenders under this chapter and the offenses for which the offenders were committed to the custody of the department.
(ii) The number of prisoners committed to the custody of the department who were subject to a recidivism risk reduction incentive minimum sentence.
(iii) The number of prisoners paroled at the recidivism risk reduction incentive minimum date. (iv) Any potential changes that would make the program more effective. (v) The six-month, one-year, three-year, and five-year recidivism rates for prisoners released at
the recidivism risk reduction incentive minimum sentence. (vi) Any other information the department deems relevant.”
The Commission’s report is to include:
(i) “Whether the goals of this chapter could be achieved through amendments to parole or sentencing guidelines.
(ii) The various options for parole or sentencing guidelines under subparagraph (i). (iii) The status of any proposed or implemented guidelines designed to implement the provision
of this chapter. (iv) Any potential changes to the program that would be likely to reduce the risk of recidivism of
prisoners and improve public safety. (v) Any other information the Commission deems relevant.“
OFFENDERS SENTENCED TO RRRI
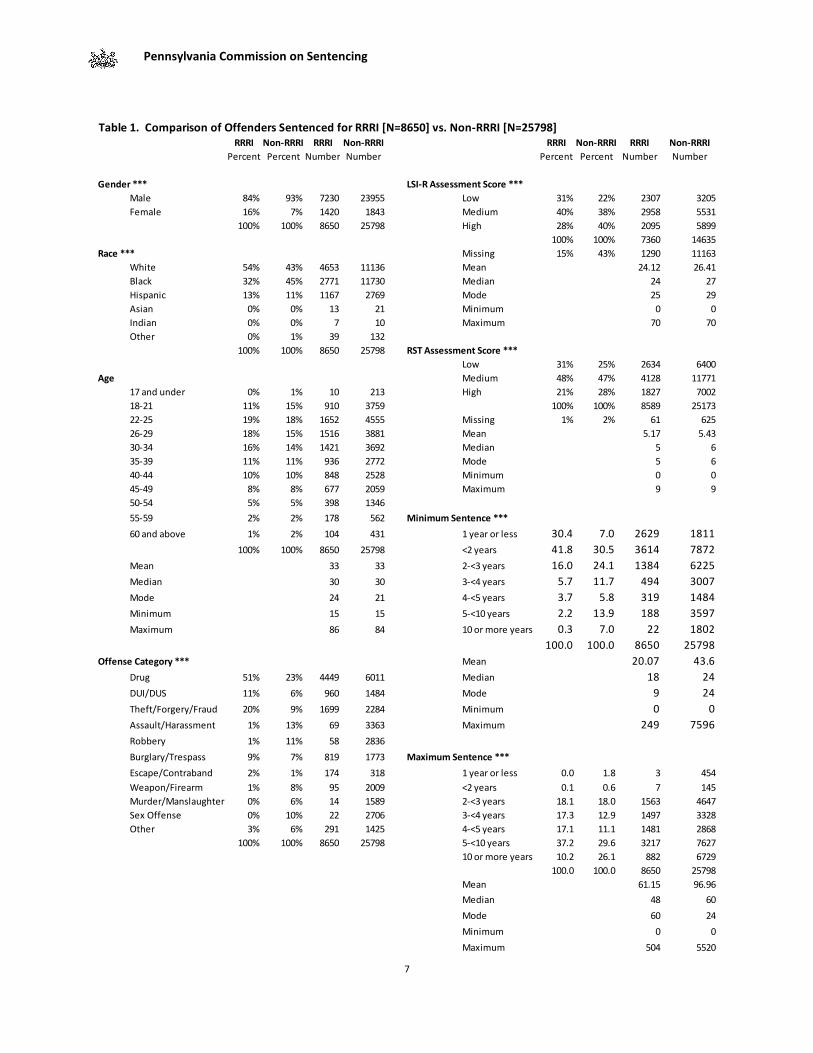
The RRRI Program became effective for offenders sentenced to the Department of Corrections on or after November 24, 2008. Based upon data received from the Department of Corrections, as of December 31, 2011 there have been 34,448 offenders sentenced to the Department of Corrections, and 25% of these offenders had a RRRI minimum sentence [n=8,650]. Table 1 shows the description of the RRRI offender compared to those offenders who did not have a RRRI sentence. There were some significant differences among offenders who were admitted to the DOC with a RRRI sentence compared to those who were not. RRRI offenders were more likely than non-RRRI offenders to be female [16% vs. 7%] and white [54% vs. 43%], though there was no difference in
Pennsylvania Commission on Sentencing
6
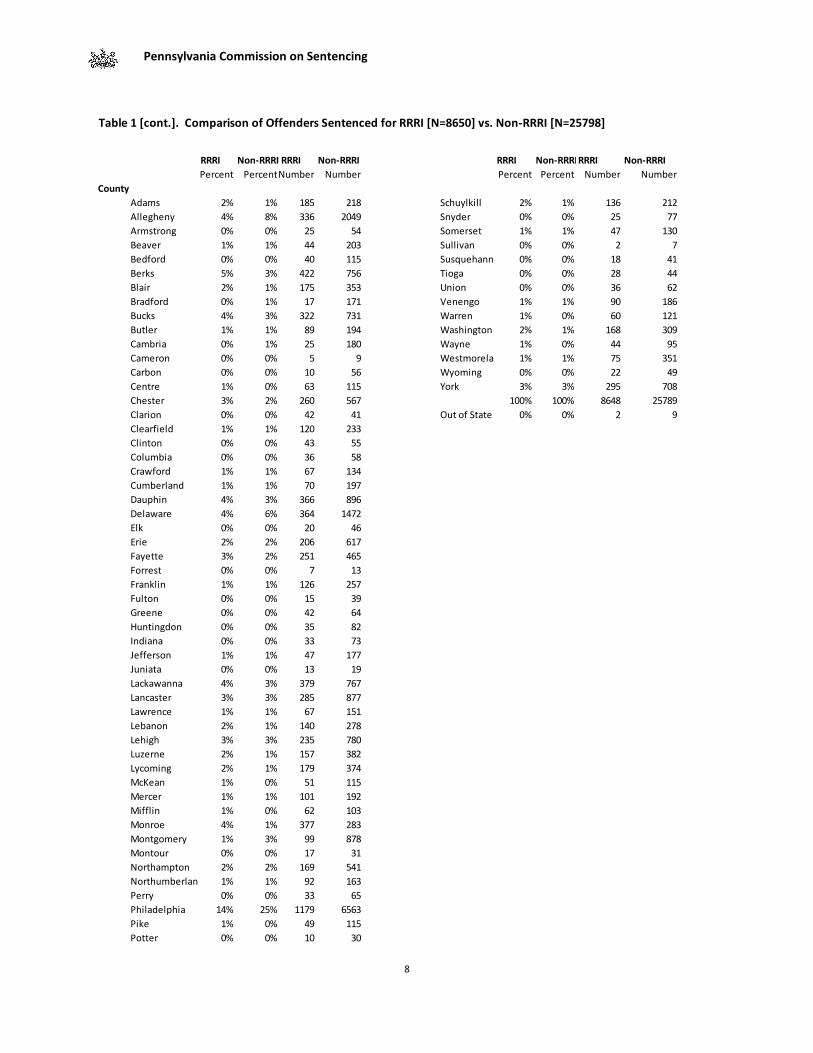
the average age of offenders [33 years]. Philadelphia and Allegheny counties were less likely to have offenders sentenced to RRRI than to non-RRRI [25% vs. 14% and 8% vs. 4% respectively]. As expected, RRRI offenders were more likely than non-RRRI offenders to be convicted of drug [53% vs. 23%], theft [20% vs. 9%], and DUI offenses [11% vs. 6%], and had shorter minimum sentences imposed [average of 20 vs. 44 months]. 5 The RRRI offender was more likely than the non-RRRI offender to be low risk [31% vs. 25%], while the non-RRRI offender was more likely than the RRRI offender to be high risk [28% vs. 21%].
5 The minimum sentence for the RRRI offender is the original minimum sentence imposed, not the RRRI minimum sentence.
Pennsylvania Commission on Sentencing
7
Table 1. Comparison of Offenders Sentenced for RRRI [N=8650] vs. Non-RRRI [N=25798] RRRI Non-RRRI RRRI Non-RRRI RRRI Non-RRRI RRRI Non-RRRI
Percent Percent Number Number Percent Percent Number Number
Gender *** LSI-R Assessment Score ***
Male 84% 93% 7230 23955 Low 31% 22% 2307 3205
Female 16% 7% 1420 1843 Medium 40% 38% 2958 5531
100% 100% 8650 25798 High 28% 40% 2095 5899
100% 100% 7360 14635
Race *** Missing 15% 43% 1290 11163
White 54% 43% 4653 11136 Mean 24.12 26.41
Black 32% 45% 2771 11730 Median 24 27
Hispanic 13% 11% 1167 2769 Mode 25 29
Asian 0% 0% 13 21 Minimum 0 0
Indian 0% 0% 7 10 Maximum 70 70
Other 0% 1% 39 132
100% 100% 8650 25798 RST Assessment Score ***
Low 31% 25% 2634 6400
Age Medium 48% 47% 4128 11771
17 and under 0% 1% 10 213 High 21% 28% 1827 7002
18-21 11% 15% 910 3759 100% 100% 8589 25173
22-25 19% 18% 1652 4555 Missing 1% 2% 61 625
26-29 18% 15% 1516 3881 Mean 5.17 5.43
30-34 16% 14% 1421 3692 Median 5 6
35-39 11% 11% 936 2772 Mode 5 6
40-44 10% 10% 848 2528 Minimum 0 0
45-49 8% 8% 677 2059 Maximum 9 9
50-54 5% 5% 398 1346
55-59 2% 2% 178 562 Minimum Sentence ***
60 and above 1% 2% 104 431 1 year or less 30.4 7.0 2629 1811
100% 100% 8650 25798 <2 years 41.8 30.5 3614 7872
Mean 33 33 2-<3 years 16.0 24.1 1384 6225
Median 30 30 3-<4 years 5.7 11.7 494 3007
Mode 24 21 4-<5 years 3.7 5.8 319 1484
Minimum 15 15 5-<10 years 2.2 13.9 188 3597
Maximum 86 84 10 or more years 0.3 7.0 22 1802
100.0 100.0 8650 25798
Offense Category *** Mean 20.07 43.6
Drug 51% 23% 4449 6011 Median 18 24
DUI/DUS 11% 6% 960 1484 Mode 9 24
Theft/Forgery/Fraud 20% 9% 1699 2284 Minimum 0 0
Assault/Harassment 1% 13% 69 3363 Maximum 249 7596
Robbery 1% 11% 58 2836
Burglary/Trespass 9% 7% 819 1773 Maximum Sentence ***
Escape/Contraband 2% 1% 174 318 1 year or less 0.0 1.8 3 454
Weapon/Firearm 1% 8% 95 2009 <2 years 0.1 0.6 7 145
Murder/Manslaughter 0% 6% 14 1589 2-<3 years 18.1 18.0 1563 4647
Sex Offense 0% 10% 22 2706 3-<4 years 17.3 12.9 1497 3328
Other 3% 6% 291 1425 4-<5 years 17.1 11.1 1481 2868
100% 100% 8650 25798 5-<10 years 37.2 29.6 3217 7627
10 or more years 10.2 26.1 882 6729
100.0 100.0 8650 25798
Mean 61.15 96.96
Median 48 60
Mode 60 24
Minimum 0 0
Maximum 504 5520
Pennsylvania Commission on Sentencing
8
Table 1 [cont.]. Comparison of Offenders Sentenced for RRRI [N=8650] vs. Non-RRRI [N=25798]
RRRI Non-RRRI RRRI Non-RRRI RRRI Non-RRRIRRRI Non-RRRI
Percent PercentNumber Number Percent Percent Number Number
County
Adams 2% 1% 185 218 Schuylkill 2% 1% 136 212
Allegheny 4% 8% 336 2049 Snyder 0% 0% 25 77
Armstrong 0% 0% 25 54 Somerset 1% 1% 47 130
Beaver 1% 1% 44 203 Sullivan 0% 0% 2 7
Bedford 0% 0% 40 115 Susquehanna 0% 0% 18 41
Berks 5% 3% 422 756 Tioga 0% 0% 28 44
Blair 2% 1% 175 353 Union 0% 0% 36 62
Bradford 0% 1% 17 171 Venengo 1% 1% 90 186
Bucks 4% 3% 322 731 Warren 1% 0% 60 121
Butler 1% 1% 89 194 Washington 2% 1% 168 309
Cambria 0% 1% 25 180 Wayne 1% 0% 44 95
Cameron 0% 0% 5 9 Westmoreland 1% 1% 75 351
Carbon 0% 0% 10 56 Wyoming 0% 0% 22 49
Centre 1% 0% 63 115 York 3% 3% 295 708
Chester 3% 2% 260 567 100% 100% 8648 25789
Clarion 0% 0% 42 41 Out of State 0% 0% 2 9
Clearfield 1% 1% 120 233
Clinton 0% 0% 43 55
Columbia 0% 0% 36 58
Crawford 1% 1% 67 134
Cumberland 1% 1% 70 197
Dauphin 4% 3% 366 896
Delaware 4% 6% 364 1472
Elk 0% 0% 20 46
Erie 2% 2% 206 617
Fayette 3% 2% 251 465
Forrest 0% 0% 7 13
Franklin 1% 1% 126 257
Fulton 0% 0% 15 39
Greene 0% 0% 42 64
Huntingdon 0% 0% 35 82
Indiana 0% 0% 33 73
Jefferson 1% 1% 47 177
Juniata 0% 0% 13 19
Lackawanna 4% 3% 379 767
Lancaster 3% 3% 285 877
Lawrence 1% 1% 67 151
Lebanon 2% 1% 140 278
Lehigh 3% 3% 235 780
Luzerne 2% 1% 157 382
Lycoming 2% 1% 179 374
McKean 1% 0% 51 115
Mercer 1% 1% 101 192
Mifflin 1% 0% 62 103
Monroe 4% 1% 377 283
Montgomery 1% 3% 99 878
Montour 0% 0% 17 31
Northampton 2% 2% 169 541
Northumberland 1% 1% 92 163
Perry 0% 0% 33 65
Philadelphia 14% 25% 1179 6563
Pike 1% 0% 49 115
Potter 0% 0% 10 30
Pennsylvania Commission on Sentencing
9
62%
38%
0%
10%
20%
30%
40%
50%
60%
70%
Released Prior toRegular Minimum
Released PastRegular Minimum
Figure 1. Percent of RRRI Offenders Released Before and After their Regular Minimum
Sentence
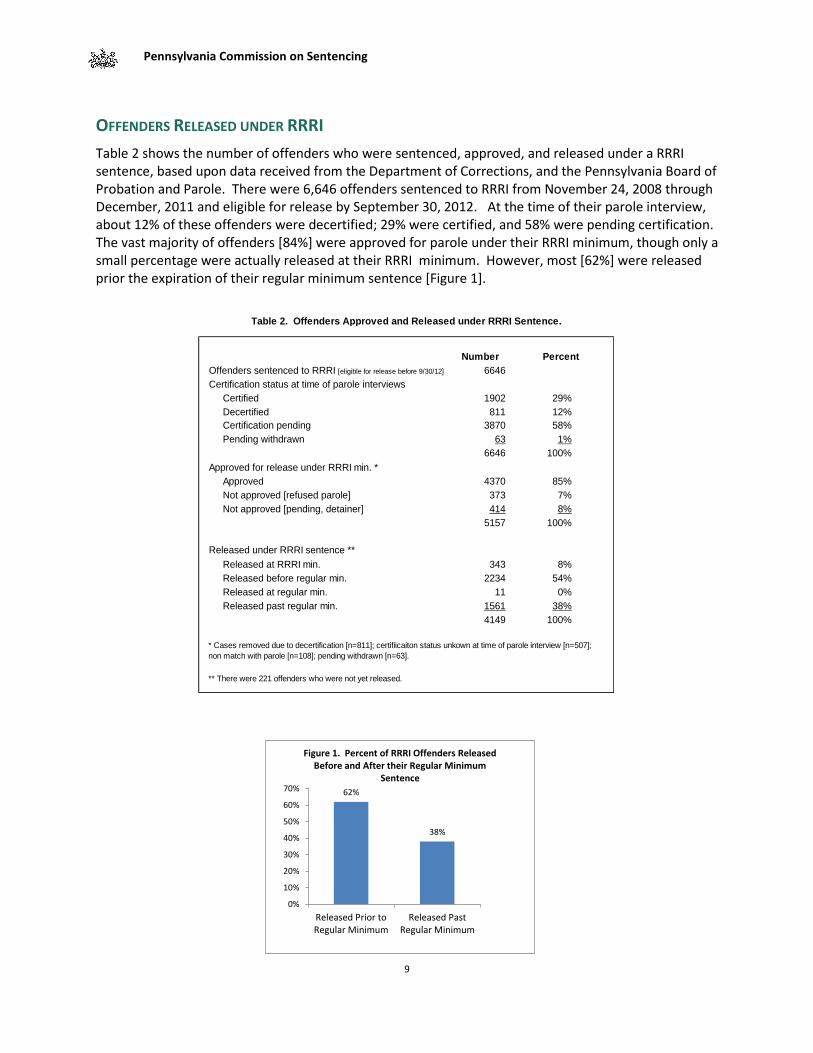
Number Percent
Offenders sentenced to RRRI [eligible for release before 9/30/12] 6646
Certification status at time of parole interviews
Certified 1902 29%
Decertified 811 12%
Certification pending 3870 58%
Pending withdrawn 63 1%
6646 100%
Approved for release under RRRI min. *
Approved 4370 85%
Not approved [refused parole] 373 7%
Not approved [pending, detainer] 414 8%
5157 100%
Released under RRRI sentence **
Released at RRRI min. 343 8%
Released before regular min. 2234 54%
Released at regular min. 11 0%
Released past regular min. 1561 38%
4149 100%
* Cases removed due to decertification [n=811]; certifiicaiton status unkown at time of parole interview [n=507];
non match with parole [n=108]; pending withdrawn [n=63].
** There were 221 offenders who were not yet released.
Table 2. Offenders Approved and Released under RRRI Sentence.
OFFENDERS RELEASED UNDER RRRI
Table 2 shows the number of offenders who were sentenced, approved, and released under a RRRI sentence, based upon data received from the Department of Corrections, and the Pennsylvania Board of Probation and Parole. There were 6,646 offenders sentenced to RRRI from November 24, 2008 through December, 2011 and eligible for release by September 30, 2012. At the time of their parole interview, about 12% of these offenders were decertified; 29% were certified, and 58% were pending certification. The vast majority of offenders [84%] were approved for parole under their RRRI minimum, though only a small percentage were actually released at their RRRI minimum. However, most [62%] were released prior the expiration of their regular minimum sentence [Figure 1].
Pennsylvania Commission on Sentencing
10
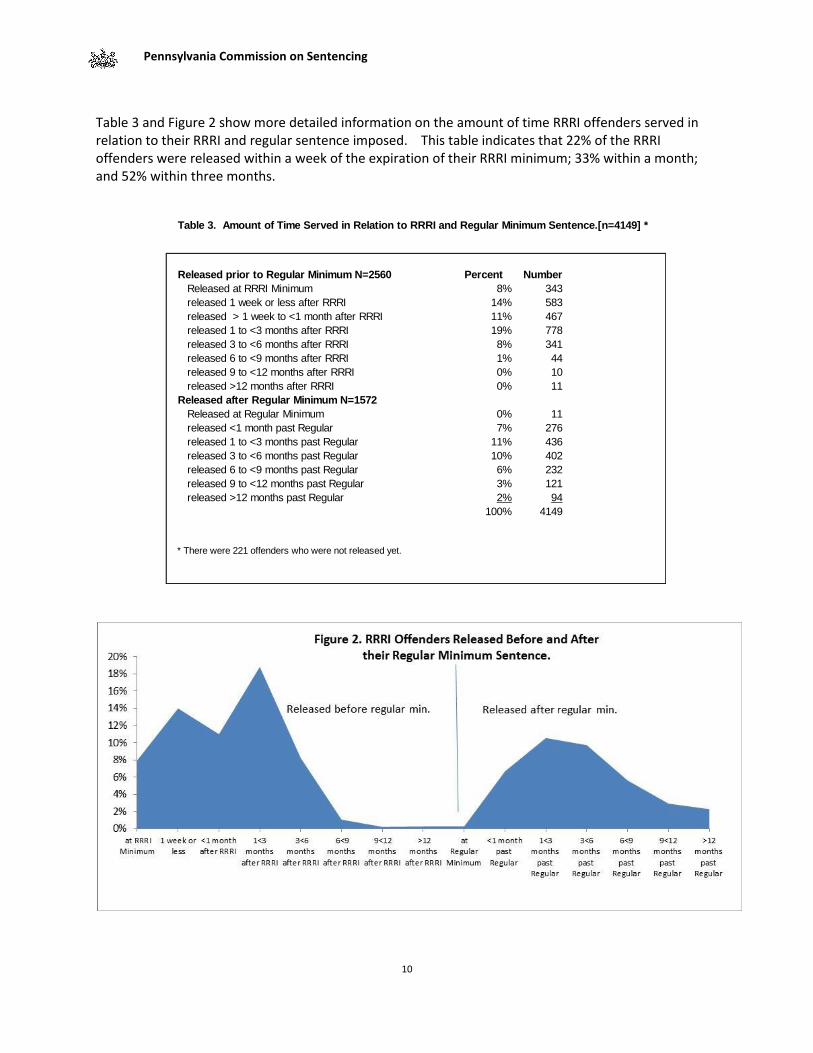
Table 3. Amount of Time Served in Relation to RRRI and Regular Minimum Sentence.[n=4149] *
Released prior to Regular Minimum N=2560 Percent Number
Released at RRRI Minimum 8% 343
released 1 week or less after RRRI 14% 583
released > 1 week to <1 month after RRRI 11% 467
released 1 to <3 months after RRRI 19% 778
released 3 to <6 months after RRRI 8% 341
released 6 to <9 months after RRRI 1% 44
released 9 to <12 months after RRRI 0% 10
released >12 months after RRRI 0% 11
Released after Regular Minimum N=1572
Released at Regular Minimum 0% 11
released <1 month past Regular 7% 276
released 1 to <3 months past Regular 11% 436
released 3 to <6 months past Regular 10% 402
released 6 to <9 months past Regular 6% 232
released 9 to <12 months past Regular 3% 121
released >12 months past Regular 2% 94
100% 4149
* There were 221 offenders who were not released yet.
Table 3 and Figure 2 show more detailed information on the amount of time RRRI offenders served in relation to their RRRI and regular sentence imposed. This table indicates that 22% of the RRRI offenders were released within a week of the expiration of their RRRI minimum; 33% within a month; and 52% within three months.
Pennsylvania Commission on Sentencing
11
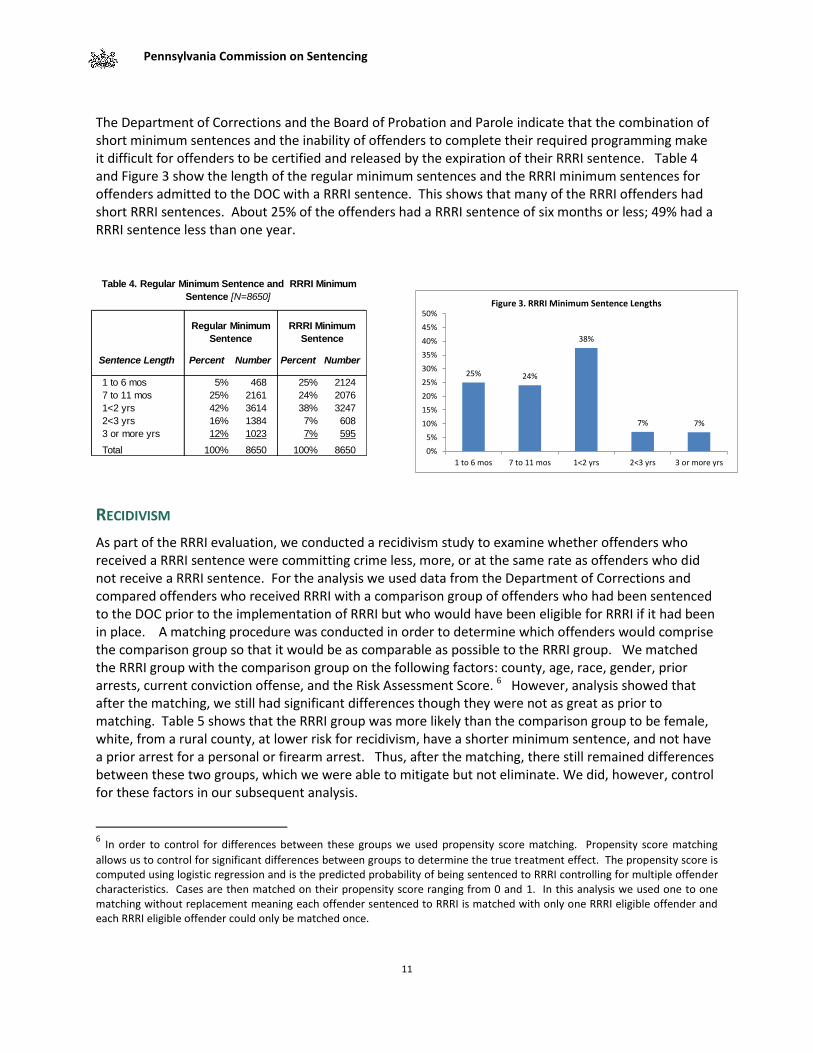
25% 24%
38%
7% 7%
0%
5%
10%
15%
20%
25%
30%
35%
40%
45%
50%
1 to 6 mos 7 to 11 mos 1<2 yrs 2<3 yrs 3 or more yrs
Figure 3. RRRI Minimum Sentence Lengths
Sentence Length Percent Number Percent Number
1 to 6 mos 5% 468 25% 2124
7 to 11 mos 25% 2161 24% 2076
1<2 yrs 42% 3614 38% 3247
2<3 yrs 16% 1384 7% 608
3 or more yrs 12% 1023 7% 595
Total 100% 8650 100% 8650
Regular Minimum
Sentence
RRRI Minimum
Sentence
Table 4. Regular Minimum Sentence and RRRI Minimum
Sentence [N=8650]
The Department of Corrections and the Board of Probation and Parole indicate that the combination of short minimum sentences and the inability of offenders to complete their required programming make it difficult for offenders to be certified and released by the expiration of their RRRI sentence. Table 4 and Figure 3 show the length of the regular minimum sentences and the RRRI minimum sentences for offenders admitted to the DOC with a RRRI sentence. This shows that many of the RRRI offenders had short RRRI sentences. About 25% of the offenders had a RRRI sentence of six months or less; 49% had a RRRI sentence less than one year.
RECIDIVISM
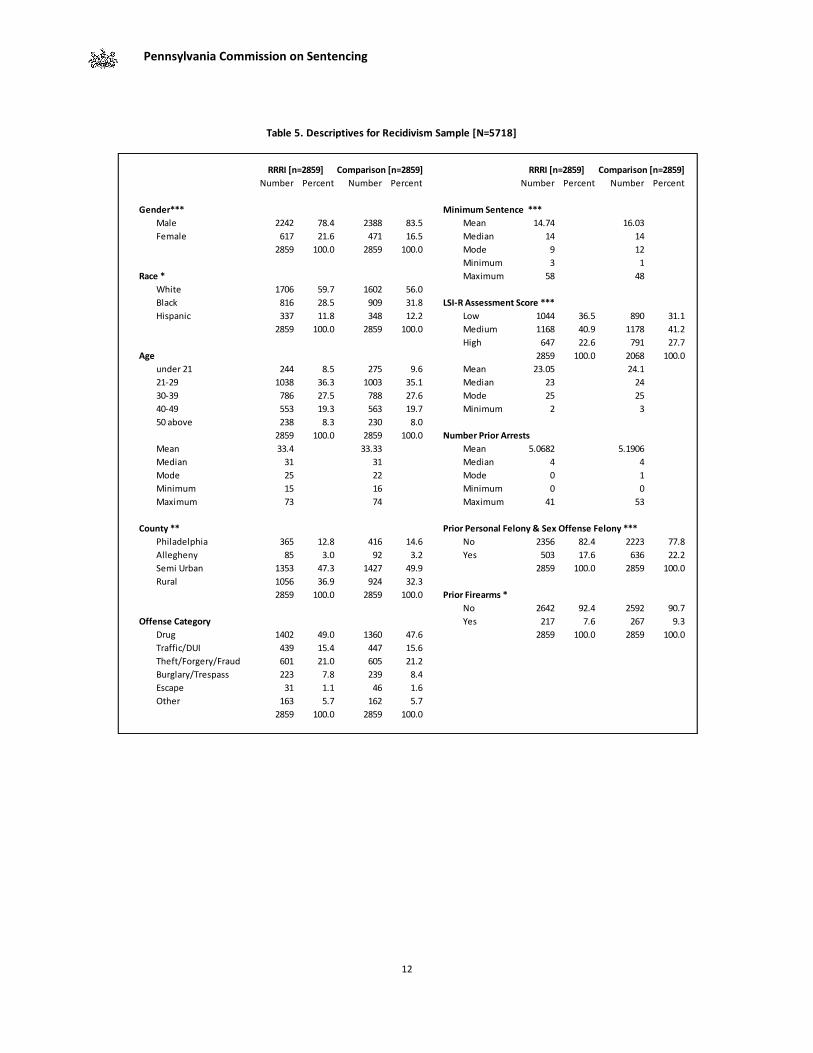
As part of the RRRI evaluation, we conducted a recidivism study to examine whether offenders who received a RRRI sentence were committing crime less, more, or at the same rate as offenders who did not receive a RRRI sentence. For the analysis we used data from the Department of Corrections and compared offenders who received RRRI with a comparison group of offenders who had been sentenced to the DOC prior to the implementation of RRRI but who would have been eligible for RRRI if it had been in place. A matching procedure was conducted in order to determine which offenders would comprise the comparison group so that it would be as comparable as possible to the RRRI group. We matched the RRRI group with the comparison group on the following factors: county, age, race, gender, prior arrests, current conviction offense, and the Risk Assessment Score. 6 However, analysis showed that after the matching, we still had significant differences though they were not as great as prior to matching. Table 5 shows that the RRRI group was more likely than the comparison group to be female, white, from a rural county, at lower risk for recidivism, have a shorter minimum sentence, and not have a prior arrest for a personal or firearm arrest. Thus, after the matching, there still remained differences between these two groups, which we were able to mitigate but not eliminate. We did, however, control for these factors in our subsequent analysis.
6 In order to control for differences between these groups we used propensity score matching. Propensity score matching
allows us to control for significant differences between groups to determine the true treatment effect. The propensity score is computed using logistic regression and is the predicted probability of being sentenced to RRRI controlling for multiple offender characteristics. Cases are then matched on their propensity score ranging from 0 and 1. In this analysis we used one to one matching without replacement meaning each offender sentenced to RRRI is matched with only one RRRI eligible offender and each RRRI eligible offender could only be matched once.
Pennsylvania Commission on Sentencing
12
Number Percent Number Percent Number Percent Number Percent
Gender*** Minimum Sentence ***
Male 2242 78.4 2388 83.5 Mean 14.74 16.03
Female 617 21.6 471 16.5 Median 14 14
2859 100.0 2859 100.0 Mode 9 12
Minimum 3 1
Race * Maximum 58 48
White 1706 59.7 1602 56.0
Black 816 28.5 909 31.8 LSI-R Assessment Score ***
Hispanic 337 11.8 348 12.2 Low 1044 36.5 890 31.1
2859 100.0 2859 100.0 Medium 1168 40.9 1178 41.2
High 647 22.6 791 27.7
Age 2859 100.0 2068 100.0
under 21 244 8.5 275 9.6 Mean 23.05 24.1
21-29 1038 36.3 1003 35.1 Median 23 24
30-39 786 27.5 788 27.6 Mode 25 25
40-49 553 19.3 563 19.7 Minimum 2 3
50 above 238 8.3 230 8.0
2859 100.0 2859 100.0 Number Prior Arrests
Mean 33.4 33.33 Mean 5.0682 5.1906
Median 31 31 Median 4 4
Mode 25 22 Mode 0 1
Minimum 15 16 Minimum 0 0
Maximum 73 74 Maximum 41 53
County ** Prior Personal Felony & Sex Offense Felony ***
Philadelphia 365 12.8 416 14.6 No 2356 82.4 2223 77.8
Allegheny 85 3.0 92 3.2 Yes 503 17.6 636 22.2
Semi Urban 1353 47.3 1427 49.9 2859 100.0 2859 100.0
Rural 1056 36.9 924 32.3
2859 100.0 2859 100.0 Prior Firearms *
No 2642 92.4 2592 90.7
Offense Category Yes 217 7.6 267 9.3
Drug 1402 49.0 1360 47.6 2859 100.0 2859 100.0
Traffic/DUI 439 15.4 447 15.6
Theft/Forgery/Fraud 601 21.0 605 21.2
Burglary/Trespass 223 7.8 239 8.4
Escape 31 1.1 46 1.6
Other 163 5.7 162 5.7
2859 100.0 2859 100.0
RRRI [n=2859] Comparison [n=2859]RRRI [n=2859] Comparison [n=2859]
Table 5. Descriptives for Recidivism Sample [N=5718]
Pennsylvania Commission on Sentencing
13
Follow-up timeRRRI Non RRRI Number
6 Months [n=5718]
Arrest *** 7.2 8.1 439
Technical 9.1 6.1 434
Total recidivism * 16.3 14.2 873
1 Year [n=4619]
Arrest *** 14.0 15.6 692
Technical 15.8 11.0 598
Total recidivism * 29.8 26.6 1290
2 Year [n=2485]
Arrest 25.7 25.1 625
Technical 18.2 17.0 427
Total recidivism 43.9 42.1 1052
100.0 100.0 2485
*** Statistically sig. at .001. level * Statistically sig. at .01 level
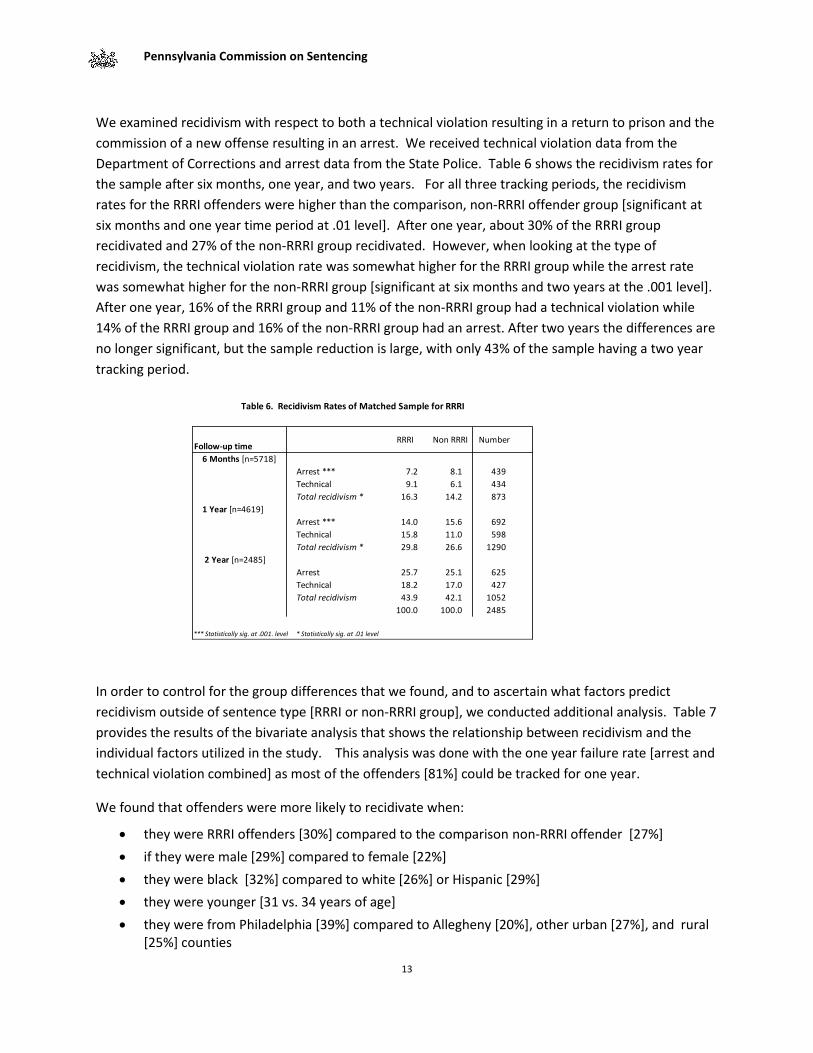
Table 6. Recidivism Rates of Matched Sample for RRRI
We examined recidivism with respect to both a technical violation resulting in a return to prison and the
commission of a new offense resulting in an arrest. We received technical violation data from the
Department of Corrections and arrest data from the State Police. Table 6 shows the recidivism rates for
the sample after six months, one year, and two years. For all three tracking periods, the recidivism
rates for the RRRI offenders were higher than the comparison, non-RRRI offender group [significant at
six months and one year time period at .01 level]. After one year, about 30% of the RRRI group
recidivated and 27% of the non-RRRI group recidivated. However, when looking at the type of
recidivism, the technical violation rate was somewhat higher for the RRRI group while the arrest rate
was somewhat higher for the non-RRRI group [significant at six months and two years at the .001 level].
After one year, 16% of the RRRI group and 11% of the non-RRRI group had a technical violation while
14% of the RRRI group and 16% of the non-RRRI group had an arrest. After two years the differences are
no longer significant, but the sample reduction is large, with only 43% of the sample having a two year
tracking period.
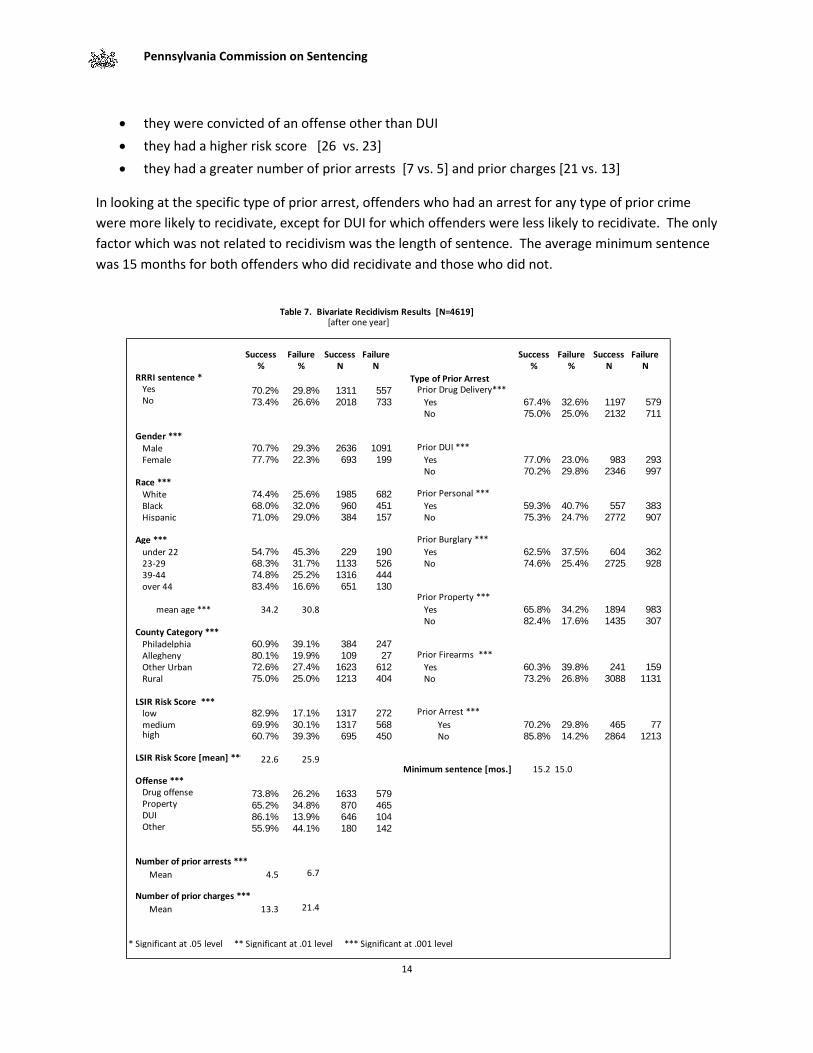
In order to control for the group differences that we found, and to ascertain what factors predict
recidivism outside of sentence type [RRRI or non-RRRI group], we conducted additional analysis. Table 7
provides the results of the bivariate analysis that shows the relationship between recidivism and the
individual factors utilized in the study. This analysis was done with the one year failure rate [arrest and
technical violation combined] as most of the offenders [81%] could be tracked for one year.
We found that offenders were more likely to recidivate when:
they were RRRI offenders [30%] compared to the comparison non-RRRI offender [27%]
if they were male [29%] compared to female [22%]
they were black [32%] compared to white [26%] or Hispanic [29%]
they were younger [31 vs. 34 years of age]
they were from Philadelphia [39%] compared to Allegheny [20%], other urban [27%], and rural [25%] counties
Pennsylvania Commission on Sentencing
14
Success Failure Success Failure Success Failure Success Failure% % N N % % N N
RRRI sentence * Type of Prior ArrestYes 70.2% 29.8% 1311 557 Prior Drug Delivery***No 73.4% 26.6% 2018 733 Yes 67.4% 32.6% 1197 579
No 75.0% 25.0% 2132 711
Gender ***Male 70.7% 29.3% 2636 1091 Prior DUI ***
Female 77.7% 22.3% 693 199 Yes 77.0% 23.0% 983 293
No 70.2% 29.8% 2346 997Race ***
White 74.4% 25.6% 1985 682 Prior Personal ***
Black 68.0% 32.0% 960 451 Yes 59.3% 40.7% 557 383
Hispanic 71.0% 29.0% 384 157 No 75.3% 24.7% 2772 907
Age *** Prior Burglary ***
under 22 54.7% 45.3% 229 190 Yes 62.5% 37.5% 604 362
23-29 68.3% 31.7% 1133 526 No 74.6% 25.4% 2725 928
39-44 74.8% 25.2% 1316 444
over 44 83.4% 16.6% 651 130Prior Property ***
mean age *** 34.2 30.8 Yes 65.8% 34.2% 1894 983
No 82.4% 17.6% 1435 307County Category ***
Philadelphia 60.9% 39.1% 384 247
Allegheny 80.1% 19.9% 109 27 Prior Firearms ***
Other Urban 72.6% 27.4% 1623 612 Yes 60.3% 39.8% 241 159
Rural 75.0% 25.0% 1213 404 No 73.2% 26.8% 3088 1131
LSIR Risk Score ***low 82.9% 17.1% 1317 272 Prior Arrest ***
medium 69.9% 30.1% 1317 568 Yes 70.2% 29.8% 465 77high 60.7% 39.3% 695 450 No 85.8% 14.2% 2864 1213
LSIR Risk Score [mean] *** 22.6 25.9Minimum sentence [mos.] 15.2 15.0
Offense ***Drug offense 73.8% 26.2% 1633 579Property 65.2% 34.8% 870 465DUI 86.1% 13.9% 646 104Other 55.9% 44.1% 180 142
Number of prior arrests ***
Mean 4.5 6.7
Number of prior charges ***
Mean 13.3 21.4
* Significant at .05 level ** Significant at .01 level *** Significant at .001 level
Table 7. Bivariate Recidivism Results [N=4619][after one year]
they were convicted of an offense other than DUI
they had a higher risk score [26 vs. 23]
they had a greater number of prior arrests [7 vs. 5] and prior charges [21 vs. 13]
In looking at the specific type of prior arrest, offenders who had an arrest for any type of prior crime
were more likely to recidivate, except for DUI for which offenders were less likely to recidivate. The only
factor which was not related to recidivism was the length of sentence. The average minimum sentence
was 15 months for both offenders who did recidivate and those who did not.
Pennsylvania Commission on Sentencing
15
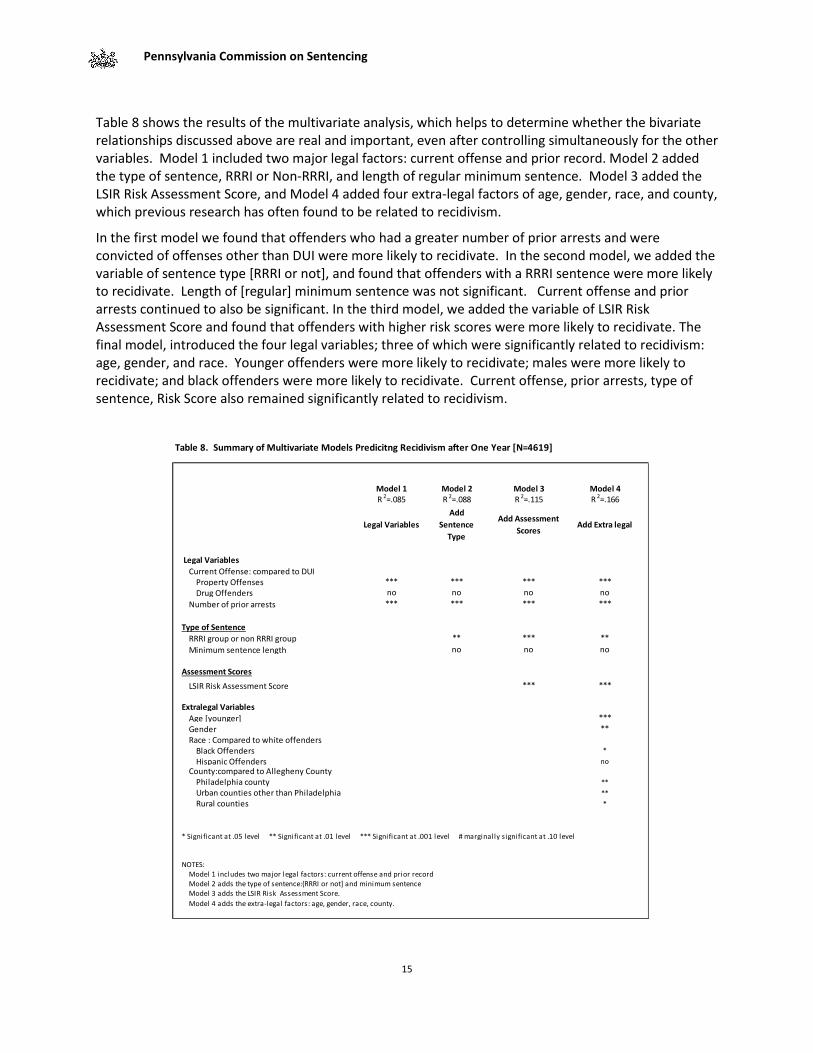
Table 8. Summary of Multivariate Models Predicitng Recidivism after One Year [N=4619]
Model 1 Model 2 Model 3 Model 4R 2=.085 R 2=.088 R 2=.115 R 2=.166
Legal Variables
Add
Sentence
Type
Add Assessment
ScoresAdd Extra legal
Legal Variables
Current Offense: compared to DUIProperty Offenses *** *** *** ***
Drug Offenders no no no no
Number of prior arrests *** *** *** ***
Type of Sentence
RRRI group or non RRRI group ** *** **
Minimum sentence length no no no
Assessment Scores
LSIR Risk Assessment Score *** ***
Extralegal Variables
Age [younger] ***
Gender **
Race : Compared to white offendersBlack Offenders *
Hispanic Offenders no
County:compared to Allegheny CountyPhiladelphia county **
Urban counties other than Philadelphia **
Rural counties *
NOTES:Model 1 includes two major legal factors: current offense and prior recordModel 2 adds the type of sentence:{RRRI or not] and minimum sentenceModel 3 adds the LSIR Risk Assessment Score.
Model 4 adds the extra-legal factors: age, gender, race, county.
* Significant at .05 level ** Significant at .01 level *** Significant at .001 level # marginally significant at .10 level
Table 8 shows the results of the multivariate analysis, which helps to determine whether the bivariate relationships discussed above are real and important, even after controlling simultaneously for the other variables. Model 1 included two major legal factors: current offense and prior record. Model 2 added the type of sentence, RRRI or Non-RRRI, and length of regular minimum sentence. Model 3 added the LSIR Risk Assessment Score, and Model 4 added four extra-legal factors of age, gender, race, and county, which previous research has often found to be related to recidivism.
In the first model we found that offenders who had a greater number of prior arrests and were convicted of offenses other than DUI were more likely to recidivate. In the second model, we added the variable of sentence type [RRRI or not], and found that offenders with a RRRI sentence were more likely to recidivate. Length of [regular] minimum sentence was not significant. Current offense and prior arrests continued to also be significant. In the third model, we added the variable of LSIR Risk Assessment Score and found that offenders with higher risk scores were more likely to recidivate. The final model, introduced the four legal variables; three of which were significantly related to recidivism: age, gender, and race. Younger offenders were more likely to recidivate; males were more likely to recidivate; and black offenders were more likely to recidivate. Current offense, prior arrests, type of sentence, Risk Score also remained significantly related to recidivism.
Pennsylvania Commission on Sentencing
16
Arrest Arrest or return to prison for
for Technical Violation
Legal Variables
Current Offense: compared to DUIProperty Offenses * ***
Drug Offenders no no
Prior arrests [larger number of prior arrests] *** *** ***
Type of SentenceSentenced to RRRI no **
Minimum sentence length no no
Assessment ScoresLSIR Risk Assessment Score *** ***
Extralegal Variables
Age [younger] *** ***
Gender no **
Race: compared to white offendersBlack Offenders ** *
Hispanic Offenders no no
County: compared to Allegheny CountyPhiladelphia county *** **
Urban counties other than Alleg. And Phil. * **
Rural counties # *
NOTES:
Model 1 includes two major legal factors: current offense and prior record
Model 2 adds the type of sentence [RRRI or not] and minimum sentence
Model 3 adds the LSIR Risk Assessment Score
Model 4 adds the extra-legal factors: age, gender, race, county
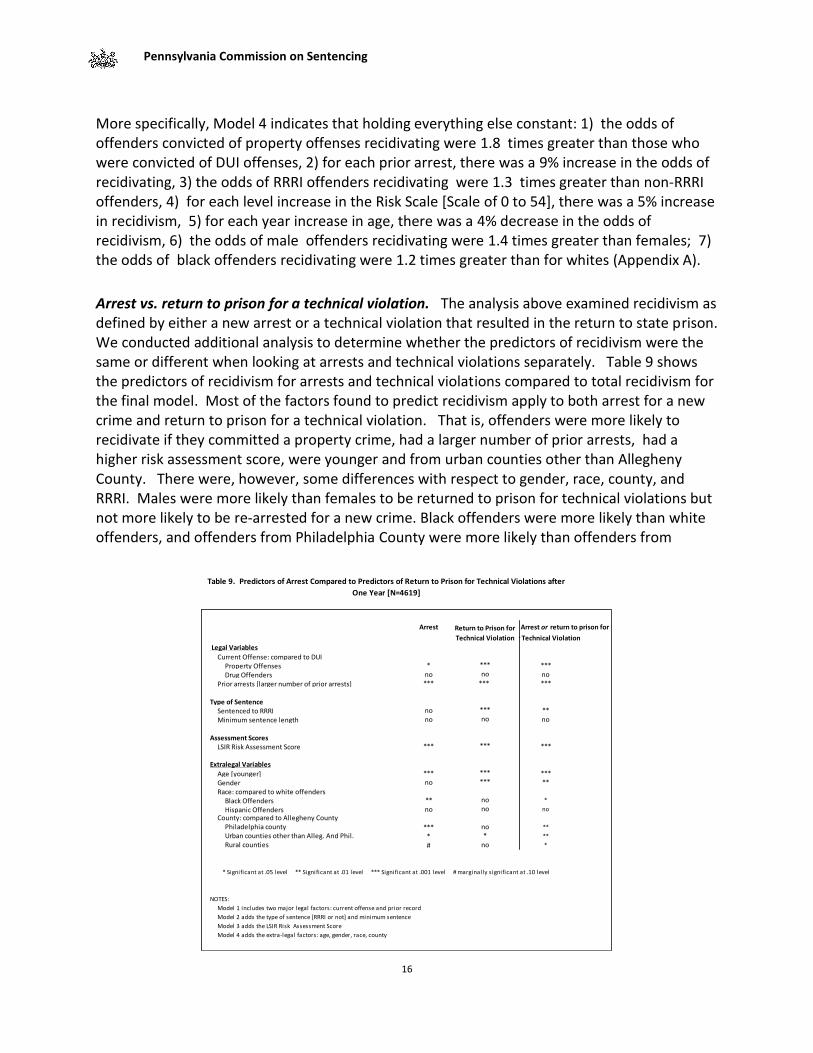
Table 9. Predictors of Arrest Compared to Predictors of Return to Prison for Technical Violations after
One Year [N=4619]
* Significant at .05 level ** Significant at .01 level *** Significant at .001 level # marginally significant at .10 level
***
no***
no***
Return to Prison for
Technical Violation
nono
no*
no
******
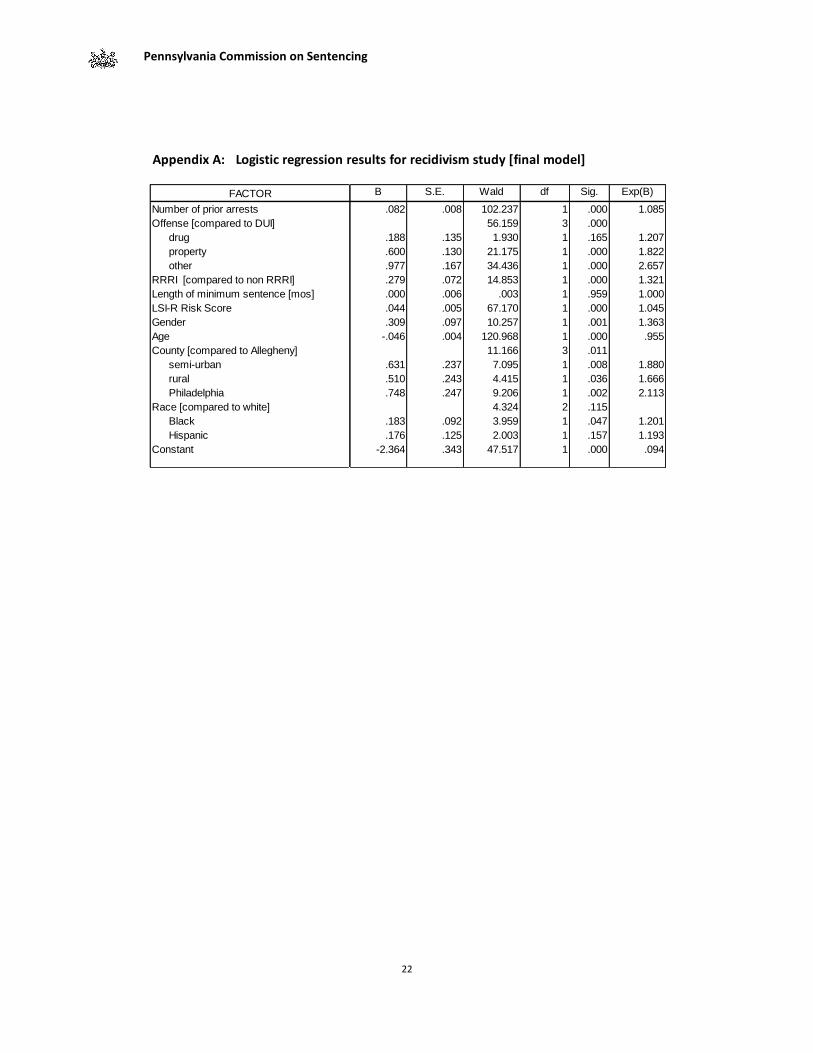
More specifically, Model 4 indicates that holding everything else constant: 1) the odds of offenders convicted of property offenses recidivating were 1.8 times greater than those who were convicted of DUI offenses, 2) for each prior arrest, there was a 9% increase in the odds of recidivating, 3) the odds of RRRI offenders recidivating were 1.3 times greater than non-RRRI offenders, 4) for each level increase in the Risk Scale [Scale of 0 to 54], there was a 5% increase in recidivism, 5) for each year increase in age, there was a 4% decrease in the odds of recidivism, 6) the odds of male offenders recidivating were 1.4 times greater than females; 7) the odds of black offenders recidivating were 1.2 times greater than for whites (Appendix A).
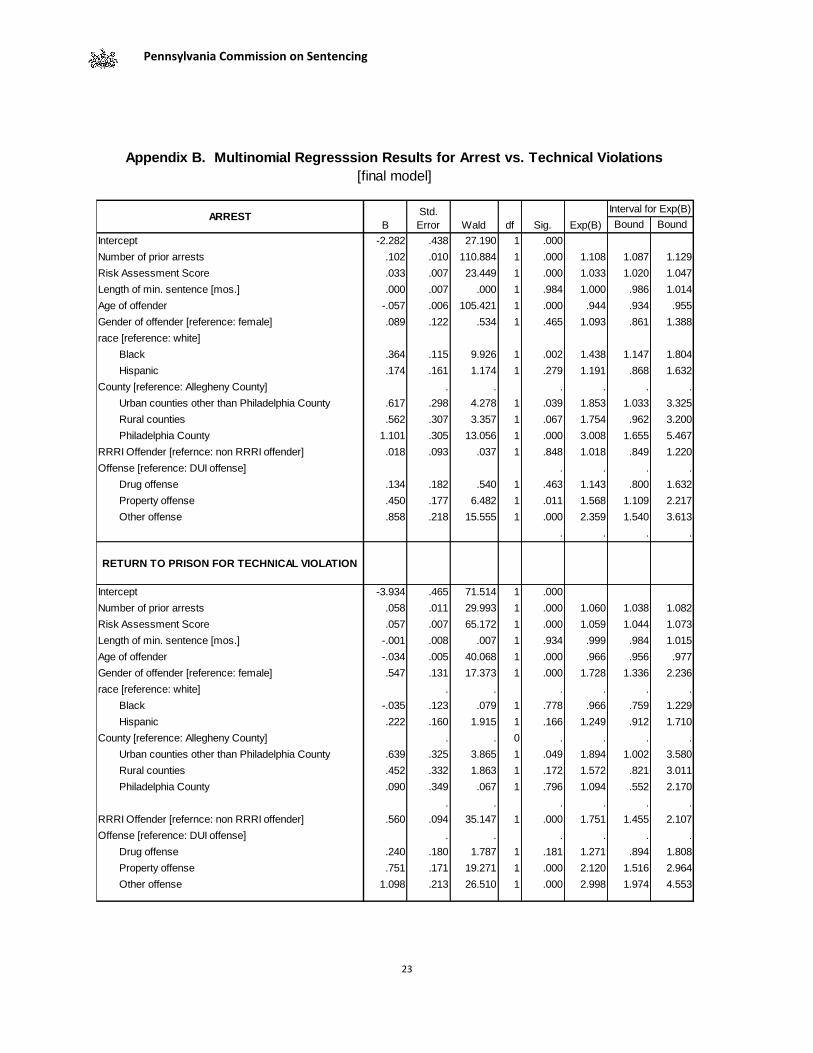
Arrest vs. return to prison for a technical violation. The analysis above examined recidivism as defined by either a new arrest or a technical violation that resulted in the return to state prison. We conducted additional analysis to determine whether the predictors of recidivism were the same or different when looking at arrests and technical violations separately. Table 9 shows the predictors of recidivism for arrests and technical violations compared to total recidivism for the final model. Most of the factors found to predict recidivism apply to both arrest for a new crime and return to prison for a technical violation. That is, offenders were more likely to recidivate if they committed a property crime, had a larger number of prior arrests, had a higher risk assessment score, were younger and from urban counties other than Allegheny County. There were, however, some differences with respect to gender, race, county, and RRRI. Males were more likely than females to be returned to prison for technical violations but not more likely to be re-arrested for a new crime. Black offenders were more likely than white offenders, and offenders from Philadelphia County were more likely than offenders from
Pennsylvania Commission on Sentencing
17
0%
5%
10%
15%
20%
25%
30%
0 1 2 3 4 5 6 7 8 9 10 11 12
pe
rce
nt
Months
Figure 5: Cumulative Percent Rearrested Within 1 Year
Non RRRI
RRRI
0%
5%
10%
15%
20%
25%
30%
0 1 2 3 4 5 6 7 8 9 10 11 12
pe
rce
nt
Months
Figure 4. Cumulative Percent Recommitted Within 1 Year
RRRI
Non RRRI
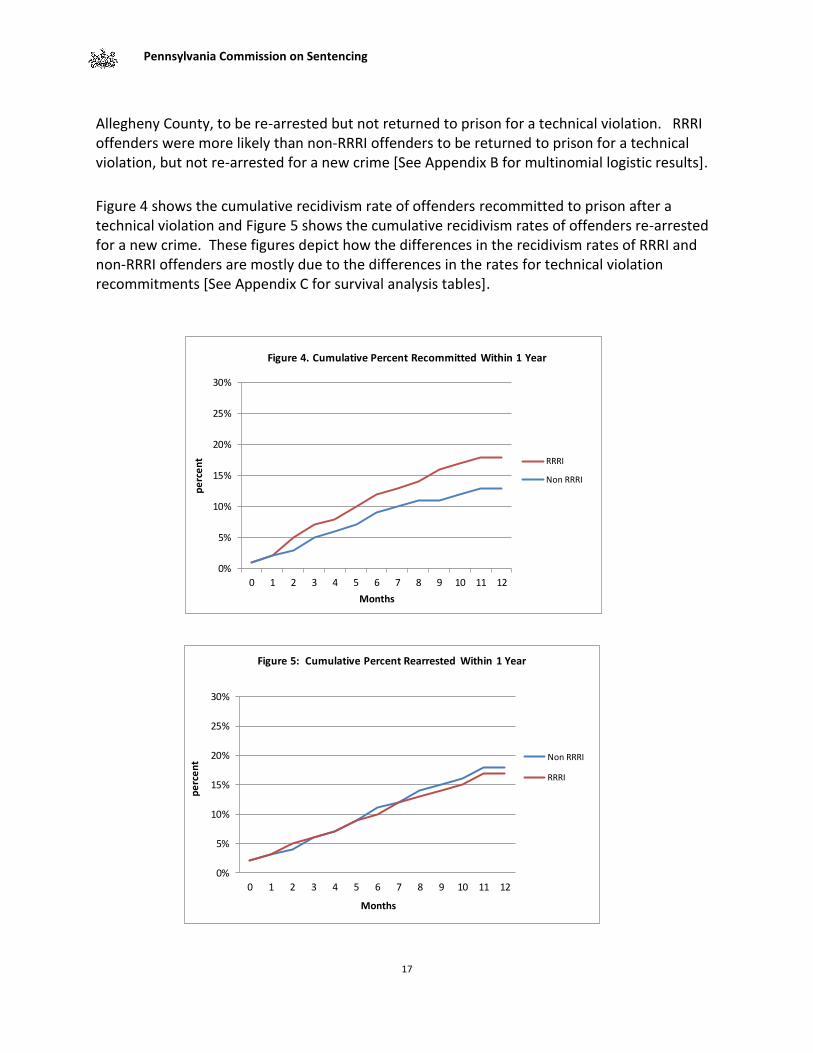
Allegheny County, to be re-arrested but not returned to prison for a technical violation. RRRI offenders were more likely than non-RRRI offenders to be returned to prison for a technical violation, but not re-arrested for a new crime [See Appendix B for multinomial logistic results].
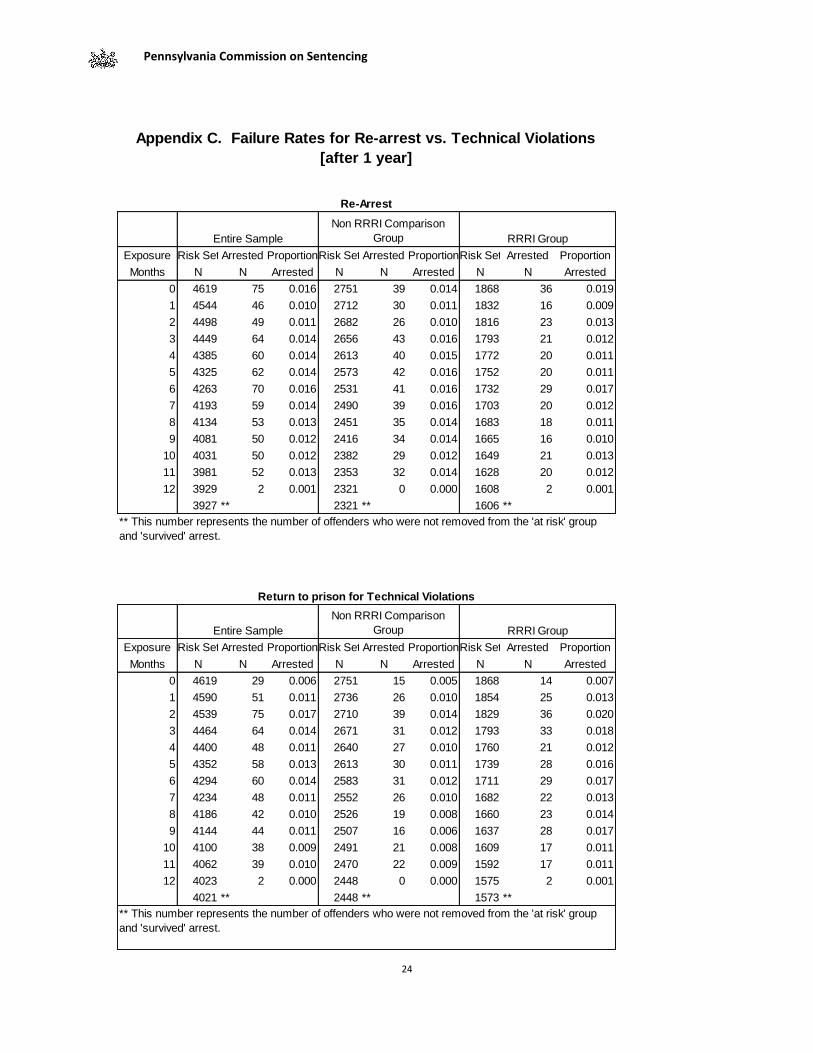
Figure 4 shows the cumulative recidivism rate of offenders recommitted to prison after a technical violation and Figure 5 shows the cumulative recidivism rates of offenders re-arrested for a new crime. These figures depict how the differences in the recidivism rates of RRRI and non-RRRI offenders are mostly due to the differences in the rates for technical violation recommitments [See Appendix C for survival analysis tables].
Pennsylvania Commission on Sentencing
18
CONCLUSION
This is the second report by the Pennsylvania Commission on Sentencing on the Recidivism Risk Reduction Incentive Program, which became operational on November 24, 2008. In this report we provided information on the admissions, releases, and recidivism of the RRRI offender. Statute requires that all eligible offenders receive a RRRI reduced minimum sentence, along with a regular minimum sentence Between November 24, 2008 and December 31, 2011 there have been 34,448 offenders sentenced to the Department of Corrections, and 25% of these offenders had a RRRI minimum sentence [n=8,650]. RRRI offenders were more likely than non-RRRI offenders to be female, white, and convicted of drug, theft, and DUI offenses. Risk Score Assessments indicate that RRRI offenders were at lower risk for recidivism. The average [regular] minimum sentence imposed on the RRRI offender was about half of that received by the non-RRRI offender [20 months vs. 44, respectively]. When RRRI offenders successfully complete their prescribed programming, they are to be certified and released under their RRRI sentence. Most offenders [85%] were approved for release under their RRRI sentence. At the time of their RRRI parole interview about 58% were pending certification. According to the DOC, most of the offenders are certified by the time they are released, though about 18% are still pending certification at the time of release [Recidivism Risk Reduction Incentive: 2011 Report by the Pennsylvania Department of Corrections]. Though most RRRI offenders were approved for release at the expiration of their RRRI minimum sentence, only a small percentage of offenders [8%] were actually released at the expiration of their RRRI minimum sentence. However, most [62%] were released before the expiration of their regular minimum sentence. Further, about 22% of those offenders were released within a week of their RRRI minimum. The Department of Corrections and Board of Probation and Parole indicate that short minimum sentences imposed on many of these offenders make it difficult for them to complete their prescribed programming in time to be released under their RRRI minimum sentence. We found that about 25% of the RRRI sentences were six months or less and 49% were less than one year. While we found that RRRI offenders were more likely to recidivate than a comparable group of non-RRRI offenders [eligible but sentenced prior to the implementation of RRRI], this was only found with respect to technical violations resulting in a return to prison, not for new arrests. One possible explanation is that offenders under parole supervision upon release from a RRRI sentence [which was a newly implemented program for offenders in our study] may have been supervised more closely and thus, more likely to be caught for a violation of parole. Another possible explanation is that, even though we matched the RRRI group as closely as possible with the non-RRRI group, we still had group differences. While those were controlled for in the analysis, there may be other factors that are responsible for differences between the two groups that were not available for our analysis. One area worthy of future study is to examine the recidivism of decertified offenders in relation to both certified offenders and a comparable group of non-RRRI offenders. Some preliminary analysis indicated that decertified offenders have a higher recidivism rate than either of the other two groups, though our numbers were too small to draw conclusions. However that would be consistent with some of our previous research that indicates program completion is an important predictor of success once released.
Pennsylvania Commission on Sentencing
19
[Pennsylvania’s State Intermediate Punishment Program: 2012 Report to the Legislature by the Pennsylvania Commission on Sentencing]. Overall, while only 8% of the RRRI offenders were getting released at the expiration of their RRRI minimum sentence, the finding that 62% of the offenders were being released before the expiration of their regular sentence indicates that the RRRI Program is achieving some success in reducing the prison population. However, with 25% of the offenders receiving a RRRI sentence of six months or less, and 49% of offenders receiving one year or less, it is difficult for offenders to complete their mandated programming. Thus, while it might be reasonable to expect that more offenders should be released at their RRRI minimum sentence, full compliance would be difficult to achieve under these circumstances. With the passage of legislation aimed at reducing the number of offenders sentenced to the Department of Corrections with short minimum sentences, this issue may be less problematic in future years. 7 Future reports will continue to examine this issue, as well as the impact of the legislative changes to the eligibility criteria.
7 Act 122 of 2012 prohibits sentences to state incarceration for aggregate sentences comprised exclusively of offenses classified
as less than a misdemeanor 2 unless otherwise approved by the Secretary of Corrections. Act 196 of 2012 permits diversion of short [an offender who at the time of sentencing has less than one year remaining to be served on the minimum sentence] or mid minimum offenders [an offender who at the time of sentencing has at least one but no more than 2 years remaining to reach the minimum sentence] from state incarceration to county incarceration. However, it should be noted that this provision conflicts with the correctional reforms of 2008, which requires sentences with a maximum sentence of 2 years or more to be served in a state facility, unless the county facility is certified less than 110% of the rated capacity or the offense is a DUI and the offender is subject to the extended supervision of the court.

Pennsylvania Commission on Sentencing
20
Pennsylvania Commission on Sentencing
21
APPENDICES
Pennsylvania Commission on Sentencing
22
Appendix A: Logistic regression results for recidivism study [final model]
FACTOR B S.E. Wald df Sig. Exp(B)
Number of prior arrests .082 .008 102.237 1 .000 1.085
Offense [compared to DUI] 56.159 3 .000
drug .188 .135 1.930 1 .165 1.207
property .600 .130 21.175 1 .000 1.822
other .977 .167 34.436 1 .000 2.657
RRRI [compared to non RRRI] .279 .072 14.853 1 .000 1.321
Length of minimum sentence [mos] .000 .006 .003 1 .959 1.000
LSI-R Risk Score .044 .005 67.170 1 .000 1.045
Gender .309 .097 10.257 1 .001 1.363
Age -.046 .004 120.968 1 .000 .955
County [compared to Allegheny] 11.166 3 .011
semi-urban .631 .237 7.095 1 .008 1.880
rural .510 .243 4.415 1 .036 1.666
Philadelphia .748 .247 9.206 1 .002 2.113
Race [compared to white] 4.324 2 .115
Black .183 .092 3.959 1 .047 1.201
Hispanic .176 .125 2.003 1 .157 1.193
Constant -2.364 .343 47.517 1 .000 .094
Pennsylvania Commission on Sentencing
23
Lower
Bound
Upper
Bound
Intercept -2.282 .438 27.190 1 .000
Number of prior arrests .102 .010 110.884 1 .000 1.108 1.087 1.129
Risk Assessment Score .033 .007 23.449 1 .000 1.033 1.020 1.047
Length of min. sentence [mos.] .000 .007 .000 1 .984 1.000 .986 1.014
Age of offender -.057 .006 105.421 1 .000 .944 .934 .955
Gender of offender [reference: female] .089 .122 .534 1 .465 1.093 .861 1.388
race [reference: white]
Black .364 .115 9.926 1 .002 1.438 1.147 1.804
Hispanic .174 .161 1.174 1 .279 1.191 .868 1.632
County [reference: Allegheny County] . . . . . .
Urban counties other than Philadelphia County .617 .298 4.278 1 .039 1.853 1.033 3.325
Rural counties .562 .307 3.357 1 .067 1.754 .962 3.200
Philadelphia County 1.101 .305 13.056 1 .000 3.008 1.655 5.467
RRRI Offender [refernce: non RRRI offender] .018 .093 .037 1 .848 1.018 .849 1.220
Offense [reference: DUI offense] . . . .
Drug offense .134 .182 .540 1 .463 1.143 .800 1.632
Property offense .450 .177 6.482 1 .011 1.568 1.109 2.217
Other offense .858 .218 15.555 1 .000 2.359 1.540 3.613
. . . .
RETURN TO PRISON FOR TECHNICAL VIOLATION
Intercept -3.934 .465 71.514 1 .000
Number of prior arrests .058 .011 29.993 1 .000 1.060 1.038 1.082
Risk Assessment Score .057 .007 65.172 1 .000 1.059 1.044 1.073
Length of min. sentence [mos.] -.001 .008 .007 1 .934 .999 .984 1.015
Age of offender -.034 .005 40.068 1 .000 .966 .956 .977
Gender of offender [reference: female] .547 .131 17.373 1 .000 1.728 1.336 2.236
race [reference: white] . . . . . .
Black -.035 .123 .079 1 .778 .966 .759 1.229
Hispanic .222 .160 1.915 1 .166 1.249 .912 1.710
County [reference: Allegheny County] . . 0 . . . .
Urban counties other than Philadelphia County .639 .325 3.865 1 .049 1.894 1.002 3.580
Rural counties .452 .332 1.863 1 .172 1.572 .821 3.011
Philadelphia County .090 .349 .067 1 .796 1.094 .552 2.170
. . . . . .
RRRI Offender [refernce: non RRRI offender] .560 .094 35.147 1 .000 1.751 1.455 2.107
Offense [reference: DUI offense] . . . . . .
Drug offense .240 .180 1.787 1 .181 1.271 .894 1.808
Property offense .751 .171 19.271 1 .000 2.120 1.516 2.964
Other offense 1.098 .213 26.510 1 .000 2.998 1.974 4.553
. . . . . .
Std.
Error
Appendix B. Multinomial Regresssion Results for Arrest vs. Technical Violations
[final model]
BARREST
Exp(B)
95% Confidence
Interval for Exp(B)
Sig.Wald df
Pennsylvania Commission on Sentencing
24
Exposure Risk Set Arrested ProportionRisk Set Arrested ProportionRisk Set Arrested Proportion
Months N N Arrested N N Arrested N N Arrested
0 4619 75 0.016 2751 39 0.014 1868 36 0.019
1 4544 46 0.010 2712 30 0.011 1832 16 0.009
2 4498 49 0.011 2682 26 0.010 1816 23 0.013
3 4449 64 0.014 2656 43 0.016 1793 21 0.012
4 4385 60 0.014 2613 40 0.015 1772 20 0.011
5 4325 62 0.014 2573 42 0.016 1752 20 0.011
6 4263 70 0.016 2531 41 0.016 1732 29 0.017
7 4193 59 0.014 2490 39 0.016 1703 20 0.012
8 4134 53 0.013 2451 35 0.014 1683 18 0.011
9 4081 50 0.012 2416 34 0.014 1665 16 0.010
10 4031 50 0.012 2382 29 0.012 1649 21 0.013
11 3981 52 0.013 2353 32 0.014 1628 20 0.012
12 3929 2 0.001 2321 0 0.000 1608 2 0.001
3927 ** 2321 ** 1606 **
Exposure Risk Set Arrested ProportionRisk Set Arrested ProportionRisk Set Arrested Proportion
Months N N Arrested N N Arrested N N Arrested
0 4619 29 0.006 2751 15 0.005 1868 14 0.007
1 4590 51 0.011 2736 26 0.010 1854 25 0.013
2 4539 75 0.017 2710 39 0.014 1829 36 0.020
3 4464 64 0.014 2671 31 0.012 1793 33 0.018
4 4400 48 0.011 2640 27 0.010 1760 21 0.012
5 4352 58 0.013 2613 30 0.011 1739 28 0.016
6 4294 60 0.014 2583 31 0.012 1711 29 0.017
7 4234 48 0.011 2552 26 0.010 1682 22 0.013
8 4186 42 0.010 2526 19 0.008 1660 23 0.014
9 4144 44 0.011 2507 16 0.006 1637 28 0.017
10 4100 38 0.009 2491 21 0.008 1609 17 0.011
11 4062 39 0.010 2470 22 0.009 1592 17 0.011
12 4023 2 0.000 2448 0 0.000 1575 2 0.001
4021 ** 2448 ** 1573 **
** This number represents the number of offenders who were not removed from the 'at risk' group
and 'survived' arrest.
Entire Sample
Non RRRI Comparison
Group RRRI Group
** This number represents the number of offenders who were not removed from the 'at risk' group
and 'survived' arrest.
Return to prison for Technical Violations
Entire Sample
Non RRRI Comparison
Group RRRI Group
Re-Arrest
Appendix C. Failure Rates for Re-arrest vs. Technical Violations
[after 1 year]
Pennsylvania Commission on Sentencing
Staff
Mark H. Bergstrom Robert E. Probst
Executive Director Lead Data Input Specialist
Cynthia A. Kempinen, Ph.D. Jodi R. Ripka
Deputy Director/Research Director Fiscal/Office Manager
Linda M. Bell Diane E. Shoop, Ph.D.*
SGS Web Support Manager, Outreach and Policy
Catherine W. Dittman Leigh A. Tinik
Staff Assistant Research Support Associate
Haiou Hu Carol A. Zeiss
Research Support Associate Manager, Data Management
Joan F. Lisle Contracted Positions
Manager, Information Access Joseph Sabino Mistick, Esquire
Counsel (part-time)
Carrie L. Peters
Sentencing Policy Specialist R. Barry Ruback, Ph.D., J.D., Professor
Faculty ResearcherFaculty Researcher
Helene Placey*
Sentencing Policy Specialist
*located in Harrisburg Office
SGS Web Help Desk: 814.867.1243
Pennsylvania Commission on Sentencing
http://pasentencing.us
State College Office Harrisburg Office 009 Brumbaugh Hall The Pennsylvania State University University Park, PA 16802
408 Forum Building Capitol Complex Harrisburg, PA 17120
Mail: PO Box 1200 State College, PA 16804-1200
Mail: PO Box 1045 Harrisburg, PA 17108-1045
Phone: 814.863.2797
Phone: 717.772.3776
Fax: 814.863.2129
Fax: 717.772.8892