Embed Size (px)
Citation preview

NBER WORKING PAPER SERIES
RECENT TRENDS IN THE EARNINGS OF NEW IMMIGRANTS TO THE UNITEDSTATES
George J. BorjasRachel M. Friedberg
Working Paper 15406http://www.nber.org/papers/w15406
NATIONAL BUREAU OF ECONOMIC RESEARCH1050 Massachusetts Avenue
Cambridge, MA 02138October 2009
We thank seminar participants at the NBER Summer Institute, the San Francisco Fed, MIT CIS, theUniversity of Houston, PAA, Hebrew University, Tel Aviv University, and the Society of Labor Economistsfor useful comments. Joanne Hsu and Alex Levkov provided excellent research assistance. The viewsexpressed herein are those of the author(s) and do not necessarily reflect the views of the NationalBureau of Economic Research.
NBER working papers are circulated for discussion and comment purposes. They have not been peer-reviewed or been subject to the review by the NBER Board of Directors that accompanies officialNBER publications.
© 2009 by George J. Borjas and Rachel M. Friedberg. All rights reserved. Short sections of text, notto exceed two paragraphs, may be quoted without explicit permission provided that full credit, including© notice, is given to the source.

Recent Trends in the Earnings of New Immigrants to the United StatesGeorge J. Borjas and Rachel M. FriedbergNBER Working Paper No. 15406October 2009JEL No. J6
ABSTRACT
This paper studies long-term trends in the labor market performance of immigrants in the United States,using the 1960-2000 PUMS and 1994-2009 CPS. While there was a continuous decline in the earningsof new immigrants 1960-1990, the trend reversed in the 1990s, with newcomers doing as well in 2000,relative to natives, as they had 20 years earlier. This improvement in immigrant performance is notexplained by changes in origin-country composition, educational attainment or state of residence. Changesin labor market conditions, including changes in the wage structure which could differentially impactrecent arrivals, can account for only a small portion of it. The upturn appears to have been causedin part by a shift in immigration policy toward high-skill workers matched with jobs, an increase inthe earnings of immigrants from Mexico, and a decline in the earnings of native high school dropouts.However, most of the increase remains a puzzle. Results from the CPS suggest that, while averageentry wages fell again after 2000, correcting for simple changes in the composition of new immigrants,the unexplained rise in entry wages has persisted.
George J. BorjasHarvard Kennedy School79 JFK StreetCambridge, MA 02138and [email protected]
Rachel M. FriedbergDepartment of EconomicsBrown University64 Waterman StreetProvidence, RI 02912and [email protected]
2
I. INTRODUCTION
Immigration is an important force of demographic and economic change in the United
States, and increasingly so in recent decades. In the 1950s, approximately 250 thousand legal
immigrants were admitted to the United States each year, and there was relatively little illegal
immigration. By the 1990s, nearly one million legal immigrants were admitted to the country
each year, with another half a million entering illegally (Passel, 2006). As a result of these
trends, nearly half of population growth in the United States is now due to immigration, and the
foreign-born share of the U.S. population has reached one in eight, having more than doubled
since 1970.
The resurgence of large-scale immigration has sparked the development of an extensive
literature that examines the performance of immigrant workers in the labor market, including
their earnings upon entry and their subsequent assimilation toward the earnings of native-born
workers (see Borjas, 1999; and LaLonde and Topel, 1997, for surveys). An important finding of
this literature is that, over the period 1960-1990, there was a continuous decline in the relative
entry wage of new immigrants. This is true in terms of both unadjusted earnings and earnings
conditional upon characteristics such as education and experience.
A relative decline in immigrant labor market performance presents potentially troubling
prospects. The skill composition of the immigrant population—and, particularly, how the skills
of immigrant workers compare to those of native workers—is the key determinant of the
economic impact of immigration on the United States. First, it determines which native workers
are more likely to feel an adverse impact of immigration on their labor market opportunities. As
closer substitutes in the labor market, low-skill native workers are more vulnerable to low-skill
immigration. Second, skilled immigrants may assimilate more quickly. They may be more adept

3
at acquiring the country-specific human capital necessary for economic success, with
consequences for their fiscal as well as labor market impact. Finally, the relative skills of
immigrants determine the economic benefits from immigration. The United States benefits from
international trade because it can import goods that are not available or are too expensive to
produce in the domestic market. Similarly, the country benefits from immigration because it can
import workers with scarce qualifications and abilities.
In this paper, we use the microdata of the 1960-2000 U.S. Censuses and the 1994-2009
Current Population Surveys to study trends in the entry wages of new immigrants.1 Our key
finding is that the downward trend in the relative earnings of successive immigrant cohorts
observed since the 1960s was reversed during the 1990s. The immigrant wave that arrived
between 1995 and 2000 earned as much in 2000, relative to natives, as new entrants did twenty
years earlier. This significant upturn in immigrant earnings is present in raw wages, as well as in
wages that have been adjusted for differences across arrival cohorts in observed characteristics.
Although average entry wages fell again after 2000, correcting for simple changes in the
composition of new immigrants, the unexplained rise in entry wages has persisted through the
2000s.
In addition to documenting this reversal of the long-run trend in the relative entry wage,
we explore the reasons for the recent improvement in immigrant labor market performance. We
test whether the forces that have been used to explain the previous decline in relative immigrant
earnings—such as changes in origin-country composition, changes in educational attainment,
1 See Borjas (1985, 1995), Funkhouser and Trejo (1995), and Duleep and Regets (2002) for earlier trends. Jasso, Rosenzweig, and Smith (2000) analyze INS data on new legal permanent residents over the period 1972-95 (with comparisons to the PUMS and CPS), finding an upturn in the occupational earnings of immigrants beginning in the late 1980s. Smith (2006) examines data from the PUMS and CPS to document trends in immigrant earnings across selected years 1970-2002.

4
and changes in labor market conditions which may differentially impact recent arrivals—can also
account for the subsequent reversal. Surprisingly, we find that these previous explanations do not
help us understand the reversal that occurred in the 1990s.
Interestingly, the data reveal that the turnaround in the relative earnings of new arrivals in
2000 occurred primarily at the top and the bottom ends of the skill distribution. We find that the
increase among college-graduate immigrants can be largely attributed to a specific change in
U.S. immigration policy, namely the expansion of the H-1B temporary visa program for high-
skill workers, who earn more, relative to natives, than did earlier cohorts of high-skill foreign-
born workers. By contrast, the relative improvement among high school dropouts was driven by
a decline in the earnings of native high school dropouts, rather than by an increase in the average
earnings of new immigrant dropouts. Immigrant dropout wages held constant over the decade,
due to the offsetting effects of a rise in the share of Mexicans and an increase in their earnings.
Still, when we correct for changes in observed characteristics, most of the improvement in the
relative earnings of new immigrants in the 1990s remains a puzzle.
We conclude by considering the implications of our findings for future patterns of
foreign-born labor market performance. Is this improvement in the earnings of new immigrants a
transient anomaly, or is it likely to extend into a full reversal of the previous decline?
II. DATA AND EARNINGS PATTERNS
Our study primarily uses data drawn from the Public Use Microdata of the 1960-2000
U.S. Censuses. Non-citizens and naturalized citizens are defined to be “immigrants.” All others
are classified as “natives.” We use the 1% sample in 1960, the (pooled) three independent Form 1
1% samples in 1970, and the 5% sample in 1980-2000. The analysis is restricted to men aged 25-

5
64.2 “New immigrants” are defined as those who arrived in the five years prior to the respective
Census. Hourly earnings are calculated from annual wage and salary income, divided by weeks
worked per year, divided by hours worked per week. All hourly earnings figures are deflated to
1989 dollars using the CPI-U price index.
Figure 1 plots the (unadjusted) difference in mean log wages between newly arrived
immigrants and natives in each Census year. The vertical axis approximately measures the
percentage wage gap between newly arrived immigrants and natives. For example, in 1960,
immigrants who had come to the U.S. in 1955-59 earned 0.117 log points less than natives—an
11% wage gap. In 1970, newly arrived immigrants (i.e., 1965-1969 arrivals) earned 18% less
than natives. By 1990, the entry wage gap between new immigrants and natives had grown to -
0.368 log points, or 31%. In sum, there was a continuous downward trend in the relative earnings
of new arrivals between 1960 and 1990.
The key point on which this paper centers is the fact that for the most recent arrival
cohort—the one which migrated in 1995-99—the trend was reversed. This increase in the
relative earnings of new arrivals marks a return to the level last seen twenty years earlier, in
1980. Not correcting for differences in other factors, such as age or education, new immigrants in
2000 earned 27% less than natives upon arrival.
A key reason to focus on the relative earnings of immigrants is to capture the earnings
fluctuations that arise to due to changes in general labor market conditions in the United States.
However, the relative earnings of new immigrants can rise either because the absolute earnings
of immigrants rise, or because the absolute earnings of natives falls, and these two scenarios
have very different interpretations. Figure 2 plots the raw earnings of recent arrivals and natives
2 The sample also excludes those with zero reported weeks of work, no wage income, the self-employed, those enrolled in school, those in the military, and those living in group quarters.

6
separately. This figure clearly indicates that the change in the earnings gap between the two
groups was caused by a rise in the earnings of the new arrivals themselves, rather than to a
shifting native benchmark.3
So what has caused the entry wages of immigrants to the United States to rise? The
following sections consider some possible explanations.
III. OLD EXPLANATIONS
A. COMPOSITION EFFECTS
An obvious explanation for the rise in the relative earnings of new arrivals in the late
1990s could be that they were more skilled, or had more of other socioeconomic attributes
associated with higher earnings. Since changes in the origin-country mix of immigration can
explain most of the downward trend through 1990, perhaps changes in measurable characteristics
can account for the subsequent reversal as well.
Table 1 examines changes over time in the characteristics of new arrivals. The first
column describes the cohort that came to the U.S. in 1985-89 as observed in the 1990 Census,
and the second column describes the cohort that arrived in 1995-99 as observed in the 2000
Census. Both cohorts are therefore measured during their first five years in the country. Over
the course of the decade, there was an increase in the proportion of immigrants coming from 3 There has been a substantial increase over time in the extent of data imputation in the PUMS. In 1990, 11% of natives and 20% of new immigrants had allocated wage and salary income data. In 2000, these figures were 24% and 31%, respectively. The Census Bureau does not include information on nativity in the formula used to impute wages. Since there are far more natives than immigrants in the population, this results in immigrants with missing wage data essentially being assigned the wages that natives with similar characteristics would earn. When income is imputed without respect to nativity, the estimated coefficient on nativity in a wage regression will suffer from attenuation bias (i.e., be biased toward zero). Hirsch and Schumacher (2004) study the effect of increasing earnings imputation in the CPS-ORG 1996-2001 on wage gap estimates, and find substantial attenuation bias. The estimated coefficient on an immigrant dummy goes from -.063 to -.081 when allocated earners are excluded from the sample. An increase over time in the share of observations with imputed wages should result in a reduction over time in the measured immigrant wage disadvantage. However, comparing results for imputed and unimputed samples in the PUMS yields the surprising result that the estimated uptick is actually higher in the unimputed sample.

7
Mexico and India, and a decrease in the proportion coming from Southeast and East Asia. The
level of education rose, with a reduction in the share with less than a 5th grade education and a
rise in the share holding Bachelors and Masters degrees. This rise in education was accompanied
by an increase in the share working in professional/technical occupations. Far fewer settled in
California and New York, and more in Texas, as well as new destinations such as North Carolina
and Georgia.
Borjas (1992) shows that most of the decline in cohort quality between 1960 and 1980
can be explained by a shift in the origin-country composition of immigration to the United
States. Following the 1965 Amendments to the Immigration and Nationality Act, fewer
immigrants originated in Europe, with the majority coming instead from developing countries,
particularly Latin American and Asia. Immigrants from these countries tend to be less skilled
and to do worse in the U.S. labor market than other immigrants. The emphasis on family ties in
the extension of new entry visas magnified this shift in origin-country mix over time.
Given the importance of country composition in explaining the previous decline in the
relative earnings of new immigrants, it is natural to ask whether the increase in the late 1990s can
be similarly attributed to a shifting origin mix. However, as Table 1 shows, the biggest change
in origin composition from the 1980s to the 1990s was a sizable rise in the share of immigrants
coming from Mexico. A change in the national origin composition of new immigrants, therefore,
cannot be the explanation for the uptick: Mexicans earn less than other immigrants on average,
so the increase in the number of Mexicans only makes the upturn even more puzzling.
Table 2 explores whether the rise in immigrants’ entry wage can be explained by other
compositional changes. The sample is comprised of the natives and new immigrants observed in
the pooled 1990 and 2000 PUMS. The dependent variable is the log hourly wage. The first

8
specification regresses log earnings on a dummy variable for immigrant status (1 for immigrants
who arrived in the previous 5 years, 0 for natives), a dummy variable for the later period (1 for
2000, 0 for 1990), and the interaction of those two, “immigrant*2000.” The coefficient on this
last variable measures the increase in the relative (to natives) earnings of new arrivals in 2000,
compared to that of new arrivals in 1990. The coefficient of 0.054 in column (1) means that the
1995-99 cohort had an entry wage 5.5% higher than the entry wage of the 1985-89 cohort. This
is what we will refer to as the “upturn” in the earnings of recent arrivals in the 1990s.
The rest of the specifications in Table 2 analyze whether the upturn goes away when we
correct for other factors that influence earnings. For example, since the level of education of
new arrivals rose in the 1990s, we might expect the earnings gain to be smaller once this is taken
into account. However, since natives’ educational attainment also rose over this period, this is
not clear. The long-run trend in the educational attainment of new immigrants, relative to
natives, is shown in Figure 4.4 Indeed, there was a modest upturn in immigrants’ relative
educational attainment in the 1990s.
The second and third regressions in Table 2 correct for education using dummy variables
for: high school graduate, some college, and college graduate (the omitted group is high school
dropouts). The coefficient on the uptick variable goes from 0.054 to 0.053,5 and to 0.050 when
the return to education is allowed to vary over time and with nativity.
4 The 1960-1980 Census data report years of schooling as a continuous variable. However, years of schooling is bracketed in 1990 and 2000. In order to compute a continuous variable for 1990 and 2000, we computed the average years of schooling of natives and of new immigrants in each bracketed educational category in 1980, and calculated weighted averages for each group in 1990 and 2000, using the bracketed educational distributions for each group in those years. 5 The uptick coefficient falls by more if more educational categories are included as controls. In other words, four educational categories are not fine enough to capture the small rise in relative educational attainment shown in Figure 4.

9
Correcting for age (columns 4 and 5) raises the measured uptick to 0.076.6 The estimated
uptick is also larger when we correct for country of origin, as in column 6 (coefficient of 0.084).
This is not surprising, given the increase in immigration from Mexico. Correcting for changes in
the pattern of settlement of new immigrants, using state fixed effects in column 7, also raises the
coefficient, to 0.074.
Correcting for all of these factors together, seen in the final column of Table 2, raises the
size of the estimated uptick from the 0.054 (5.5%) found for raw earnings to 0.100 for residual
earnings (10.5%). Clearly, the increase in the relative earnings of new arrivals cannot be
attributed to straightforward changes in their composition, in terms of the observable
characteristics of origin country, education, age, or state of residence.
B. ECONOMIC ENVIRONMENT
When immigrants and natives occupy different positions in the labor market, changes in
general labor market conditions can have an effect on the outcomes of immigrants, compared to
natives, even when there have been no changes in the productive characteristics of either group.
Having found that the rise in the relative earnings of new immigrants cannot be explained by the
broad changes in their observed characteristics, we now explore a second possibility, namely,
that it was brought about by changes in U.S. labor market conditions which might differentially
affect immigrants and natives.
6 There was no change in the age distribution of new arrivals between 1990 and 2000 (the average age in this sample was 36), but the native population aged. Another characteristic which did not change across these arrival cohorts was English fluency. The share reporting speaking English “very well” held steady at 38%.

10
Labor Market Conditions
Figure 5 shows the time series of the rate of real wage growth and the unemployment rate
since 1980. Real wages were falling in the late 1980s. By contrast, real wages grew rapidly in
the late 1990s. Similarly, though the unemployment rate was falling both periods, the average
level in the late 1980s was 6.1%, while the average in the late 1990s was 4.8%. In 2000, the
unemployment rate fell to 4%, the lowest level in 30 years.
One potential explanation for the rise in the relative earnings of recent immigrants in
2000 is that the tight U.S. labor market of the late 1990s somehow benefited immigrants relative
to natives. If this were the case, we might expect earlier cohorts to also have done particularly
well in 2000.
Table 3 presents the relative earnings of each arrival-cohort in each Census year, 1970-
2000. This table can be used to compare the earnings of different cohorts at the same point in
time (by reading down columns), of the same cohort over time (by reading across rows), or of
different cohorts at the same stage of years since arrival (by reading diagonally). The top panel
of Table 4 shows that, although the earnings of the most recent cohort (0-5 years since
migration) rose between 1990 and 2000, there was not a similar increase in earnings for the
second most recent cohort (5-10 years since migration), and earlier cohorts (10-15 and 15-20
years since migration) actually experienced a substantial decline in relative earnings of about
9%.
Figure 6 shows the longer-term pattern of cohort effects 1960-2000. The figure shows a
uniform decline in immigrants’ relative earnings, across cohorts and across years through 1990.
Seen in this larger context, the turnaround in 2000 for the most recent arrivals (0-5 years) is even
11
more striking, and the disappearance of the decline for the next most recent arrivals (5-10 years)
is also noteworthy.
The bottom panel of Table 4 asks whether assimilation rates, i.e., immigrants’ rates of
relative earnings growth over time, were faster in the 1990s than in previous decades. The
earnings path of a given arrival cohort can be seen by reading across a row in Table 3. These
earnings paths are also plotted in Figure 7. We can compare the earnings growth of the cohort
that arrived in 1975-79 during its first decade in the U.S. (1980-1990) to that of the cohort that
arrived in 1985-89 during its first decade here (1990-2000). In fact, the first-decade assimilation
rate was higher in the 1980s than in the 1990s (13.9% and 9.0%, respectively). Though the
second-decade assimilation rate was slightly higher— 12.4% in the 1980s and 13.0% in the
1990s— this difference is within one standard error of the estimated coefficients, and in any
case, is not of the same magnitude as the uptick for new arrivals.
In sum, based on comparisons with earlier arrival cohorts, it does not seem that the tight
labor market conditions of the late 1990s benefited all immigrants relative to natives, and that
this can explain the upturn in the earnings of new immigrants.
Recent work (Bratsberg, et al, 2006) has suggested that immigrants are more sensitive to
labor market conditions than natives. In Table 5, conditioning on the state unemployment rate in
each year, and allowing its effect to vary with nativity, lowers the estimated upturn from 0.054 to
0.043. Adding state fixed effects to the regression raises the coefficient to 0.064. Without
assigning a causal interpretation to the coefficient on the unemployment rate, and putting aside
the issue of endogenous location choice, it does not appear that sensitivity to improved local
labor market conditions can explain the rise in the relative wages of new immigrants.

12
Changes in the U.S. Wage Structure
Previous work has shown that the wage gap between immigrants and natives is
influenced by general changes in the structure of wages (see LaLonde and Topel, 1991;
Lubotsky, 2001; and Butcher and DiNardo, 2002). Since the average immigrant falls in the
lower tail of the native wage distribution, increases in the dispersion of the distribution will result
in a drop in the earnings of the average immigrant, relative to the average native, and therefore a
rise in the absolute size of the immigrant-native wage gap. This previous work argues that
increased wage inequality in the United States since 1970 has been largely responsible for the
observed decline in the relative wages of (new) immigrants.
Wage inequality in the United States continued to increase in the 1990s, this time in an
asymmetric way. The upper end of the wage distribution (as measured by the 90%-50%
differential) widened as rapidly as it had in the 1980s, while the lower end (the 50%-10%
differential) remained fairly stable or even narrowed somewhat (Autor, Katz, Kearney, 2005,
2006).
For the average new immigrant, situated in the bottom half of the native wage
distribution, compression in lower-tail inequality could potentially imply a rise in entry wages,
relative to the average native. In 1990, the average log wage of new immigrants was 2.143
($8.52). This fell at the 25th percentile of the 1990 native wage distribution. Between 1990 and
2000, the wage differential between natives at the 25th and 50th percentiles shrank by 1.0%.
However, the differential between those at the 25th percentile and the mean actually grew by
1.4%, so that changes in the wage structure cannot explain the observed reduction in the earnings
gap between the average new immigrant and the average native in the 1990s.7
7 Changes in U.S. earnings inequality could also change the selection of immigrants who choose to migrate to the United States. Holding mean wages constant, more-skilled immigrants should be attracted to countries with higher

13
Correcting for Changes in the U.S. Wage Structure
A more precise way of adjusting for changes in the U.S. wage structure is to deflate the
wage measure used as the dependent variable in the regression analysis. One aspect of the
changing U.S. wage structure during the 1990s was changes in the returns to observable
characteristics, such as age and education. How did the changes in these returns affect the
immigrant-native earnings gap? One way of assessing this is to construct counterfactual wages
for 2000, computing the wage an individual would have earned, had the joint returns to age and
education remain unchanged. We consider four age groups (25-34, 35-44, 45-54, and 55-64) and
four education groups (high school dropouts, high school graduates, those with some college,
and college graduates). We calculate native wage growth in each of 16 age-education cells. We
then deflate the 2000 wages of immigrants and natives by this factor.
A second type of deflation takes into account immigrants’ position in the native wage
distribution. First, we divide the 1990 and 2000 native wage distributions into percentiles, and
calculate wage growth at each percentile. We then assign all natives and immigrants in 2000 to a
percentile of the 2000 native wage distribution, and then deflate their wages by native wage
growth at that percentile.
Table 6 presents estimates of the improvement in immigrants’ relative entry wages,
comparing results using three different wage measures. The first column shows the unadjusted
uptick coefficient of 0.054. As in Table 2, correcting for education and age (in this case, using
dummy variables for the 16 age-education groups described above) raises the measured uptick, returns to skill, while less-skilled immigrants should be attracted to countries with lower returns to skill (Borjas, 1987). By this logic, changes in the U.S. wage structure would have provided an increased incentive for highly skilled immigrants to come to the U.S., as well as a stable or increased incentive for less skilled immigrants. Though there was an increase in immigration from India, whose immigrants are more educated than either the Indian or native U.S. populations, the dominant change was the substantial increase in immigration from Mexico, whose immigrants are on average less-skilled than U.S. natives. Improved selectivity across origin countries therefore cannot account for the uptick. The possibility of improved selectivity within origin countries will be considered below.

14
to 0.080. Deflating wages by native wage growth in each age-education cell, in columns (2) and
(3), reduces the coefficient somewhat. In the regressions that correct for changes in age-
education composition, it reduces the coefficient by 0.016. The final two columns of the table
show that using wages deflated by wage growth at each percentile of the native wage distribution
has a similar small negative effect. Comparing the final regression, which uses percentile-
deflated wages and corrects for changes in age and education, to the same regression using
undeflated wages, the measured coefficient is reduced by one-eighth.
In sum, changes over the 1990s in the joint returns to age and education and in wage
growth at different points of the native wage distribution can account for only a small portion of
the observed rise in the relative earnings of new immigrants to the United States.
IV. DIFFERENTIATING BY SKILL
Since the factors that could explain the previous decline in the entry wages of new
immigrants before 1990-- changes in the educational attainment and origin-country composition
of new immigrants and changes in the wage structure-- cannot account for most of the recent
upturn, and since changes in geographic distribution and general labor market conditions also do
not appear to have caused it, we turn in this section to other potential explanations. Since the
growth in entry wages cannot be explained by across group changes (i.e., favorable changes in
composition), it must be something that occurred within groups. We therefore begin by looking
across the earnings and schooling distributions to pinpoint the location of the rise in immigrant
earnings.

15
Earnings Quantiles
Figures 8A and 8B show the wage distributions of natives and new immigrants in 1990
and 2000 respectively. New immigrants earn less than natives on average, and the shapes of
their wage distributions are rather different. The average new immigrant went from earning at
the 25th percentile of the 1990 native distribution to the 30th percentile of the 2000 native
distribution.
Figure 8C shows how the wage distribution of new immigrants changed over the 1990s.
Wage growth appears to have been greater at the upper end of the distribution. This is confirmed
in Figure 9, which graphs wage growth over the 1990s for natives and new immigrants by
percentiles of their respective wage distributions.
Because a given percentile of the native and immigrant wage distributions represent very
different levels of earnings, it is hard to see how relative wages changed by visually inspecting
Figure 9. To explore whether the rise in relative earnings occurred in some parts of the wage
distribution and not others, Table 7 shows relative wage growth at different quantiles of the
immigrant wage distribution. The first and second columns of the table list the average log
wages of new immigrants at the 10th, 25th, 50th, 75th, and 90th percentiles in 1990. Column (3)
then reports the corresponding percentile of the 1990 native wage distribution. For example, the
median new immigrant earned e2.050 or $7.77 per hour in 1990. Natives who earned that much
were at the 21.4th percentile of the 1990 native wage distribution. The fourth column shows how
much natives at each of those quantiles earned in 2000, and the resulting wage growth 1990-
2000 is shown in column (5). The corresponding amount of wage growth for immigrants who
started out at the same level of earnings as those natives is shown Column (6). Finally, the last
column of the table shows immigrant wage growth, relative to that of natives.

16
At the bottom end of the distribution, new immigrants actually lost ground to natives.
The gains become larger as we move up the distribution, with the median immigrant
experiencing relative log earnings growth of 0.045. The uptick is strongest at the 75th percentile,
with immigrants’ wages growing an impressive 20% more than natives’. The uptick declines
somewhat by the 90th percentile, though it is still sizeable at 0.119. These results suggest that
whatever was the driving force behind the rise in the relative earnings of new immigrants in the
1990s was something going on toward the upper end of the immigrant wage distribution.
Education Groups
Figure 10 breaks the sample into four education groups-- high school dropouts, high
school graduates, those with some college, and college graduates. The figure charts a time-series
of the earnings of new immigrants belonging to each education group, relative to natives with the
same level of education. The earnings of new immigrants with less than a college degree all
follow a similar pattern of decline 1960-1990, while college-graduates follows a completely
different trend, increasing in the 1960s and 1970s, falling somewhat in the 1980s, and rising
sharply in the 1990s.
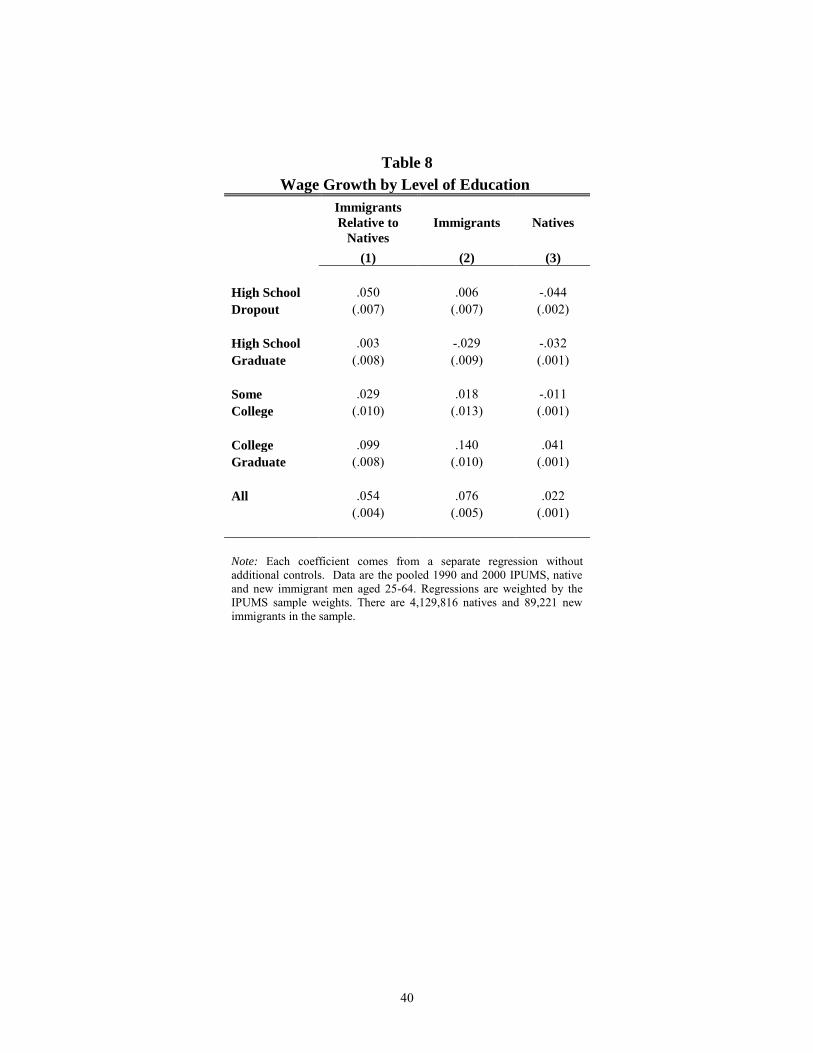
Table 8 shows the change in new immigrants’ relative earnings in the 1990s for each
education group. There was a 5% increase in the relative entry wages of high school dropouts.
There was no change for high-school graduates, and a relatively small rise for those with some
college. The increase in relative earnings among college graduates was 0.099, or 10.4%.
Since there was not a dramatic change in the relative educational attainment of new
immigrants and natives in the 1990s, changes in relative supplies are probably not the story
behind the observed changes in relative wages, particularly the dramatic rise in the relative

17
earnings of new immigrant college graduates. The large increase for the most-educated is
consistent with the findings of the previous section, suggesting a focus on the upper end of the
immigrant earnings distribution in trying to understand the reasons behind the upturn for
immigrants as a whole.
V. HIGH-SKILL IMMIGRATION
What factors might account for the dramatic rise in the relative entry wages of highly-
educated immigrants in the 1990s? The decade witnessed important changes in U.S. immigration
policy, with specific implications for immigrants at the high end of the skill distribution. First,
the Immigration Act of 1990 raised the share of visas allocated on the basis of skill. Though
correcting for education does not explain the uptick, perhaps there is some effect of the rise in
these high-skilled visas not fully captured by the increase in education. For example, arriving
with a job in hand means there is less of an initial earnings gap due to search frictions or
imperfect skill transferability (Friedberg 2000), a better selection of immigrants in terms of
English ability, a better match between their skills and U.S. labor market opportunities, and so
on. This would be consistent with the finding of a large upturn in the relative entry wages of
college graduates and those at the upper quantiles of the immigrant wage distribution.
If the 1990 Act raised the average skill level of immigrants, we would expect not only the
immigrants who arrived in the late 1990s, but also those who arrived in the early 1990s to have
high earnings in 2000. However, as previously shown in Table 4, this was not the case. We
conclude, therefore, that this particular policy change did not play a key role in the upturn.
Another important policy change that took place during the 1990s was the expansion,
most notably in the late 1990s, of the H-1B visa program. H-1Bs are temporary, employer-

18
sponsored visas for college graduates who work in “specialty” occupations. In 2001, 58% of H-
1B visa holders were in computer-related occupations, with another 12% in engineering and
architecture. Over 40% had at least a Masters degree, and half of them were from India. An H-
1B visa can be renewed for up to six years, and people on H-1Bs can apply to remain in the U.S.
permanently. Figure 11 shows the number of H-1B visa admissions for selected years, 1989-
2004.8 In 1985, there were 47,322 high-skill temporary employment visas granted. The number
increased to around 100,000 in the early 1990s, after the cap on such visas was raised by the
Immigration Act of 1990. In 1996, the number increased to 144,548. The cap was raised again
with the American Competitiveness and Workforce Improvement Act of 1998, when the number
rose to 240,947. By 2000, the number of H-1B visas was over 355,000.
A natural question to ask is what share of new arrivals in the late 1990s were H-1Bs? The
INS Statistical Yearbook lists just over 800,000 H-1B visa applications accepted for the period
1995-99.9 This number includes both new visas and renewals, so individuals who renew are
double-counted. If we make the conservative assumption that half of these represent new visas
granted, about 400,000 people entered the U.S. on H1-B visas in the late 1990s. This can be
compared to the roughly 5 million people who obtained legal permanent residence in the U.S.
over the same period, or the 7.6 million people in the 2000 Census who report having arrived in
the U.S. in the previous five years. H-1Bs therefore made up around 5-8% of the overall flow of
new “immigrants” in this period.10
8 The H-1B visa category as such was formally established by the 1990 Act. The number of new H-1Bs was capped at 65,000 starting in 1992, 67,000 in 1997, rising to 115,000 in 1999, and to 195,000 in 2001. In 2004, the cap was brought back down to 65,000 (plus 20,000 in 2005 for foreigners holding U.S. graduate degrees). 9 not including missing data for 1997. 10 Calculating this share precisely involves grappling with some definitional issues. The Census asks foreign-born respondents “When did you first come to the U.S. to live/stay?” The answer to this question is used to gauge the
number of arrivals in a given year. By contrast, the INS counts as immigrants the number of people who became
19
Since the Census does not include information on visa status, we approximate the set of
H-1Bs recipients by looking at newly arrived computer scientists and engineers. The first four
columns of Table 9 show the share of new immigrants and natives in each year and at each level
of education who were in these “high-tech” fields. New immigrants and natives were equally
likely to be employed in high-tech in 1990, with slightly over 4% of each working in those
occupations. In the 1990s, there was a slight rise in that share among natives, but the share of
new immigrants working in high-tech more than doubled, to 11.7%. Among college-graduate
immigrants, the share of high-tech workers rose to over 31%.
The last two columns of Table 9 show the rise in the relative earnings of new immigrants
by level of education, first for all occupations11 and then excluding high-tech workers. In these
regressions, which do not control for other factors, the coefficient for all education groups taken
together, seen in the bottom row, goes from 0.054 to -0.008 when engineers and computer
scientists are excluded from the sample. Thus, in the raw data, the H-1B visa program appears to
fully explain the improvement in immigrants’ relative earnings in the 1990s.
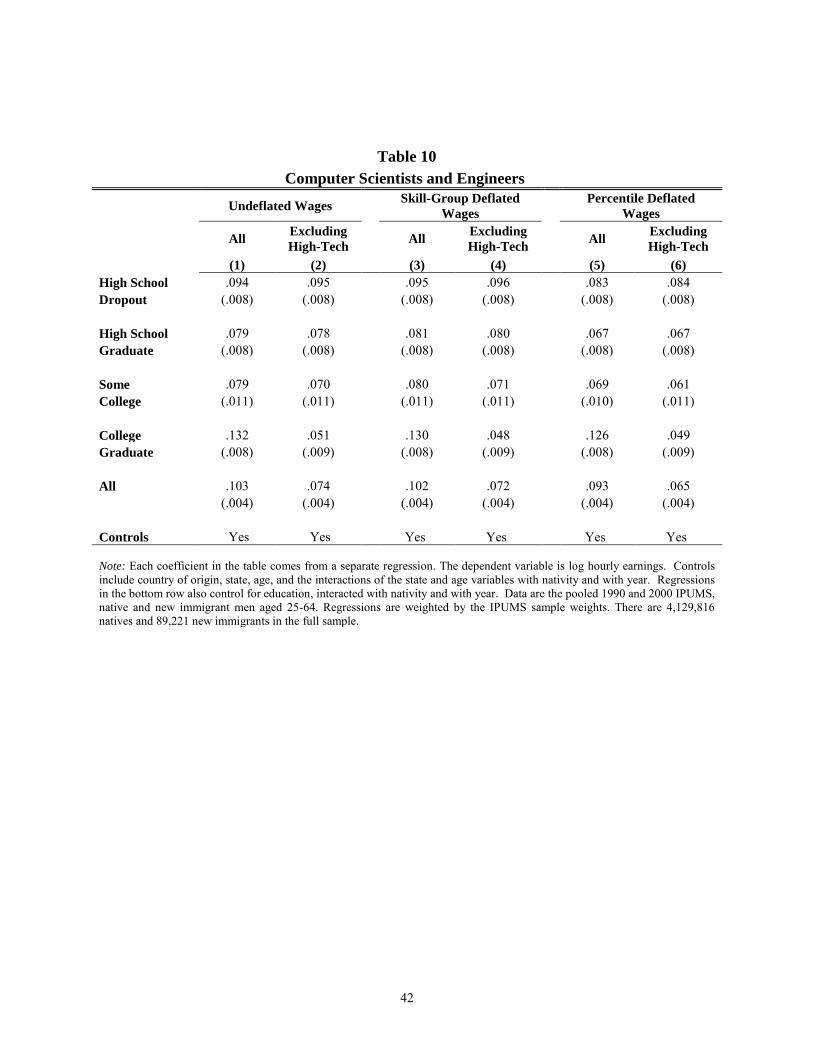
On the other hand, if we control for other factors, such as age, education, country of
origin, and state of residence, as in Table 10, the H-1B visa program would appear to account for
less than one-third of the overall rise in immigrants’ entry wages.12 This can be seen by
legal permanent residents in a given year. The Census measures when people first arrived, whether it was on a temporary visa, like the H-1B, or even illegally. The INS measures when those people got green cards (and includes special cases like the IRCA legalization). Strictly speaking, the Census measures the number of foreign-born arrivals, while the INS measures the number of permanent legal immigrations. H-1B visa holders are foreign-born arrivals on temporary work permits. Many, though not all, of these H-1Bs are likely to be sponsored by their employers for green cards. 11 This replicates column (1) of Table 8. 12 Since one of the effects of the H-1B program was to raise the education level of new arrivals, we also ran these regressions excluding education as a control variable, in order to fully attribute the rise in relative educational attainment to the H-1B program. The estimates are largely unchanged. Using undeflated wages as the dependent variable, the coefficients with and without the H-1Bs are .103 and .074 using all the controls, and .116 and .074 excluding the controls for education.

20
comparing the coefficients with and without high-tech workers for each dependent variable in
the bottom row of the table. If we limit the set of controls to just a dummy variable to adjust for
the increased share of Mexicans in the 1990s, removing high-tech workers from the sample still
leaves roughly half of the improvement in entry wages unexplained. Among college graduates,
seen in the second-to-last row of the table, about 60% of the increase in relative earnings can be
explained by the high-tech sector.
In regressions not reported here, simply correcting for whether an individual is a high-
tech worker reduces the 0.054 uptick observed in the unadjusted data by about one-third. In
other words, one-third of the high-tech effect is due to the fact that there were relatively more
high-tech workers among the immigrants who arrived in the late 1990s. The remaining two-
thirds reflects the fact that immigrant high-tech workers in the late 1990s earned more, relative to
native high-tech workers, than did those that arrived in the late 1980s. This is consistent with the
idea that H-1B visa holders arrive with an earnings advantage, even relative to other high-skill
immigrants. Arriving with a job in hand eliminates some of the initial labor market disadvantage
of new immigrants. The higher earnings of new high-tech workers could also be due to an
increase in the supply of well-trained foreign science and technology workers, and the
development of networks connecting places like the Indian Institute of Technology to the U.S.
high-tech industry.
A final possibility is that the quality of new high-tech immigrants was higher in the 1990s
because the U.S. high-tech boom attracted the best of the international pool of high-tech workers.
In fact, running the uptick regression separately by five-digit country of origin shows that just

21
seven countries had had statistically significant increases in relative entry wages,13 six of which
are Asian countries which send many high-tech workers to the United States: India, China,
Taiwan, Hong Kong, Korea, the Philippines.14 Half of the immigrants from this group of
countries are Indian, and another quarter are Chinese. At least until recently, India and China (as
well as Korea and Taiwan) had income distributions more equal than that of the United States.
Theory predicts that immigrants from such countries will be positively selected from the
population of the home country. Indeed, among new immigrants from these six Asian countries,
in 1990, 47% were college graduates, which is much higher than the share in their home
countries (or, for that matter, the United States). Consistent with an increasing degree of positive
selection motivated by rising U.S. skill prices and, in particular, the rise in the return to a college
degree, that share grew to 72% in 2000. However, over the 1990s, the relative earnings of
immigrants from this group of six countries grew by an enormous 47%, only one-half of which
can be explained by the rise in their relative educational attainment and in the return to college in
this period. This finding is consistent with increased positive selectivity in unobserved skills in
response to the rise in U.S. residual upper-tail inequality. With the share of high-tech workers
among this group increasing from 8.2% to 38.5%, it is also consistent with the H-1B visa story.15
In sum, the improvement in the relative earnings of new immigrants seen in raw data can
be completely eliminated by excluding high-tech workers from the sample. On the other hand, if 13 Care should be taken in treating statistical significance as the metric of the importance of the uptick, since countries with more immigrants have larger sample sizes in the PUMS, providing greater power to reject the null of no change in entry wages. 14 The seventh country is Mexico, which will be discussed below. The uptick coefficients for the individual countries are: India .434 (s.e. .041), China .319 (.051), Taiwan .219 (.107), Hong Kong .407 (.138), Korea .276 (.063), Philippines .168 (.048), and Mexico .062 (.019). The share of new immigrants working in high tech in 2000 was: India 51.1%, China 23.2%, Taiwan 28.0%, Hong Kong 22.9%, Korea 10.6%, and Philippines 13.2%. The share among native-born U.S. workers was 5.7%. 15 Despite their high education, the earnings of the average immigrant from each of these countries falls in the lower half of the native wage distribution in all cases, except India and Taiwan in 2000, so a mechanical effect of rising upper-tail inequality boosting immigrant earnings (as in section IIIB) cannot explain the uptick for this group.

22
we control for country of origin, age, education, and state of residence—or even just the increase
in the proportion coming from Mexico-- it returns as a puzzle. In the adjusted data, the H-1B
visa program appears to explain about 30% of the increase in the relative earnings of new
immigrants in the 1990s.
VI. LOW-SKILL IMMIGRATION
Interestingly, a rebound in the relative earnings of new immigrants also occurred at the
opposite end of the skill distribution. High school dropout immigrants earned 5% more, relative
to native dropouts, in 2000 than in 1990. However, examining wage growth for these two
groups separately in columns (2) and (3) of the top row of Table 8, it becomes apparent that the
change in their relative earnings was driven by the 4.3% fall in the wages of native dropouts,
rather than an increase in the wages of immigrant dropouts. Native dropout wages may have
fallen as a result of immigration, as well as other factors, such as increased adverse selection in
the pool of dropout natives, whose share of the native workforce fell from 12.5% to just 7.9%
during this period. It is interesting that the rise in the proportion of dropouts who are immigrants
was not associated with a decline in their relative earnings.
Closer examination of the earnings data for immigrant dropouts reveals that the
unchanged average over the 1990s masks two effects working in opposite directions. On the one
hand, the share of Mexicans rose, such that fully two-thirds of new immigrant high school
dropouts in the late 1990s came from Mexico. As discussed above, Mexicans tend to earn less
than immigrants from most other countries. On the other hand, new Mexican immigrants with
less than a high school education earned 5.9% more in 2000 than in 1990, and 10.5% more,
relative to native dropouts.

23
What was behind the rise in the wages of new Mexican immigrants? There were three
major changes in their characteristics in the 1990s.16 First, the share of new Mexican dropouts
who had completed eight or fewer years of schooling fell from 80% to 73%. Education levels
increased more generally among Mexican immigrants over this period, with an eight percentage
point rise in the share having completed high school. Most of this can be attributed to rising
educational attainment in Mexico, where the high school graduation rate rose by six percentage
points.17 Still, the rise in the education level of Mexican immigrants to the United States was
even greater than the rise in Mexico, leaving room for the possibility of increased positive
selection.
Second, new Mexicans were less likely to work in agriculture, and more likely to work in
construction, with 9% shifting from the former to the latter. On average, construction workers
earn 50% more per hour than agricultural workers, and the premium among new Mexican
immigrants in 2000 was 23%. Whether this was purely a demand-side change, with recruiters
pulling Mexicans into these new jobs, or whether it was linked to the increasingly skilled supply
of immigrants from Mexico remains for future work to determine.
Third, there was a major shift in the geographic distribution of new Mexican immigrants.
The fraction living in California fell from 58% in the late 1980s to only 24% in the late 1990s.
Mexicans were more likely to settle in Texas, as well as new destinations like North Carolina
and Georgia, with a 15 percentage point increase in the share settling in these three states.18 One
possible explanation is the collapse of wages at the lower end of the California wage distribution 16 There was no significant change in their age or degree of English language fluency. 17 The share of men over the age of 25 who had completed high school rose from 5.9% in 1985 to 11.8% in 1995 (Barro and Lee, 2000). 18 See Borjas (2004) for more on the new immigration to the South, and Zuniga and Hernandez-Leon (2005) on the legal changes that paved the way for the geographic shift.
24
in the 1990s, both in absolute terms and in comparison to the rest of the United States. There is
other evidence to suggest that California “deflected” new immigrants. Research on Los Angeles
suggests that an intentional tightening of housing ordinances raised rents and reduced the
accessibility of Los Angeles to poorer immigrants, thus deflecting further inflows, while
maintaining its attractiveness to better-off immigrants (Light, 2006). However, while natives
earn substantially more in California than elsewhere, Mexicans do not.19 So this geographic
redistribution did not have a substantial effect Mexicans’ relative earnings at the national level.
Table 11 shows that correcting for these changes in education, industry, and geography
can account for 40% of the growth in the absolute wages of new Mexican immigrant dropouts in
the 1990s. For those living outside of California, it can account for just one-third of it.
Why might the entry wages of new Mexicans have risen over the 1990s? The dramatic
increase in their supply, which can be largely attributed to population growth and weak
economic conditions-- including a 20% drop in real wages-- in Mexico in the 1990s (Card and
Lewis, 2007), only makes the rise in their relative earnings more puzzling.20
Is there any reason to believe that a better selection of Mexicans is now coming to the
United States? According to the Borjas (1987) model, it is the relative degree of inequality in the
sending and receiving country that determines the degree of immigrant selectivity. 21
19 Mexican dropouts earned somewhat more in California than elsewhere in 1990, and less in 2000, resulting from no wage growth for this group within California and significant wage growth elsewhere. 20 One (purely speculative) possibility for a perverse effect is that increasing numbers of Mexicans in the U.S. labor market over a longer period of time has lead to the development of improved information and job networks, established recruiting channels, and more exposure on the part of U.S. employers, leading to better matches and higher earnings. 21 With a more unequal income distribution than the United States, the theory predicts Mexican immigrants to the United States would be negatively selected. Chiquiar and Hanson (2005) provide evidence that Mexican immigrants to the United States are more educated than non-emigrant Mexicans, and are drawn from the middle of Mexico’s
wage distribution. Hanson (2007) finds emigration rates to be highest among Mexicans with earnings in the top half the Mexican wage distribution.

25
Compression in the lower tail of the U.S. wage distribution in the 1990s would have attracted a
worse selection of Mexicans to the United States. And in Mexico, despite a macroeconomic
crisis in 1994 which had a disproportionate impact on more-skilled workers and brought a halt to
inequality growth, wage inequality was still higher in the late 1990s than it had been in the late
1980s (Airola and Juhn, 2005). Unless potential immigrants responded to the rate of change in
inequality, rather than just the level, this would suggest a diminished incentive for skilled
Mexicans to emigrate to the United States in the later period. Improved selectivity is therefore
an unlikely candidate to explain the rise in Mexican immigrants’ relative earnings in the 1990s,
which remains a puzzle.
VII. HAS THE UPTURN CONTINUED?
To examine whether the upward trend in immigrant entry wages has continued since
2000, we replicate our analysis using the March CPS for 1994-2009. Figure 12 tracks the
relative earnings of immigrants who arrived in the five years prior to each CPS survey, showing
the 1990-2000 rate of growth found in the PUMS as a benchmark for comparison.22 The raw
earnings data in the upper panel show a great deal of variation over this period. This may be
due, in part, to sampling variability in the CPS, with only about 800 observations on new
immigrants per year. Though this suggests caution in relying on the CPS as an indicator of
short-run trends, it appears that relative entry wages continued to increase through 2001, but then
fell substantially beginning in 2002.
The lower panel of Figure 12 repeats the graph of the upper panel, conditioning on age,
education, and share Mexican. Correcting for these straightforward changes in composition (and
22 In even years, bracketing makes it impossible to isolate those who are within 5 years of arrival, so we use the average for those within 4 and 6 years. It is worth noting that the wage disadvantage of new arrivals appears larger in the CPS than the PUMS, a discrepancy which warrants further study.

26
in fact, the result is the same using just age and education), the decline observed in the raw data
is replaced by a continuing upward trend through most of the 2000s. Between 2000 and 2008,
the adjusted wage gap between natives and new arrivals narrowed by about one-fifth, widening
back to its 2000 level during the deep recession of 2009.
The upward trend in the relative earnings of new arrivals from Mexico has also continued
into the 2000s, and is not readily explained by changes in observable characteristics. This
pattern is particularly interesting, in light of the growing volume of immigration from Mexico to
the United States, and clearly warrants further analysis.
VIII. SUMMARY
Following a thirty-year decline in the earnings of new immigrants relative to natives,
immigrants who came to the United States in the late 1990s earned more on arrival than the
cohort that preceded them. This paper explores the factors behind this recent improvement in
immigrant performance.
We find that, while new arrivals in the late 1990s were more educated than were new
arrivals a decade earlier, this change alone can explain very little of the rise in entry wages.
Taking into account other changes in the composition of new immigrants-- such as the rise in the
share originating in Mexico and the decline in the share settling in California-- only makes the
rise in entry wages more difficult to explain. Neither does the rise in entry wages appear to have
been the result of an economic environment or wage structure generally favorable toward
immigrants.
We find that the rise in the relative entry wages of new immigrants occurred primarily at
the top and bottom ends of the skill distribution. At the top end, we find the upturn was due in
27
part to an improvement in the earnings of new immigrant computer scientists and engineers,
relative to comparable natives, compared to earlier cohorts of immigrant high-tech workers. It
should be emphasized that it is not just that there were more high-tech workers in this most
recent wave of immigrants, but that these high-tech workers earned more, relative to native high-
tech workers, than used to be the case. This improvement in immigrant earnings is consistent
with a story in which arriving with a job in hand, as is the case with the H-1B visa program,
eliminates some of the initial labor market disadvantage of new immigrants. It is also possible
that the high-tech boom and rising upper-tail wage inequality attracted a better selection of
workers to the United States.
At the bottom end of the skill distribution, we find that the reduction in the immigrant-
native earnings gap was driven by the reduction in the wages of native high school dropouts,
rather than an increase in the earnings of immigrant dropouts. A rising share of Mexicans was
offset by an increase in their earnings.
In the raw data, the improvement in immigrant earnings 1990s was confined to the high-
tech sector, a change likely attributable to the H-1B visa program. However, adjusting for
changes over time in the observable characteristics of natives and new immigrants-- in particular,
the dramatic increase in the share of new immigrants coming from Mexico-- most of the
improvement in the relative earnings of new arrivals remains a puzzle.
Has some permanent change occurred to improve the quality of immigrants coming to the
United States or their performance once here? First, it remains to be seen how the most recent
arrival cohorts will perform in the future. This depends, first, on whether the most successful

28
members of these cohorts remain in the United States.23 Second, if the high entry earnings of
this cohort were due, not to positive selectivity, but simply to the advantage of arriving with a
job in hand and thus bypassing the slow process of wage assimilation toward some long-run
level, their earnings advantage may be only a short-run phenomenon.
At the lower end of the skill distribution, the flows and future performance of Mexican
immigrants in the United States will depend on pull factors like demand growth in industries that
employ less-skilled labor, push factors like economic conditions in Mexico, and changes in the
U.S. and Mexican wage structures that affect both the composition of Mexicans emigrating to the
United States, as well as their relative earnings once here.
The United States is currently considering a major overhaul of immigration policy.
Understanding the forces which have led to the improved performance of new arrivals in recent
years would provide valuable guidance in devising policies that, among other things, boost the
labor market success of the foreign-born we admit.
.
23 H-1B visas are temporary, expiring after a maximum of six years. It is likely that most H-1B visa holders will be sponsored for green cards by their employers. Yet, with the collapse of the U.S. high-tech sector, some may not be sponsored, and others may choose to leave for third countries, like Germany.

29
BIBLIOGRAPHY
Airola, Jim and Chinhui Juhn, “Wage Inequality in Post-Reform Mexico,” University of Houston
Working Paper, January 2005.
Angrist, Joshua, Victor Chernozhukov and Ivan Fernandez-Val, “Quantile Regression Under
Misspecification, with an Application to the U.S. Wage Structure,” Econometrica, 2006, vol.74, pp.539-563.
Autor, David H., Melissa S. Kearney, and Lawrence F. Katz, “The Polarization of the U.S. Labor
Market,” American Economic Review, May 2006, vol.96(2), pp.189-194
Autor, David H., Melissa S. Kearney, and Lawrence F. Katz, “Rising Wage Inequality: The Role
of Composition and Prices,” NBER Working Paper 11628, September 2005.
Autor, David H., Melissa S. Kearney, and Lawrence F. Katz, “Trends in U.S. Wage Inequality:
Re-Assessing the Revisionists,” Review of Economics and Statistics, 2008, vol.90(2), pp.300-323.
Barro, Robert, and Jong-Wha Lee, “International Data on Educational Attainment: Updates and Implications,” Harvard University Center for International Development, Working Paper 42,
April 2000.
Borjas, George J. "The Economic Analysis of Immigration," in Handbook of Labor Economics, Volume 3A, edited by Orley Ashenfelter and David Card, North-Holland, 1999, pp. 1697-1760.
Borjas, George J. “Self-Selection and the Earnings of Immigrants.” American Economic Review, Sept. 1987, pp.531-553.
Borjas, George J. “Assimilation, Changes in Cohort Quality, and the Earnings of Immigrants.”
Journal of Labor Economics, Oct. 1985, pp.463-89.
Borjas, George J., “Assimilation and Changes in Cohort Quality Revisited: What Happened to
Immigrant Earnings in the 1980s?” Journal of Labor Economics, vol.3 no.2, 1995.
Borjas, George J., “The Rise of Low-Skill Immigration in the South,” unpublished manuscript,
July 2004.
Bratsberg, Bernt, Erling Barth, and Oddbjorn Raaum, “Local Unemployment and the Relative
Wages of Immigrants: Evidence from the Current Population Surveys, Review of Economics and Statistics, vol. LXXXVIII, no.2, May 2006, pp.243-263.
Butcher, Kristin F., and John DiNardo, “The Immigrant and Native-Born Wage Distributions: Evidence from the United States Censuses” Industrial and Labor Relations Review, vol.56, no.1, October 2002, pp.97-121.

30
Card, David and Ethan G. Lewis, “The Diffusion of Mexican Immigrants During the 1990s: Explanations and Impacts,” in Mexican Immigration to the United States, George J. Borjas, ed. Chicago: University of Chicago Press, 2007, pp.193-227.
Chiquiar, Daniel and Gordon H. Hanson, “International Migration, Self-Selection, and the Distribution of Wages: Evidence from Mexico and the United States,” Journal of Political
Economy, vol.113, no.2, April 2005, pp.239-281.
Duleep, Harriet, and Mark Regets, “The Elusive Concept of Immigrant Quality: Evidence from
1970-1990,” IZA Discussion paper 631, November 2002.
Friedberg, Rachel M. “You Can’t Take It With You? Immigrant Assimilation and the Portability
of Human Capital,” Journal of Labor Economics, vol.18, no.2, April 2000, pp.221-251.
Funkhouser, Edward and Stephen J. Trejo, “The Labor Market Skills of Recent Male
Immigrants: Evidence from the Current Population Survey,” Industrial and Labor Relations
Review, vol. 48, no. 4, July 1995.
Hanson, Gordon H. “Emigration, Labor Supply, and Earnings in Mexico,” in Mexican
Immigration to the United States, George J. Borjas, ed. Chicago: University of Chicago Press, 2007, pp.289-328.
Hirsch, Barry T. and Edward J. Schumacher, “Match Bias in Wage Gap Estimates Due to
Earnings Imputation,” Journal of Labor Economics, vol. 22, no. 3, July 2004, pp.689-722.
Jasso, Guillermina, Mark R. Rosenzweig, and James P. Smith, “The Changing Skill of New Immigrants to the United States: Recent Trends and Their Determinants” in Issues in the
Economics of Immigration, George J. Borjas, ed. Chicago: University of Chicago Press, 2000, pp.185-225.
Jasso, Guillermina, Mark R. Rosenzweig, and James P. Smith, “The Earnings of U.S.
Immigrants: World Skill Prices, Skill Transferability and Selectivity,” unpublished manuscript,
March 2002.
King, Miriam, Steven Ruggles, Trent Alexander, Donna Leicach, and Matthew Sobek. Integrated Public Use Microdata Series, Current Population Survey: Version 2.0. Minneapolis, MN: Minnesota Population Center, 2009.
LaLonde, Robert J. and Robert H. Topel, “The Assimilation of Immigrants in the U.S. Labor Market.” In Immigration and the Work Force: Economic Consequences for the United States and
Source Areas, edited by George J. Borjas and Richard Freeman. Chicago: University of Chicago Press, 1992, pp.67-92.

31
LaLonde, Robert J. and Topel, Robert H. "Economic Impact of International Migration and the Economic Performance of Migrants," M. R. Rosenzweig and O. Stark, Handbook of Population
and Family Economics. Handbooks in Economics, vol. 14. Amsterdam; New York and Oxford: Elsevier Science North-Holland, 1997, pp. 799-850.
Light, Ivan. Deflecting Immigration: Networks, Markets, and Regulation in Los Angeles. New York: Russell Sage Foundation, 2006.
Lubotsky, Darren, “The Effect of Changes in the U.S. Wage Structure on Recent Immigrants’
Earnings,” Princeton University IR Section Working Paper #458, Sept. 2001.
Munshi, Kaivan, “Networks in the Modern Economy: Mexican Migrants in the U.S. Labor
Market,” Quarterly Journal of Economics, May 2003, pp.549-599.
Passel, Jeffrey S. “The Size and Characteristics of the Unauthorized Migrant Population in the
United States: Estimates Based on the March 2005 Current Population Survey.” Pew Hispanic
Center Report, March 2006.
Ruggles, Steven, Matthew Sobek, Trent Alexander, Catherine A. Fitch, Ronald Goeken, Patricia Kelly Hall, Miriam King, and Chad Ronnander. Integrated Public Use Microdata Series:
Version 4.0. Minneapolis, MN: Minnesota Population Center, 2009.
Smith, James P. and Barry Edmonston. The New Americans: Economic, Demographic, and
Fiscal Effects of Immigration. Washington, D.C.: National Academy Press, 1997.
Smith, James P. “Immigrants and the Labor Market,” Journal of Labor Economics, vol. 24, no. 2, April 2006, pp.203-233.
U.S. Department of Homeland Security, Office of Immigration Statistics, Characteristics of
Specialty Occupation Workers (H-1B): Fiscal Year 2003, Nov. 2004.
U.S. Immigration and Naturalization Service (later, Citizenship and Immigration Service). Statistical Yearbook of the Immigration and Naturalization Service. Washington, D.C.: Government Printing Office, various years.
Zuniga, Victor, and Ruben Hernandez-Leon. New Destinations: Mexican Immigrants in the
United States. New York: Russell Sage Foundation, 2005.

32
Table 1
Composition of New Arrivals
Continent of Birth 1990 2000 Change
Mexico 22.2 31.1 8.9 Central America 7.9 5.7 -2.2 Caribbean 7.2 6.5 -.7 South America 7.5 6.8 -.6 Northwest Europe 6.2 5.1 -1.2 Southeast Europe 7.1 7.3 .2 Former Soviet Union 1.4 3.1 1.7 East Asia 12.2 7.8 -4.4 Southeast Asia 8.5 5.6 -2.9 Southwest Asia 7.2 10.6 3.4 Other 12.6 10.4 -2.2 Total 100.0 100.0 0
Education
High School Dropout 0 6.7 4.6 -2.2 1-4th 4.8 2.5 -2.4 5-8th 12.4 13.4 1.0 9th 3.9 4.9 1.0 10th 2.9 2.4 -.4 11th 2.0 2.0 -.0 High School 12th 5.6 5.8 .2 High School 17.9 17.9 -.1 Some College Some College 10.1 9.1 -.9 Associate 4.7 3.3 -1.4 College Graduate Bachelors 14.9 17.4 2.5 Masters 7.5 9.9 2.4 Professional 3.3 3.5 .2 Ph.D. 3.3 3.4 .1 Total 100.0 100.0 0
Note: The data for 1990 are for immigrants who arrived in 1985-89, and the data for 2000 are for immigrants who arrived in 1995-99. The sample is restricted to men aged 25-64.

33
Table 1 continued
Composition of New Arrivals
Occupation 1990 2000 Change
Professional, Technical 17.0 22.6 5.5 Farmer .2 .1 -.1 Manager 10.6 10.5 -.1 Clerical 7.3 5.9 -1.4 Sales 3.3 2.7 -.5 Crafts 14.2 14.4 .2 Operatives 17.5 17.2 -.4 Service 16.6 13.5 -3.1 Farm Labor 3.6 2.5 -1.1 Laborers 9.7 10.6 1.0 Total 100.0 100.0 0
Industry Agriculture 6.5 5.1 -1.4 Construction 12.0 14.4 2.4 Durables Manufacturing 12.9 13.4 .5 Nondurables Manufacturing 9.3 7.8 -1.5 Transportation, Communication 4.6 5.8 1.1 Trade 24.1 21.0 -3.1 Finance, Insurance, Real Estate 4.3 3.5 -.9 Services 24.3 27.5 3.2 Public Sector 2.0 1.7 -.4 Total 100.0 100.0 0
State of Residence
California 32.3 19.0 -13.3 New York 16.3 10.3 -6.0 Florida 7.4 8.4 1.0 Texas 6.7 10.6 3.9 New Jersey 6.2 5.3 -1.0 Illinois 4.8 5.5 .7 Massachusetts 3.2 2.7 -.5 Washington 1.5 2.2 .7 Arizona 1.4 2.4 1.0 Georgia 1.3 3.6 2.3 North Carolina .8 3.1 2.3
Note: The data for 1990 are for immigrants who arrived in 1985-89, and the data for 2000 are for immigrants who arrived in 1995-99. The sample is restricted to men aged 25-64.

Table 2: Correcting for Composition
(1) (2) (3) (4) (5) (6) (7) (8)
Immigrant -.368 -.334 -.378 -.296 -.150 -.546 (.003) (.003) (.004) (.003) (.034) (.114) 2000 .022 -.007 -.044 -.006 .438 .022 -.014 .212 (.001) (.001) (.002) (.001) (.010) (.001) (.014) (.016) Immigrant*2000 .054 .053 .050 .082 .076 .084 .074 .100
(.004) (.004) (.004) (.004) (.004) (.004) (.004) (.004)
High School .188 .183 .214 (.001) (.001) (.001) Some College .353 .337 .350 (.001) (.001) (.001) College Graduate .635 .588 .601 (.001) (.002) (.002) Graduate School .840 .787 .726 (.001) (.002) (.002) High School * 2000 .011 -.019 (.002) (.002) Some College * 2000 .033 .006 (.002) (.002) College Graduate * 2000 .083 .058 (.002) (.002) Graduate School * 2000 .098 .091 (.003) (.003) High School * Immigrant .013 -.097 (.005) (.005) Some College * Immigrant .041 -.109 (.006) (.007) College Grad * Immigrant .169 -.064 (.006) (.007) Grad School * Immigrant .063 -.134 (.006) (.007) Age .076 .088 .071 (.000) (.000) (.000) Age
2 -.074 -.088 -.067
(.000) (.000) (.000) Age*2000 -.022 -.013 (.000) (.000) Age
2 *2000 .026 .013
(.001) (.001) Age*Immigrant .002 -.030 (.002) (.002) Age
2*Immigrant -.016 .021
(.002) (.002) Origin-Country Fixed
Effects Yes Yes State Fixed Effects Yes Yes Constant 2.511 2.168 2.187 .743 .499 2.502 2.424 .426 (.000) (.001) (.001) (.005) (.007) (.000) (.010) (.012) R
2 .006 .146 .146 .058 .059 .013 .041 .215
Note: Dependent variable is the log of hourly earnings. Data are the pooled 1990 and 2000 IPUMS, natives and new immigrant men only (N = 4,129,816 and 89,221 respectively). Regressions are weighted by the IPUMS sample weights. State fixed effects vary with nativity and with year.

Table 3
Immigrants’ Earnings Relative to Natives
Arrival Census Year
Cohort 1970 1980 1990 2000
1995-99 -.314 (.003) 1990-94 -.320 (.003) 1985-89 -.368 -.282 (.003) (.003) 1980-84 -.322 -.200 (.003) (.003) 1975-79 -.321 -.191 -.112 (.004) (.003) (.003) 1970-74 -.216 -.098 -.061 (.004) (.004) (.004) 1965-69 -.192 -.088 .015 .047 (.006) (.004) (.004) (.005) 1960-64 -.043 -.001 .088 .123 (.007) (.005) (.005) (.007) 1950-59 .051 .057 .178 .170 (.005) (.004) (.005) (.007) Pre-1950 .091 .098 .229 .261 (.005) (.005) (.009) (.017) N 904,660 1,856,705 2,165,789 2,487,274
Note: Dependent variable is the log of hourly earnings. Sample includes native and new immigrant men aged 25-65. Regressions are weighted by the IPUMS sample weights.

36
Table 4
Cross-Cohort Comparisons
A. Did the uptick occur for earlier cohorts as well? No.
Years Since
Migration
Arrival Cohort
1990
2000
Change
0 – 5 1985-89 vs. 1995-99 -.368 -.314 .054 (.004) 5 – 10 1980-84 vs. 1990-94 -.322 -.320 .001 (.004) 10 - 15 1975-79 vs. 1985-89 -.191 -.282 -.091 (.004) 25 - 20 1970-74 vs. 1980-84 -.098 -.200 -.101 (.005)
B. Was assimilation particularly fast in the 1990s? No.
Decade Arrival Cohort From To Change
First Decade
Assimilation
Rate
1985-89 over the 1990s -.368 -.282 .086 (.004)
1975-79 over the 1980s -.321 -.191 .130 (.005) Second Decade
Assimilation
Rate
1980-84 over the 1990s -.322 -.200 .122 (.004)
1970-74 over the 1980s -.216 -.098 .117 (.005)

37
Table 5
Relative Earnings and the State Unemployment Rate
(1) (2) (3) (4)
Immigrant -.368 -.451 -.253 -.217 (.003) (.003) (.013) (.013) 2000 .022 .029 .008 .018 (.001) (.001) (.001) (.001) Immigrant*2000 .054 .093 .043 .064
(.004) (.004) (.005) (.005)
Unemployment Rate -.012 -.010 (.000) (.001) Unemployment Rate * Immigrant -.023 -.046 (.003) (.002) State Fixed Effects Yes Yes Constant 2.511 2.509 2.576 2.562 (.000) (.000) (.002) (.003) R
2 .006 .040 .007 .040
Note: Dependent variable is the log of hourly earnings. Data are the pooled 1990 and 2000 PUMS, native and new immigrant men aged 25-64. Regressions are weighted by the IPUMS sample weights. State unemployment rates are measured as of 1989 and 1999. There are 4,129,816 natives and 89,221 new immigrants in the sample.

38
Table 6
Relative Wages Deflated by Native Wage Growth
Undeflated
Wages
Undeflated
Wages
Skill-Group
Deflated
Wages
Skill-Group
Deflated
Wages
Percentile
Deflated
Wages
Percentile
Deflated
Wages
(1) (2) (3) (4) (5) (6)
Immigrant -.368 -.262 -.368 -.255 -.368 -.262 (.003) (.003) (.003) (.003) (.003) (.003) 2000 .022 -.032 .056 .000 -.004 -.057 (.001) (.001) (.001) (.001) (.001) (.001) Immigrant*2000 .054 .080 .035 .064 .045 .070
(.004) (.004) (.004) (.004) (.004) (.004)
Age-Education Group
Dummies Yes Yes Yes Constant 2.511 2.263 2.511 2.281 2.511 2.266 (.000) (.002) (.001) (.002) (.000) (.002) R
2 .006 .181 .008 .177 .007 .180
Note: Dependent variable is the log of hourly earnings. Data are the pooled 1990 and 2000 PUMS, native and new immigrant men aged 25-64. Regressions are weighted by the IPUMS sample weights. There are 16 age-education groups, where the four age groups are 25-34, 35-44, 45-54, and 55-64, and the education groups are high-school dropout, high-school graduate, some college, and college graduate. Deflated wages are equal to the actual log wage for observations in 1990, and to the log wage minus the 1990-2000 growth in native wages in that age-education cell or wage-distribution percentile for observations (both native and immigrant) in 2000. There are 4,129,816 natives and 89,221 new immigrants in the sample.

39
Table 7
Quantile Comparisons
1990 2000 1990-2000
Quantile of
the
Immigrant
Wage
Distribution
Immigrant
Log Wage at
that Quantile
Corresponding
Quantile of the
Native Wage
Distribution
Native Log
Wage at
Quantile in
Column (3)
Native
Wage
Growth
(4)-(2)
Immigrant
Wage
Growth
Immigrant Wage
Growth Relative
to Natives
(6) - (5)
(1) (2) (3) (4) (5) (6) (7)
10% 1.322 3.4% 1.355 .033 -.008 -.041
25% 1.635 8.1% 1.680 .045 .036 -.009
50% 2.050 21.4% 2.063 .013 .058 .045
75% 2.574 52.6% 2.556 -.018 .165 .183
90% 3.108 85.9% 3.148 .040 .159 .119
Note: Data are pooled 1990 and 2000 PUMS, native and new immigrant men aged 25-64. There are 4,129,816 natives and 89,221 new immigrants in the sample.
40
Table 8
Wage Growth by Level of Education
Immigrants
Relative to
Natives
Immigrants Natives
(1) (2) (3)
High School .050 .006 -.044 Dropout (.007) (.007) (.002) High School .003 -.029 -.032 Graduate (.008) (.009) (.001) Some .029 .018 -.011 College (.010) (.013) (.001) College .099 .140 .041 Graduate (.008) (.010) (.001) All .054 .076 .022 (.004) (.005) (.001)
Note: Each coefficient comes from a separate regression without additional controls. Data are the pooled 1990 and 2000 IPUMS, native and new immigrant men aged 25-64. Regressions are weighted by the IPUMS sample weights. There are 4,129,816 natives and 89,221 new immigrants in the sample.

41
Table 9
Computer Scientists and Engineers
Share Employed in High-Tech Immigrants' Relative
Wage Growth Immigrants Natives
1990 2000 1990 2000 All
Excluding
High-Tech
(1) (2) (3) (4) (5) (6)
High School .2 .2 .1 .2 .050 .050 Dropout (.007) (.007) High School .7 .8 .8 1.1 .003 .003 Graduate (.008) (.007) Some 2.6 6.0 3.9 5.6 .029 .010 College (.010) (.011) College 13.9 31.4 10.6 12.7 .099 .015 Graduate (.008) (.009) All 4.6 11.7 4.1 5.7 .054 -.008 (.004) (.004)
Note: Each coefficient in columns (5) and (6) comes from a separate regression, without additional controls. The dependent variable is log hourly earnings. Data are the pooled 1990 and 2000 IPUMS, natives and new immigrant men aged 25-64. Regressions are weighted by the IPUMS sample weights. There are 4,129,816 natives and 89,221 new immigrants in the full sample.
42
Table 10
Computer Scientists and Engineers
Undeflated Wages Skill-Group Deflated
Wages Percentile Deflated
Wages
All
Excluding
High-Tech All
Excluding
High-Tech All
Excluding
High-Tech
(1) (2) (3) (4) (5) (6)
High School .094 .095 .095 .096 .083 .084 Dropout (.008) (.008) (.008) (.008) (.008) (.008) High School .079 .078 .081 .080 .067 .067 Graduate (.008) (.008) (.008) (.008) (.008) (.008) Some .079 .070 .080 .071 .069 .061 College (.011) (.011) (.011) (.011) (.010) (.011) College .132 .051 .130 .048 .126 .049 Graduate (.008) (.009) (.008) (.009) (.008) (.009) All .103 .074 .102 .072 .093 .065 (.004) (.004) (.004) (.004) (.004) (.004) Controls Yes Yes Yes Yes Yes Yes
Note: Each coefficient in the table comes from a separate regression. The dependent variable is log hourly earnings. Controls include country of origin, state, age, and the interactions of the state and age variables with nativity and with year. Regressions in the bottom row also control for education, interacted with nativity and with year. Data are the pooled 1990 and 2000 IPUMS, native and new immigrant men aged 25-64. Regressions are weighted by the IPUMS sample weights. There are 4,129,816 natives and 89,221 new immigrants in the full sample.

43
Table 11
Mexican High School Dropouts
All All
Excluding
California
Excluding
California
(1) (2) (3) (4)
2000 .050 .031 .096 .067 (.010) (.010) (.014) (.014) <9th Grade -.026 -.023 (.010) (.013) Agriculture -.112 -.125 (.012) (.015) Construction .085 .058 (.011) (.013) California -.021 (.011) Texas -.090 -.085 (.012) (.013) North Carolina -.079 -.081 (.023) (.024) Georgia -.037 -.038 (.024) (.024) R
2 .002 .016 .004 .017
Observations 17,182 17,182 11,105 11,105
Note: Dependent variable is the log of hourly earnings. Data are the pooled 1990 and 2000 PUMS. Sample includes Mexican-born men aged 25-64 who have not completed high school. Regressions are weighted by the PUMS sample weights.

44
Figure 1Earnings of New Immigrants Relative to Natives
-0.4
-0.3
-0.2
-0.1
0.0
1960 1970 1980 1990 2000
Year
Log
Earn
ings
Gap
Note: Each point represents the average log earnings of immigrants who arrived in the five years prior to the specified Census year,relative to average native earnings in that year.

45
Figure 2Earnings of Natives and New Immigrants
2.1
2.2
2.3
2.4
2.5
2.6
2.7
1960 1970 1980 1990 2000Year
Log
Earn
ings
Note: Each point indicates average log earnings in the specified Census year. New immigrants are those who arrived in the five years prior to thespecified year.
Natives
New Immigrants
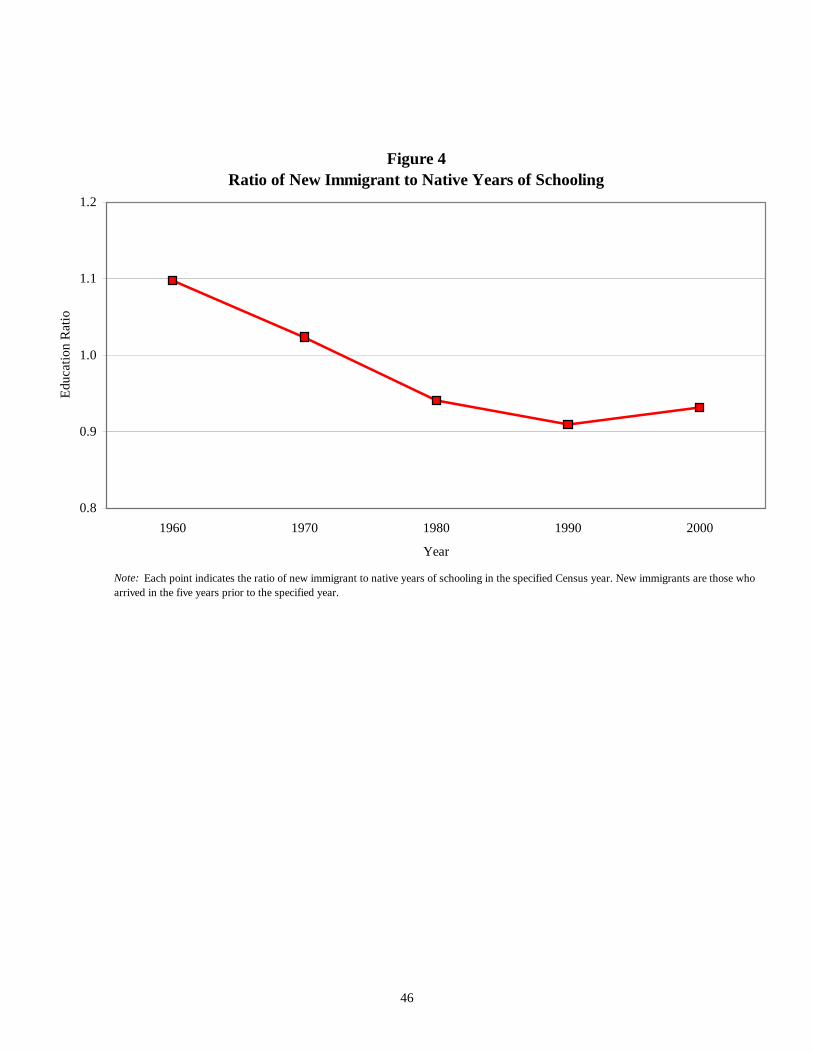
46
Figure 4Ratio of New Immigrant to Native Years of Schooling
0.8
0.9
1.0
1.1
1.2
1960 1970 1980 1990 2000
Year
Educ
atio
n R
atio
Note: Each point indicates the ratio of new immigrant to native years of schooling in the specified Census year. New immigrants are those who arrived in the five years prior to the specified year.

47
FIGURE 5
U.S. Labor Market Conditions
-4-2
02
46
810
1980 1982 1984 1986 1988 1990 1992 1994 1996 1998 2000 2002 2004 2006Year
unemployment wage growth
Source: U.S. Bureau of Labor Statistics.

48
Figure 6Trends in Immigrant Earnings
by Years Since Migration
-0.4
-0.3
-0.2
-0.1
0.0
0.1
1960 1970 1980 1990 2000
Year
Log
Earn
ings
Gap
Note: The relative wage is calculated in the sample of working men aged 25-64 who are not enrolled in school and who worked in the civilian sector. Thehourly wage rate is defined as the ratio of total income earned annually to annual hours worked in the calendar year prior to the Census.
1-5 Years in US
5-10 Years in US
10-15 Years in US
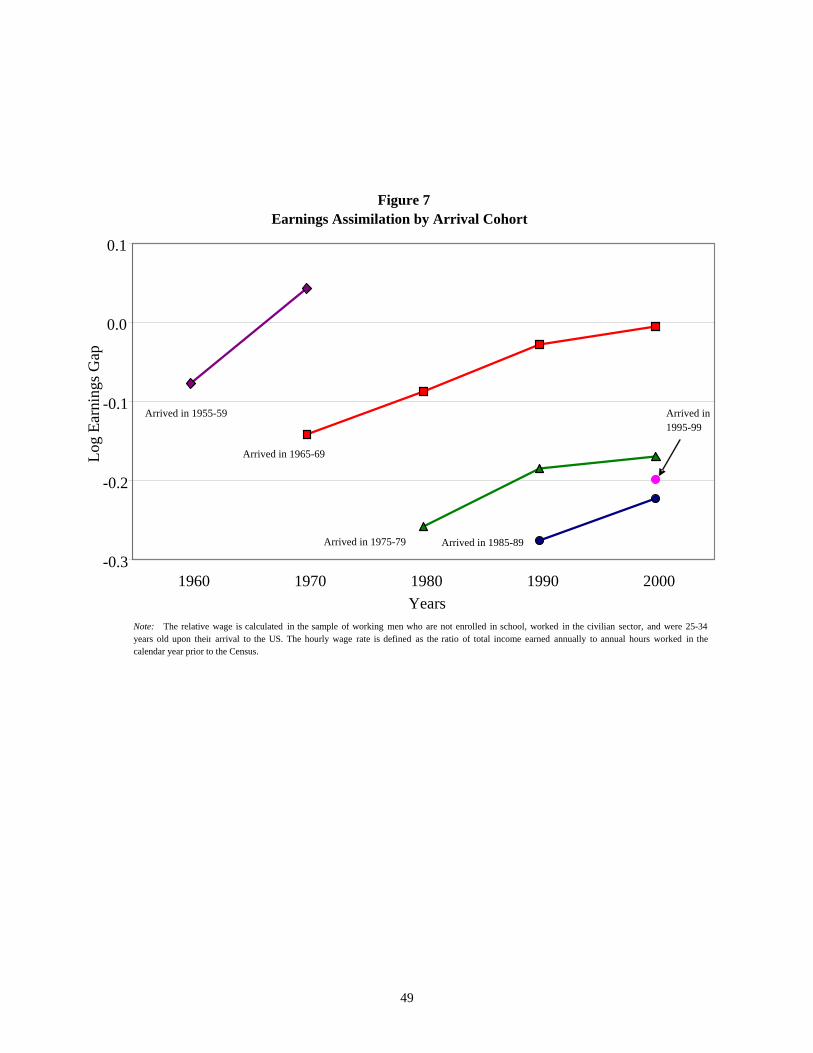
49
Figure 7Earnings Assimilation by Arrival Cohort
-0.3
-0.2
-0.1
0.0
0.1
1960 1970 1980 1990 2000Years
Log
Earn
ings
Gap
Note: The relative wage is calculated in the sample of working men who are not enrolled in school, worked in the civilian sector, and were 25-34years old upon their arrival to the US. The hourly wage rate is defined as the ratio of total income earned annually to annual hours worked in thecalendar year prior to the Census.
Arrived in 1965-69
Arrived in 1975-79 Arrived in 1985-89
Arrived in 1995-99
Arrived in 1955-59

50
Figure 8A Wage Distribution by Nativity in 1990
(Natives and New Immigrants)
0.2
.4.6
.8D
ensi
ty
0 2 4 6Log Earnings
Immigrants Natives

51
Figure 8B
Wage Distribution by Nativity in 2000 (Natives and New Immigrants)
0
.2.4
.6.8
Den
sity
0 2 4 6Log Earnings
Immigrants Natives

52
Figure 8C
The New Immigrant Wage Distribution in 1990 and 2000
0.2
.4.6
Den
sity
0 2 4 6Log Earnings
1990 2000

53
Figure 9
Change in Earnings by Percentile, 1990-2000
-0.05
0
0.05
0.1
0.15
0.2
10 20 30 40 50 60 70 80 90 100
Percentile
Diff
eren
ce in
Log
Ear
ning
s
New Immigrants
Natives
Notes: Each point indicates the difference between 2000 and 1990 earnings for each percentile. The sample includes men aged 25-64. New immigrants are those who arrived in the five years prior to the Census.

54
Figure 10Earnings of New Immigrants Relative to Natives
by Level of Education
-0.40
-0.35
-0.30
-0.25
-0.20
-0.15
-0.10
-0.05
1960 1970 1980 1990 2000
Year
Log
Earn
ings
Gap
College Grad
Some College
HighSchool
Dropout
Note: The relative wage is calculated in the sample of men aged 25-64. The hourly wage rate is defined as the ratio of total income earned annually to annual hours worked in the calendar year prior to the Census.

55
Figure 11Number of H-1B Visas
0
100,000
200,000
300,000
400,000
500,000
1989 1990 1991 1992 1993 1994 1995 1996 1998 1999 2000 2001 2002 2003 2004
Year
Num
ber o
f H-1
B V
isas
Source: INS Statistical Yearbook, 1996 and 1999; U.S. Department of Homeland Security, Office of Immigration Statistics Yearbook,2004.
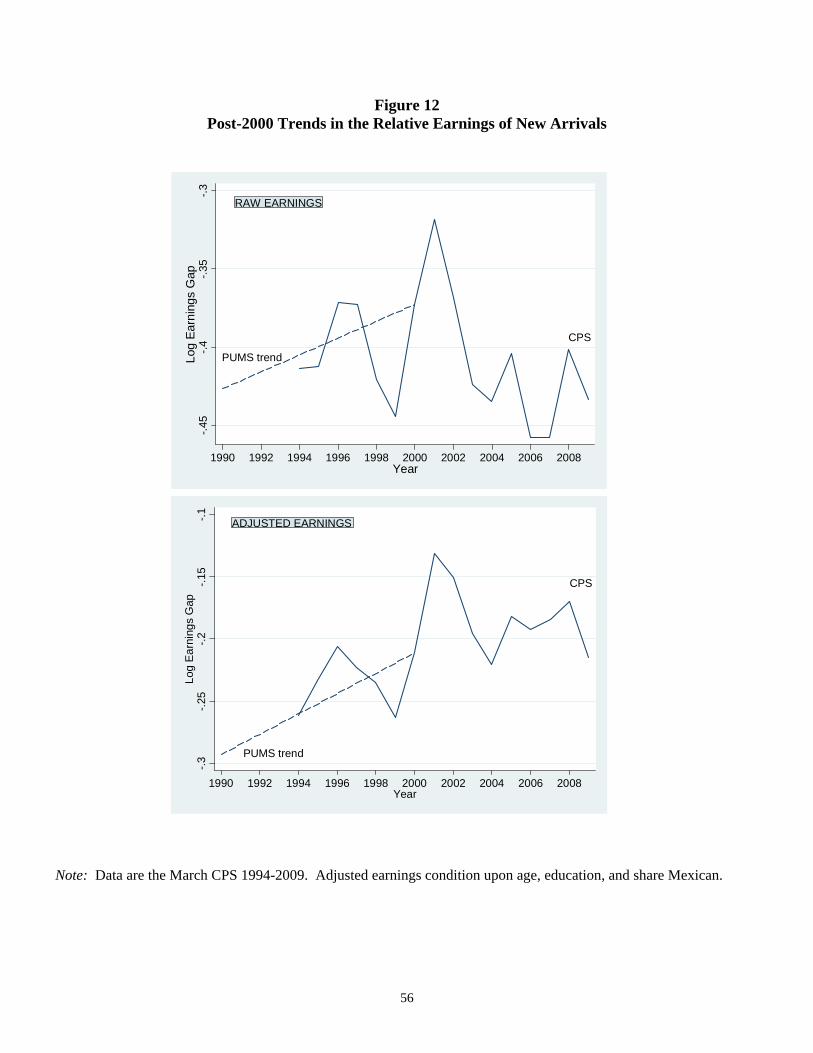
56
Figure 12 Post-2000 Trends in the Relative Earnings of New Arrivals
RAW EARNINGS
PUMS trend
CPS
-.45
-.4-.3
5-.3
Log
Earn
ings
Gap
1990 1992 1994 1996 1998 2000 2002 2004 2006 2008Year
ADJUSTED EARNINGS
PUMS trend
CPS
-.3-.2
5-.2
-.15
-.1Lo
g E
arni
ngs
Gap
1990 1992 1994 1996 1998 2000 2002 2004 2006 2008Year
Note: Data are the March CPS 1994-2009. Adjusted earnings condition upon age, education, and share Mexican.