Embed Size (px)
Citation preview
Policy Research Working Paper 9318
Recent Trends in Bank PrivatizationAta Can Bertay
Pietro CaliceFederico Alfonso Diaz Kalan
Oliver Masetti
Finance, Competitiveness and Innovation Global Practice July 2020
Pub
lic D
iscl
osur
e A
utho
rized
Pub
lic D
iscl
osur
e A
utho
rized
Pub
lic D
iscl
osur
e A
utho
rized
Pub
lic D
iscl
osur
e A
utho
rized
Produced by the Research Support Team
Abstract
The Policy Research Working Paper Series disseminates the findings of work in progress to encourage the exchange of ideas about development issues. An objective of the series is to get the findings out quickly, even if the presentations are less than fully polished. The papers carry the names of the authors and should be cited accordingly. The findings, interpretations, and conclusions expressed in this paper are entirely those of the authors. They do not necessarily represent the views of the International Bank for Reconstruction and Development/World Bank and its affiliated organizations, or those of the Executive Directors of the World Bank or the governments they represent.
Policy Research Working Paper 9318
This paper revisits trends in bank privatization and analyzes their economic impact over the past 25 years. Building on a novel data set of privatization events for 70 developed and developing countries, it shows that bank privatization became more frequent since the Global Financial Crisis, especially in emerging markets such as China and India, but also smaller in that the fraction of a bank’s ownership relinquished during privatization events declined. The majority of privatizations happened via public sales in domestic capital markets. The banks that were chosen to be privatized tended to underperform their peers and had
weaker asset quality pre-privatization, but the empirical evidence on banks’ post-privatization performance is mixed. The paper finds that privatized banks turn toward more tra-ditional banking models and increase credit extension with no apparent negative distributional implications. However, the analysis does not reveal significant differences in bank profitability post-privatization, although differences exist between developed and developing countries. Notably, banks that have been recapitalized prior to privatization perform significantly better afterward privatization.
This paper is a product of the Finance, Competitiveness and Innovation Global Practice. It is part of a larger effort by the World Bank to provide open access to its research and make a contribution to development policy discussions around the world. Policy Research Working Papers are also posted on the Web at http://www.worldbank.org/prwp. The authors may be contacted at [email protected]; [email protected]; [email protected]; and [email protected].

Recent Trends in Bank Privatization
Ata Can Bertay, Pietro Calice, Federico Alfonso Diaz Kalan, Oliver Masetti1
JEL Classification Numbers: G210, G28, G23, H13, H81 Keywords: State-owned Banks, Financial Crisis, Financial Development, Public Economics, Privatization, Bank Profitability Authors’ E-Mail Addresses: [email protected]; [email protected]; [email protected]; and [email protected].
1 The authors would like to acknowledge the financial support of the FIRST Initiative and thank Carlos Piñerúa and Moni Sengupta for their support. The authors would also like to thank Tatiana Alonso Gispert, Alexander Berg, Tito Cordella, Robert Cull, Eva Gutierrez, William Megginson, Zafer Mustafaoglu, Ugo Panizza and Valeria Salomao Garcia for their comments. The views expressed in this paper are those of the authors and do not necessarily represent those of the World Bank or of its Board of Directors.
2
1. Introduction
Privatization programs implemented over the past quarter of a century have significantly contributed to the diminished role of state-owned commercial banks (SOCBs) globally. While the median share of SOCBs over total banking assets was 40 percent in developing economies and 36 percent in advanced economies in 1995, it had declined to 18 percent and 12 percent, respectively, in 2016 (Cull et al, 2018). This is despite the wave of temporary nationalizations of privately-owned banks that occurred in many countries after recent banking crises, when bank bailouts (e.g. through direct capital injections and purchase of banks) were a common government response.2 However, government ownership of banks remains still dominant in some parts of the world. For example, the market share of SOCBs is above 50 percent in countries such as Uzbekistan, the Russian Federation, Uruguay and Qatar and exceeds 40 percent in the South Asia region.
Privatization programs around the world have traditionally been motivated by the notion that extensive government ownership in banking is problematic for financial development, which, in turn, is crucial for economic development (Megginson, 2005).3 Governments around the world play many important roles when it comes to establishing a growth-promoting financial system. In many countries, and especially in developing countries, governments go beyond their roles as economic policy makers, legal and informational infrastructure providers, and regulators, and directly intervene in their banking systems through government ownership of financial institutions (Demirguc-Kunt, 2012). The literature, however, points out that government ownership of banks can be detrimental to economic welfare as it is correlated with lower financial development and economic growth and higher systemic fragility (La Porta et al., 2002). There is plenty of bank-level evidence documenting underperformance of government-owned banks in terms of profitability, especially in developing countries (Mian, 2003; Iannotta et al., 2007; Micco et al., 2007). An important contributing factor to such grim outlook is the political nature of government-owned banks which may provide politically motivated inefficient lending―so-called ‘political view’ of banking (e.g. Sapienza, 2003; Dinc, 2005; Englmaier and Stowasser, 2017).4
There is also evidence showing that fundamental determinants of economic growth, such as institutional quality are critical in the relationship between government ownership of banks and financial and economic development outcomes as the negative correlation disappears and even turns to positive when institutional development is factored in (see for example the cross-sectional analysis in Andrianova et al., 2012). This ‘developmental’ view suggests that governments have longer term developmental goals, particularly addressing market failures which can be severe due to, for example, lack of economic institutions such as informational infrastructure (World Bank, 2012). Thus, government-owned banks with various objectives beyond profit maximization may provide funding to disadvantaged segments of the society. Such credit provision may have developmental benefits, but they are also very risky due to the informational problems. Indeed,
2 See Igan et al. (2019) for a discussion of government response after the global financial crisis (GFC). 3 There is a vast literature documenting the positive relationship between financial development and real economic outcomes (Levine, 2005; Popov, 2018, Brown and Earle, 2017; Levine and Warusawitharana, 2019). Also, privatization programs and related analyses involve not just financial markets and institutions but include almost all businesses. See, for example, Magginson (2017) for an extensive survey of recent research. 4 See Cull et al. (2018) for a recent analysis of trends in and implications of bank ownership for bank performance and competition, financial stability, and access to finance.
3
there is evidence showing that the performance of government-owned banks depends on whether they purchased a distressed bank because of political factors. Unless they purchase a distressed bank, government-owned banks tend to perform as well as their private counterparts and especially so in countries with poor records on political rights and governance (Shen et al., 2014). This substitution between institutional elements and effectiveness of government-owned banks was also evident in Andrianova et al. (2012), who show the positive correlation between government bank ownership and argue that economic growth outcomes are stronger for the countries with weaker regulatory quality. One other aspect with possible developmental consequences is that the activities of government-owned banks may differ from private banks in many dimensions including the cyclicality of credit provision and asset and liability composition. Regarding the cyclicality of credit provision, Bertay et al. (2015) show that state-owned banks can smooth the credit cycles even after controlling for the election cycles and help during a banking crisis by providing countercyclical lending.5 A country study by Gupta et al. (2015) provides an example of heterogeneity in asset composition by demonstrating that government banks in India invested a larger share of their assets in government securities, which may not be as growth enhancing as some alternatives such as corporate funding, even in the face of financial liberalization.6
Widespread privatization programs, however, are often controversial and difficult to implement in many parts of the world, especially in developing economies where the share of SOCBs remains comparatively high. This is a general trend that goes beyond the financial industry and affects all sectors of the economy that remain in state hands. It largely reflects political opposition stemming from doubtful success in previous episodes of privatization, especially when corruption played a role; negative (actual or perceived) distributional consequences; and political economy considerations (see Estrin and Pelletier, 2019, for a discussion). Skepticism of privatization may have been exacerbated by the GFC, which in many respects has called into question the liberal approach championed in the previous two decades and in the case of the financial sector has tarnished the reputation of private bankers in the eyes of voters, reducing governmental and investor appetite for privatization. This may change in the post-pandemic world, when governments around the world will have to find ways to manage the vast amounts of debt accumulated as a result of the fiscal policy responses to the Covid-19 crisis. In this context, privatization programs, including of banks, may receive renewed interest in the next few years.
Given the numerous trade-offs and dependencies surrounding government ownership of banks, it is crucial to optimize the privatization decisions and processes for the policy makers. The evidence from existing empirical studies on bank privatization, although not conclusive, shows that standard metrics used to proxy bank performance typically improve post-privatization.7 This is true especially when the government fully relinquishes control, banks are sold to strategic investors, and bidding is open to all investors, including foreign investors. These findings are consistent with the well-established literature showing the problems associated with government ownership of banks, which introduces several direct and indirect economic distortions (see, for example, Kumar,
5 Choi et al. (2016) document the countercyclical role played by government-owned banks during the GFC. Moreover, Bosshardt and Cerrutti (2020) recently confirm earlier findings and show that during the GFC state-owned banks lent relatively more compared to domestic private counterparts with an objective to stabilize the economy in their sample of 25 emerging markets. 6 See Boubakri and Saffar (2019) on how state ownership affects the debt choices of privatized firms. 7See, for example, Beck et al. (2005a), Beck et al. (2005b), Clarke et al. (2009), and Cull and Spreng (2011) for single-country analysis; or Azam et al. (2004), Boubakri et al. (2005) for cross-country setting.

4
2019, or Bircan and Saka, 2019, on political lending)). Hence, when it comes to banking, ownership does matter and privatization decisions are critical for economic outcomes. It is, however, important to consider that the argument for bank privatization does not mean that there is no residual role for SOCBs, especially in developing economies. In large countries, only SOCBs are likely to be willing to serve customers in remote areas and in chronically underserved segments such as agriculture, though this argument may be losing power as digital technologies increasingly permeate the banking industry. Another argument for the government to keep limited direct ownership of banks is that SOCBs exhibit less procyclical lending behavior than private banks (Bertay et al., 2015), which is crucial especially for small open economies. Being a second-best solution, it would be important to ensure that these banks are subject to the same supervisory requirements as private banks to avoid distortion and monitor accountability.
This paper aims to revive the public policy and academic debate around bank privatization by analyzing the following questions: What are the key trends and drivers in bank privatization in recent years? Does privatization affect banks’ performance and business models? What methods of privatization are prevalent and what maximizes post-privatization performance? Under what institutional, market and regulatory circumstances does privatization lead to stronger bank performance, if any? What are the implications of privatization on banking sector employment and credit provision and composition?
This paper complements the existing empirical literature on bank privatization by using a novel and up-to-date data set, which covers a large set of countries. Specifically, our data set covers 70 countries during 1995-2017 and allows to compare the pre- and post-privatization profile of banks and to analyze the associations between sale events and various bank-level measures such as financial performance, business model, and distributional effects. Stylized facts presented in this paper show that bank privatization did accelerate sharply post-2000, driven primarily by developments in China and India, and remained constant following the GFC. While the number of privatizations increased, the average equity stake at sale per transaction declined and it is no longer the case that the majority of sales involved significant changes in the control of financial institutions. Banks chosen to be privatized exhibited, ceteris paribus, a weaker performance and lower asset quality than market peers prior to the privatization event. Regarding the method of sale, our data show that the majority of privatizations took the form of public equity sales on domestic capital markets.
Furthermore, the empirical results suggest that the short-term associations between banking outcomes and privatization activities may differ from longer-term banking outcomes after large privatization events.8 Simple before- and after-privatization mean comparisons indicate that banks going through large privatizations turn to more traditional banking models characterized by lower non-interest income shares and higher loans over assets ratios. Furthermore, privatized banks reduce their liquidity significantly while they hire more employees. These results can be interpreted as higher post-privatization financial intermediation and even though we do not find significant differences in bank bottom-line profitability (ROA), in our panel regressions we show that credit growth after privatization increases, with some reduction in cost-to-income ratios and not much change in nonperforming loans (NPLs) over loans.
8 We use 30 percent share sales as our large privatization event.
5
Crucially, the paper shows that if the privatized bank received a capital injection before privatization its performance measures improve compared to the earlier period as well as to privatized banks without recapitalization. The results, using sample splits between developing and advanced economy banks, indicate that privatized banks in high-income countries perform better and with lower liquidity and lower costs. Developing country banks, on the other hand, seem to be increasing their credit growth (though still lower than their high-income country counterparts) as well as their number of employees post privatization.
The rest of this paper proceeds as follows. The next section presents the data set and some stylized facts about recent trends in bank privatization around the world. Section 3 presents the empirical analysis that estimates the relation between privatization and bank financial performance, strategy, as well as the distributional implications. Section 4 concludes.
2. Data and stylized facts
Our data set covers 475 privatization events, that is equity sales of SOCBs in 70 advanced and emerging economies over a period ranging from 1995 to 2017.9 In terms of country level of income, two-thirds of the transactions refer to banks in middle-income countries, while the rest is mostly composed of public banks in high-income countries. The data set is compiled by merging information from multiple different data sources. The main source is the World Bank Privatization Database, but given that this database was discontinued in 2008, further bank privatization events were incorporated from additional sources, including the Securities Data Company (SDC) Platinum New Issues database and the Privatization Barometer’s online database on European transactions as well as their annual reports, which included a section on both EU and non-EU privatization trends and major deals. Current commercial bank ownership information was obtained from Fitch Connect. The privatization events were individually examined to exclude non-commercial bank privatizations, and also to incorporate events announced in financial media outlets such as the Financial Times or The Economist. Non-commercial bank sales excluded from our database include development banks (agricultural banks, industrial banks, export-import banks), financial companies associated to other industries (steel, real estate development), securities depositories and asset sales by central banks. Using the information from Igan et al. (2019), we excluded from our data set institutions that had received public financial support during the GFC and later proceeded to offer equity totally or partially to private investors.
Our data set allows us to detect important trends and developments in SOCB privatization, which are presented below as 10 key stylized facts:
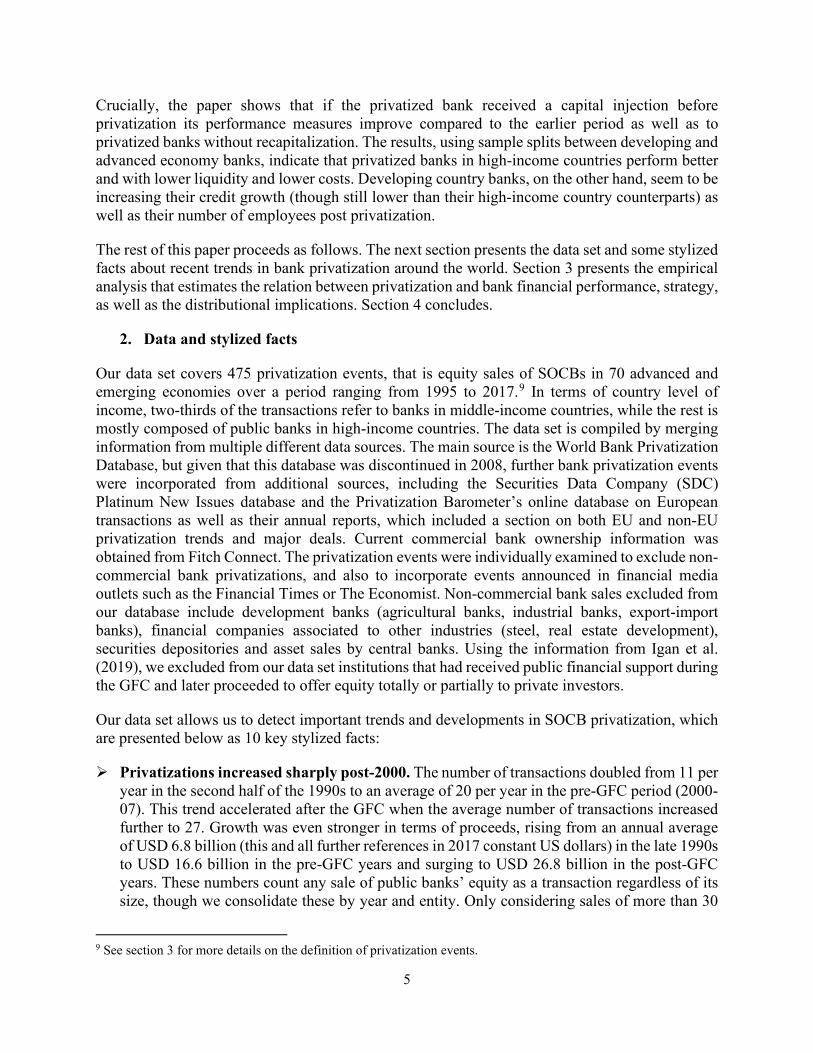
Privatizations increased sharply post-2000. The number of transactions doubled from 11 per year in the second half of the 1990s to an average of 20 per year in the pre-GFC period (2000-07). This trend accelerated after the GFC when the average number of transactions increased further to 27. Growth was even stronger in terms of proceeds, rising from an annual average of USD 6.8 billion (this and all further references in 2017 constant US dollars) in the late 1990s to USD 16.6 billion in the pre-GFC years and surging to USD 26.8 billion in the post-GFC years. These numbers count any sale of public banks’ equity as a transaction regardless of its size, though we consolidate these by year and entity. Only considering sales of more than 30
9 See section 3 for more details on the definition of privatization events.
6
(50) percent of total equity for a better gauge of change in control, also points to a peak in the number of transactions in the pre-GFC period, when these increased from 4 (3) to 7 (4) per year. After the GFC, sales of large shares of equity dropped to 4 (2) per year.
China and India were the driving force behind the rise of privatizations post-2000. China
has changed the privatization landscape since 2005, when it decided to issue shares of its “Big Four” SOCBs, starting with Industrial and Commercial Bank of China (ICBC) and China Construction Bank Corporation (CCB).10 China went from no bank transaction in 1995-99 to an average of two deals per year during 2000-07 worth USD 8.4 billion on average. After the GFC, the number of transactions in China jumped to four per year, with average proceeds of USD 11.9 billion per year. More recently, India has become a global leader in terms of number of deals, registering more privatizations per year than the rest of the world combined during each of the last five years in our sample period. India has gone from two transactions (USD 0.6 billion) per year in 1995-2010, to an average of 17 deals (collecting USD 5.8 billion) per year in 2011-17.
Following years of strong growth, privatizations were recently more limited in other
middle-income countries. Upper-middle income countries excluding China, saw an increase from an average of one deal and USD 1.7 billion in 1995-99 to three transactions (USD 2.4 billion) per year pre-GFC and 2 deals (USD 3.1 billion) post-GFC.11 Over the same period, lower-middle income countries, excluding India, went from two yearly transactions (USD 0.5 billion) in the late 1990s to four transactions (USD 0.8 billion) per year before the crisis and three deals (USD 1 billion) after it. Finally, our data set only registered six transactions with an average of USD 60 million (in 2017 constant US dollars) in low income countries, validating the notion that bank privatizations are not commonplace at that development stage.
Privatizations in high-income countries remained broadly constant despite the wave of bank nationalization in the aftermath of the GFC. Throughout our sample period, privatizations were stable in high income countries with six yearly transactions and proceeds of USD 4.8 billion. This is a remarkable result considering that our post-GFC sample excluded those institutions that had received government support (figures would show an increase in advanced economies if GFC bailed-out banks were included in the sample), though it should also be noted that this process may be coming to an end as 2015-2017 only averaged one yearly transaction for USD 0.3 billion in proceeds.
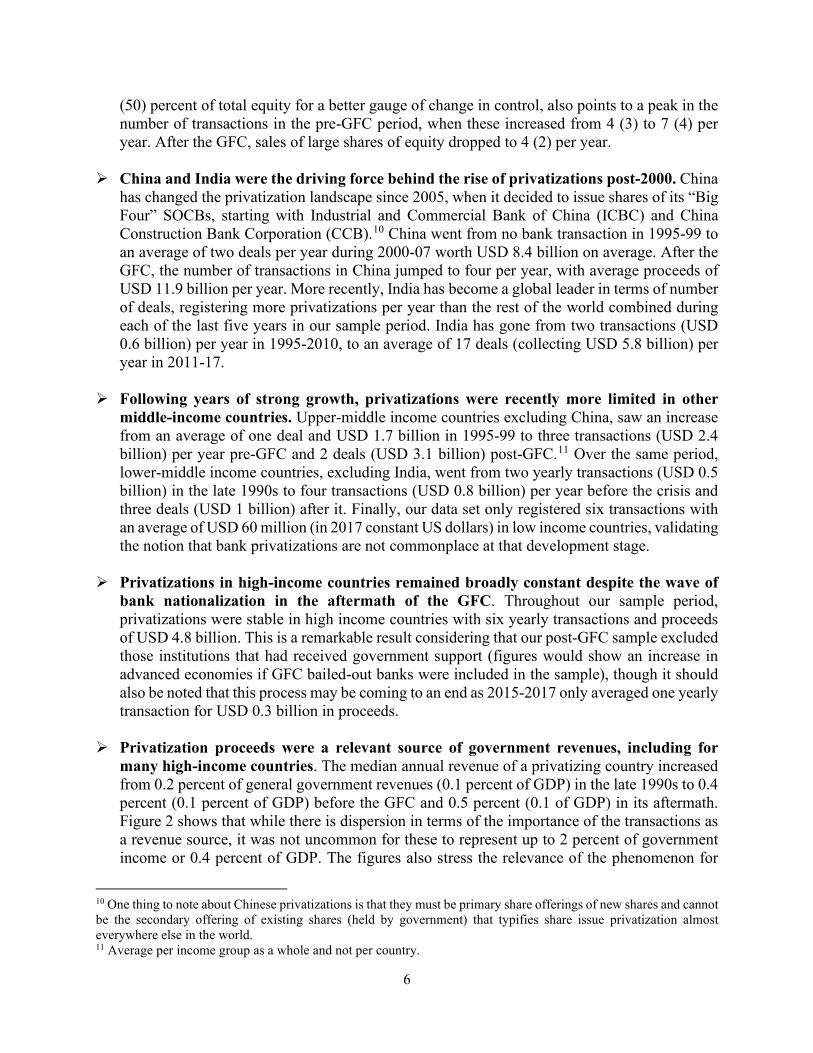
Privatization proceeds were a relevant source of government revenues, including for many high-income countries. The median annual revenue of a privatizing country increased from 0.2 percent of general government revenues (0.1 percent of GDP) in the late 1990s to 0.4 percent (0.1 percent of GDP) before the GFC and 0.5 percent (0.1 of GDP) in its aftermath. Figure 2 shows that while there is dispersion in terms of the importance of the transactions as a revenue source, it was not uncommon for these to represent up to 2 percent of government income or 0.4 percent of GDP. The figures also stress the relevance of the phenomenon for
10 One thing to note about Chinese privatizations is that they must be primary share offerings of new shares and cannot be the secondary offering of existing shares (held by government) that typifies share issue privatization almost everywhere else in the world. 11 Average per income group as a whole and not per country.
7
China and India. For the former, the equity sale of ICBC, CMB and CCB in 2006 represented 5.2 percent of the general government revenues and 0.9 percent of GDP.12 For the latter, the sale of equity of 19 public banks in 2017 provided the government with USD 11.5 billion, which is equivalent to 2.2 percent of revenues and 0.4 percent of GDP.
Figure 1: Bank Privatizations: Number of Transactions and Proceeds
Source: Authors, based on World Bank Privatization Database, Securities Data Company, Privatization Barometer and other sources.
Figures 2. Bank Privatizations: Proceeds as percent of GDP and government revenue
Source: Authors, based on World Bank Privatization Database, Securities Data Company, Privatization Barometer and other sources.
The average equity stake at sale per transaction declined. Using the ratio of privatization
proceeds to total equity book value as a proxy for the share of equity sold in each transaction reveals a large drop in equity stake sold when comparing the pre- and post-GFC periods. While in 2000-07 the median transaction involved the sale of a 21 percent stake of the privatized banks’ equity, that share fell to 12 percent in 2008-17.13 That is, after the GFC it is no longer the case that the majority of sales involve significant changes in the control of the financial institutions. In fact, while it used to be the case that the top quartile of transactions posted sales of 37 percent of equity or more, that ratio fell to less than 20 percent in 2008-17.
12 Industrial and Commercial Bank of China (ICBC), China Merchants Bank (CMB), China Construction Bank (CCB) sold equity stakes for a total of USD 24.8 billion (30.2 billion in constant 2017 USD). 13 Sample sizes are 145 and 174 transactions for the pre- and post-GFC periods, respectively. These subsets exclude transactions with no amount data or with a privatization proceeds to total equity book value ratios exceeding 100 percent.
0
5
10
15
20
25
30
35
40
1995
1996
1997
1998
1999
2000
2001
2002
2003
2004
2005
2006
2007
2008
2009
2010
2011
2012
2013
2014
2015
2016
2017
Privatizations, Income Groups - # Transactions
Low income Lower middle income Upper middle income
High income China India
0
5,000
10,000
15,000
20,000
25,000
30,000
35,000
40,000
45,000
50,000
1995
1996
1997
1998
1999
2000
2001
2002
2003
2004
2005
2006
2007
2008
2009
2010
2011
2012
2013
2014
2015
2016
2017
Privatizations, Income Groups - 2017 USD Million
Low income Lower middle income Upper middle income
High income China India
*Excludes outliers *Excludes outliers

8
The majority of bank privatizations involved governments selling their equity publicly in the domestic capital markets. The overwhelming majority of transactions (92 percent) were channeled through capital markets, with 20 percent of them being IPOs. Moreover, 65 percent of the former were hosted in the domestic markets, while the rest was offered internationally (usually being US or European equity issues). Private sales of banks in our sample primarily occurred in more developed countries: while representing 17.7 percent of the high income country transactions, these fell to 13.3 and 4.9 percent for upper and lower middle income economies, respectively. We have no records of private sales in low income countries, which could point to market characteristics, but also to data collection difficulties.
Banks chosen to be privatized were consistently those showing underperformance in terms of profitability. Both pre- and post-GFC these institutions typically exhibited returns on assets roughly one percentage point below that of their domestic banking sector average. It should be noted though that the distribution became more leptokurtic after the GFC.
Figures 3. Share for Sale, Profitability, Asset Quality and Type of Placement
Source: Authors, based on World Bank Privatization Database, Securities Data Company, Privatization Barometer and other sources.
Banks chosen to be privatized exhibited weaker portfolio quality, but that seemed to
change recently. All 286 transactions for which information is available show that the ratio of NPLs to gross loans was higher for the privatized institutions than for the average of the
9
domestic banking systems. However, the gap seemed to be closing recently with the median difference reducing from 6.7 percent in the pre-GFC to 2.7 in its aftermath, with very few transactions posting double digit differences.
Bank privatization events did not appear to be motivated by domestic banking crises. Only 21 out of 475 transactions coincided with a banking crisis as defined by Laeven and Valencia (2018). In fact, 74 percent of the sample, which excludes sales related to GFC-related bank bailouts, did not undergo a banking crisis in the decade preceding to the equity sale. 3. Empirical analysis
The empirical analysis in this section estimates the relation between privatization and bank financial performance, strategy, as well as the distributional implications. For that purpose, we collect bank-level outcome variables at an annual frequency from Bankscope and Bank Focus Orbis and match them with our sample of SOCB privatization events. The variables chosen to measure bank profitability and efficiency include return on assets (ROA), return on equity (ROE) and cost-to-income ratio. We also analyze the credit provision through credit growth and the ratio of NPLs over loans. Changes in the banks’ strategy are approximated through liquidity, non-interest income and asset composition, while the distributional impacts are assessed by looking at employment (log of number of employees)) and the net interest margin (NIM).
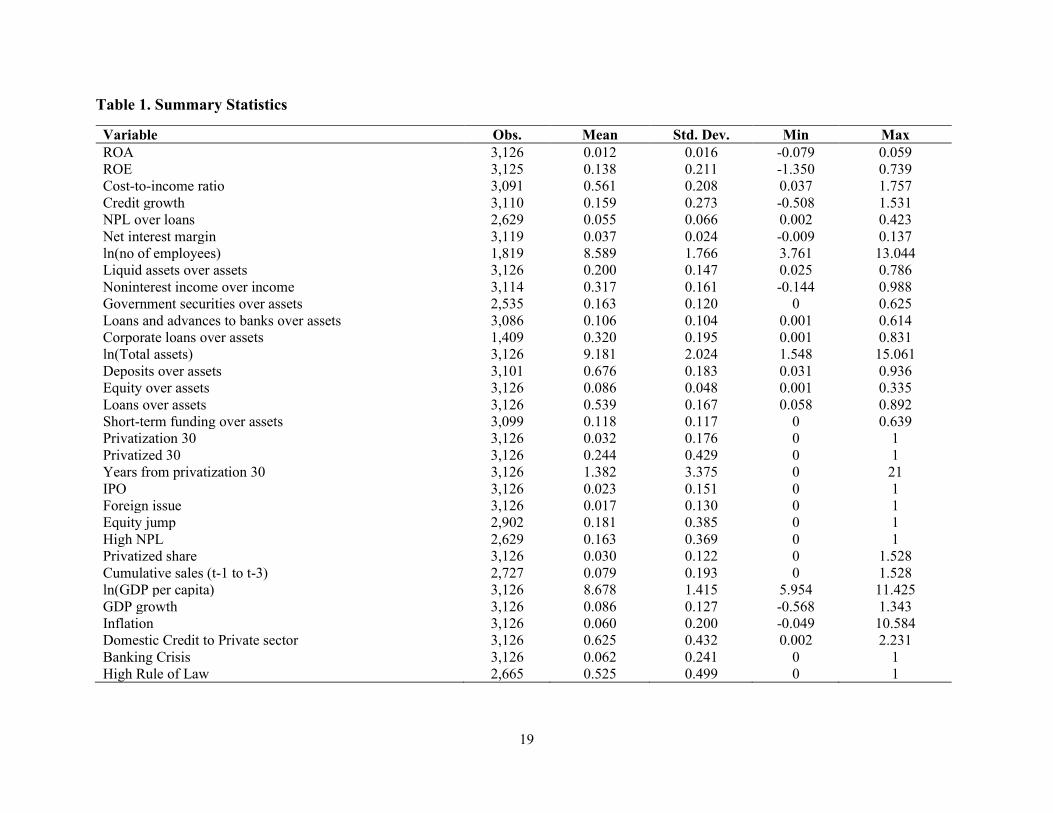
The summary statistics of the variables for our sample are provided in Table 1.14 Note that all bank-level variables are winsorized at 1 percent and 99 percent. Our econometric analysis includes 250 banks from 65 countries for which we could match at least one privatization event with their financials.15 Out of 3,139 bank-year observations from around 240 banks between 1995 and 2017, 420 observations represent privatization events, of which 71 events are IPOs and 47 events are foreign issuances. On average 13.8 percent of shares were sold in these events.16 We use a 30 percent threshold to represent large privatizations and these sales constitutes 23.8 percent of all the events (60 events in developing countries and 40 in high-income countries). We also try to identify whether bank privatizations involved large increases in equity (i.e. more than a 33 percent growth in equity last year) and/or presented high NPL ratios (specifically, higher than 8.7 percent, the 75th percentile of large privatization observations).
3.1. Bi-variate analysis of banks’ pre- and post-privatization performance
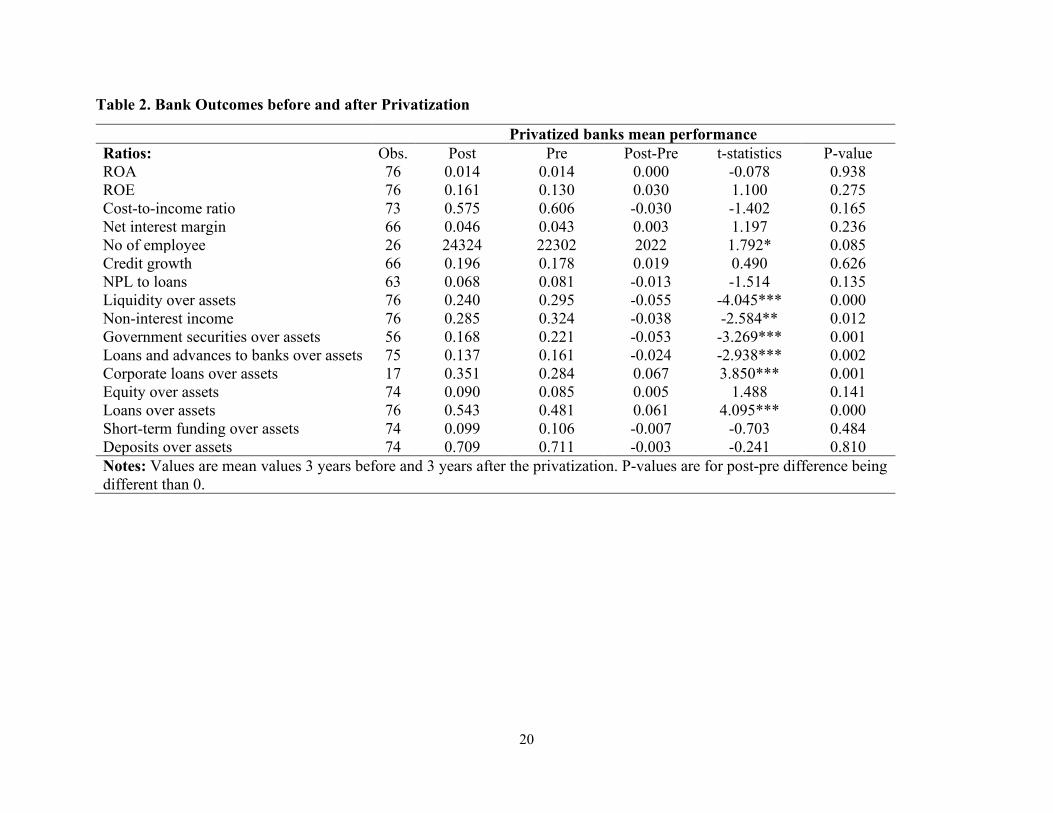
We start the empirical analysis by calculating and comparing bank outcome variables before and after a large privatization event, where the sold amount was at least 30 percent of the book equity (similar to Otchere, 2005). The pre-privatization mean ratios are calculated over the year t-3 to year t-1 period and the post-privatization mean ratios are calculated over the year t+1 to year t+3 period relative to year t=0 (the year of issue).17 Thus, this analysis provides insights into short-term differences in banking outcomes around the privatization events. The t-stat test results regarding the difference post- and pre-privatization are reported in Table 2. Comparing the means
14 The summary statistics are based on the multivariate regression including the bank and country level control variables (regression 3 in Table 3). 15 This is slightly smaller than the 270 observations used in the previous section due to missing bank-level data. 16 The median sale in these events was 22.6 percent. 17 These mean ratios are calculated for banks with at least two observations for each window.
10
suggests that following a large privatization event the number of employees rises and non-interest income and liquidity ratios fall significantly. These initial results suggest that privatized banks increase their traditional financial intermediation by higher credit provision with respect to their assets with more bankers possibly channeling assets from high liquidity assets such as cash balances at the central bank or treasury bills to credit. Indeed, comparing banks’ asset allocation shows that after the privatization holdings of government securities and interbank loans are lower while corporate loans are higher. Such a shift may be desirable as it would have positive real outcomes for the economy as long as the banks will not get into liquidity problems and credit allocation is well done. In contrast, there are no significant differences in pre- and post-privatization outcomes such as bank profitability, efficiency, and funding variables (equity over assets, short-term funding over assets and deposits over assets). These results warrant further econometric analysis to be able to incorporate more sophisticated specifications, where we control for various bank and country characteristics.18
3.2. Multivariate analysis of the relationship between privatization and bank outcomes
In the multivariate empirical analysis, we establish short-term correlations of privatization events as well as longer term relationships between larger sales (i.e. 30 percent or more of shares sold in a privatization) with bank outcomes related to performance, strategy and distributional implications.19 We employ a bank fixed effect panel specification with time fixed effects, where we control for bank- and country-level variables:
𝐵𝐵𝐵𝐵𝐵𝐵𝐵𝐵 𝑜𝑜𝑜𝑜𝑜𝑜𝑜𝑜𝑜𝑜𝑜𝑜𝑜𝑜𝑜𝑜𝑖𝑖,𝑡𝑡 = 𝛼𝛼𝑖𝑖 + 𝜃𝜃𝑡𝑡 + ∑ 𝛽𝛽𝑗𝑗3𝑗𝑗=0 𝑃𝑃𝑃𝑃𝑃𝑃𝑃𝑃𝐵𝐵𝑜𝑜𝑃𝑃𝑃𝑃𝑜𝑜𝑃𝑃 𝑜𝑜ℎ𝐵𝐵𝑃𝑃𝑜𝑜𝑖𝑖,𝑡𝑡−𝑗𝑗 + 𝛾𝛾𝐵𝐵𝐵𝐵𝐵𝐵𝐵𝐵 𝐶𝐶𝑜𝑜𝐵𝐵𝑜𝑜𝑃𝑃𝑜𝑜𝐶𝐶𝑜𝑜𝑖𝑖,𝑡𝑡−1 +
𝛿𝛿𝐶𝐶𝑜𝑜𝑜𝑜𝐵𝐵𝑜𝑜𝑃𝑃𝐶𝐶 𝐶𝐶𝑜𝑜𝐵𝐵𝑜𝑜𝑃𝑃𝑜𝑜𝐶𝐶𝑜𝑜𝑗𝑗,𝑡𝑡 + 𝜀𝜀𝑖𝑖,𝑡𝑡 (1)
This first specification focuses on short-term dynamics during and after the privatization events, where 𝛼𝛼𝑖𝑖 is bank fixed effects and 𝜃𝜃𝑡𝑡 is year fixed effects. The dependent variable 𝐵𝐵𝐵𝐵𝐵𝐵𝐵𝐵 𝑜𝑜𝑜𝑜𝑜𝑜𝑜𝑜𝑜𝑜𝑜𝑜𝑜𝑜𝑜𝑜𝑖𝑖,𝑡𝑡 captures various bank outcomes for bank i in year t. The first variable of interest is a continuous privatization variable, Privatized share, capturing the relative size of the transaction by using the sold amount over the book equity of the bank, which is a reasonable proxy for the fraction of shares sold. 𝑃𝑃𝑃𝑃𝑃𝑃𝑃𝑃𝐵𝐵𝑜𝑜𝑃𝑃𝑃𝑃𝑜𝑜𝑃𝑃 𝑜𝑜ℎ𝐵𝐵𝑃𝑃𝑜𝑜𝑖𝑖,𝑡𝑡−𝑗𝑗 includes the privatized share sales of bank i at year t-j, where j goes up to three to include from the contemporaneous share sale to its third lag. As smaller share sales became more common especially after the GFC, in an alternative specification, we also generate a cumulative share sale measure, 𝐶𝐶𝑜𝑜𝑜𝑜𝑜𝑜𝐶𝐶𝐵𝐵𝑜𝑜𝑃𝑃𝑃𝑃𝑜𝑜 𝑜𝑜𝐵𝐵𝐶𝐶𝑜𝑜𝑜𝑜𝑖𝑖,𝑡𝑡 (t-1 to t-3), capturing total sold amount in the last three years over respective values of book equity. We also include bank-level control variables lagged one year and country-level controls for banks in country j in year t.
18 The documented statistically significant differences seem to be economically significant as well as post-pre differences in absolute terms vary between 9-24 percent of pre-privatization means. 19 In this analysis, we are working on a specific subsample of banks, namely SOCBs, which had at least one government involved share sale in our sample period. Our sample includes banks, which ceased to exist due to mergers or liquidation, limiting survivorship bias. The amount and timing of share sales would be endogenous limiting the causal interpretation of our analysis.
11
In our second specification, we follow Boubakri et al. (2005):
𝐵𝐵𝐵𝐵𝐵𝐵𝐵𝐵 𝑜𝑜𝑜𝑜𝑜𝑜𝑜𝑜𝑜𝑜𝑜𝑜𝑜𝑜𝑜𝑜𝑖𝑖,𝑡𝑡 = 𝛼𝛼𝑖𝑖 + 𝜃𝜃𝑡𝑡 + 𝛽𝛽1𝑃𝑃𝑃𝑃𝑃𝑃𝑃𝑃𝐵𝐵𝑜𝑜𝑃𝑃𝑃𝑃𝐵𝐵𝑜𝑜𝑃𝑃𝑜𝑜𝐵𝐵𝑖𝑖,𝑡𝑡 + 𝛽𝛽2𝑃𝑃𝑃𝑃𝑃𝑃𝑃𝑃𝐵𝐵𝑜𝑜𝑃𝑃𝑃𝑃𝑜𝑜𝑃𝑃𝑖𝑖,𝑡𝑡 +𝛽𝛽3𝑌𝑌𝑜𝑜𝐵𝐵𝑃𝑃𝑜𝑜 𝑓𝑓𝑃𝑃𝑜𝑜𝑜𝑜 𝑃𝑃𝑃𝑃𝑃𝑃𝑃𝑃𝐵𝐵𝑜𝑜𝑃𝑃𝑃𝑃𝐵𝐵𝑜𝑜𝑃𝑃𝑜𝑜𝐵𝐵𝑖𝑖,𝑡𝑡 + 𝛾𝛾𝐵𝐵𝐵𝐵𝐵𝐵𝐵𝐵 𝐶𝐶𝑜𝑜𝐵𝐵𝑜𝑜𝑃𝑃𝑜𝑜𝐶𝐶𝑜𝑜𝑖𝑖,𝑡𝑡−1 + 𝛿𝛿𝐶𝐶𝑜𝑜𝑜𝑜𝐵𝐵𝑜𝑜𝑃𝑃𝐶𝐶 𝐶𝐶𝑜𝑜𝐵𝐵𝑜𝑜𝑃𝑃𝑜𝑜𝐶𝐶𝑜𝑜𝑗𝑗,𝑡𝑡 + 𝜀𝜀𝑖𝑖,𝑡𝑡 (2)
Here we create a post-privatization dummy (𝑃𝑃𝑃𝑃𝑃𝑃𝑃𝑃𝐵𝐵𝑜𝑜𝑃𝑃𝑃𝑃𝑜𝑜𝑃𝑃𝑖𝑖,𝑡𝑡), which takes the value of 1 for each year after the privatization in year t and 0 in all other years, to capture longer term effects together with a timing indicator (i.e., the number of years from the privatization, 𝑌𝑌𝑜𝑜𝐵𝐵𝑃𝑃𝑜𝑜 𝑓𝑓𝑃𝑃𝑜𝑜𝑜𝑜 𝑃𝑃𝑃𝑃𝑃𝑃𝑃𝑃𝐵𝐵𝑜𝑜𝑃𝑃𝑃𝑃𝐵𝐵𝑜𝑜𝑃𝑃𝑜𝑜𝐵𝐵𝑖𝑖,𝑡𝑡) to show whether the relationship changes over time. Finally, we have a privatization event dummy, 𝑃𝑃𝑃𝑃𝑃𝑃𝑃𝑃𝐵𝐵𝑜𝑜𝑃𝑃𝑃𝑃𝐵𝐵𝑜𝑜𝑃𝑃𝑜𝑜𝐵𝐵𝑖𝑖,𝑡𝑡, which takes value of 1 for the year of privatization and 0 otherwise.
We include bank size (log of total assets)), capitalization (equity over assets) and loans over assets as lagged bank-level control variables,20 while log GDP per capita, GDP growth, inflation, financial development (through domestic credit to private sector) and banking crisis dummy are included to control for country-level heterogeneity.21
In Table 3, we focus on bank profitability and efficiency. The first two regressions in Table 3 focus on short-term relations (Equation 1) as they use recent privatized shares between t and t-3 in regression 1 and a cumulative measure summing up the share sales between t-1 and t-3 in regression 2. These measures are not significantly associated with bank ROA suggesting a few years’ time and possibly small share sales are not enough to significantly make a difference for SOCBs. In regressions 3, on the other hand, we focus on larger sales (using the 30 percent share sale as a threshold) having longer term associations via a dummy variable capturing the period after the privatization. This specification also includes a variable for the years from the privatization allowing for decaying (or growing) relationships between privatization event and various banking outcomes over time. Finally, this specification also includes a privatization dummy taking value 1 for the event year and an IPO dummy capturing association between method of privatization and immediate banking outcomes (Equation 2). This specification with a longer-term perspective also could not capture a significant difference in ROA for banks going through large privatization events. Nevertheless, the IPO dummy is positive and significant signaling that banks going through large privatization through IPOs have higher ROA in the event year. When we analyze ROE, in regressions 4-6, we find a positive relationship between privatization and bank ROE both in the short-term and long-term, although they are only marginally significant at 10 percent. For example, the positive and significant coefficient of 𝑃𝑃𝑃𝑃𝑃𝑃𝑃𝑃𝐵𝐵𝑜𝑜𝑃𝑃𝑃𝑃𝑜𝑜𝑃𝑃𝑖𝑖,𝑡𝑡 indicates that on average ROE of banks which are privatized by at least a 30 percent share sale is 4.8 percentage points higher for the period after the privatization event. This is an economically large increase given the mean value of ROE (13.8 percent). In regression 5, the coefficient on cumulative sales is 0.038, implying that if 100 percent of the shares had been sold in the last three years the ROE would be 3.8 percentage points higher. In our sample the standard deviation of cumulative sales is 0.193, so one standard deviation increase in cumulative sales would be associated with a 0.7 percentage point (=0.193*0.038) increase in ROE. Finally, regressions 7-9 in Table 3 suggest that there are no statistically significant short-term differences in cost-to-income ratios a few years
20 We control for lagged ROA in the specifications except where the dependent variable was ROA, ROE or NIM. 21 All bank-level variables come from the Bankscope (1995-2014) and Bank Focus Orbis (2015-2017) databases and all macro variables come from the Global Financial Development Database.
12
after privatization events (privatized shares and cumulative shares are insignificant), but after large privatizations cost-to-income ratios decrease by 0.6 percentage points a year. For example, 5 years after privatization, privatized banks will on average have around 3 percentage points lower cost-to-income ratios.
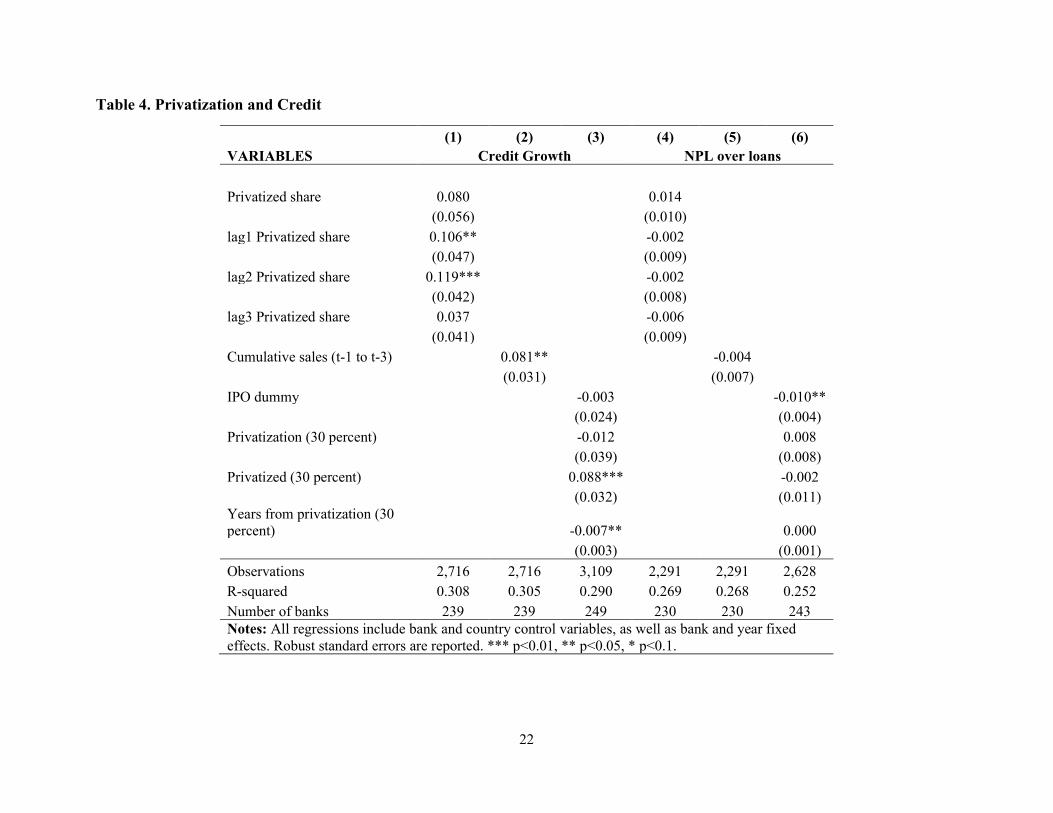
When we turn our attention to credit provision after large privatizations, in regressions 1 to 3 of Table 4, both short-term privatized shares and longer term large post-privatization dummies indicate higher credit growth after privatization. For example, post-privatization credit growth was 8.8 percentage points higher during the years after privatization, which is more than half of the mean credit growth of our sample, which was 15.9 percent. However, the years from privatization variable being negative and significant implies this positive relationship gets lower over time. Higher credit provision may be desirable as it may lead to higher financial development and possibly to economic growth, conditional upon credit being provided without increasing the risk or related costs. Indeed, in regressions 4 to 6 of Table 4, we show that large privatization events were not followed by any significant changes in NPL ratios.
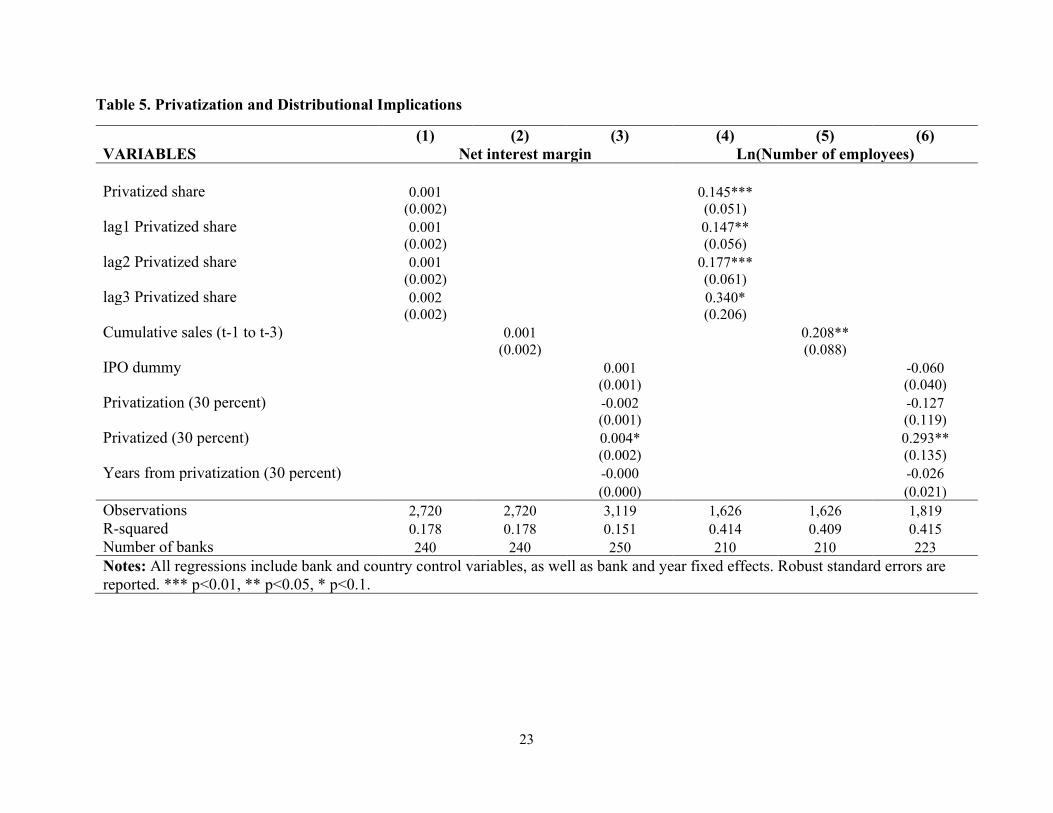
In Table 5, we analyze possible distributional implications of bank privatizations through net interest margins and banks’ employment. The NIM is a traditional measure of bank intermediation efficiency, indicating whether banks are earning some margin over their cost of funding, but also how expensive is the funding for the firms and households getting loans from the banks. Here it is mainly used to analyze whether a privatization event is followed by an increase in the price of credit. In regressions 1-3, we only find a marginally significant positive change in the NIM of privatized banks after large share sales compared to earlier periods (around 0.4 percentage points, which is less than 10 percent of the mean NIM). An additional distributional concern is whether a privatization leads to a reduction in the number of bank employees. Quite surprisingly, in regressions 4-6 of Table 5, we show that both in the short-term (regressions 4 and 5) and the long-term (positive and significant coefficient of Privatized (30 percent) in regression 6) banks hire more people after the privatization event.
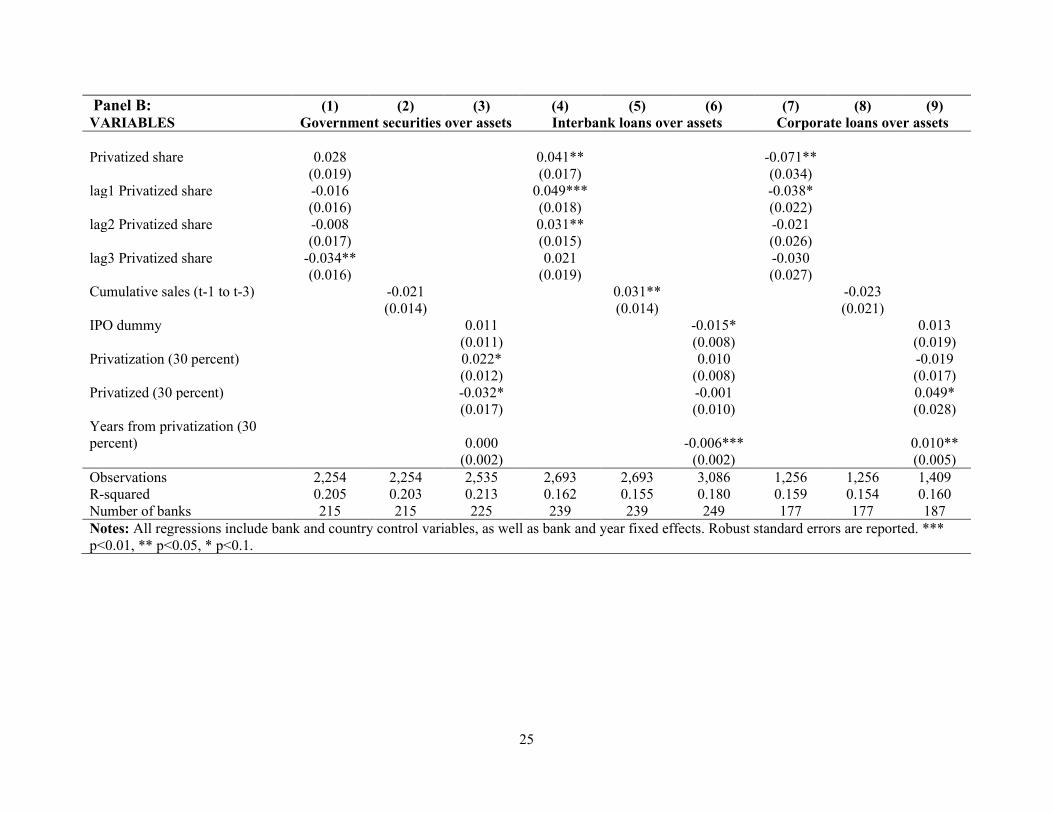
Next, we relate the privatization events to banks’ strategy in terms of liquidity management, income generation and asset composition. In Panel A of Table 6, we analyze how privatization events are related to liquidity management and non-interest income generation by banks. The results indicate slightly higher liquidity right after the privatization (possibly caused by liquidity injections by the new owner) but as time passes the liquidity gets lower (as the coefficient of years from privatization is negative and significant implying a minus 0.7 percentage point change in liquidity every year after the privatization event). The privatized banks also adopt a more traditional business model in the short-term as their share of income from non-interest income activities decreases. But in time the non-interest income share seems to increase as the years from privatization in regression 6 is positive though only marginally significant. In Panel B, we focus on the asset side of the privatized banks and analyze where they allocate capital (i.e. government securities, loans and advances to banks, or corporate loans). The results suggest that in the long-term after large privatization events banks tend to have lower government securities and higher corporate loans, which gets even higher over time. Interbank loans, on the other hand, are higher right after privatization sales but decrease over time after large privatization events.
3.3 Testing for privatization modalities, institutional and market features
13
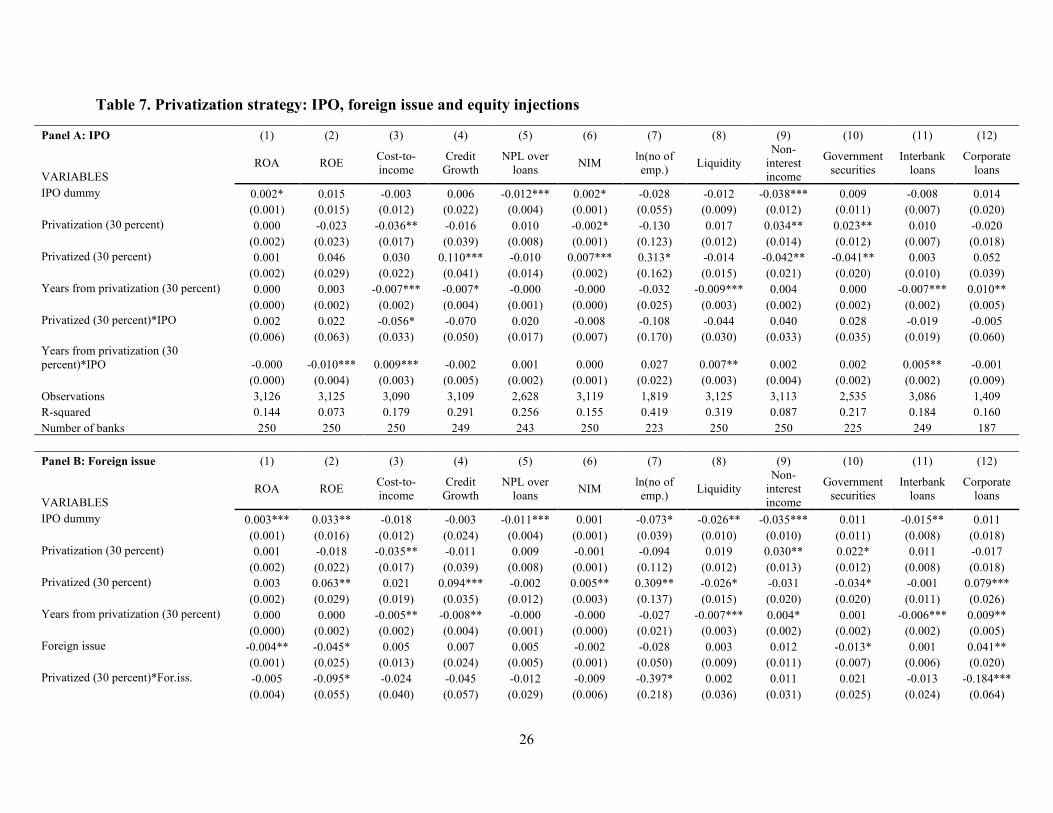
In this section we analyze the longer-term relationship between banking outcomes and the method of and preparation period for large privatizations. Specifically, we analyze if banks after large privatizations accomplished through IPOs or foreign placements (e.g. offering the shares in another country’s market) behave differently. Another aspect we cover is whether large increases in equity just before the sale (which we interpret as capital injections or large retained earnings) change the impact of privatizations on bank outcomes. In Table 7, Panel A, the main difference in IPO privatizations comes as lower cost-to-income ratios for these banks and much lower reduction in liquidity and interbank loans as time passes compared to non-IPO privatizations. In Panel B, we analyze foreign privatization issues and find that foreign placements suffer from lower post-privatization ROE, higher NPL ratios and NIM over time but also decreases in number of employees and corporate loans over assets though these reductions disappear over time. These findings indicate that foreign issues in large privatizations are related to worse banking outcomes (lower profitability) and possible negative distributional implications (higher NIM and lower employment compounding a lower share of corporate loans in these banks).
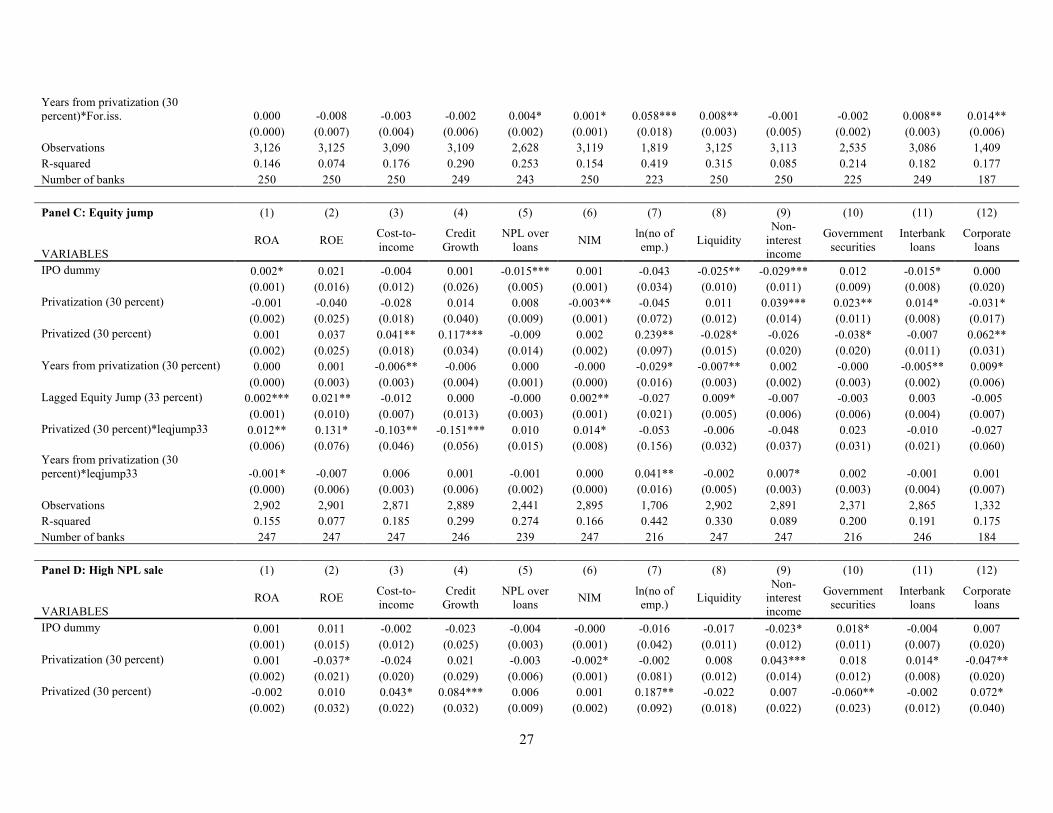
In Table 7, Panel C, we focus on “equity jumps” and how banks going through large privatizations accompanied with such increases in equity behave afterwards. The results suggest that privatized banks with equity jumps (which we define as a 33 percent increase in equity a year before privatization) enjoy better financial performance (higher ROA and ROE, and cost-to-income ratio) compared to the earlier period as well as to the privatized banks without possible recapitalization. They also have lower credit growth (-3.4 percent = 0.117-0.151), even though they are still increasing their number of employees over time. Finally, in Panel D, we also consider the possibility that the banks may have high NPL ratios when they were privatized. To capture this possibility, we create a “high NPL” dummy variable, which equals 1 if the NPL ratio is higher than 8.7 percent (i.e., 75th percentile of large privatization observations). The results suggest that the employment gains for the banks, which had large privatization sales when they had higher NPL ratios, is lost in time as they decrease the number of employees as time passes. These banks also seem to hold higher government securities and have lower non-interest income shares after privatization. Even though these banks have higher liquidity and interbank loan shares after the event, both go down as time passes after the privatization.22
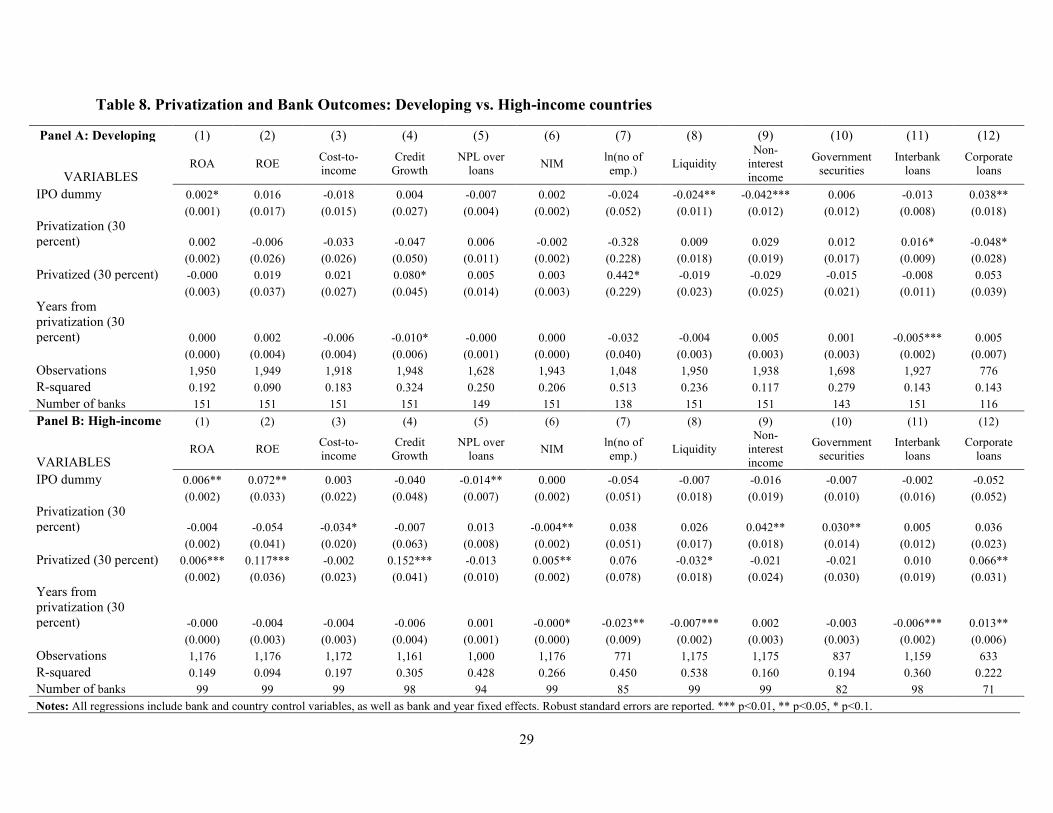
Finally, in Tables 8 and 9 we focus on differences between developing vs. high-income countries and the role of the rule of law and financial development, respectively. In Table 8, using sample splits between developing and high-income country banks, we show that in high-income countries privatized banks have higher profitability and with lower liquidity and higher credit growth accompanied by a higher share of corporate loans. Privatized banks in high-income countries also have higher NIMs and reductions in number of employees over time. Developing country banks, on the other hand, show an increase in their credit growth (though still lower than their high-income country counterparts) as well as their number of employees.
In contrast, in Panel A of Table 9 we find a notable difference in NPL over loans between large privatizations in high rule of law countries (WGI Rule of Law index higher than 0) and others. In regression 6, the interaction between the Privatized dummy and High Rule of Law is negative and statistically significant at 5 percent, suggesting that after large privatizations in high rule of law
22 We did not include a triple interaction term with equity jumps and high NPL dummy as there are only 4 such cases.
14
countries NPL ratios are 2.3 percentage points lower compared to the pre-privatization ratios. Note that this is a reduction of around 42 percent of mean NPL ratio and thus is economically significant. Furthermore, the increase in number of employees after the privatization is subdued over time in high rule of law countries and these banks from high rule of law countries hold even less liquidity after privatization. Finally, in Panel B of Table 9, we focus on the financial development at the time of privatization and how it is related to privatization and various banking outcomes.
The results indicate that the post-privatization decrease in cost-to-income ratios and liquidity ratios over time is lower when the privatization occurs in a financially more developed country. Moreover, the banks which went through privatization in highly financially developed countries reduce their non-interest income generation much less and may even increase it over time, especially if the country has very high domestic credit to GDP (more than 100 percent). The results also suggest that the portfolio shift from interbank loans to corporate loans is mostly happening in lower financial development environments. Taken all together these results suggest that privatization offers significant benefits in lower financial development environments as well as implications for the optimal strategies of the privatizing banks.
4. Conclusions
Building on a novel data set comprising 475 bank privatization events in 70 countries in emerging and advanced economies during the period from 1995 to 2017, this paper attempts to shed some light on recent privatization events and analyzes the relationship between privatization and banking outcomes. The first part of the paper offers some stylized facts. We find that bank privatizations increased sharply post-2000 and that China and India were the driving force behind the rise of privatizations post-2000. Following years of strong growth, privatization activity was more limited recently in other middle-income countries while privatizations in high-income countries remained broadly constant despite the wave of bank nationalizations in the aftermath of the GFC. Privatization proceeds were a relevant source of government revenues, including for many high-income countries. We also find that the average equity stake at sale per transaction declined over time and that the majority of bank privatizations involved governments selling their equity publicly in their domestic capital markets. Banks chosen to be privatized were consistently those showing underperformance in terms of profitability and quality of assets. Finally, we could not find evidence that bank privatization events were motivated by domestic banking crises.
The empirical part of the paper complements the existing empirical literature. The results suggest that post-privatization financial intermediation becomes more oriented toward corporate credit provision, a result driven by high income countries. Even though on average there are no significant post-privatization differences in bank bottom-line profitability (ROA), credit growth after privatization increases with some reduction in cost-to-income ratios and share of government securities over assets, while corporate loan share increases without significant change in NPL over loans. Moreover, privatizations associated with pre-privatization capital injection are associated with improved post-privatization bank performance. Finally, the results indicate that in high-income countries privatized banks perform better and with lower liquidity and lower costs. Privatized banks in developing countries, on the other hand, seem to be increasing their credit growth (albeit to still lower levels than their high-income country counterparts) as well as their number of employees post privatization.
15
From a policy making perspective, the novel evidence provided by this paper on the outcomes of commercial bank privatization, including for the government coffers, does not easily translate into prescriptive policy recommendations. Bank privatization is a complex undertaking with several potential ramifications, including for financial stability. Moreover, such an option would need to be carefully weighed against the existence of market failures that may lead to suboptimal allocation of credit by private lenders. Our hope is that this paper may reignite interest in bank privatization and stimulate further research. One extension of our work would be, for example, to analyze bank privatization outcomes relative to non-privatized banks and to private banks. This may be especially relevant in the post-pandemic world, where governments around the world will have to devise exit strategies from bailout programs and other emergency measures while bringing public debt to a sustainable path. In this context, privatization of state-owned assets, including of state-owned banks, might well be back on the policy agenda.
16
References
Andrews, M. M. (2005). State-Owned Banks, Stability, Privatization, and Growth: Practical Policy Decisions in a World Without Empirical Proof . International Monetary Fund Working Paper No 5/10.
Andrianova, S., Demetriades, P., & Shortland, A. (2012). Government ownership of banks, institutions and economic growth. Economica, 79(315), 449-469.
Azam, J.-P., B. Biais, & M. Dia. (2004). Privatization versus Regulation in Developing Economies: The Case of West African Banks. Journal of African Economies 13 (3): 361–94.
Beck, T., J. M. Crivelli, & W. Summerhill. (2005a). State Bank Transformation in Brazil - Choices and Consequences. Journal of Banking and Finance 29 (8-9): 2223–57.
Beck, T., R. Cull, & A. Jerome. (2005b). Bank Privatization and Performance: Empirical Evidence from Nigeria. Journal of Banking and Finance 29 (8-9): 2355–79.
Bertay, A. C., Demirgüç-Kunt, A., & Huizinga, H. (2015). Bank ownership and credit over the business cycle: Is lending by state banks less procyclical?. Journal of Banking and Finance 50, 326-339.
Bircan, Ç., & Saka, O. (2019). Lending Cycles and Real Outcomes: Costs of Political Misalignment, EBRD Working Paper No. 225.
Bosshardt, J., & Cerutti, E. M. (2020). Why Did Public Banks Lend More During the Global Financial Crisis?. International Monetary Fund Working Paper No. 20/84.
Boubakri, N., Cosset, J. C., Fischer, K., & Guedhami, O. (2005). Privatization and bank performance in developing countries. Journal of Banking & Finance, 29(8-9), 2015-2041.
Boubakri, N., & Saffar, W. (2019). State ownership and debt choice: Evidence from privatization. Journal of Financial and Quantitative Analysis, 54(3), 1313-1346.
Brown, J. D., & Earle, J. S. (2017). Finance and growth at the firm level: evidence from SBA loans. The Journal of Finance, 72(3), 1039-1080.
Choi, M. J., Gutierrez, E., & Martinez Peria, M. S. (2016). Dissecting foreign bank lending behavior during the 2008–2009 crisis. Financial Markets, Institutions & Instruments, 25(5), 361-398.
Clarke, G., R. Cull, and M. Fuchs. (2009). Bank Privatization in Sub-Saharan Africa: The Case of Uganda Commercial Bank. World Development 37 (9): 1506–21.
Cull, R., Peria, M. S. M., & Verrier, J. (2018). Bank ownership: Trends and implications. The World Bank.
Cull, R., & Spreng, C. (2011). Pursuing Efficiency While Maintaining Outreach: Bank Privatization in Tanzania. Journal of Development Economics 94 (2): 254–61.

17
Demirgüç-Kunt, A. (2012). Finance and economic development: The role of government. The Oxford Handbook of Banking, 1st ed., edited by Berger, Molyneux and Wilson.
Dinç, I. S. (2005). Politicians and banks: Political influences on government-owned banks in emerging markets. Journal of Financial Economics, 77(2), 453-479.
Englmaier, F., & Stowasser, T. (2017). Electoral cycles in savings bank lending. Journal of the European Economic Association, 15(2), 296-354.
Estrin, S., & Pelletier, A. (2018). Privatization in developing countries: what are the lessons of recent experience? The World Bank Research Observer, 33(1), 65-102.
Gupta, P., Kochhar, K., & Panth, S. (2015). Bank ownership and the effects of financial liberalization: evidence from India. Indian Growth and Development Review.
Iannotta, G., Nocera, G., & Sironi, A. (2007). Ownership structure, risk and performance in the European banking industry. Journal of banking & finance, 31(7), 2127-2149.
Igan, M. D. O., Moussawi, H., Tieman, A. F., Zdzienicka, M. A., Dell'Ariccia, M. G., & Mauro, M. P. (2019). The long shadow of the global financial crisis: public interventions in the financial sector. International Monetary Fund Working Paper No. 19/164.
Kumar, N. (2019). Political interference and crowding out in bank lending. Journal of Financial Intermediation, 100815.
La Porta, R., Lopez‐de‐Silanes, F., & Shleifer, A. (2002). Government ownership of banks. The Journal of Finance, 57(1), 265-301.
Laeven, M. L., & Valencia, M. F. (2018). Systemic banking crises revisited. International Monetary Fund Working Paper No. 18/206.
Levine, R. (2005). Finance and growth: theory and evidence. In Handbook of Economic Growth, 1, 865-934.
Levine, O., & Warusawitharana, M. (2019). Finance and productivity growth: Firm-level evidence. Journal of Monetary Economics.
Megginson, W. L. (2005). The economics of bank privatization. Journal of Banking & Finance, 29(8-9), 1931-1980.
Megginson, W. L. (2017). Privatization, state capitalism, and state ownership of business in the 21st century. Foundations and Trends in Finance, 11(1-2).
Mian, A. (2003). Foreign, private domestic, and government banks: New evidence from emerging markets. Working Paper, mimeo, University of Chicago.
Micco, A., Panizza, U., & Yanez, M. (2007). Bank ownership and performance. Does politics matter?. Journal of Banking & Finance, 31(1), 219-241.
18
Otchere, I. (2005). Do privatized banks in middle-and low-income countries perform better than rival banks? An intra-industry analysis of bank privatization. Journal of Banking & Finance, 29(8-9), 2067-2093.
Popov, A. (2018). Evidence on finance and economic growth. In Handbook of Finance and Development. Edward Elgar Publishing.
Sapienza, P. (2003). The effects of government ownership on bank lending. Journal of Financial Economics 72, 357-384.
Shen, C. H., Hasan, I., & Lin, C. Y. (2014). The government’s role in government-owned banks. Journal of Financial Services Research, 45(3), 307-340.
World Bank. (2012). Global Financial Development Report 2013: Rethinking the Role of the State in Finance. Washington, DC: World Bank.
19
Table 1. Summary Statistics
Variable Obs. Mean Std. Dev. Min Max ROA 3,126 0.012 0.016 -0.079 0.059 ROE 3,125 0.138 0.211 -1.350 0.739 Cost-to-income ratio 3,091 0.561 0.208 0.037 1.757 Credit growth 3,110 0.159 0.273 -0.508 1.531 NPL over loans 2,629 0.055 0.066 0.002 0.423 Net interest margin 3,119 0.037 0.024 -0.009 0.137 ln(no of employees) 1,819 8.589 1.766 3.761 13.044 Liquid assets over assets 3,126 0.200 0.147 0.025 0.786 Noninterest income over income 3,114 0.317 0.161 -0.144 0.988 Government securities over assets 2,535 0.163 0.120 0 0.625 Loans and advances to banks over assets 3,086 0.106 0.104 0.001 0.614 Corporate loans over assets 1,409 0.320 0.195 0.001 0.831 ln(Total assets) 3,126 9.181 2.024 1.548 15.061 Deposits over assets 3,101 0.676 0.183 0.031 0.936 Equity over assets 3,126 0.086 0.048 0.001 0.335 Loans over assets 3,126 0.539 0.167 0.058 0.892 Short-term funding over assets 3,099 0.118 0.117 0 0.639 Privatization 30 3,126 0.032 0.176 0 1 Privatized 30 3,126 0.244 0.429 0 1 Years from privatization 30 3,126 1.382 3.375 0 21 IPO 3,126 0.023 0.151 0 1 Foreign issue 3,126 0.017 0.130 0 1 Equity jump 2,902 0.181 0.385 0 1 High NPL 2,629 0.163 0.369 0 1 Privatized share 3,126 0.030 0.122 0 1.528 Cumulative sales (t-1 to t-3) 2,727 0.079 0.193 0 1.528 ln(GDP per capita) 3,126 8.678 1.415 5.954 11.425 GDP growth 3,126 0.086 0.127 -0.568 1.343 Inflation 3,126 0.060 0.200 -0.049 10.584 Domestic Credit to Private sector 3,126 0.625 0.432 0.002 2.231 Banking Crisis 3,126 0.062 0.241 0 1 High Rule of Law 2,665 0.525 0.499 0 1
20
Table 2. Bank Outcomes before and after Privatization
Privatized banks mean performance Ratios: Obs. Post Pre Post-Pre t-statistics P-value ROA 76 0.014 0.014 0.000 -0.078 0.938 ROE 76 0.161 0.130 0.030 1.100 0.275 Cost-to-income ratio 73 0.575 0.606 -0.030 -1.402 0.165 Net interest margin 66 0.046 0.043 0.003 1.197 0.236 No of employee 26 24324 22302 2022 1.792* 0.085 Credit growth 66 0.196 0.178 0.019 0.490 0.626 NPL to loans 63 0.068 0.081 -0.013 -1.514 0.135 Liquidity over assets 76 0.240 0.295 -0.055 -4.045*** 0.000 Non-interest income 76 0.285 0.324 -0.038 -2.584** 0.012 Government securities over assets 56 0.168 0.221 -0.053 -3.269*** 0.001 Loans and advances to banks over assets 75 0.137 0.161 -0.024 -2.938*** 0.002 Corporate loans over assets 17 0.351 0.284 0.067 3.850*** 0.001 Equity over assets 74 0.090 0.085 0.005 1.488 0.141 Loans over assets 76 0.543 0.481 0.061 4.095*** 0.000 Short-term funding over assets 74 0.099 0.106 -0.007 -0.703 0.484 Deposits over assets 74 0.709 0.711 -0.003 -0.241 0.810 Notes: Values are mean values 3 years before and 3 years after the privatization. P-values are for post-pre difference being different than 0.

21
Table 3. Privatization and Bank Profitability and Efficiency
(1) (2) (3) (4) (5) (6) (7) (8) (9) VARIABLES Return on Assets Return on Equity Cost-to-income ratio Privatized share 0.001 0.023 -0.040
(0.002) (0.038) (0.034) lag1 Privatized share 0.002 0.071** 0.009
(0.002) (0.028) (0.029) lag2 Privatized share -0.002 0.034 0.024
(0.002) (0.030) (0.019) lag3 Privatized share 0.000 0.015 0.012
(0.002) (0.024) (0.018) Cumulative sales (t-1 to t-3) -0.000 0.038* 0.018
(0.002) (0.021) (0.017) IPO dummy 0.003*** 0.027* -0.023*
(0.001) (0.016) (0.013) Privatization (30 percent) 0.000 -0.022 -0.038**
(0.002) (0.023) (0.017) Privatized (30 percent) 0.002 0.048* 0.012
(0.002) (0.027) (0.021) Years from privatization (30 percent) 0.000 0.000 -0.006**
(0.000) (0.002) (0.002) ln(Total assets) -0.000 -0.001 -0.002 -0.007 -0.007 -0.023 -0.037* -0.037* -0.031*
(0.002) (0.002) (0.002) (0.015) (0.015) (0.015) (0.020) (0.020) (0.017) Equity over assets 0.082*** 0.082*** 0.060*** -0.260 -0.257 -0.380** -0.522*** -0.512*** -0.577***
(0.019) (0.019) (0.017) (0.167) (0.169) (0.150) (0.185) (0.184) (0.206) Loans over assets -0.005 -0.006 -0.011** 0.062 0.058 -0.030 -0.293*** -0.289*** -0.205***
(0.005) (0.005) (0.004) (0.049) (0.049) (0.042) (0.063) (0.063) (0.054) ln(GDP per capita) -0.008* -0.008* -0.005 -0.166*** -0.163*** -0.099** -0.013 -0.017 -0.037
(0.005) (0.005) (0.004) (0.052) (0.053) (0.048) (0.051) (0.051) (0.051) GDP growth 0.018*** 0.018*** 0.017*** -0.066 -0.067 -0.025 -0.018 -0.020 -0.019
(0.005) (0.005) (0.005) (0.054) (0.054) (0.052) (0.030) (0.030) (0.029) Inflation 0.001 0.001 0.001 0.072*** 0.072*** 0.068*** -0.041 -0.037 0.031
(0.003) (0.003) (0.003) (0.023) (0.023) (0.017) (0.112) (0.111) (0.107) Domestic Credit to Private sector -0.001 -0.001 0.003 0.044 0.045 0.110** -0.046 -0.046 -0.060
(0.004) (0.004) (0.004) (0.054) (0.054) (0.054) (0.064) (0.064) (0.054) Banking Crisis -0.009*** -0.009*** -0.010*** -0.069** -0.067** -0.090*** 0.069** 0.068** 0.056**
(0.002) (0.002) (0.002) (0.029) (0.029) (0.029) (0.030) (0.029) (0.028) Observations 2,727 2,727 3,126 2,726 2,726 3,125 2,700 2,700 3,091 R-squared 0.144 0.144 0.144 0.068 0.068 0.070 0.147 0.145 0.130 Number of banks 240 240 250 240 240 250 240 240 250 Notes: All regressions include bank and year fixed effects. Robust standard errors are reported. *** p<0.01, ** p<0.05, * p<0.1.
22
Table 4. Privatization and Credit
(1) (2) (3) (4) (5) (6) VARIABLES Credit Growth NPL over loans Privatized share 0.080 0.014
(0.056) (0.010) lag1 Privatized share 0.106** -0.002
(0.047) (0.009) lag2 Privatized share 0.119*** -0.002
(0.042) (0.008) lag3 Privatized share 0.037 -0.006
(0.041) (0.009) Cumulative sales (t-1 to t-3) 0.081** -0.004
(0.031) (0.007) IPO dummy -0.003 -0.010**
(0.024) (0.004) Privatization (30 percent) -0.012 0.008
(0.039) (0.008) Privatized (30 percent) 0.088*** -0.002
(0.032) (0.011) Years from privatization (30 percent) -0.007** 0.000 (0.003) (0.001) Observations 2,716 2,716 3,109 2,291 2,291 2,628 R-squared 0.308 0.305 0.290 0.269 0.268 0.252 Number of banks 239 239 249 230 230 243 Notes: All regressions include bank and country control variables, as well as bank and year fixed effects. Robust standard errors are reported. *** p<0.01, ** p<0.05, * p<0.1.
23
Table 5. Privatization and Distributional Implications
(1) (2) (3) (4) (5) (6) VARIABLES Net interest margin Ln(Number of employees) Privatized share 0.001 0.145***
(0.002) (0.051) lag1 Privatized share 0.001 0.147**
(0.002) (0.056) lag2 Privatized share 0.001 0.177***
(0.002) (0.061) lag3 Privatized share 0.002 0.340*
(0.002) (0.206) Cumulative sales (t-1 to t-3) 0.001 0.208**
(0.002) (0.088) IPO dummy 0.001 -0.060
(0.001) (0.040) Privatization (30 percent) -0.002 -0.127
(0.001) (0.119) Privatized (30 percent) 0.004* 0.293**
(0.002) (0.135) Years from privatization (30 percent) -0.000 -0.026 (0.000) (0.021) Observations 2,720 2,720 3,119 1,626 1,626 1,819 R-squared 0.178 0.178 0.151 0.414 0.409 0.415 Number of banks 240 240 250 210 210 223 Notes: All regressions include bank and country control variables, as well as bank and year fixed effects. Robust standard errors are reported. *** p<0.01, ** p<0.05, * p<0.1.

24
Table 6. Privatization and Strategy
Panel A: (1) (2) (3) (4) (5) (6) VARIABLES Liquidity over assets Non-interest income Privatized share 0.043* -0.002
(0.023) (0.018) lag1 Privatized share 0.040 -0.016
(0.025) (0.022) lag2 Privatized share 0.040* -0.049***
(0.023) (0.017) lag3 Privatized share 0.010 -0.037**
(0.021) (0.017) Cumulative sales (t-1 to t-3) 0.027 -0.034**
(0.018) (0.014) IPO dummy -0.025** -0.034***
(0.010) (0.010) Privatization (30 percent) 0.017 0.032**
(0.012) (0.013) Privatized (30 percent) -0.024 -0.029
(0.015) (0.018) Years from privatization (30 percent) -0.007*** 0.004* (0.002) (0.002) Observations 2,727 2,727 3,125 2,716 2,716 3,113 R-squared 0.295 0.291 0.313 0.093 0.092 0.085 Number of banks 240 240 250 240 240 250 Notes: All regressions include bank and country control variables, as well as bank and year fixed effects. Robust standard errors are reported. *** p<0.01, ** p<0.05, * p<0.1.
25
Panel B: (1) (2) (3) (4) (5) (6) (7) (8) (9) VARIABLES Government securities over assets Interbank loans over assets Corporate loans over assets Privatized share 0.028 0.041** -0.071**
(0.019) (0.017) (0.034) lag1 Privatized share -0.016 0.049*** -0.038*
(0.016) (0.018) (0.022) lag2 Privatized share -0.008 0.031** -0.021
(0.017) (0.015) (0.026) lag3 Privatized share -0.034** 0.021 -0.030
(0.016) (0.019) (0.027) Cumulative sales (t-1 to t-3) -0.021 0.031** -0.023
(0.014) (0.014) (0.021) IPO dummy 0.011 -0.015* 0.013
(0.011) (0.008) (0.019) Privatization (30 percent) 0.022* 0.010 -0.019
(0.012) (0.008) (0.017) Privatized (30 percent) -0.032* -0.001 0.049*
(0.017) (0.010) (0.028) Years from privatization (30 percent) 0.000 -0.006*** 0.010** (0.002) (0.002) (0.005) Observations 2,254 2,254 2,535 2,693 2,693 3,086 1,256 1,256 1,409 R-squared 0.205 0.203 0.213 0.162 0.155 0.180 0.159 0.154 0.160 Number of banks 215 215 225 239 239 249 177 177 187 Notes: All regressions include bank and country control variables, as well as bank and year fixed effects. Robust standard errors are reported. *** p<0.01, ** p<0.05, * p<0.1.
26
Table 7. Privatization strategy: IPO, foreign issue and equity injections
Panel A: IPO (1) (2) (3) (4) (5) (6) (7) (8) (9) (10) (11) (12)
VARIABLES ROA ROE Cost-to-
income Credit
Growth NPL over
loans NIM ln(no of emp.) Liquidity
Non-interest income
Government securities
Interbank loans
Corporate loans
IPO dummy 0.002* 0.015 -0.003 0.006 -0.012*** 0.002* -0.028 -0.012 -0.038*** 0.009 -0.008 0.014 (0.001) (0.015) (0.012) (0.022) (0.004) (0.001) (0.055) (0.009) (0.012) (0.011) (0.007) (0.020)
Privatization (30 percent) 0.000 -0.023 -0.036** -0.016 0.010 -0.002* -0.130 0.017 0.034** 0.023** 0.010 -0.020 (0.002) (0.023) (0.017) (0.039) (0.008) (0.001) (0.123) (0.012) (0.014) (0.012) (0.007) (0.018)
Privatized (30 percent) 0.001 0.046 0.030 0.110*** -0.010 0.007*** 0.313* -0.014 -0.042** -0.041** 0.003 0.052 (0.002) (0.029) (0.022) (0.041) (0.014) (0.002) (0.162) (0.015) (0.021) (0.020) (0.010) (0.039)
Years from privatization (30 percent) 0.000 0.003 -0.007*** -0.007* -0.000 -0.000 -0.032 -0.009*** 0.004 0.000 -0.007*** 0.010** (0.000) (0.002) (0.002) (0.004) (0.001) (0.000) (0.025) (0.003) (0.002) (0.002) (0.002) (0.005)
Privatized (30 percent)*IPO 0.002 0.022 -0.056* -0.070 0.020 -0.008 -0.108 -0.044 0.040 0.028 -0.019 -0.005 (0.006) (0.063) (0.033) (0.050) (0.017) (0.007) (0.170) (0.030) (0.033) (0.035) (0.019) (0.060)
Years from privatization (30 percent)*IPO -0.000 -0.010*** 0.009*** -0.002 0.001 0.000 0.027 0.007** 0.002 0.002 0.005** -0.001
(0.000) (0.004) (0.003) (0.005) (0.002) (0.001) (0.022) (0.003) (0.004) (0.002) (0.002) (0.009) Observations 3,126 3,125 3,090 3,109 2,628 3,119 1,819 3,125 3,113 2,535 3,086 1,409 R-squared 0.144 0.073 0.179 0.291 0.256 0.155 0.419 0.319 0.087 0.217 0.184 0.160 Number of banks 250 250 250 249 243 250 223 250 250 225 249 187
Panel B: Foreign issue (1) (2) (3) (4) (5) (6) (7) (8) (9) (10) (11) (12)
VARIABLES ROA ROE Cost-to-
income Credit
Growth NPL over
loans NIM ln(no of emp.) Liquidity
Non-interest income
Government securities
Interbank loans
Corporate loans
IPO dummy 0.003*** 0.033** -0.018 -0.003 -0.011*** 0.001 -0.073* -0.026** -0.035*** 0.011 -0.015** 0.011 (0.001) (0.016) (0.012) (0.024) (0.004) (0.001) (0.039) (0.010) (0.010) (0.011) (0.008) (0.018)
Privatization (30 percent) 0.001 -0.018 -0.035** -0.011 0.009 -0.001 -0.094 0.019 0.030** 0.022* 0.011 -0.017 (0.002) (0.022) (0.017) (0.039) (0.008) (0.001) (0.112) (0.012) (0.013) (0.012) (0.008) (0.018)
Privatized (30 percent) 0.003 0.063** 0.021 0.094*** -0.002 0.005** 0.309** -0.026* -0.031 -0.034* -0.001 0.079*** (0.002) (0.029) (0.019) (0.035) (0.012) (0.003) (0.137) (0.015) (0.020) (0.020) (0.011) (0.026)
Years from privatization (30 percent) 0.000 0.000 -0.005** -0.008** -0.000 -0.000 -0.027 -0.007*** 0.004* 0.001 -0.006*** 0.009** (0.000) (0.002) (0.002) (0.004) (0.001) (0.000) (0.021) (0.003) (0.002) (0.002) (0.002) (0.005)
Foreign issue -0.004** -0.045* 0.005 0.007 0.005 -0.002 -0.028 0.003 0.012 -0.013* 0.001 0.041** (0.001) (0.025) (0.013) (0.024) (0.005) (0.001) (0.050) (0.009) (0.011) (0.007) (0.006) (0.020)
Privatized (30 percent)*For.iss. -0.005 -0.095* -0.024 -0.045 -0.012 -0.009 -0.397* 0.002 0.011 0.021 -0.013 -0.184*** (0.004) (0.055) (0.040) (0.057) (0.029) (0.006) (0.218) (0.036) (0.031) (0.025) (0.024) (0.064)
27
Years from privatization (30 percent)*For.iss. 0.000 -0.008 -0.003 -0.002 0.004* 0.001* 0.058*** 0.008** -0.001 -0.002 0.008** 0.014**
(0.000) (0.007) (0.004) (0.006) (0.002) (0.001) (0.018) (0.003) (0.005) (0.002) (0.003) (0.006) Observations 3,126 3,125 3,090 3,109 2,628 3,119 1,819 3,125 3,113 2,535 3,086 1,409 R-squared 0.146 0.074 0.176 0.290 0.253 0.154 0.419 0.315 0.085 0.214 0.182 0.177 Number of banks 250 250 250 249 243 250 223 250 250 225 249 187
Panel C: Equity jump (1) (2) (3) (4) (5) (6) (7) (8) (9) (10) (11) (12)
VARIABLES ROA ROE Cost-to-
income Credit
Growth NPL over
loans NIM ln(no of emp.) Liquidity
Non-interest income
Government securities
Interbank loans
Corporate loans
IPO dummy 0.002* 0.021 -0.004 0.001 -0.015*** 0.001 -0.043 -0.025** -0.029*** 0.012 -0.015* 0.000 (0.001) (0.016) (0.012) (0.026) (0.005) (0.001) (0.034) (0.010) (0.011) (0.009) (0.008) (0.020)
Privatization (30 percent) -0.001 -0.040 -0.028 0.014 0.008 -0.003** -0.045 0.011 0.039*** 0.023** 0.014* -0.031* (0.002) (0.025) (0.018) (0.040) (0.009) (0.001) (0.072) (0.012) (0.014) (0.011) (0.008) (0.017)
Privatized (30 percent) 0.001 0.037 0.041** 0.117*** -0.009 0.002 0.239** -0.028* -0.026 -0.038* -0.007 0.062** (0.002) (0.025) (0.018) (0.034) (0.014) (0.002) (0.097) (0.015) (0.020) (0.020) (0.011) (0.031)
Years from privatization (30 percent) 0.000 0.001 -0.006** -0.006 0.000 -0.000 -0.029* -0.007** 0.002 -0.000 -0.005** 0.009* (0.000) (0.003) (0.003) (0.004) (0.001) (0.000) (0.016) (0.003) (0.002) (0.003) (0.002) (0.006)
Lagged Equity Jump (33 percent) 0.002*** 0.021** -0.012 0.000 -0.000 0.002** -0.027 0.009* -0.007 -0.003 0.003 -0.005 (0.001) (0.010) (0.007) (0.013) (0.003) (0.001) (0.021) (0.005) (0.006) (0.006) (0.004) (0.007)
Privatized (30 percent)*leqjump33 0.012** 0.131* -0.103** -0.151*** 0.010 0.014* -0.053 -0.006 -0.048 0.023 -0.010 -0.027 (0.006) (0.076) (0.046) (0.056) (0.015) (0.008) (0.156) (0.032) (0.037) (0.031) (0.021) (0.060)
Years from privatization (30 percent)*leqjump33 -0.001* -0.007 0.006 0.001 -0.001 0.000 0.041** -0.002 0.007* 0.002 -0.001 0.001
(0.000) (0.006) (0.003) (0.006) (0.002) (0.000) (0.016) (0.005) (0.003) (0.003) (0.004) (0.007) Observations 2,902 2,901 2,871 2,889 2,441 2,895 1,706 2,902 2,891 2,371 2,865 1,332 R-squared 0.155 0.077 0.185 0.299 0.274 0.166 0.442 0.330 0.089 0.200 0.191 0.175 Number of banks 247 247 247 246 239 247 216 247 247 216 246 184
Panel D: High NPL sale (1) (2) (3) (4) (5) (6) (7) (8) (9) (10) (11) (12)
VARIABLES ROA ROE Cost-to-
income Credit
Growth NPL over
loans NIM ln(no of emp.) Liquidity
Non-interest income
Government securities
Interbank loans
Corporate loans
IPO dummy 0.001 0.011 -0.002 -0.023 -0.004 -0.000 -0.016 -0.017 -0.023* 0.018* -0.004 0.007 (0.001) (0.015) (0.012) (0.025) (0.003) (0.001) (0.042) (0.011) (0.012) (0.011) (0.007) (0.020)
Privatization (30 percent) 0.001 -0.037* -0.024 0.021 -0.003 -0.002* -0.002 0.008 0.043*** 0.018 0.014* -0.047** (0.002) (0.021) (0.020) (0.029) (0.006) (0.001) (0.081) (0.012) (0.014) (0.012) (0.008) (0.020)
Privatized (30 percent) -0.002 0.010 0.043* 0.084*** 0.006 0.001 0.187** -0.022 0.007 -0.060** -0.002 0.072* (0.002) (0.032) (0.022) (0.032) (0.009) (0.002) (0.092) (0.018) (0.022) (0.023) (0.012) (0.040)
28
Years from privatization (30 percent) 0.000 -0.003 -0.003 -0.005 0.000 0.000 -0.003 -0.002 0.008** -0.005 0.001 0.002 (0.000) (0.003) (0.003) (0.005) (0.001) (0.000) (0.012) (0.003) (0.003) (0.003) (0.001) (0.006)
Lagged Equity Jump (33 percent) 0.002*** 0.027*** -0.015** 0.004 0.001 0.001 -0.045* 0.010* -0.005 0.001 0.004 -0.007 (0.001) (0.010) (0.007) (0.013) (0.002) (0.001) (0.024) (0.006) (0.006) (0.005) (0.004) (0.007)
Privatized (30 percent)*leqjump33 0.013*** 0.115 -0.120** -0.078 0.001 0.015** -0.089 -0.016 -0.075** 0.040 -0.026 -0.019 (0.005) (0.074) (0.050) (0.055) (0.011) (0.008) (0.145) (0.031) (0.036) (0.034) (0.020) (0.066)
Years from privatization (30 percent)*leqjump33 -0.001** -0.003 0.004 0.000 -0.001 -0.000 0.023* -0.003 0.005* 0.004 -0.003* 0.004
(0.000) (0.005) (0.003) (0.005) (0.001) (0.000) (0.014) (0.004) (0.003) (0.003) (0.002) (0.007) High NPL -0.015*** -0.110*** 0.025 -0.164*** 0.099*** -0.004** 0.048 0.049*** -0.010 0.029** 0.021*** 0.027 (0.002) (0.026) (0.019) (0.025) (0.009) (0.002) (0.074) (0.012) (0.013) (0.013) (0.007) (0.021) Privatized (30 percent)*highnpl75 -0.001 0.091 0.016 -0.071 0.017 -0.005 -0.086 0.043* -0.058* 0.080** 0.041** 0.018
(0.005) (0.065) (0.048) (0.050) (0.019) (0.004) (0.199) (0.025) (0.032) (0.037) (0.019) (0.062) Years from privatization (30 percent)*highnpl75 0.000 0.003 -0.005 0.006 -0.000 -0.000 -0.045** -0.010** -0.007** 0.005 -0.012*** 0.013*
(0.000) (0.004) (0.004) (0.005) (0.001) (0.000) (0.022) (0.004) (0.003) (0.004) (0.002) (0.007) Observations 2,441 2,441 2,419 2,440 2,441 2,440 1,459 2,441 2,438 2,069 2,418 1,212 R-squared 0.254 0.121 0.156 0.366 0.538 0.199 0.492 0.390 0.121 0.227 0.249 0.220 Number of banks 239 239 239 239 239 239 206 239 239 214 239 175 Notes: All regressions include bank and country control variables, as well as bank and year fixed effects. Robust standard errors are reported. *** p<0.01, ** p<0.05, * p<0.1.
29
Table 8. Privatization and Bank Outcomes: Developing vs. High-income countries
Panel A: Developing (1) (2) (3) (4) (5) (6) (7) (8) (9) (10) (11) (12)
VARIABLES ROA ROE Cost-to-
income Credit
Growth NPL over
loans NIM ln(no of emp.) Liquidity
Non-interest income
Government securities
Interbank loans
Corporate loans
IPO dummy 0.002* 0.016 -0.018 0.004 -0.007 0.002 -0.024 -0.024** -0.042*** 0.006 -0.013 0.038** (0.001) (0.017) (0.015) (0.027) (0.004) (0.002) (0.052) (0.011) (0.012) (0.012) (0.008) (0.018)
Privatization (30 percent) 0.002 -0.006 -0.033 -0.047 0.006 -0.002 -0.328 0.009 0.029 0.012 0.016* -0.048*
(0.002) (0.026) (0.026) (0.050) (0.011) (0.002) (0.228) (0.018) (0.019) (0.017) (0.009) (0.028) Privatized (30 percent) -0.000 0.019 0.021 0.080* 0.005 0.003 0.442* -0.019 -0.029 -0.015 -0.008 0.053
(0.003) (0.037) (0.027) (0.045) (0.014) (0.003) (0.229) (0.023) (0.025) (0.021) (0.011) (0.039) Years from privatization (30 percent) 0.000 0.002 -0.006 -0.010* -0.000 0.000 -0.032 -0.004 0.005 0.001 -0.005*** 0.005
(0.000) (0.004) (0.004) (0.006) (0.001) (0.000) (0.040) (0.003) (0.003) (0.003) (0.002) (0.007) Observations 1,950 1,949 1,918 1,948 1,628 1,943 1,048 1,950 1,938 1,698 1,927 776 R-squared 0.192 0.090 0.183 0.324 0.250 0.206 0.513 0.236 0.117 0.279 0.143 0.143 Number of banks 151 151 151 151 149 151 138 151 151 143 151 116 Panel B: High-income (1) (2) (3) (4) (5) (6) (7) (8) (9) (10) (11) (12)
VARIABLES ROA ROE Cost-to-
income Credit
Growth NPL over
loans NIM ln(no of emp.) Liquidity
Non-interest income
Government securities
Interbank loans
Corporate loans
IPO dummy 0.006** 0.072** 0.003 -0.040 -0.014** 0.000 -0.054 -0.007 -0.016 -0.007 -0.002 -0.052 (0.002) (0.033) (0.022) (0.048) (0.007) (0.002) (0.051) (0.018) (0.019) (0.010) (0.016) (0.052)
Privatization (30 percent) -0.004 -0.054 -0.034* -0.007 0.013 -0.004** 0.038 0.026 0.042** 0.030** 0.005 0.036
(0.002) (0.041) (0.020) (0.063) (0.008) (0.002) (0.051) (0.017) (0.018) (0.014) (0.012) (0.023) Privatized (30 percent) 0.006*** 0.117*** -0.002 0.152*** -0.013 0.005** 0.076 -0.032* -0.021 -0.021 0.010 0.066**
(0.002) (0.036) (0.023) (0.041) (0.010) (0.002) (0.078) (0.018) (0.024) (0.030) (0.019) (0.031) Years from privatization (30 percent) -0.000 -0.004 -0.004 -0.006 0.001 -0.000* -0.023** -0.007*** 0.002 -0.003 -0.006*** 0.013**
(0.000) (0.003) (0.003) (0.004) (0.001) (0.000) (0.009) (0.002) (0.003) (0.003) (0.002) (0.006) Observations 1,176 1,176 1,172 1,161 1,000 1,176 771 1,175 1,175 837 1,159 633 R-squared 0.149 0.094 0.197 0.305 0.428 0.266 0.450 0.538 0.160 0.194 0.360 0.222 Number of banks 99 99 99 98 94 99 85 99 99 82 98 71 Notes: All regressions include bank and country control variables, as well as bank and year fixed effects. Robust standard errors are reported. *** p<0.01, ** p<0.05, * p<0.1.

30
Table 9. Privatization and Bank Outcomes: Rule of Law and Financial Development
Panel A: Rule of Law (1) (2) (3) (4) (5) (6) (7) (8) (9) (10) (11) (12)
VARIABLES ROA ROE Cost-to-
income Credit
Growth
NPL over loans
NIM ln(no of emp.) Liquidity
Non-interest income
Government securities
Interbank loans
Corporate loans
IPO dummy 0.001 0.001 -0.007 -0.013 -0.008** 0.001 -0.086** -0.017* -0.033*** 0.015 -0.012 0.010 (0.001) (0.001) (0.013) (0.025) (0.004) (0.001) (0.039) (0.010) (0.010) (0.012) (0.008) (0.021)
Privatization (30 percent) 0.001 0.001 -0.048** 0.003 0.006 -0.003** 0.009 -0.000 0.034** 0.019 0.005 -0.023 (0.002) (0.002) (0.019) (0.046) (0.008) (0.001) (0.050) (0.013) (0.014) (0.015) (0.010) (0.019)
Privatized (30 percent) 0.002 0.002 0.024 0.128** 0.002 0.007** 0.167** 0.001 -0.064*** -0.030 0.003 0.054 (0.003) (0.003) (0.022) (0.050) (0.013) (0.003) (0.076) (0.023) (0.024) (0.024) (0.013) (0.039)
Years from privatization (30 percent) 0.000 0.000 -0.005* -0.011* -0.000 0.000 0.012 -0.007** 0.007** -0.000 -0.005*** 0.010*
(0.000) (0.000) (0.003) (0.006) (0.001) (0.000) (0.012) (0.003) (0.003) (0.003) (0.002) (0.005) High Rule of Law 0.000 0.000 0.009 -0.028 0.015** -0.000 0.225*** -0.030*** 0.030** 0.023* -0.015** 0.014
(0.002) (0.002) (0.015) (0.024) (0.006) (0.002) (0.073) (0.011) (0.014) (0.013) (0.007) (0.021) Privatized (30 percent)*High Rule of Law -0.001 -0.001 0.006 -0.028 -0.023** -0.006* -0.110 -0.046* 0.046* -0.020 -0.009 0.003
(0.003) (0.003) (0.027) (0.054) (0.011) (0.003) (0.091) (0.024) (0.027) (0.027) (0.018) (0.050) Years from privatization (30 percent)*High Rule of Law
-0.000 -0.000 -0.001 0.005 0.000 -0.000 -0.023** 0.000 -0.005* 0.001 -0.002 -0.001 (0.000) (0.000) (0.003) (0.006) (0.001) (0.000) (0.011) (0.003) (0.003) (0.003) (0.002) (0.004)
Observations 2,665 2,665 2,641 2,653 2,312 2,662 1,547 2,664 2,658 2,199 2,629 1,294 R-squared 0.174 0.174 0.161 0.300 0.300 0.169 0.561 0.334 0.087 0.209 0.173 0.147 Number of banks 250 250 250 249 241 250 221 250 250 224 249 186 Panel B: Fin. Development (1) (2) (3) (4) (5) (6) (7) (8) (9) (10) (11) (12)
VARIABLES ROA ROE Cost-to-
income Credit
Growth
NPL over loans
NIM ln(no of emp.) Liquidity
Non-interest income
Government securities
Interbank loans
Corporate loans
IPO dummy 0.003*** 0.027* -0.018 -0.005 -0.010** 0.001 -0.053 -0.025** -0.032*** 0.010 -0.015* 0.018 (0.001) (0.016) (0.012) (0.024) (0.004) (0.001) (0.041) (0.010) (0.010) (0.011) (0.008) (0.019)
Privatization (30 percent) 0.000 -0.022 -0.037** -0.009 0.008 -0.002 -0.136 0.015 0.028** 0.022* 0.008 -0.021 (0.002) (0.022) (0.017) (0.039) (0.007) (0.001) (0.120) (0.012) (0.013) (0.012) (0.008) (0.017)
Privatized (30 percent) 0.002 0.047 0.012 0.132** -0.009 0.007* 0.340* -0.027 -0.052** -0.023 -0.003 0.022 (0.004) (0.051) (0.027) (0.054) (0.016) (0.004) (0.197) (0.024) (0.024) (0.026) (0.016) (0.044)
Years from privatization (30 percent) 0.000 -0.000 -0.010*** -0.006 -0.000 0.000 -0.040 -0.012*** -0.003 -0.001 -0.010*** 0.026***
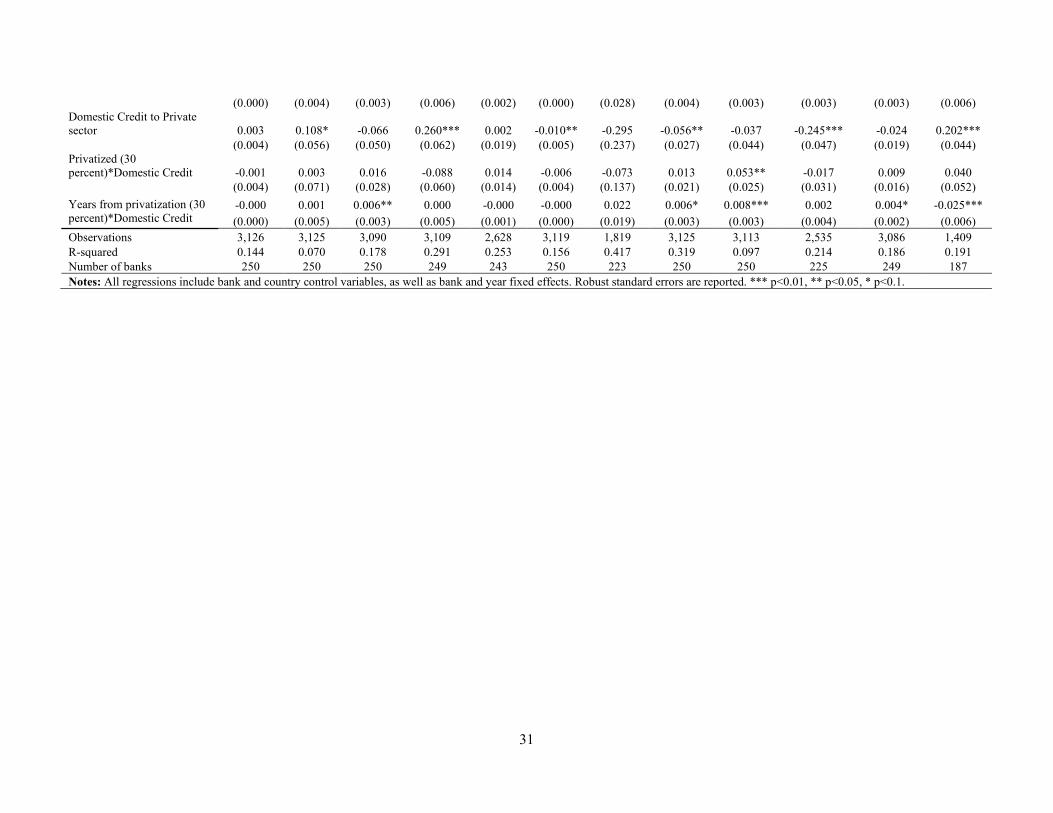
31
(0.000) (0.004) (0.003) (0.006) (0.002) (0.000) (0.028) (0.004) (0.003) (0.003) (0.003) (0.006) Domestic Credit to Private sector 0.003 0.108* -0.066 0.260*** 0.002 -0.010** -0.295 -0.056** -0.037 -0.245*** -0.024 0.202***
(0.004) (0.056) (0.050) (0.062) (0.019) (0.005) (0.237) (0.027) (0.044) (0.047) (0.019) (0.044) Privatized (30 percent)*Domestic Credit -0.001 0.003 0.016 -0.088 0.014 -0.006 -0.073 0.013 0.053** -0.017 0.009 0.040
(0.004) (0.071) (0.028) (0.060) (0.014) (0.004) (0.137) (0.021) (0.025) (0.031) (0.016) (0.052) Years from privatization (30 percent)*Domestic Credit
-0.000 0.001 0.006** 0.000 -0.000 -0.000 0.022 0.006* 0.008*** 0.002 0.004* -0.025*** (0.000) (0.005) (0.003) (0.005) (0.001) (0.000) (0.019) (0.003) (0.003) (0.004) (0.002) (0.006)
Observations 3,126 3,125 3,090 3,109 2,628 3,119 1,819 3,125 3,113 2,535 3,086 1,409 R-squared 0.144 0.070 0.178 0.291 0.253 0.156 0.417 0.319 0.097 0.214 0.186 0.191 Number of banks 250 250 250 249 243 250 223 250 250 225 249 187 Notes: All regressions include bank and country control variables, as well as bank and year fixed effects. Robust standard errors are reported. *** p<0.01, ** p<0.05, * p<0.1.
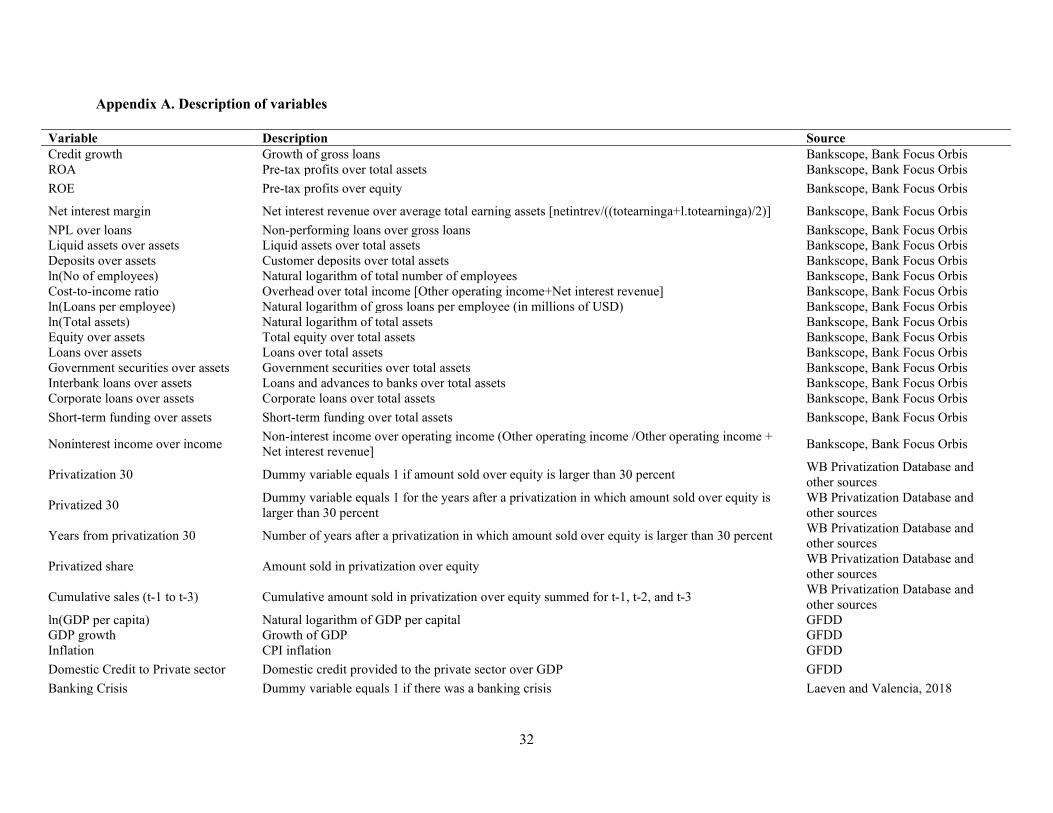
32
Appendix A. Description of variables
Variable Description Source Credit growth Growth of gross loans Bankscope, Bank Focus Orbis ROA Pre-tax profits over total assets Bankscope, Bank Focus Orbis ROE Pre-tax profits over equity Bankscope, Bank Focus Orbis
Net interest margin Net interest revenue over average total earning assets [netintrev/((totearninga+l.totearninga)/2)] Bankscope, Bank Focus Orbis NPL over loans Non-performing loans over gross loans Bankscope, Bank Focus Orbis Liquid assets over assets Liquid assets over total assets Bankscope, Bank Focus Orbis Deposits over assets Customer deposits over total assets Bankscope, Bank Focus Orbis ln(No of employees) Natural logarithm of total number of employees Bankscope, Bank Focus Orbis Cost-to-income ratio Overhead over total income [Other operating income+Net interest revenue] Bankscope, Bank Focus Orbis ln(Loans per employee) Natural logarithm of gross loans per employee (in millions of USD) Bankscope, Bank Focus Orbis ln(Total assets) Natural logarithm of total assets Bankscope, Bank Focus Orbis Equity over assets Total equity over total assets Bankscope, Bank Focus Orbis Loans over assets Loans over total assets Bankscope, Bank Focus Orbis Government securities over assets Government securities over total assets Bankscope, Bank Focus Orbis Interbank loans over assets Loans and advances to banks over total assets Bankscope, Bank Focus Orbis Corporate loans over assets Corporate loans over total assets Bankscope, Bank Focus Orbis Short-term funding over assets Short-term funding over total assets Bankscope, Bank Focus Orbis
Noninterest income over income Non-interest income over operating income (Other operating income /Other operating income + Net interest revenue] Bankscope, Bank Focus Orbis
Privatization 30 Dummy variable equals 1 if amount sold over equity is larger than 30 percent WB Privatization Database and other sources
Privatized 30 Dummy variable equals 1 for the years after a privatization in which amount sold over equity is larger than 30 percent
WB Privatization Database and other sources
Years from privatization 30 Number of years after a privatization in which amount sold over equity is larger than 30 percent WB Privatization Database and other sources
Privatized share Amount sold in privatization over equity WB Privatization Database and other sources
Cumulative sales (t-1 to t-3) Cumulative amount sold in privatization over equity summed for t-1, t-2, and t-3 WB Privatization Database and other sources
ln(GDP per capita) Natural logarithm of GDP per capital GFDD GDP growth Growth of GDP GFDD Inflation CPI inflation GFDD Domestic Credit to Private sector Domestic credit provided to the private sector over GDP GFDD Banking Crisis Dummy variable equals 1 if there was a banking crisis Laeven and Valencia, 2018

33
High Rule of Law Dummy variable equals 1 if there the Rule of law index [varying between -2.5 and 2.5] is higher than 0. WGI
Equity jump (33 percent) Dummy variable equals 1 if the growth of equity is higher than 33 percent Bankscope, Bank Focus Orbis High NPL Dummy variable equals 1 if the NPL ratio is higher than 8.7 percent Bankscope, Bank Focus Orbis