Embed Size (px)
Citation preview

I. INTRODUCTION
Electrostatic precipitation (ESP) is a common
technology applied in fly ash control in coal-fired power
plant over the world, due to its high efficiency, low
pressure loss and low maintenance cost. It has a history
of over one hundred years. In 1880s, the British physicist
Oliver J. Lodge gave the first idea about ESP [1] and
developed the first commercial ESP with Alfred Walker
for a lead smelter in North Wales. Unfortunately, this
application was unsuccessful because of problems with
the high-voltage power supply and the high resistivity of
the lead oxide fume. The first applicable ESP in an
industrial scale was promoted by Dr. F. G. Cottrell in
California, USA until in early 1900s, which was
described in his first ESP patent [2]. During the
following ten years, several ESPs were installed for
applications such as removal of cement kiln dust, lead
smelter fumes, tar, and pulp and paper alkali salts.
At the first stage of ESP development, the dust
collection efficiency is not high enough (around 90%)
because of the limited understanding of ESP principle
and high voltage power source. But the handled gas
volume grew very fast, reached 1,000,000 cfm in 1912,
and even by today's standards was large [3]. The first
ESP installed in coal-fired power plant was in 1923, just
after the pulverized-coal furnaces were applied [4]. In
1922, the German physicist Walther Deutsch derived the
famous Deutsch equation through theoretical
considerations [5]. This equation describes the basic law
about the relationship between dust collecting efficiency
and treatment time or collecting area for a given gas flow.
Deutsch equation is still being used in the design of ESP
today with several modifications according to actual
industrial design requirements.
During the time from 1960s to 1980s, ESP developed
fast both in theory and industrial application. Fig. 1 gives
the schematic of ESP development history, especially for
its collection efficiency improvement. In 1963, Harry J.
White made a great contribution in the scientific
understanding and industrial progress of ESP through
publishing the famous book “Industrial Electrostatic
Precipitation”. In the 1970s, Oglesby and Nichols
reviewed almost all aspects related to this technique,
such as historical development, theory of ESP,
development of equipment, applications, and economics
in their book “Electrostatic Precipitation”, and they also
drafted the “A Manual of Electrostatic Precipitator
Technology” published by National Air Pollution Control
Administration of USA. Based on the full understanding
of ESP, its industrial design and operation was improved
dramatically. The collection efficiency reached over
99.5% at the middle of 1970s [4]. Nowadays, ESPs are
designed to collect in excess of 99.9% of the fly ash to
meet the very low emission limits.
The collection efficiency normally used in the ESP
evaluation is a kind of mass proportion, while the mass
proportion of fine particle (sometime equally means
PM2.5) is much smaller than large particle even though
its particle number is big, and fine particle collection is
much harder than large particle. Higher collection
efficiency means more fine particle should be collected.
For instance, the improvement of collection efficiency
from 99.5% to 99.9% requires over 80% particles should
be removed [4]. So, the fine particle collection needs
much more effort in the technique improvement than
ever before. Taking China for an example, the haze
pollution is severe in the east. According to the published
literatures, the fly ash from coal consumption contributes
around 33% to the haze in the form of primary particles
[6] and around 14-26% in the form of secondary particle
Recent Progress of Dry Electrostatic Precipitation for PM2.5 Emission
Control from Coal-fired Boilers
Y. Huang1, S. Li
1, Q. Zheng
1, X. Shen
1, S. Wang
2, P. Han
2, Z. Liu
1, and K. Yan
1
1Key Laboratory of Biomass Chemical Engineering of the Ministry of Education,
The Institute of Industrial Ecology and Environment, Zhejiang University, PR China 2Shenhua Guoneng Energy Group Corporation Limited, PR China
Abstract—Electrostatic precipitation (ESP) is a common technology applied in fly ash control in coal-fired power
plant over the world, due to its high efficiency, low pressure loss, and low maintenance cost. Since fine particle collection
(PM2.5) is much harder than relative large particle, modern ESP requires excellent performance on PM2.5 collection. In
this paper, not only the ESP principles and models, but also the modern techniques developed recently for ESP in PM2.5
control will be reviewed, such as electric agglomeration, flow field visualization, modern power source, moving electrode
ESP and colder-side ESP. The newly developed ESP index model and its application in ESP sizing and upgrading will be
introduced in detail. Besides, several advanced flue gas cleaning systems developed in the past twenty years will be
presented and compared, especially for the system with colder-side ESP developed in the recent ESP upgrading activities
in China.
Keywords—Electrostatic precipitation, PM2.5 control, coal-fired power plant
Corresponding author: Keping Yan
e-mail address: [email protected]
Huang et al. 69

[7]. For improving the haze pollution control, the latest
coal-fired power plant emission limit published in China
decreased the dust emission limit from several
hundred mg/Nm3 to 30 mg/Nm
3 (20 mg/Nm
3 for some
central areas, such as Beijing, Shanghai and Guangzhou)
[8]. According to the new limits, all ESPs installed
before 2012 should fulfill the new emission limits after
July 1st, 2014. While, according to the data from the
China ESP Association in 2013, the dust emission of
most ESPs excess these limits and some of them even
over 100 mg/Nm3 [9]. So most ESPs in China was under
upgrading or rebuilding during these years, and several
state-of-the-art techniques have been developed or
imported for the old ESP upgrading or new ESP
construction.
In this review, not only the ESP principles and
models will be reviewed, but also the modern techniques
developed for ESP in the fine particle control in the
recent years will also be introduced, such as electric
agglomeration, flow field visualization, modern power
source, moving electrode ESP and colder-side ESP. The
newly developed ESP index model and its application in
ESP sizing and upgrading will be discussed in detail.
Besides, several advanced flue gas cleaning systems
developed in the past twenty years will be presented and
compared, especially the new system with colder-side
ESP developed in the recent ESP upgrading activities in
China. While, the synchronization of ESP and fabric bag,
wet ESP and electric field enhanced fabric filter will not
be included since only dry ESP technology is reviewed in
this paper.
II. ESP PRINCIPLES
The particle collection process in ESP can mainly be
divided into three steps: particle charging by generated
electrons and ions, particle transportation under electric
field, and particle removal from the collecting electrode
by mechanical force. Fig. 2 gives schematic diagram of
the dust particle collection in ESP. The discharging
electrode is placed between two collecting electrode to
Fig. 1. The schematic of ESP history, especially for collection efficiency improvement (data are from [4]).
Fig. 2. The schematic diagram of dust particle collection in ESP [10].
Discharge electrodes
Collected dust
Dust particles
Charged particles
particles
Corona
Collecting electrodes
Dust-laden gas
Clean gas
70 International Journal of Plasma Environmental Science & Technology, Vol.9, No.2, OCTOBER 2015

produce localized high non-uniform electric field. In this
region, free electrons will be accelerated to high
velocities when a sufficiently high voltage (larger than
corona onset voltage) is applied to the wire electrode. If
the energy of these electrons is high enough, the
ionization process will be repeated for many times so that
large quantities of free electrons and positive ions are
formed within the corona region (also called active zone).
Dust particles can be charged by these generated
electrons and ions, and dragged towards to plate
electrode by the Coulomb force [10]. The particle
charging has two mechanisms: field charging and
diffusion charging, which mainly depends on particle
diameter. If particle diameter is larger than 1 μm, field
charging dominates and requires the ordered motion of
ions under the presences of electrical field, if particle
diameter is less than 0.1 μm, diffusion charging
dominates, which is based on random ionic collision
driven by thermal motion. Otherwise, two kinds of
mechanisms both exist. The details of ionization, particle
charging and charged particle migration can be found in
Fig. 3. As long as the charged particles arrive at plate
electrode, electric charge runs away through ground
connection while particles remain. When a dust layer is
formed on the collecting electrode and its thickness
reaches a predetermined level, rapping hammer or
intensive acoustic apparatus will be used to remove the
layer to a hopper located below [11].
With regards to the fine particle collection in ESP, the
collection efficiency is not as good as relative large
particle. There are mainly three reasons making the ESP
cannot collect fine particle effectively:
(1) Fine particle is difficult to be charged since the
diffusion charge mechanism. The relatively low
operating voltage of ESP and uneven corona
discharge or ion current can also results in the non-
sufficient particle charging, even there is no charge
for sub-micro particles [12-15].
(2) Particle in the diameter larger than 10 μm in ESP
can be regarded as Stocks particle, and their
movement is mainly judged by Coulomb force and
drag force, while for the fine particle, their behavior
in ESP is quite different that they usually move with
the gas flow for the unsufficient charging. So, the
electrohydrodynamic (EHD) induced turbulent flow,
which is the motion of ionized particle or molecular
and their interactions with electric field and
surrounding air, can effectively decrease the fine
particle collection efficiency [16, 17].
(3) Back corona discharge or irrational rapping can also
cause the re-entrainment of the fine particles which
have been collected on the plate [18, 19].
III. THEORETICAL MODEL AND SIMULATION
A. Deutsch Equation
The theoretical analysis of ESP performance was
initiated by the famous Deutsch equation. It served over
50 years in the ESP design having similar dusts, process
applications and design efficiencies, but different flow
rate. Deutsch equation gives logarithmic relationship
between collection efficiency, gas flow rate and
collection area. It was firstly found experimentally based
on the field tests by Anderson in 1919, and then
theoretically derived by Deutsch in 1922, so it is also
called the Deutsch-Anderson equation [20]:
η = 1 − exp(−ω ∙A
Q) (1)
where, η is the collecting efficiency, ω is the charged
particle migration velocity, which means moving
velocity in the direction perpendicular to collecting
electrode, cm/s (also in the unit of m/s in some
literatures), A is the collecting plate area, m2, Q is the gas
flow rate, m3/s. Here, A/Q is also defined as specific
collection area (SCA), which indicates the collecting area
required per m3/s of gas. It is always used to compare
(normalize) one ESP to another. The migration velocity
ω is in principle a constant for given conditions (particle
size and shape, electric field strength, gas composition
and temperature etc.). The theoretical derivation details
Fig. 3. Schematic diagram of the ionization, particle charging and charged particle migration in ESP [11].
Huang et al. 71

of ω can be found in chapter 5 of Reference [21], but it is
usually calculated from the measured collecting
efficiency, measured or calculated gas flow rate and
actual collection area, since theoretical result always
deviates significantly from real condition. It is observed
that ω can be treated as constant within a wide efficiency
range. Except for the original expression as shown in Eq.
(1), the Deutsch equation can also be expressed in
another empirical formulation as follow [22]:
lg(1 − η) = −𝑆𝐶𝐴 ∙ ωe/2.303 (2)
where, ωe is the effective migration velocity.
B. Modified Deutsch Equations
As Deutsch equation assumes the infinite transverse
turbulent dispersion and uniform dust concentration, it is
overly restrictive to provide accurate prediction. The
actual ESP operation conditions are quite different from
the ideal assumptions, for example, the non-uniformity of
dust concentration over the ESP cross section, turbulent
effects, large particle diameter range, and different
migration velocity and so on. So the collection efficiency
is always overestimated.
During the past century since Deutsch equation was
published, many modified equations have been generated
and tested. The first important modification was made by
Matts and Öhnjeld. In the Matts-Öhnjeld equation, the
influence of particle size distribution is taken into
consideration, and a log-normal distribution of particle
size is assumed. It only can be used when the electrical
conditions of the precipitator are maximized and the
temperature is constant [23]. Another important modified
equation published in early 1960s is called extended
Deutsch equation (SCIRO), in which the migration
velocity term in the original Deutsch equation is replaced
by particle size and voltage components that can be
measured directly [22]. Robinson once took the non-
uniformity of dust concentration into consideration by
adding a ratio between dust concentration close to the
plate and average value [24]. Since high longitudinal
turbulent mixing only occurs in the extreme condition,
Cooperman considered the particle re-entrainment and
the longitudinal turbulent mixing effects by adding a
factor (1-f) (see Table I) to the effective migration
velocity [25-26]. After that, several equations were
developed by solving the particle convection-diffusion
equation [27-30]. Leonard et al. took the finite turbulent
diffusion coefficient into consideration [27], and Zhao et
al. also considered the non-uniform air velocity profile
and the turbulent mixing coefficient [28]. For particle
size distribution effect, Feldman et al. gave a complex
equation including the parameters, such as particle
diameter, average field strength, fluid viscosity, dielectric
constant of the particle and so on [31]. Riehle et al.
derived a grade collection efficiency equation based on
the work of Leonard [32]. Bai et al. developed a moment
model approximating the particle size distribution by a
lognormal function through the ESP [33]. Kim et al. also
obtained a set of the first three moment equations by
taking continuous evolution of particle size distribution
into consideration [34].
In the recent years, Ortiz et al. developed a simple
equation having a good fit to experiment data by
considering several dimensionless parameters, which
included turbulence factor, electro-hydrodynamics factor
and Deutsch number (NDe) [35]. Lin derived a collection
efficiency equation for partially charged fine particle in
the diameter less than 100 nm [36]. Zhu and Yan et al.
developed an equation based on the ESP index, which is
applied successfully in the recent ESP upgrading in
China [37]. This simple equation not only considers the
directly parameters, such as SCA and applied voltage,
but also fits to the grade collection evaluation.
The following table summarizes all the equations
available in the published literatures. These equations
companied with the authors, publication year and some
remarks are listed. At present, all ESP equipment
suppliers have adopted some version of the modified
Deutsch Equation for ESP sizing, even developed their
own empirical model and database based on their design
and operation experiences. We also believe that there are
some equations out of the table are kept as commercial
secrets in ESP equipment suppliers.
C. ESP Index Model
According to Table I, most of the modified equations
are based on theoretical derivation or experimental
results in lab, and too complicate to be applied in
industrial ESP sizing and performance evaluation. ESP
performance usually depends on both the collection area
and the applied voltage, which correspond to the ESP
body and high voltage power source, respectively. The
collection area can be easily evaluated by SCA value,
while there is still no common defined specification to
evaluate the effectiveness of high voltage power source.
In order to bridge this technical gap, it is necessary to
develop a simple equation that takes the SCA and applied
voltage both into consideration. Meanwhile, this equation
not only can be used in practical ESP design, but also
appropriate for grade collection evaluation. For that
purpose, Zhu and Yan developed an equation as follow
[37]:
lg1−η(d𝑝)
𝛽= −α ∙ E𝑎 ∙ 𝐸𝑝 ∙ 𝑆𝐶𝐴 (3)
where, Ea is the average electric field, Ep is the peak
electric field and α, β is the coefficient related to the
operating condition and particle size. The product of
Ea∙Ep∙SCA is defined as ESP index, which indicates the
collection capacity of ESP. The expression of α ∙ E𝑎 ∙ 𝐸𝑝
represents the grade effective migration velocity as
follow:
ω(dp) = α ∙ Ea ∙ Ep (4)
72 International Journal of Plasma Environmental Science & Technology, Vol.9, No.2, OCTOBER 2015
Eq. (3) can also be rewritten for mass of penetrated
particles:
0lg lg a pm M E E S (5)
where, M0 and m is the inlet and outlet mass
concentration, respectively. Fig. 4 a-c give the test results
of grade penetrations under different SCA and square of
average electrical field on a pilot ESP model [37]. It is
clearly that the grade penetrations show linearly
relationship with SCA, square electric field strength and
their product.
TABLE I
THE MODIFIED DEUTSCH EQUATIONS LIST
Equation name Equation expression Publication
year Remarks
Matts-Öhnjeld equation
[23]
η = 1 − exp(−𝜔𝑒 ∙ 𝑆𝐶𝐴)𝑘
log(1 − η) = −(SCA ∙ 𝜔𝑒)0.5/2.303
also expressed in the form:
1963
𝜔𝑒 is the effective migration velocity, k
represents a factor taking into account
several process variables, it normally
ranges from 0.4 to 0.6.
Extended Deutsch
equation (SCIRO) [22] log(1 − η) = log(1 − η𝑔) + 𝐶 ∙ 𝑆𝐶𝐴 ∙ 𝑑 ∙ 𝑉
2 1963
η𝑔 is the efficiency at corona onset
voltage, C is a constant , d is the particle
size, and V is the applied voltage.
Published by M.
Robinson [24] η = 1 − (1 −
𝛽
1 − 𝛼)exp[−ω ∙ (1 − 𝛼) ∙ 𝜒 ∙ 𝑆𝐶𝐴] 1967
α is the mass of dust eroded per unit
mass precipitated (dimensionless), β is
the mass of “problem” dust eroded per
unit mass of dust precipitated at the
position close to inlet (dimensionless),
and χ is the ratio between dust
concentration close to the plate and
average value, in original Deutsch
Equation, χ = 1.
F. L. Smidth equation
[22] 1/(1 − η) = (1 + b ∙ SCA ∙ 𝜔𝐵)
1/𝑏 1967
𝜔𝐵 is the effective migration velocity in
the first infinitesimal part of the ESP and
b is an empirically determined exponent
found to be 0.22 in most cases.
Published by P.
Cooperman [25]
η = 1 − exp{[𝛼 − (𝛼2 + 2𝛽)12] ∙ 𝑙}
η = 1 − exp(𝛽
𝛼∙ 𝑙 −
(1 − 𝑓)𝑤𝐿
𝑣𝑏)
also can be transformed into Deutsch-type equation:
1971
This equation is dimensionless.
α =bv
2D, β = (1 − f) ∙
𝑏𝑤
2𝐷, 𝑙 = 𝐿/𝑏 .
where, b is the semi-width of the
precipitator channel, v is the mean gas
velocity, D is the particle diffusion
coefficient in the direction of flow, f is
ratio of particle transport by turbulence
away from an electrode to the rate of
electrostatic particle transport towards
the electrode, w is the particle velocity
due to electrostatic forces, L is
precipitator length.
Published by P.L.
Feldman [30]
η(d𝑝) = 1 − exp{𝑆𝐶𝐴 ∙ 𝜀0𝐸𝑎𝑐
2 𝐶𝑑𝑝3𝜇
[(1 +2𝜆
𝑑𝑝)
2
+2(𝜅 − 1)
(1 +2𝜆𝑑𝑝) (𝜅 + 2)
]}
1975
This is a grade efficiency equation, in
which dp is the particle diameter, ε0 is the
permittivity of free space, Eac is the
average field strength, C is the
Cunningham slip correction factor, μ is
the fluid viscosity, λ is the mean free
path of the gas and κ is the dielectric
constant of the particle
Published by Leonard
[27]
η = 1 − exp(−𝜔𝑒 ∙ 𝑆𝐶𝐴)𝐹 = 1 − exp(−𝜔𝑒𝐿/𝑏𝑣)𝐹
𝐹(𝜔𝑒𝑣, 𝑃𝑒) = (
𝑣
𝜔𝑒)2 𝑃𝑒2({1 + (
𝜔𝑒𝑣)2
[1 + (2𝜃
𝑃𝑒)2
]}
12
− 1)
in which,
1980
F is a function of ωe/v and Pe. If F=1,
this equation reduces to original Deutsch
equation. ωe/v is the ratio of the
transversal particle velocities, can also be
called as the electrical drift parameter. Pe
is the electric Pectel number (Pe=wb/D),
in which D is the turbulent mixing
coefficient.
(Continued on next page)
Huang et al. 73

TABLE I Continued
Published by G.
Cooperman [26]
η = 1 − (const)exp{[𝛼 − (𝛼2 + 𝛾𝜆12 +
𝛽2
𝛾)
12
] ∙ 𝑙}
tan 𝜆1 =𝛽
𝛾
2𝜆12(1 − 𝑓)
𝜆12 − (1 − 𝑓)𝛽2/𝛾2
in which,
1984
This is a unified equation for both high
mixing condition and low mixing
condition, in which γ = Dx/Dy, Dx and
Dy represent the longitudinal and
transverse mixing coefficients,
respectively. λ1 is the smallest positive
solution to the transcendental equation.
The constant varies from 1 for β/γ ≪ π/2
to (√2𝜋𝛾
𝛽)3 exp (
𝛽
𝛾) for
𝛽
𝛾≫ 𝜋
Published by Zhao et al.
[28]
η = 1 −√𝑃𝑒
2𝑏√𝜋𝐷𝑒∙ ∫ exp[−
𝑃𝑒4𝐷𝑒
(𝑦
𝑏− 𝐷𝑒)
2𝑏
0
]𝑑𝑦
η = 1 −√𝑃𝑒
2√𝜋𝐷𝑒∙ exp[−
𝑃𝑒4𝐷𝑒
(𝛼 − 𝐷𝑒)2]
or simplifies
1994
NDe is the Deutsch number that equals
ωe∙SCA or, 𝜔𝑒L
𝑏𝑣, α is the ratio of
distance from center to wire-plate
spacing, which varies from 0.45 to 0.6.
For the small electric Peclet number α is
around 0.45 and for the large electric
Peclet number α equals 0.6.
Published by Riehle et
al. [32] η(d𝑝) = 1 − ∑ 𝐶𝑚exp(−
𝜔𝑒𝑣
𝐿
𝑏𝐹𝑚)
𝑠𝑖𝑛𝜃𝑚𝜃𝑚
exp(𝑃𝑒2)
∞
𝑚=1
1995
tan𝜃𝑚 =−2(2𝜃𝑚/𝑃𝑒)
1 − (2𝜃𝑚/𝑃𝑒)2
This is a grade efficiency equation
based on the derivation of Leonard’s
work, in which m is the eigen function,
Cm and Fm are both functions of θm and
Pe. The relationship between θm and Pe
is:
Published by Zhang et
al. [30]
η = 1 − exp(−𝜔𝑒𝐿/𝑏𝑣)𝐹
𝐹(𝜔𝑒𝑣, 𝑃𝑒) =
𝑣
𝜔𝑒
𝑃𝑒𝑥2({1 +
𝜔𝑒𝑣
𝑃𝑒𝑦𝑃𝑒𝑥
[1 + (2𝜃
𝑃𝑒𝑦)
2
]}
12
− 1)
in which,
2002
This equation is similar to Leonard’s
equation, while both transverse and
longitudinal Peclet numbers (Pex and
Pey) are considered.
𝑃𝑒𝑥 =𝑣𝑏
𝐷𝑥, 𝑃𝑒𝑦 =
𝑤𝑏
𝐷𝑦
Published by Ortiz et al.
[35] η = 1 − 1.042exp(−N𝐷𝑒
0.612) 2010
The simplified equation that has the best
fit to experimental data for particles
with average diameter of 12 μm.
Published by Lin et al.
[36] η = 1 − exp(−A ∙ 𝑁𝐷𝑒
𝐵) + 𝐶 ∙ 𝑁𝐷𝑒 − (1 − 𝛼) 2012
A, B, and C are all regression
coefficients. This equation is developed
for controlling nanoparticles with the
particle diameter (dp) < 100 nm in the
air environment.
Published by Zhu et al.
[37] log
1 − η(d𝑝)
𝛽= α ∙ E𝑎 ∙ 𝐸𝑝 ∙ 𝑆𝐶𝐴 2012
Ea is the average electric field, Ep is the
peak electric field and α, β is the
coefficient related to the operating
condition and particle size. The product
of Ea∙Ep∙SCA is defined as ESP index.
Fig. 4a. Grade penetration versus specific collection area when the
three-phase TR source is applied with the flow rate of 40,000 m3/h,
gas temperature of 110°C, and initial concentration of 15 g/Nm3 [37].
Fig. 4b. Grade penetration versus square of average electrical field
when the three-phase TR source is applied with the flow rate of
40,000 m3/h, gas temperature of 110°C, and initial concentration of
15 g/Nm3. For three-phase T/R source, Ep ≤ 1.05∙Ea [37].
74 International Journal of Plasma Environmental Science & Technology, Vol.9, No.2, OCTOBER 2015

D. Theoretical Simulation
With regards to the theoretical simulation of ESP
performance, it developed fast in the last 30 years in
terms of model size and accuracy since the impressive
progress in the speed and capacity of the computing
equipment, but it is still difficult to simulate the whole
processes in ESP. Fig. 5 gives the schematic diagram of
complete ESP models that mainly include the gas flow,
electric field, and particle transport. It can be found that
there are mutual coupling relationships between these
models. The solid lines indicate the important effects
usually considered in the model simulation, while the
dash lines can be neglected. Taking the EHD flow for an
example, the intensive electric field strength induced
EHD flow causes the severe turbulence in the gas flow
field. It is also the hottest research point in the past ten
years in the field of ESP simulation.
For the electric field simulation, Poisson equation
adopted in the most works can give accurate results for
any practical electrode configurations [39-47, 50, 53-55].
For the particle transport, the particle concentration can
be easily obtained by solving the Euler equation with
considering the particle density and its charge density
[56], while the Lagrangian solution includes all essential
factors to generate the particle behavior [38, 42]. For the
gas flow pattern, two kinds of models have been used:
laminar flow model and turbulent flow model. k-ε
approach is the most popular method in Computational
Fluid Dynamics (CFD) to simulate the turbulent flow
conditions [43-45, 48-52]. Besides, the Navier-Stokes
equations can give more accurate results of the turbulent
flow [40, 41, 48-52]. The studies of all these models
mentioned above in the ESP gas flow field simulation are
mostly finished in 1990s.
In the recent ten years, researchers mainly focused
on the EHD flow simulation and the comparison of
simulation results and experimental results. Table II
gives the summary of EHD flow simulations in the past
ten years. It can be found that most of these works
adopted the Navier-Stokes equations in their turbulent
models, and commercial CFD code was also used in the
simulation. Recently, Haque et al. published two papers
about the 3D simulation of gas flow field in full size ESP
[48], and investigated the boundary influence on
calculation results [49]. Castle’s group published also
several papers on the EHD effect on gas flow pattern [50,
51] and fine particle collection [52]. Meanwhile, the flow
field measurement with particle image velocimetry (PIV)
method has also been developed to investigate the EHD
flow [57]. The measurement results gave the direct
images of EHD flow and improved the understanding of
its effect on flow field pattern by comparing with the
simulation results. The PIV method will be presented in
details in section IV.B.
Fig. 4c. Grade penetration versus ESP index when the three-phase
TR source is applied with the flow rate of 40,000 m3/h, gas
temperature of 110°C, and initial concentration of 15 g/Nm3 [37].
Fig. 5. The schematic diagram of complete ESP models, and their multi-coupling relationship and solving approaches, part of the figure is
derived from [38].
Huang et al. 75

According to the literatures published, there is less
comprehensive simulation work can be found in the last
ten years. Adamiak once investigated the coupled model
of gas flow and particle transport by involving several
parameters, such as flow field, electric field, space charge
density and particle trajectories [46]. Talaie once built a
model that took the electric field distribution, particle
movement, turbulent flow into consideration. This model
can give the simulation results about corona sheath radius,
voltage-current curve, gas flow pattern, and particle
collection efficiency [39]. Farnoosh also considered a
complete model for submicron particle collection, which
included the interaction effect of electric field, fluid
dynamics and particulate flow [52]. Besides, a research
group from Tsinghua University, China focused on the
electric field and particle charging simulations. They
TABLE II
THE EHD SIMULATION WORKS IN RECENT YEARS
Authors Dimensions Geometry EHD model Boundary conditions Main results:
Yamamoto
et.al. in 2006
[40]
3D Point/tuft-plate
Laminar model:
continuity equation;
Turbulent model:
Navier-Stokes equations
Inlet flow: specified
Outlet flow: zero gradient
Wall boundary: non-slip
and the periodic boundary
The turbulent flow model is
more appropriate than laminar
flow model
Fujishima et
al. in 2006
[41]
3D Wire-plate Navier-Stokes equations
Inlet flow: specified
Outlet flow: zero gradient
Wall boundary: non-slip
and the periodic boundary
The secondary flow forms a pair
of long-elliptic and circulatory
cells between spike points along
the wire.
Skodras et al.
in 2006 [42] 2D
Wire-plate
(full size)
Commercial CFD
software including both
Eulerian and Lagrangian
approaches
Specified, details can be
found in [42]
Small particles are harder to
collect and the most efficient
way to increase the collecting
performance is to increase the
wire voltage or lower the entry
velocity
Chun et al. in
2007 [43] 2D Wire-plate
k-ε turbulent model with
commercial CFD code
Specified, details can be
found in [43]
Secondary flow vortices caused
by the EHD increases with
increasing discharge current or
EHD number, hence pressure
drop of ESP increases.
Zhao et al. in
2008 [44] 2D
Wire-plate
(full size)
k-ε turbulent model with
commercial CFD code
Specified, details can be
found in [44]
The ion-convection effect
should be considered for
relatively high-velocity main
airflow and the motion of the
fine particles can be affected by
the presence of EHD flow.
Lei et al. in
2008 [45] 3D Wire-plate k-ε turbulent model
Specified, details can be
found in [45]
The flow distortion in an ESP is
caused by the circulatory cells
near the grounded plate, and the
turbulence intensity. The flow
turbulence causes the particles
to have different electric charges
Adamiak et
al. in 2009
[46]
2D Wire-plate Laminar model:
continuity equation Not provided
Increasing the particle
concentration significantly
affects the flow pattern which
becomes more and more non-
uniform and exhibits stronger
and stronger agitation.
Haque et al.
in 2009 [48] 3D
Wire-plate
(full size)
Reynolds averaged
Navier-Stokes equations
coupled with the k–ε
turbulence model
equations, commercial
CFD code is used.
Velocity-inlet and
pressure- outlet;
Wall boundary: non-slip
The collecting electrodes,
baffles and the perforated plates
are included to assess their
influence on the flow pattern of
an ESP, and this model
particularly is useful to predict
possible improvement in the
ESP designs.
Haque et al.
in 2009 [49] 3D
Wire-plate
(full size)
Reynolds averaged
Navier-Stokes equations
coupled with the k-ε
turbulence model
equations, commercial
CFD code is used.
Two inlet boundary
conditions are included:
uniform velocity profile
and non-uniform velocity
profile;
Pressure-outlet boundary
and non-slip boundary for
walls
For the industrial application,
the experimentally measured
velocity distribution should be
used at the inlet boundary for an
accurate and realistic flow
simulation.
(Continued on next page)
76 International Journal of Plasma Environmental Science & Technology, Vol.9, No.2, OCTOBER 2015
used the new cell-centered finite volume method to
predict the electric field and found that the predictions of
the constant charging models are higher than that of the
non-constant models but differ little for the sub-micro
meter particles [53-55].
IV. MODERN DRY ESP TECHNIQUES FOR PM2.5 CONTROL
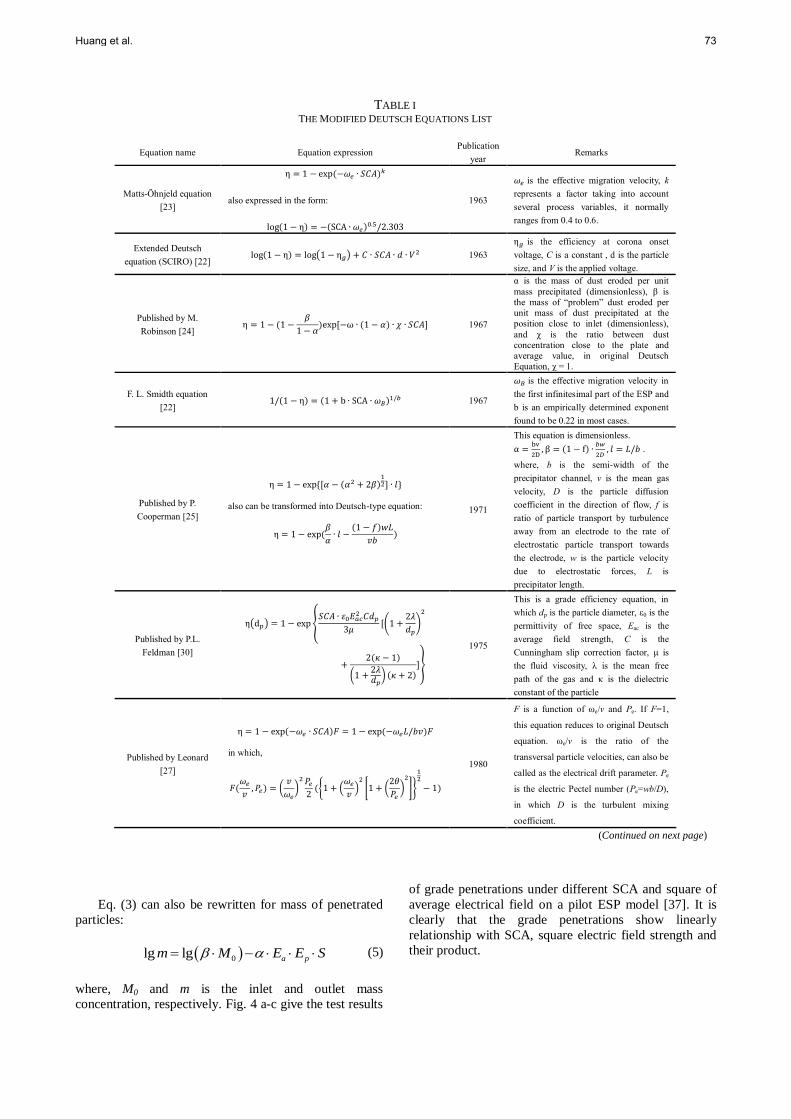
A. Pre-charging and Fine Particle Agglomeration
Particle agglomeration is one of the effective
methods that improve the ESP performance of fine
particle collection [58]. It is mainly divided several
types: heat agglomeration, acoustic agglomeration,
electric agglomeration, optic or electromagnetic
agglomeration and chemical agglomeration. Since most
coal-fired power plants use ESP as particle collection
equipment, the electric agglomeration is more popular for
them. According to the mechanisms and the electric field
applied, the electric agglomeration can be mainly divided
into three types: agglomeration in AC field with the
single-polarity charging, agglomeration in AC field with
bipolar charging, and agglomeration with Coulomb force.
These three kinds of systems are shown in Fig. 6. In the
system (A), the fine particle is charged by both positive
and negative corona discharge, and then agglomerated in
an AC field, while in system (B) single polarity discharge
is used to charge the fine particle, and also agglomerated
in an AC field. In the system (C), the electric field is
replaced by mechanical agglomerator.
The first study of electric agglomeration of fine
particle was finished by Masuda in 1983 [60]. In 1990s,
several types of electric agglomeration technologies and
equipment were studied and tested [61-68]. After that,
there is less work in the field of electric agglomeration,
and most of them focus on bipolar charging [70-73].
According to the results, it can be found that the pre-
charging can improve the fine particle collection
efficiency effectively. The company Indigo promoted the
industrial application of electric agglomeration in the
way of applying a gas flow mixing system after the
bipolar pre-charger [71, 72]. All of the electric
agglomeration researches are listed in Table III.
TABLE II Continued
Farnoosh et
al. in 2010
[50]
3D Wire-plate
Reynolds averaged
Navier–Stokes equations
coupled with the k–ε
turbulence model
equations, commercial
CFD code is used.
Specified, details can be
found in [50]
Higher particle collection
efficiencies are obtained for the
larger particles and the EHD
flow has a negligible effect on
the ESP performance.
Farnoosh et
al. in 2011
[51]
3D Wire-plate
Time averaged Navier–
Stokes equations coupled
with the k–ε turbulence
model equations,
commercial CFD code is
used.
The same as in [51]
The strength and dimension of
the gas vortices depend not only
on the value of the excitation
voltage but also on the mutual
directions of the secondary
EHD and the primary airflows.
Farnoosh et
al. in 2011
[52]
3D Wire-plate
Time averaged Navier–
Stokes equations coupled
with the k–ε turbulence
model equations,
commercial CFD code is
used.
Velocity-inlet and
pressure- outlet;
Wall boundary: non-slip
ESP with spikes on two sides is
the best discharge electrode
design for collecting fine
particles. The increasing the
particle concentration at the
inlet decreases the fine particle
collection efficiency.
Fig. 6. The schematic diagrams of pre-charging and agglomeration
system.
(A) is the bipolar pre-charging and AC field agglomeration system,
(B) is the single polarity pre-charging and AC field agglomeration
system, (C) is the bipolar pre-charging and Coulomb force
agglomeration system.
Huang et al. 77

B. Gas Flow Visualization with PIV Method
Since the fine particle behavior in the fluid is
dominated by the gas flow condition and its charging
mode is mainly diffusion charge, the fine particle
collection efficiency in ESP is not as high as large
particle. The ion wind induced by the intensive electric
field also causes severe turbulence that makes the fine
particle collection even more difficult. So some
researchers paid their attention on the ion wind effect on
fine particle collection. Not only the improved gas flow
model combined with powerful commercial CFD code is
used to optimize the gas flow pattern, but also state-of-
the-art measurement techniques are introduced to study
TABLE III THE ELECTRIC AGGLOMERATION RESEARCHES LIST
Authors Pre-charging type Agglomeration
zone structure
Fine particle
type
Particle
density
Gas flow velocity
(m/s) or residence
time (s)
Collection
efficiency or
agglomeration
efficiency if not
marked
Masuda et al.
in 1983 [60]
Wire-cylinder reactor
1.5kV/cm ;
2~2.5 mA/m2
Gap distance:
6mm
Tail gas, 0.06~2
μm 0.12 g/m3
0.25~1 m/s Improved from 75%
to 95% (12 μm)
Watanabe et
al. in 1995
[61, 62]
Wire-cylinder reactor
(single-polarity)
Stick-cylinder
reactor ;
Stick diameter:
60mm ;
(30 kV/DC,
+11 kV/AC)
Carbonate
particle/
fly ash, 0.06~12
μm
0.1 g/m3 / 98%
Kanazawa et
al. in 1993
[63]
Bipolar wire-plate
reactor, gap distance:
90 mm discharge wire
material: tungsten,
(+10 kV, -7 kV)
/ Smoke, 0.3~1
μm 0.25~0.8 m/s /
Improved from 25%
to over 80%
Hautanen in
1995 [64]
Positive wire-plate
reactor, gap distance:
35 mm (+7 kV) ;
Plate-plate reactor
with 500 mm gap
distance, AC
(35 kV/50 Hz)
Oil mist, 0.1~10
μm 1~2 g/m3 0.25 m/s, 1 s
30% for
agglomeration
(0.3~2 μm)
Kildeso et al.
in 1995 [65]
Bipolar wire-plate
reactor
Four discharge
electrodes, AC
(25 kV/cm, 50 Hz)
Line powder,
5 μm 4.2 g/m3 2.1s
30%
(0.3~2 μm)
Laitinen et al.
in 1996 [66]
Single-polarity wire-
plate reactor, gap
distance: 40 mm ;
Plate-plate reactor
with 80 mm gap
distance, AC
(3 kV, 300 Hz)
Oil mist, 0.03~1
μm 0.2 g/m3 4.8s
17~19%
(0.1~1 μm)
Chang et al.
in 1998 [67]
Positive DC pre-
charger (+10 kV) ;
Plate-plate reactor
with 6 mm gap
distance, AC
(1~8 kV, 50 Hz)
/ 2 g/m3 4~6s /
Kim et al. in
1998 [68]
Negative wire-plate
reactor, gap
distance: 80 mm (-
10 kV) ;
Plate-plate reactor
with 36 mm gap
distance, AC
(20 kV, 60-
500 Hz)
Sodium chloride
particle, 0.2~1.2
μm
/
Zukeran et al.
in 2000 [69]
Wire-plate reactor,
gap distance:
38.5 mm, AC15 kV ;
Plate-plate reactor
with cylindrical
gas flow mixing
system
Tail gas,
0.03~0.5 μm 1012 /m3 2.5 m/s
~100% /1 μm,
10% /0.03 μm
Ji et al. in
2004 [70]
Bipolar wire-plate
reactor, gap distance
40 mm, (+8 kV, -
8 kV)
Four discharge
electrodes, AC
(25 kV/cm, 50Hz)
DOS,
0.07~0.6 μm 0.25 g/m3 0. 5 m/s, 1s
25~29%
(0.1~1 μm)
Crynack et
al. in 2006
[71, 72]
Bipolar wire-plate
reactor
Plate-plate reactor
with cylindrical
gas flow mixing
system
~2.5 μm / 15 m/s 80%
Zhu et al.
in 2010 [73]
Bipolar wire-plate
reactor
150×150×1000 mm
around +5 kV and
-13 kV
/
Calcium
carbonate
with specific
resistance:
2.74×10⁹ Ω∙cm
50 mg/m3 11.4 m/s
Improved from
95% to 98% for
all size particles
78 International Journal of Plasma Environmental Science & Technology, Vol.9, No.2, OCTOBER 2015
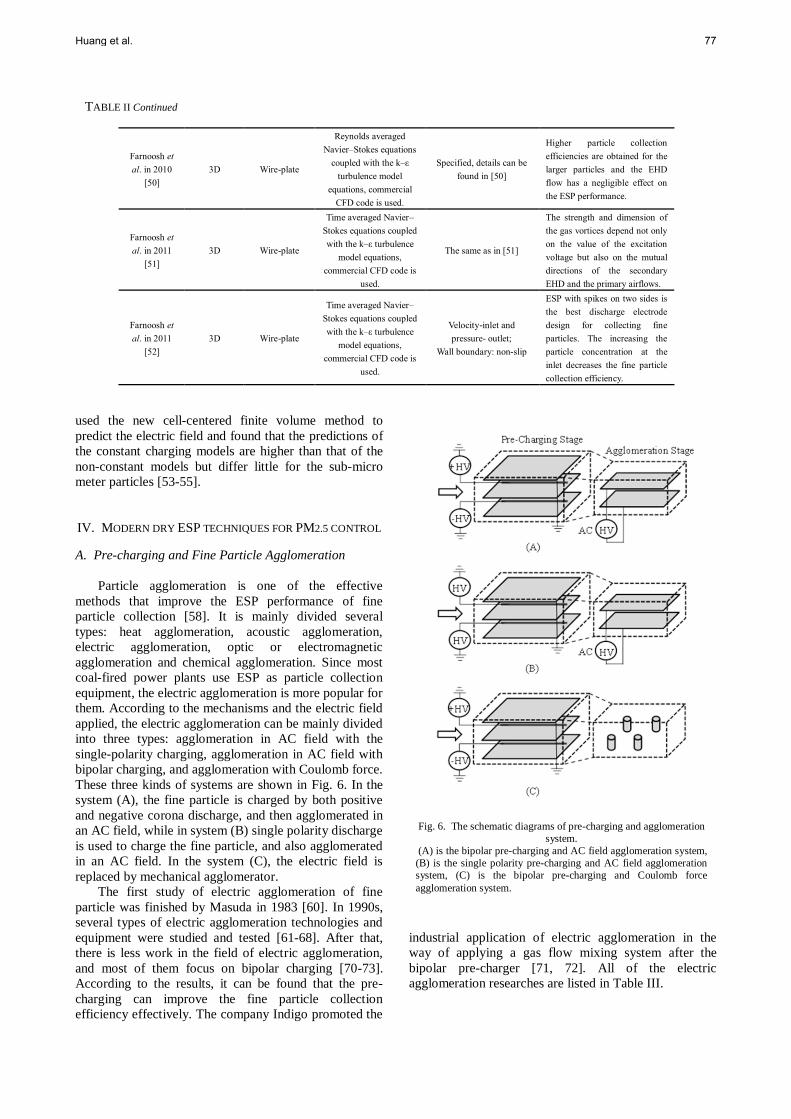
the EHD flow effect on fine particle collection. The most
popular experimental setup for gas flow measurement is
Particle Image Velocimetry (PIV), which use the laser
and CCD or CMOS camera to capture two velocity
components in a plane. It has been adopted widely both
in gas flow field and liquid flow field tests for its
advantages as online and non-intrusive [74]. Fig. 7 gives
the schematic diagram of a 2D PIV system. For 3D PIV,
there are two cameras positioned in a certain degree to
take the images.
Up to now, the gas flow field measurement with PIV
method is mostly conducted by the Mizeraczyk’s group.
They focused on the fine particle behavior and collection
efficiency in ESPs with PIV method for over ten years.
Their works include the flow field measurement in
several types of ESP geometries in lab size with 2D or
3D PIV. For example, the ESP geometries of wire-plate
[75-77], multiple wire-plate [78, 79], spike-plate [80, 81]
and wire-cylinder [82] are studied with 2D PIV. 3D PIV
are also used to study the narrow ESP with plate-plate
gap distance of 30 mm [83, 84] and wide ESP with plate-
plate gas distance of 100 mm [85, 86]. Their results
showed that EHD flow had significant effects on the fine
particle collection process, especially pulls the fine
particle back into the fluid before they arrive at the
collection plate [87]. So some researchers pointed out
Fig. 7. The schematic diagram of PIV measurement system.
1: Computer, 2: Laser power source, 3: Synchronizer, 4: Pulsed laser, 5: Optical waveguide, 6: camera, 7: ESP model, 8&9: High voltage DC
source, 10: Fan.
Fig. 8. The effects of electric field on gas flow pattern (200 mm×200 mm) inside a ESP, the electrode configuration is wire-plate, Laser:
Nd:YAG laser with the model: Beamtech Vlite-200, wavelength: 532 nm, energy per pulse: 200 mJ, repetition rate: 1~15 Hz, pulse width: 6~8 ns,
CCD model: IMPERX IPX E4M15 with the pixel resolution: 2048×2048 [90].
U = 0 kV, I = 0 μA U = -30 kV, I = 72 μA U = -50 kV, I = 423 μA
Wire
Plate
Plate
100 mm
Huang et al. 79

that using membrane collection plate [88] or optimizing
the flow distribution [89] can improve the particle
collection efficiency. Recently, Shen et al. also reported
the 2D PIV visualization of gas flow field in a wire-plate
ESP model with electrode gap distance around 100 mm
(as shown in Fig. 8). The main result is that the turbulent
flow velocity induced by ion wind is almost 3 times
higher than the mean gas flow velocity [90]. Another
important result they found is the optimized electric field
strength, with which the ion wind is not so strong and the
fine particle collection efficiency can reach its maximum
[91]. Fig. 9 gives the grade collection efficiency under
different electric field strength. No matter PM0.1, PM1.0,
PM2.5 or PM10, they all have optimized electric field
strengths, and larger wire electrode gap distance
generates smaller optimized electric field strength.
However, the optimized electric field strength in an
industrial ESP is still difficult to be obtained for the
much more complex conditions.
The measurement results in an industrial ESP also
proved that both of the PM10 and PM2.5 emission
increased rapidly if the input power of ESP was over
1,200 kW (as shown in Fig. 10). It could be attributed to
the fine particle re-entrainment induced by the EHD flow.
Fig. 11 gives the PM10 and PM2.5 emission variations
when the corona currents in the last 3 fields of ESP
increase individually. The results show that the rising of
corona currents in the third and fourth fields could
Fig. 9. The particle emission under different electric field strength, the experimental setup is the same to Fig. 8 but two wire electrodes are used,
(a) PM0.5 emission, (b) PM1.0 emission, (c) PM2.5 emission and (d) PM10 emission (all measured by ELPI) [91].
Fig. 10. The PM10 and PM2.5 emissions under different input power of ESP.
0 10 20 3010
5
106
107
Wire electrodes gap: 78 mm
Wire electrodes gap: 155 mm
Nu
mb
er C
on
cen
trat
ion
/ 1
/cm
3
E2 / (kV/cm)
2
(a)
0 10 20 3010
5
106
107
(b) Wire electrodes gap: 78 mm
Wire electrodes gap: 155 mm
Nu
mb
er C
on
cen
trat
ion
/ 1
/cm
3
E2 / (kV/cm)
2
0 10 20 3010
5
106
107
(c) Wire electrodes gap: 78 mm
Wire electrodes gap: 155 mm
Nu
mb
er C
on
cen
trat
ion
/ 1
/cm
3
E2 / (kV/cm)
2
0 10 20 3010
5
106
107
Wire electrodes gap: 78 mm
Wire electrodes gap: 155 mm
(d)
Num
ber
Conce
ntr
atio
n /
1/c
m3
E2 / (kV/cm)
2
0
10
20
30
40
800 1000 1200 1400
HV Input Power/ kW
ES
P
Em
issi
on
/ m
g/N
m3
PM10
PM2.5
80 International Journal of Plasma Environmental Science & Technology, Vol.9, No.2, OCTOBER 2015

decrease the emissions, while the corona current in the
last field does in the opposite way. So, the corona current
in the last field should be limited to suppress the severe
turbulent flow and overcome the re-entrainment of fine
particles.
This result also indicates that all existed ESP models
for ESP sizing fails in predicting the fine particle
collection, especially for the last field. To improve the
fine particle collection performance of the industrial ESP,
the optimization method of flow field should be studied
furthermore. The optimization of flow distribution can be
that the fine particle moves fast towards to the collection
plate with EHD flow, and its velocity reaches zero when
it approaches the plate. In that way, the re-entrainment
induced by the ion wind can be avoided. Meanwhile, the
research of the relationship between fine particle
collection and flow field pattern in an industrial ESP
scale with the combining of PIV and ELPI are
recommended.
C. Modern Power Sources
For the improvement of fine particle collection in
industrial ESPs, one of the most cost effective techniques
is to upgrading the high voltage power sources by using
the latest automatic voltage controller (AVC) and/or new
types of high voltage techniques, such as switch-mode
power supplies. The traditional power supply of ESP is
the single-phase Transformer/Rectifier (T/R) source, in
which the voltage output is controlled by a primary-side
line-commutated thyristor. The high voltage in the range
of 40-100 kV is generated by a 50 Hz (60 Hz)
transformer [92]. Since the low operation voltage and
current, high ripple factor and low power factor, single-
phase T/R source cannot meet electrical requirement for
fine particle charging and collection. During the past
twenty years, several kinds of efficient power sources
have been developed, such as three-phase T/R source
[93-95], switch mode power source [96, 97], pulsed
power source [98-100], and intermittent power source
[101]. Here after, these kinds of power supplies will be
introduced in detail.
Three-phase T/R source
Three-phase T/R source can be judged as the most
reliable and economic efficient power source for ESPs.
Fig. 12 gives the circuit diagram of three phase T/R
Fig. 11. The PM10 and PM2.5 emission variations when changing the corona currents in the last three fields of a five-fields ESP.
0
10
20
30
40
300 600 900 1200
I1=1300mA
I2=1260mA
I4=600mA
I55=600mA
PM10
PM2.5
Secondary Current I3 /mA
ES
P E
mis
sio
n/
mg
/Nm
3
0
10
20
30
300 600 900 1200
Secondary Current I4
/mA
0
10
20
30
300 400 500 600 700
Secondary Current I5 /mA
I1=1300mA
I2=1260mA
I3=800mA
I5=600mA
PM10
PM2.5
PM10
PM2.5
I1=1300mA
I2=1260mA
I3=800mA
I4=800mA
ES
P E
mis
sio
n/
mg
/Nm
3
ES
P E
mis
sio
n/
mg
/Nm
3
Fig. 12. The circuit diagrams of single phase T/R source (a) and three-phase T/R source (b).
Single Phase
AC Input HV DC Output
SCR L T/R R
Three Phase
AC Input HV DC Output
SCR L T/R L/R
(a)
(b)
Huang et al. 81

source and compares it with single-phase T/R source. It
can be found that, for three-phase T/R source, six SCRs
are connected in reversed parallel with rectifier diodes
for generating much more smooth voltage waveform.
Then, the spark frequency can be decreased and particle
charging current can be increased [93].
Zhu et al. once studied the fine particle collection
improvement with replacing single-phase T/R source by
three-phase T/R source. The experiment was finished on
a full size ESP model with a gas flow rate up to 40,000
Nm3/h and total collection area around 120 m
2. The
results showed that the maximum average secondary
voltage (the voltage output of transformer) was increased
from 55 kV to 71 kV and secondary current (the current
output of transformer) raised from 31 mA to 62 mA
without spark breakdown (as shown in Fig. 13). The
corresponding power inputs and power factor is also
increased from 14.3 kW to 47 kW and 0.49 to 0.82,
respectively (as shown in Table IV). For fine particle
collection, the particles within 0.03 to 0.1 μm and 0.1 to
2.5 μm in diameter, the efficiencies rise from about 85%
to 95% and 92%, respectively. For particles of around
2.5-8.0 μm, their collection efficiency also rises from
about 87% to about 98% [94].
Switch mode power source
With the fast development of high frequency
transformer and high power semi-conductive switches,
the high frequency switch mode power source (SMPS)
for ESPs becomes the focus of electrical engineer’s
researches. SMPS works in the frequency around 20 kHz,
and its power factor can be improved to around 0.95 [92].
So a higher secondary voltage and secondary current can
be achieved than linear power source. Fig. 14 gives the
circuit diagram of a typical IGBT-based SMPS. The
DC/AV converter, which comprising four switches, a
series capacitance Cs and a series inductance L, is the
heart of this system. Each switch has a high power IGBT
and an anti-parallel diode. Since the IGBT works at the
high frequency around 20 kHz or higher, and the ripple
of output voltage waveform is less than 1%, which is
much smaller than T/R sources (as shown in Fig. 15).
Meanwhile, there is also so-called medium frequency
(a) voltage and current waveforms (b) U-V curves
Fig. 13. The electrical waveforms and U-I curves of single-phase T/R and three-phase T/R [94].
TABLE IV
THE COMPARISON OF BOTH ELECTRIC CHARACTERISTICS AND COLLECTION EFFICIENCY BETWEEN SINGLE-PHASE T/R AND THREE-
PHASE T/R
Source Primary Voltage
(V)
Primary Current
(A)
Secondary Voltage
(kV)
Secondary Current
(mA) Power factor
Collection
efficiency (%)
Single
phase
T/R
128 4 34 2 0.13 71
170 12 45 14 0.31 81
204 17 55 31 0.49 85
Three
phase
T/R
202 1 45 12 0.89 91
236 3 55 28 0.72 94
282 5 65 49 0.75 95
299 6 71 62 0.82 97
Fig. 14. The circuit diagram of IGBT-based SMPS.
30 40 50 60 70 80
0
20
40
60
80
Secondary Voltage (kV)
Sec
on
dar
y C
urr
ent
(mA
) Three phase T/R
Single phase T/R
82 International Journal of Plasma Environmental Science & Technology, Vol.9, No.2, OCTOBER 2015
SMPS which works at the frequency around 10 kHz.
Because the power limit of IGBT and the complexity of
the power supply system, the peak power output and
reliability of the SMPS are not good as T/R source. Grass
et al. once compared high frequency IGBT-based SMPS
with single phase TR source. The main conclusion is that
the appropriate power supply should be selected
according to the ESP operating parameters and economic
conditions and a high frequency IGBT inverter combined
with a microsecond-pulsed power supply significantly
improved the overall performance of ESP [96].
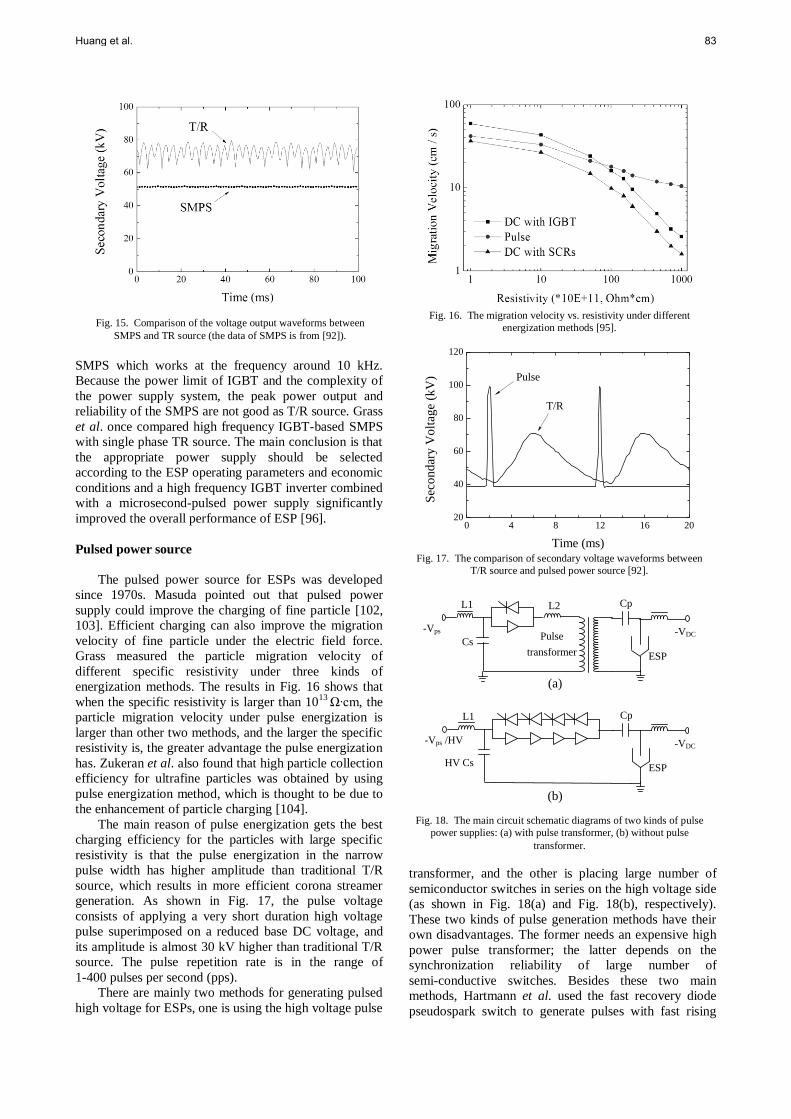
Pulsed power source
The pulsed power source for ESPs was developed
since 1970s. Masuda pointed out that pulsed power
supply could improve the charging of fine particle [102,
103]. Efficient charging can also improve the migration
velocity of fine particle under the electric field force.
Grass measured the particle migration velocity of
different specific resistivity under three kinds of
energization methods. The results in Fig. 16 shows that
when the specific resistivity is larger than 1013
Ω∙cm, the
particle migration velocity under pulse energization is
larger than other two methods, and the larger the specific
resistivity is, the greater advantage the pulse energization
has. Zukeran et al. also found that high particle collection
efficiency for ultrafine particles was obtained by using
pulse energization method, which is thought to be due to
the enhancement of particle charging [104].
The main reason of pulse energization gets the best
charging efficiency for the particles with large specific
resistivity is that the pulse energization in the narrow
pulse width has higher amplitude than traditional T/R
source, which results in more efficient corona streamer
generation. As shown in Fig. 17, the pulse voltage
consists of applying a very short duration high voltage
pulse superimposed on a reduced base DC voltage, and
its amplitude is almost 30 kV higher than traditional T/R
source. The pulse repetition rate is in the range of
1-400 pulses per second (pps).
There are mainly two methods for generating pulsed
high voltage for ESPs, one is using the high voltage pulse
transformer, and the other is placing large number of
semiconductor switches in series on the high voltage side
(as shown in Fig. 18(a) and Fig. 18(b), respectively).
These two kinds of pulse generation methods have their
own disadvantages. The former needs an expensive high
power pulse transformer; the latter depends on the
synchronization reliability of large number of
semi-conductive switches. Besides these two main
methods, Hartmann et al. used the fast recovery diode
pseudospark switch to generate pulses with fast rising
Fig. 15. Comparison of the voltage output waveforms between
SMPS and TR source (the data of SMPS is from [92]).
Fig. 16. The migration velocity vs. resistivity under different
energization methods [95].
Fig. 17. The comparison of secondary voltage waveforms between
T/R source and pulsed power source [92].
Fig. 18. The main circuit schematic diagrams of two kinds of pulse
power supplies: (a) with pulse transformer, (b) without pulse
transformer.
0 4 8 12 16 2020
40
60
80
100
120
Sec
on
dar
y V
olt
age
(kV
)
Time (ms)
T/R
Pulse
Cp
Cs
L1 L2
-VDC
ESP
-Vps Pulse
transformer
Cp
HV Cs
L1
-VDC
ESP
-Vps /HV
(a)
(b)
Huang et al. 83

rate around 50 kV/μs [105]. Song et al. once developed a
pulse generator for ESP with magnetic pulse
compression [106].
Intermittent power source
The intermittent power source is also developed for
the dust particle with high specific resistivity. It
decreases the corona current by shutting down the
semi-conductive switches intermittently for avoiding the
back corona discharge. The time interval between
successive current pulses enables charge to dissipate
through the dust layer, rather than allowing a voltage to
build up on the surface. This approach not only can
increase the collection efficiency, but also can save the
electric energy in a certain context [95]. Fig. 19 gives the
comparison of dust emission under different corona
power density between DC energization and intermittent
energization, in which particles with different resistivity
have tested. It can be found that the particle collection
efficiency for low resistivity and medium resistivity is
close, while for high resistivity, intermittent enegization
mode performs much better than DC mode. That is
because the severe back corona discharge is prohibited
effectively by the intermittent energization mode.
In summary, the power supply is one of the most
full-developed technologies in the ESP system. Many
manufactories over the world can provide their own high
qualified products. Three phase T/R source and high
frequency SMPS are the main products applied in the
industrial ESPs. For example, Alstom promotes their SIR
(Switched Integrated Rectifier) series product (up to
100 kV and 120 kW), NWL in U.S. provides the
PowerPlus series for high frequency mode (up to 100 kV,
110 kW for single unit), ML series for medium frequency
mode (up to 150 kV, 500 kW) and linear frequency
supply (up to 150 kV, 4000 kW), FLSmidth in Denmark
developed a three phase T/R source (up to 100 kV and
2.8 A). Longking and Zhonghe in China also promote
their high frequency power source (up to 80 kV, 2.0 A)
and three-phase T/R source (up to 86 kV, 2.4 A),
respectively. With regards to the question of the priority
of SMPS and three-phase T/R source, a simplified model
shown in Fig. 20 can be used, where the ESP is
represented by a capacitor CESP in parallel with a resistor.
Assuming the applied voltage of ESP is V, and then the
energy stored in ESP can be estimated as following:
E𝐸𝑆𝑃 =1
2𝐶𝐸𝑆𝑃𝑉
2 (6)
For a large ESP, such as the ESP of a 600 MW generator,
its stray capacitance could be around 1 μF, and the
charged energy could be 1800 J when the applied voltage
is 60 kV. Fast charging is very important for the fine
collection, especially for the high voltage recovery after
spark happens. It requires high peak corona current
output of the power source. Three-phase T/R sources can
complete the charging process in about 2 to
8 wavelengths, while SPMS need much longer time due
to its limited corona current output [107]. Fig. 21 gives
comparison results of the dust emission at the outlet of an
ESP equipped with three-phase T/R source and SMPS on
a 600 MW generator. It could be found that not only
PM10 and PM2.5 emissions, but also the PM2.5/PM10
value with three-phase T/R source are lower than with
SMPS and intermittent power source. So, three-phase
T/R source can perform better than SMPS on fine
Fig. 19. The comparison of dust emission under different corona power density between DC energization and intermittent energization.
(a) is with low particle resistivity, (b) is with medium particle resistivity and (c) is with high particle resistivity [92].
Fig. 20. The schematic diagram of a simplified circuit topology for ESP charging model and its equivalent circuit.
0 4 8 12 160
100
200
300
400
Dust
em
issi
on (
mg/m
3 N
TP
)
Corona power density (W/m2)
DC
Intermitent
(a)
0 4 8 12 160
40
80
120
160
Du
st e
mis
sio
n (
mg
/m3 N
TP
)
Corona power density (W/m2)
DC
Intermittent
(b)
0 4 8 12 160
40
80
120
160
Du
st e
mis
sio
n (
mg
/m3 N
TP
)
Corona power density (W/m2)
DC
Intermittent
(c)
V
L
Imax
N2∙CESP
Dust layer
Electrodes
84 International Journal of Plasma Environmental Science & Technology, Vol.9, No.2, OCTOBER 2015

particle collection if it is installed appropriately on a
large ESP.
D. Moving Electrode ESP
Moving electrode ESP is developed for solving the
problems of fine particle re-entrainment induced by
rapping and back corona discharge, in which the fixed
collection plate is replaced by a rolling plate. When the
collection plate rolls in the velocity around 0.5-1.5 m/min,
the condensed dust layer will be removed by the brushes
installed at the bottom of collection plate, as shown in the
following figure. Since no rapping is need, the
re-entrainment can be avoided. Meanwhile, the back
corona discharge induced by charge accumulation can
also be inhibited effectively. Masuda once applied this
type of ESP in the collection of black carbon in the
mobile tail gas, and the collection efficiency reached
95% [60]. Misaka et al. applied the rolling plate in the
ESPs of coal-fired power plant successfully. But there
are still some problems should be improved, for example,
the optimization of rolling plate, brush, chain, and the
ways to prolong their lifetime and decrease the
investment [108].
E. Colder-side ESP
According to the gas temperature, the dry ESP can
be mainly divided into two types: hot-side ESP and cold-
side ESP. The hot-side ESPs is normally placed upstream
the air preheater and the inlet flue gas temperature is in
the range of 300-400°C, while the cold-side ESP usually
works downstream of the air preheater and operates in
the gas temperature around 130-180°C. Cold-side ESPs
are most often used to collect fly ash from coal-fired
boilers, and makes up a large portion of the current
market. The gas temperature has a significant influence
on particle specific resistivity. Since low-sulfur coal is
used in order to fulfill the sulfur oxide emission
regulations, the fly ash resistivity is relative high and
cause severe back corona discharge, one of the efficient
methods to solve this problem is decreasing gas
temperature. As seen in Fig. 23, the fly ash resistivity
reaches the maximum value when its temperature locates
in the range of gas temperature at the inlet of cold-side
Fig. 21. The comparison of PM10 and PM2.5 emissions of the ESP equipped with (a) 20 three-phase T/R sources and (b) 8 SMPS and 12
intermittent power sources on a 600 MW generator (4×5 fields), all the data listed in the figures are time averaged.
Fig. 22. The comparison between fixed collection electrode and rolling collection electrode [108].
1
10
100
1000
11:09 11:14 11:19 11:24 11:29 11:34 11:39
PM10: 51.83 mg/Nm3
PM2.5: 15.11 mg/Nm3
PM2.5/PM10 = 29.15%
Time /min
PM
10
Em
issi
on
/ m
g/N
m3
1
10
100
1000
13:45 13:55 14:05 14:15 14:25 14:35
Time /min
PM
10 E
mis
sio
n /
mg/N
m3
PM10: 12.35 mg/Nm3
PM2.5: 2.39 mg/Nm3
PM2.5/PM10=19.2%
(a) (b)
Huang et al. 85

ESP, and the resistivity decreases sharply when the gas
temperature is reduced to about 130°C or less [109]. This
mainly attributes to the influence of SO3 condensation.
Yuan et al. once studied the influence of SO3 on
electrical conductivity and agglomerate property of fine
particles in flue gas. Results showed that when the mass
concentration of SO3 raised by 34.3 mg/m3, the fly ash
resistivity could be reduced by nearly 2 orders of
magnitude under nominal load of boiler [110]. At the
beginning of 21th century, several published works
focused on the gas conditioning upstream of ESP with
catalyst upstream of ESP to oxide SO2 to SO3 [111, 112].
The main result they found is that the typical values for
SO3 concentration in the flue gas usually vary within the
range of 20-50 ppmv. Recently, Zagoruikoa et al. also
reported their works on this subject [113, 114]. Besides,
the sulfur trioxide conditioning combined with several
other flue gas conditioning techniques has been reviewed
by Shanthakumar et al. [115].
Lower resistivity can generate larger secondary
current and larger effective migration velocity. Porle et al.
also pointed out that if the gas temperature was lowered
for cold-side ESP, its performance could be also
improved sharply due to the elimination of back corona
discharge [116]. At the ends of 1990s, Fujishima et al. in
Japan successfully developed an ESP working in the gas
temperature under 100°C, and defined it as “Colder-side
ESP”. Nowadays, the colder-side ESP is also called
“Low-low temperature ESP”. According to the results
they reported in Fig. 24, it is obviously that the particle
collection efficiency can be increased when the gas
temperature transits from cold-side ESP range to
colder-side ESP range. When the gas flow enters the heat
exchanger upstream of ESP, its temperature will be
decreased to the level under acid dew point. This causes
most of the SO3 in the flue gas to condense and adhere to
the solid particles. Then the fly ash resistivity is adjusted
to the relative small range, and the characteristic of the
particle gas fluent is improved substantially. So, this
method not only can greatly improve the collection
efficiency, but also can get rid of most of the SO3 in the
flue gas at the same time [117]. Fig. 25 also shows the
grade dust emissions before and after the ESP gas
temperature conditioning on a 330 MW generator in
China. It is obvious that both of the particulate number
concentration and mass accumulation at all particulate
diameter ranges decrease when the gas temperature is
decreased from 160 to 110°C.
Fig. 23. The influence of gas temperature on fly ash resistivity (two
Australian coal fly ash samples) [109].
Fig. 24. The gas temperature effect on particle collection efficiency
in ESP [117].
80 100 120 140 16097
98
99
100
Co
llec
tio
n E
ffic
ien
cy (
%)
Temperature (℃)
Colder-side ESP Cold-side ESP
Unexpected results
Putting countermeasure
for re-entrainment
Fig. 25. The grade dust emissions including (a) particulate number concentration and (b) mass accumulation before and after the ESP gas
temperature conditioning on a 330MW generator.
0.01 0.1 1 1010
0
101
102
103
104
105
106
ESP: 330MW / 110℃
Num
ber
Conce
ntr
atio
n /
1/m
3
Particle Diameter / μm
ESP: 330MW / 160℃
0.01 0.1 1 101E-3
0.01
0.1
1
10
100
Mass
Accum
ula
tion /
mg/N
m3
Particle Diameter / μm
ESP: 330MW / 160℃
ESP: 330MW / 110℃
(a) (b) (a)
86 International Journal of Plasma Environmental Science & Technology, Vol.9, No.2, OCTOBER 2015

F. ESP Sizing and Upgrading with ESP Index
The modified Deutsch equations, especially the
Matts-Öhnjeld equation, have been applied in the ESP
sizing for many decades. According to the Matts-Öhnjeld
equation, the specific collection area can be determined
by collection efficiency requirement and the effective
particle migration velocity. The effective particle
migration velocity is semi-empirical, and differs a lot
when the coal type is changed. It is difficult to derive a
unified value to solve all situations. Taking the records
from a coal-fired power plant in China for an example,
the coal type was changed over 90 times in a year. The
heating value, sulfur content and ash content of the coal
can vary from 15 to 28 MJ/kg, 0.5% to 2.1% and 15% to
45%, respectively (as shown in Fig. 26). The frequently
changing of coal type makes the ESP design and
operation much more difficult, especially for finding the
suitable effective migration velocity. So, most
commercial ESP providers have their own effective
migration data base related to the sulfur and sodium
content of the coal according to their own operation
experiences [118, 119]. However, the actual emission
concentration will also differ even if the SCA and coal
type remains the same while the ESP structure or the
power source is changed [120]. Fig. 27 shows the current
PM10 and PM2.5 emissions of the ESPs with traditional
design methods and power sources in China. The dust
emissions varies in a large range, for example, the PM10
and PM2.5 emissions of a 600 MW generator range from
20 to 200 mg/Nm3 and 4 to 32 mg/Nm
3, respectively.
Meanwhile, the averaged PM10 and PM2.5 emissions
could be around 60 mg/Nm3 and 10 mg/Nm
3 for a
600 MW generator, and over 100 mg/Nm3 and 7 mg/Nm
3
for a 1000 MW generator. For realizing the low dust
emission, all these ESPs should be upgraded with a
comprehensive consideration of design methods, power
sources, collecting electrode and so on.
According to the introduction in section III.C, ESP
index is a kind model considering both the SCA and the
power source. It is very suitable for the ESP upgrading
for meeting the upgraded emission limits. Based on the
existed ESP index and emission concentration, the
specified coefficients α and β can be determined. Then,
the new ESP index, which also indicates the required
SCA and secondary voltage, can be calculated according
to the emission limits. Actually, the ESP index
(Ea∙Ep∙SCA) represents the specific energy density inside
the ESP body. It can be applied for different ESP
structures such as three fields or five fields, and different
power sources including single phase or three phase T/R
source, SMPS and pulsed power source.
Based on more than 50 industrial ESP upgrading
applications with 250-600 MW coal-fired boilers in the
Fig. 26. The coal type recording from a coal-fired power plant in China, (a) the heating value, (b) the sulfur content and (c) the ash content.
Fig. 27. The current PM10 and PM2.5 emissions of the ESP with
traditional design methods and power sources in China.
Fig. 28. The dust emission under different ESP index, in which L1:
10% ash content coal, L2: 20% content coal, L3: 40% content coal
[106].
0
5
10
15
20
25
30
35
0 100 200 300 400
600MW
PM10: 63.14 mg/Nm3
PM2.5: 14.75 mg/Nm3
1000MW
PM10: 128.82 mg/Nm3
PM2.5: 7.07 mg/Nm3
600MW
PM10: 62.42 mg/Nm3
PM2.5: 6.72 mg/Nm3
PM10 Emission / mg/Nm3
PM
2.5
Em
issi
on
/ m
g/N
m3
Huang et al. 87

past two years in China, Fig. 28 summarizes the
relationships between the particle emission and ESP
index values. Three typical lines, indicated by L1, L2 and
L3 represent three types of coals with ash contents of
around 10%, 20% and 40%, respectively. The ESPs are
typical 400-410mm wide space and their gas
temperatures are around 95-145°C. The results can be
approximated very well by using the ESP index model
but not by the Deutsch equation. For realizing the
emission concentration in the range of 10-30 mg/Nm3
under various ash content situations, the line L3 is
recommended, and the ESP index value should reach
1300 (kV/cm)2(m
2/m
3/s) as indicated in Eq. (7).
𝐸𝑎 ∙ 𝐸𝑝 ∙ 𝑆𝐶𝐴
{
≥ 900 (
𝑘𝑉
𝑐𝑚)2
(𝑚2
𝑚3 𝑠⁄) for low ashcontent coal
≥ 1000 (𝑘𝑉
𝑐𝑚)2
(𝑚2
𝑚3 𝑠⁄) for medium ashcontent coal
≥ 1300 (𝑘𝑉
𝑐𝑚)2
(𝑚2
𝑚3 𝑠⁄) for high fly ash content coal
(7)
According to Eq. (7), the average electric field
strength should be in the range of 3.3-4 kV/cm if the
SCA is around 100 m2/m
3/s. For the full size ESP with
electrode gap of 400 mm, the corresponding average
secondary voltage is 66-80 kV. Fig. 29 gives the
relationship between average secondary voltage and SCA
under different ESP index. The ESP indexes 700, 1000
and 1300 (kV/cm)2 (m
2/m
3/s) corresponds to the particle
emission concentrations around 100, 50 and 20 mg/Nm3,
respectively. For achieving an emission less than
20 mg/Nm3, the average secondary voltage should be
larger than 70 kV if the SCA is less than 100 m2/m
3/s.
There are two efficient methods to increase the
average secondary voltage: upgrading the power source
and decreasing the gas temperature. For the power source
upgrading, both of the high efficient three-phase T/R
source and switch mode power source can be used with
appropriate control method, such as spark control,
current limit, and back corona control and so on. For the
gas temperature conditioning, not only the ash resistivity
can be decreased, but also the spark voltage can be
increased as the gas density is increased when the gas
temperature decreases from cold-side range (130-180°C)
to the colder-side range (<130°C). The relationship
between the average secondary voltage (Va) and gas
temperature (T) can be approximated as follow [120]:
V𝑎 = 80 − 0.2 ∙ (𝑇 − 95) (8)
Meanwhile, the largest ESP index can also be obtained
from the following equation expressed in gas temperature
[120]:
𝐸𝑎 ∙ 𝐸𝑝 ∙ 𝑆𝐶𝐴 = 𝛹 ∙ (273+𝑇0
273+𝑇1)3 (9)
where, the coefficient Ψ represents the working condition
of the ESP body, T0 and T1 are the initial gas temperature
and adjusted gas temperature, respectively.
In conclusion, there are mainly three technical
methods for ESP upgrading with ESP index: increasing
SCA, upgrading power source and decreasing gas
temperature. And the latter two are the cost effective
methods that adapted for most ESP upgrading. Wang
reported a successful ESP upgrading case of a 660 MW
generator with the ESP index method. The SCA of ESP
body is unchanged that equals 98.27 m2/m
3/s. The gas
temperature at the ESP inlet is decreased from 140°C to
110°C by using economizers. Three-phase T/R source
(82 kV/2.2 A) is used to replace the single-phase T/R
source (72 kV/2.1 A). Fig. 30 gives the comparison of
electrical parameters before and after the upgrading. It
Fig. 29. The relationship between average secondary voltage and
SCA under different ESP index [106].
Fig. 30. The comparison of electrical parameters before and after ESP upgrading of a 660 MW generator, (a): secondary voltage, (b) secondary
current, (c) secondary power [120].
88 International Journal of Plasma Environmental Science & Technology, Vol.9, No.2, OCTOBER 2015

could be found that both of the secondary voltage and
current are improved obviously except for the 4th field,
where a small power source is applied for avoiding fine
particle re-entrainment induced by ion wind. The input
power of ESP at the first three fields almost increases 3
to 4 times higher, and the ESP index increases from
around 610 to 1070 (kV/cm)2 (m
2/m
3/s).
The results in Fig. 30 also indicate that the each ESP
field should be considered separately when upgraded
with ESP index. Not all fields should be regulated into
the same ESP index, especially for the last field where
the applied voltage should be low enough to avoid the
fine particle re-entrainment induced by ion wind. This
conclusion is also proved by the results in Fig. 11 in
section IV.B, which shows the rising of secondary
current will increase the dust emission.
Another important upgrading for colder-side ESP is
the rapping mode. The side rapping is recommended for
decreasing the gas temperature to the range of colder-side
ESP. The secondary voltage-current characteristics show
that for cold-side ESP, the results of two rapping modes
are close. But for colder-side ESP, the side rapping mode
can give much higher secondary current than top rapping
mode (as shown in Fig. 31).
Fig. 32 compares the dust emission before and after
upgrading. Both of the emitted particle number and
integrated mass are decreased in all particle diameters
ranging from 0.1 to 10 μm, especially for the PM 2.5.
Both of the PM2.5 emission and PM10 emission before
and after upgrading are presented in Fig. 33. The results
show that PM10 emission differs from 25-125 mg/Nm3,
and PM2.5 emission ranges from 16-32 mg/Nm3. After
the upgrading, both of these two values decrease to
3-50 mg/Nm3 and 0.5-5 mg/Nm
3, respectively. Fig. 34
gives the data of PM10 and PM2.5 emissions from over
50 upgraded ESPs with generator’s electrical capacity of
125-1000 MW. The mass ratio of PM2.5 to PM10 varies
from 6 to 40 % depending on the rapping condition. For
dust load of around 10-30 g/Nm3 and ESPs with an ESP
Fig. 31. The comparison of secondary voltage-current characteristics between side rapping mode and top rapping mode under different gas
temperature (a) 90-100°C (colder-side ESP) and 130-140°C (cold-side ESP).
Fig. 32. The emitted particle number and integrated mass before and after ESP upgrading of a 660 MW generator [120].
Fig. 33. The mass ratio of PM2.5 to PM10 before and after ESP
upgrading of a 660 MW generator [120].
Huang et al. 89

index larger than 1300 (kV/cm)2 (m
2/m
3/s), PM10 and
PM2.5 can be controlled to be less than 15 mg/Nm3 and
2 mg/Nm3, respectively.
V. ADVANCED FLUE GAS CLEANING SYSTEM
In addition to dust removal, DeNOx and DeSO2 are
the most popular topics in flue gas cleaning. The gas
phase pollutants NOx and SO2 can also form aerosols
when they are suspended in the air in appropriate weather
condition [121]. The traditional industrial treatments of
NOx and SO2 is SCR (Selective Catalytic Reduction) and
FGD (Flue Gas Desulfurization), which use NH3 together
with catalysts to convert NO into N2 and use lime or
other alkaline material (CaO, NaOH etc.) to convert SO2
into gypsum (wet FGD), respectively. The integrated flue
gas cleaning system should have a capability of
simultaneously removing fine particle, acid gas and the
poisonous element Hg [122]. For fine particle emission
control, the combination of ESP and FGD is critical
because of the rational design of desulfurization towers
can help further eliminate PM2.5 after the ESP [123].
Fig. 35 introduces several integrated flue gas
cleaning systems developed all over the world. The
system A is traditional and adopted widely in Europe, in
which two GGHs are placed upstream and downstream
of FGD to decrease the gas temperature to around
50-60°C and raise it again. The dust emission from the
stack can down to 5 mg/Nm3 [124]. Since the gypsum
and limestone particles in the FGD can be further
transformed into fine particles through entrainment and
drying, thereby increasing PM2.5 concentration, it is
necessary to eliminate the fine particles furthermore. For
that purpose, system B was developed in Japan in 1990s,
in which a wet ESP is installed just after the FGD [125].
While, the investment and maintenance cost of wet ESP
was so high that the colder-side ESP technology was also
developed and promoted in Japan at the end of 1990s
[117], which was described as system C. Besides of the
Fig. 34. The mass ratio of PM2.5 to PM10 from over 50 upgraded
ESPs with generator’s electrical capacity of 125-1000MW.
Fig. 35. Several integrated flue gas cleaning systems in coal-fired power plant (AH: air preheater, DESP: dry ESP, GGH: gas-gas heater, WESP:
wet ESP, ECON: economizer).
TABLE V THE ESP UPGRADING WITH SYSTEM D (ECON+ESP+FGD) IN THE LAST TWO YEARS IN CHINA
Power plant name Scale
Huaneng Thermal Power Plant in Beijing (4 generators) 4*250 MW
Dagang Thermal Power Plant in Tianjin (No.3 generator) 2*330 MW
Dingzhou Thermal Power Plant in Hebei Province (No.3&4 generators) 2*600 MW
Yuanyanghu Thermal Power Plant in Ningxia Autonomous Region (2 generators) 2*600 MW
Yunhe Thermal Power Plant in Shandong Province 300 MW
Leiyang Thermal Power Plant in Hunan Province 300 MW
Yungang Thermal Power Plant in Shanxi Province (2 generators) 2*300 MW
Linzhou Thermal Power Plant in Ningxia Autonomous Region (2 generators) 2*135 MW
Boiler SCR AH DESP GGH FGD GGH Stack
Flue gas heat exchange
Boiler SCR AH DESP GGH FGD GGH Stack WESP
Flue gas heat exchange
Boiler SCR AH GGH DESP FGD GGH Stack
Flue gas heat exchange
Boiler SCR AH ECON DESP FGD Stack
A:
B:
C:
D:
90 International Journal of Plasma Environmental Science & Technology, Vol.9, No.2, OCTOBER 2015

removing of wet ESP, the dry ESP is moved from the
position before GGH to after GGH with the purpose of
decreasing the flue gas temperature under the acid dew
point of flue gas. This system had been operated in
several 1000MW units successfully in Japan. Not only
the ESP performance was improved, but also part of SO3
aerosols was also removed simultaneously. The total
particle emission from the stack could be decreased to
around 5 mg/Nm3 [125]. In the recent ESP upgrading in
China, system D was recommended that GGH was
removed and an economizer was installed between air
preheater and dry ESP to act as GGH. The flue gas
temperature was also adjusted to the level under acid dew
point. This kind of system had been installed in over ten
generators (as listed in Table V), and the measurement
results showed that the particle emission at the outlet of
FGD could be reduced to the level around 10 mg/Nm3
[120]. Another important feature of this system is that the
investment and maintenance cost is just ten percent of
adding a wet ESP after FGD.
In the system D, the ESP also has an obvious effect
on particle collection of the wet FGD. The particles at the
ESP outlet are almost fully charged and the FGD acts as
charged-scrubber. Fig. 36 compares accumulated charge
numbers at the FGD inlet and at the FGD outlet. It could
be found that the charge numbers of particles decrease
when it passes through the FGD in all diameter ranges.
Fig. 37 gives the respective measurement of PM10 and
PM2.5 emission. The mass ratio of PM2.5 to PM10
increases when the flue gas passes through the FGD,
which indicates that PM10 collection efficiency in FGD
is better than PM2.5. It may attribute to the aerosol
formation during the SO2 scrubbing that dominates in the
diameter below 1.5 μm. This conclusion is proved by the
corresponding grade emission including particulate
number concentration and mass accumulation shown in
Fig. 38. Both of the particulate number and accumulated
mass of PM2.5 are increased when the flue gas passing
through the FGD. The time averaged PM2.5 emission
increases from 0.67 to 1.53 mg/Nm3, although the PM10
emission decreases from 9.33 to 3.38 mg/Nm3. So the
optimization of the relationship between ESP and FGD
should be studied further to decrease the fine particle
emission, especially for the aerosols. Wang et al., once
recommended that the effective way to decrease the
PM2.5 emission at the FGD outlet is decreasing the gas
temperature at the FGD inlet to below 110°C [126].
Fig. 36. The accumulated charge numbers at the inlet and outlet of
the FGD of a 330MW generator.
Fig. 37. The mass ratio of PM2.5 to PM10 emission when the flue
gas passes through a FGD of a 330MW generator [126].
Fig. 38. The grade particulate number emission (a) and grade accumulated mass emission (b) at the ESP outlet and FGD outlet of a 330 MW
generator [126].
0.001
0.01
0.1
1
10
0.1 1 10
1.E+00
1.E+01
1.E+02
1.E+03
1.E+04
1.E+05
1.E+06
0.1 1 10
ESP:330MW&110˚C
PM10: 9.33 mg/Nm3
PM2.5: 0.67 mg/Nm3
FGD:330MW&60˚C
PM10: 3.38 mg/Nm3
PM2.5: 1.53 mg/Nm3
Particle Diameter / μm
Nu
mb
er C
on
cen
trati
on
/ 1
/cm
3
Particle Diameter / μm
Mass
Acc
um
ula
tion
/ m
g/N
m3
ESP:330MW&110˚C
PM10: 9.33 mg/Nm3
PM2.5: 0.67 mg/Nm3
FGD:330MW&60˚C
PM10: 3.38 mg/Nm3
PM2.5: 1.53 mg/Nm3
(a) (b)
Huang et al. 91

VI. CONCLUSION
In this review, the history and principle of ESP are
presented, and the modern ESP techniques developed for
fine particle control are discussed in detail, such as
electric agglomeration, gas flow visualization with PIV,
modern power source, moving electrode ESP and colder-
side ESP. A novel ESP index model with empirical
relationship between particle emission, ESP size and
power source has been introduced in detail, and
industrially applied in China for sizing and upgrading
ESPs to match the new national emission regulations.
Based on over 50 ESPs’ upgrading data with the
generators ranging from 250 to 600 MW, the ESP index
value (Ea∙Ep∙SCA) of 1300 (kV/cm)2 (m
2/m
3/s) is needed
to realize the emission concentration of 10-30 mg/Nm3
under various ash content situations. For the colder-side
ESPs, the voltage-current characteristics can be easily
used for sizing ESP and/or designing the power source.
By optimizing the rapping, the particle emission can be
controlled to be less than 5mg/Nm3 when the index is
around 900 (kV/cm)2 (m
2/m
3/s). Besides, a new advanced
flue gas cleaning system, in which an economizer was
installed between air preheater and colder-side ESP, was
developed and applied successfully in over ten generators
with an important advantage that the investment and
maintenance cost is just ten percent of adding a wet ESP
after FGD.
ACKNOWLEDGMENT
The authors are grateful to the Chinese 863 program
(No.2013AA065001 & No.2013AA065005), NSFC
grants (21276232, 41476080 & 51377145) and the
Program for Zhejiang Leading Team of S&T Innovation
(grant No.2013TD07) for their financial supports.
REFERENCES
[1] O. T. Lodge, "On Lord Rayleigh's dark plane," Nature, vol. 28,
pp. 297-299, 1883.
[2] F. G. Cottrell, "Art of separating suspended particles from
gaseous bodies," .U.S. Patent. 895729, August 11, 1908.
[3] W. A. Schmidt, "The control of dust in Portland cement
manufacture by the Cottrell precipitation processes," in Proc. 8th
International Congress of Applied Chemistry, 1912, vol. 5, pp.
117-124.
[4] C. Cooper and F. C. Alley, Air pollution control: a design
approach, 4th Ed., Waveland press, 2010; pp. 163-169.
[5] W. Deutsch, "Allgemeine Theorie der Vorgänge in Stromkreisen"
(in German), Archiv für Elektrotechnik, vol. 6, pp. 225-262, 1918.
[6] X. Y. Zhang, Y. Q. Wang, T. Niu, X. C. Zhang, S. L. Gong, Y. M.
Zhang, and J. Y. Sun, "Atmospheric aerosol compositions in
China: Spatial/temporal variability, chemical signature, regional
haze distribution and comparisons with global aerosols,"
Atmospheric Chemistry and Physics, vol. 12, pp. 779-799, 2012.
[7] R. J. Huang, Y. Zhang, C. Bozzetti, K. F. Ho, J. J. Cao, Y. Han, K.
R. Daellenbach, J. G. Slowik, S. M. Platt, F. Canonaco, P. Zotter,
R. Wolf, S. M. Pieber, E. A. Bruns, M. Crippa, G. Ciarelli, A.
Piazzalunga, M. Schwikowski, G. Abbaszade, J. Schnelle-Kreis,
R. Zimmermann, Z. An, S. Szidat, U. Baltensperger, I. El
Haddad, and A. S. Prévôt, "High secondary aerosol contribution
to particulate pollution during haze events in China," Nature, vol.
514, pp. 218-222, 2014.
[8] Emission standard of air pollutants for thermal power plants,
GB13223-2011, published in July 29, 2011 (in Chinese).
[9] China ESP Association in 2013.
[10] K. Yan, "Environmental Applications of Plasmas," in Low
Temperature Plasma Technology: Methods and Applications, P.
K. Chu and X.-P. Lu, Ed., CRC Press, 2013, p. 313.
[11] S. Li, X. Li, Y. Huang, Z. Liu, and K. Yan,"Fly Ash Resistivity:
Influencing Factors, Predicting Models and Its Impacts on
Electrostatic Precipitator Performance," in Fly Ash, Sources,
Applications and Potential Environmental Impacts, P. K. Sarker,
Ed., Nova Science Publishers, 2014, pp. 91-144.
[12] A. Marquard, J. Meyer, and G. Kasper, "Characterization of
unipolar electrical aerosol chargers-Part I. A review of charger
performance criteria," Journal of Aerosol Science, vol. 37, pp.
1052-1068, 2006.
[13] A. Marquard, J. Meyer, and G. Kasper, "Characterization of
unipolar electrical aerosol chargers-Part II:. Application of
comparison criteria to various types of nanoaerosol charging
devices," Journal of Aerosol Science, vol. 37, pp. 1069-1080,
2006.
[14] M. Moisio, "Real time distribution measurements of combustion
aerosols," Ph.D. dissertation, Tampere University of Technology,
Publication 279, Tampere, Finland, 1999.
[15] S. H. Huang and C. C. Chen, "Ultrafine aerosol penetration
through electrostatic precipitators," Environmental Science and
Technology, vol. 36, pp. 4625-4632, 2002.
[16] J. Podliński, M. Kocik, R. Barbucha, A. Niewulis, J. Mizeraczyk,
and A. Mizuno, "3D PIV measurements of the EHD flow
patterns in a narrow lectrostatic precipitator with wire-plate or
wire-flocking electrodes," Czechoslovak Journal of Physics, vol.
56, pp. B1009-B1016, 2006.
[17] J. Podliński, J. Dekowski, J. Mizeraczyk, D. Brocilo, and J. S.
Chang, "Electrohydrodynamic gas flow in a positive polarity
wire-plate electrostatic precipitator and the related dust particle
collection efficiency," Journal of Electrostatics, vol. 64, pp. 259-
262, 2006.
[18] A. Mizuno, "Electrostatic precipitation," IEEE Transactions on
Dielectrics and Electrical Insulation, vol. 7, pp. 615-624, 2000.
[19] H. H. Yi, J. M. Hao, L. Duan, X. H. Li, and X. M. Guo,
"Influence of Dust Catchers on PM10 Emission Characteristics
of Power Plants" (in Chinese), Environmental Science, vol. 27,
pp. 1921-1925, 2006.
[20] H. J. White, Industrial electrostatic precipitation, Addison-
Wesley, 1963, p.297
[21] S. Oglesby and G. B. Nichols, Electrostatic precipitation, Dekker,
1978, pp.84-132.
[22] C. Paulson, Precipitator sizing methods in Applied Electrostatic
Precipitation, K.R. Parker, Ed. Springer, 1996, pp. 254-258.
[23] S. Matts and P. O. Ohnfeldt, "Efficient gas cleaning with SF
electrostatic precipitators," Svenska Fliiktfabriken Report, vol. 6,
pp. 105-22, 1963.
[24] M. Robinson, "A modified deutsch efficiency equation for
electrostatic precipitation," Atmospheric Environment, vol. 1, pp.
193-204, 1967.
[25] P. Cooperman, "A new theory of precipitator efficiency,"
Atmospheric Environment, vol. 5, pp. 541-551, 1971.
[26] G. Cooperman, "A unified efficiency theory for electrostatic
precipitators," Atmospheric Environment, vol. 18, pp. 277-285,
1984.
[27] G. Leonard, M. Mitchner, and S. A. Self, "Particle transport in
electrostatic precipitators," Atmospheric Environment, vol. 14, pp.
1289-1299, 1980.
[28] Z. B. Zhao and G. Q. Zhang, "Investigations of the collection
efficiency of an electrostatic precipitator with turbulent effects,"
Aerosol Science and Technology, vol. 20, pp. 169-176, 1994.
[29] S. H. Kim and K. W. Lee, "Experimental study of electrostatic
precipitator performance and comparison with existing
theoretical prediction models," Journal of Electrostatics, vol. 48,
pp. 3-25, 1999.
[30] X. R. Zhang, L. Z. Wang, and K.Q. Zhu, "An analysis ofa wire-
plate electrostatic precipitator," Journal of Aerosol Science, vol.
33, pp. 1595-1600, 2002.
92 International Journal of Plasma Environmental Science & Technology, Vol.9, No.2, OCTOBER 2015

[31] P. L. Feldman, "Effects of particle size distribution on the
performance of electrostatic precipitators," in Proceedings of
68th Air Pollution Control Association Conference, Air Pollution
Control Association, Pittsburgh, PA, 1975, Paper No. 75-02-3.
[32] C. Riehle and F. Löfer, "Grade efficiency and Eddy diffusivity
models," Journal of Electrostatics, vol. 34, pp. 401-413, 1995.
[33] H. Bai, C. Lu, and C. Chung Liang, "A model to predict the
system performance of an electrostatic precipitator for collecting
polydisperse particles," Journal of the Air and Waste
Management Association, vol. 45, pp. 908-916, 1995.
[34] S. H. Kim, H. S. Park, and K. W. Lee, "Theoretical model of
electrostatic precipitator performance for collecting polydisperse
particles," Journal of Electrostatics, vol. 50, pp. 177-190, 2001.
[35] F. J. Gutiérrez Ortiz, B. Navarrete, and L. Cañadas, "Dimensional
analysis for assessing the performance of electrostatic
precipitators," Fuel Processing Technology, vol. 91, pp. 1783-
1793, 2010.
[36] G. Y. Lin, T. M. Chen, and C. J. Tsai, "A modified Deutsch-
Anderson equation for predicting the nanoparticle collection
efficiency of electrostatic Precipitators," Aerosol and Air Quality
Research, vol. 12, pp. 697-706, 2012.
[37] J. B. Zhu, "Fine particle collection with electrostatic
precipitation," Ph.D. dissertation, Zhejiang University, Hangzhou,
China, 2010.
[38] K. Adamiak, "Numerical models in simulating wire-plate
electrostatic precipitators: A review," Journal of Electrostatics,
vol. 71, pp. 673-680, 2013.
[39] M. R. Talaie, "Mathematical modeling of wire-duct single-stage
electrostatic precipitators," Journal of Hazardous Materials, vol.
124, pp. 44-52, 2005.
[40] T. Yamamoto, Y. Morita, H. Fujishima, and M. Okubo, "Three-
dimensional EHD simulation for point corona electrostatic
precipitator based on laminar and turbulent models," Journal of
Electrostatics, vol. 64, pp. 628-633, 2006.
[41] H. Fujishima, Y. Morita, M. Okubo, and T. Yamamoto,
"Numerical simulation of three-dimensional
electrohydrodynamics of spiked-electrode electrostatic
precipitators," IEEE Transactions on Dielectrics and Electrical
Insulation, vol. 13, pp. 160-166, 2006.
[42] G. Skodras, S. P. Kaldis, D. Sofialidis, O. Faltsi, P. Grammelis,
and G. P. Sakellaropoulos, "Particulate removal via electrostatic
precipitators - CFD simulation," Fuel Processing Technology,
vol. 87, pp. 623-631, 2006.
[43] Y. N. Chun, J. S. Chang, A. A. Berezin, and J. Mizeraczyk,
"Numerical modeling of near corona wire electrohydrodynamic
flow in a wire-plate electrostatic precipitator," IEEE
Transactions on Dielectrics and Electrical Insulation, vol. 14, pp.
119-124, 2007.
[44] L. Zhao and K. Adamiak, "Numerical simulation of the
electrohydrodynamic flow in a single wire-plate electrostatic
precipitator," IEEE Transactions on Industry Applications, vol.
44, pp. 683-691, 2008.
[45] H. Lei, L. Z. Wang, and Z. N. Wu, "EHD turbulent flow and
Monte-Carlo simulation for particle charging and tracing in a
wire-plate electrostatic precipitator," Journal of Electrostatics,
vol. 66, pp. 130-141, 2008.
[46] K. Adamiak and P. Atten, "Numerical simulation of the 2-D gas
flow modified by the action of charged fine particles in a single-
wire ESP," IEEE Transactions on Dielectrics and Electrical
Insulation, vol. 16, pp. 608-614, 2009.
[47] N. Neimarlija, I. Demirdžić, and S. Muzaferija, "Finite volume
method for calculation of electrostatic fields in electrostatic
precipitators," Journal of Electrostatics, vol. 67, pp. 37-47, 2009.
[48] S. M. E. Haque, M. G. Rasul, A. V. Deev, M. M. K. Khan, and N.
Subaschandar, "Flow simulation in an electrostatic precipitator of
a thermal power plant," Applied Thermal Engineering, vol. 29,
pp. 2037-2042, 2009.
[49] S. M. E. Haque, M. G. Rasul, M. M. K. Khan, A. V. Deev, and N.
Subaschandar, "Influence of the inlet velocity profiles on the
prediction of velocity distribution inside an electrostatic
precipitator," Experimental Thermal and Fluid Science, vol. 33,
pp. 322-328, 2009.
[50] N. Farnoosh, K. Adamiak, and G. S. P. Castle, "3-D numerical
analysis of EHD turbulent flow and mono-disperse charged
particle transport and collection in a wire-plate ESP," Journal of
Electrostatics, vol. 68, pp. 513-522, 2010.
[51] N. Farnoosh, K. Adamiak, and G. S. P. Castle, "Three-
dimensional analysis of electrohydrodynamic flow in a spiked
electrode-plate electrostatic precipitator," Journal of
Electrostatics, vol. 69, pp. 419-428, 2011.
[52] N. Farnoosh, K. Adamiak and G. S. P. Castle, "Numerical
calculations of submicron particle removal in a spike-plate
electrostatic precipitator," IEEE Transactions on Dielectrics and
Electrical Insulation, vol. 18, pp. 1439-1452, 2011.
[53] Z. Long, Q. Yao, Q. Song, and S. Li, "Three-dimensional
simulation of electric field and space charge in the advanced
hybrid particulate collector," Journal of Electrostatics, vol. 67,
pp. 835-843, 2009.
[54] Z. Long, Q. Yao, Q. Song, and S.Q. Li, "A second-order accurate
finite volume method for the computation of electrical conditions
inside a wire-plate electrostatic precipitator on unstructured
meshes," Journal of Electrostatics, vol. 67, pp. 597–604, 2009.
[55] Z. Long and Q. Yao, "Evaluation of various particle charging
models for simulating particle dynamics in electrostatic
precipitators," Journal of Aerosol Science, vol. 41, pp. 702-718,
2010.
[56] B. S. Choi and C. A. J. Fletcher, "Computation of particle
transport in an electrostatic precipitator," Journal of
Electrostatics, vol. 40-41, pp. 413-418, 1997.
[57] J. Podlinski, A. Niewulis, J. Mizeraczyk, and P. Atten, "ESP
performance for various dust concentration," in Proc. of 5eme
Conf. de la Societe Francaise d’Electrostatique, Grenoble, 2006,
pp. 109-113.
[58] A. Mizuno, "Electrostatic precipitation," IEEE Transactions on
Dielectrics and Electrical Insulation, vol. 7, pp. 615-624, 2000.
[59] R. Meij and H. Te Winkel, "The emissions and environmental
impact of PM10 and trace elements from a modern coal-fired
power plant equipped with ESP and wet FGD," Fuel Processing
Technology, vol. 85, pp. 641-656, 2004.
[60] S. Masuda and J. D. Moon, "Electrostatic precipitation of carbon
soot from diesel engine exhaust," IEEE Transactions on Industry
Applications, vol. 19, pp. 1104-1111, 1983.
[61] T. Watanabe and T. Suda, "Submicron size carbonic particle
agglomeration by an electrostatic agglomeration apparatus," in
Proc. 3rd International Aerosol Conference, Kyoto, Japan, 1990,
vol. 2, pp.749-752.
[62] T. Watanabe, F. Tochikubo, Y. Koizurni, T. Tsuchida, J.
Hautanen, and E. I. Kauppinen, "Submicron particle
agglomeration by an electrostatic agglomerator," Journal of
Electrostatics, vol. 34, pp. 367-383, 1995.
[63] S. Kanazawa, T. Ohkubo, Y. Nomoto, and T. Adachi,
"Submicron particle agglomeration and precipitation by using a
bipolar charging method," Journal of Electrostatics, vol. 29, pp.
193-209, 1993.
[64] J. Hautanen, M. Kilpelainen, E. I. Kauppinen, J. Jokiniemi, and K.
Lehtinen, "Electrical agglomeration of aerosol particles in an
alternating electric field," Aerosol Science and Technology, vol.
22, pp. 181-189, 1995.
[65] J. Kildeso, V. K. Bhatia, L. Lind, E. Johnson, and A. Johansen,
"An experimental investigation for agglomeration of aerosols in
alternating electric fields," Aerosol Science and Technology, vol.
23, pp. 603-610, 1995.
[66] A. Laitinen, J. Hautanen, J. Keskinen, E. Kauppinen, J. Jokiniemi,
and K. Lehtinen, "Bipolar charged aerosol agglomeration with
alternating electric field in laminar gas flow," Journal of
Electrostatics, vol. 38, pp. 303-315, 1996.
[67] J. S. Chang, P. C. Looy, C. Webster, A. A. Berezin, A. Zukeran,
and T. Ito, "The collection of fine particles by an electrostatic
precipitator with quadrupole prechargers," in Proc. 7th
International Conference on Electrostatic Precipitation, Kyongju,
Korea, 1998, pp. 620–627.
[68] Y. S. Kim, J. B. Lee, J. Hwang, and K. S. Park, "An experimental
study of electrical agglomeration of fine particles in an
alternating electric field," in Prod. 7th International Conference
on Electrostatic Precipitation, Kyongju, Korea, 1998, pp. 179–
187.
[69] A. Zukeran, Y. Ikeda, Y. Ehara, T. Ito, T. Takahashi, H.
Kawakami, and T. Takamatsu, "Agglomeration of particles by ac
corona discharge," Electrical Engineering in Japan, vol. 130, pp.
30-37, 2000.
Huang et al. 93

[70] J. H. Ji, J. Hwang, G. N. Bae, and Y. G. Kim, "Particle charging
and agglomeration in DC and AC electric fields," Journal of
Electrostatics, vol. 61, pp. 57-68, 2004.
[71] R. Crynack, R. Truce, and Wallis Harrison, "Indigo particle
agglomerators reduce mass and visible emissions on coal fired
boilers in the US," presented at the 10th international conference
of electrostatic precipitator, Australia 2006, 12A1.
[72] R. Truce, J. Wilkins, R. Crynack, and W. Harrison. "Enhanced
fine particle collection using the indigo agglomerator," presented
at the 10th international conference of electrostatic precipitator,
Australia 2006, 6A2.
[73] J. Zhu, X. Zhang, W. Chen, Y. Shi, and K. Yan, "Electrostatic
precipitation of fine particles with a bipolar pre-charger," Journal
of Electrostatics, vol. 68, pp. 174-178, 2010.
[74] J. Mizeraczyk, M. Kocik, and J. Podliński, "Flow diagnostics
using particle image velocimetry method," Proc. SPIE 6598,
Laser Technology VIII: Applications of Lasers, 2006, pp.
65980W-65980W-9.
[75] J. Mizeraczyk, M. Kocik, J. Dekowski, M. Dors, J. Podliński, T.
Ohkubo, S. Kanazawa, and T. Kawasaki, "Measurements of the
velocity field of the flue gas flow in an electrostatic precipitator
model using PIV method," Journal of Electrostatics, vol. 51-52,
pp. 272-277, 2001.
[76] J. Podliński, J. Dekowski, J. Mizeraczyk, D. Brocilo, and J. S.
Chang, "Electrohydrodynamic gas flow in a positive polarity
wire-plate electrostatic precipitator and the related dust particle
collection efficiency," Journal of Electrostatics, vol. 64, pp. 259-
262, 2006.
[77] J. Podlinski, A. Niewulis, J. Mizeraczyk, and P. Atten, "ESP
performance for various dust densities," Journal of Electrostatics,
vol. 66, pp. 246-253, 2008.
[78] J. Mizeraczyk, J. Dekowski, J. Podliński, M. Kocik, T. Ohkubo,
and S. Kanazawa, "Laser Flow Visualization and Velocity Fields
by Particle Image Velocimetry in an Electrostatic Precipitator
Model," Journal of Visualization, vol. 6, pp. 125-133, 2003.
[79] J. Podlinski, J. Dekowski, M. Kocik, J. Mizeraczyk, and J. S.
Chang, "Measurement of the flow velocity field in multi-field
wire-plate electrostatic precipitator," Czechoslovak Journal of
Physics, vol. 54, pp. C922-C930, 2004.
[80] J. Podliński, J. Dekowski, J. Mizeraczyk, D. Brocilo, K.
Urashima, and J. S. Chang, "EHD flow in a wide electrode
spacing spike-plate electrostatic precipitator under positive
polarity," Journal of Electrostatics, vol. 64, pp. 498-505, 2006.
[81] J. Podliński, A. Niewulis, and J. Mizeraczyk,
"Electrohydrodynamic flow and particle collection efficiency of
a spike-plate type electrostatic precipitator," Journal of
Electrostatics, vol. 67, pp. 99-104, 2009.
[82] A. Niewulis, A. Berendt, J. Podliński, and J. Mizeraczyk,
"Electrohydrodynamic flow patterns and collection efficiency in
narrow wire-cylinder type electrostatic precipitator," Journal of
Electrostatics, vol. 71, pp. 808-814, 2013.
[83] A. Niewulis, J. Podliński, M. Kocik, R. Barbucha, J. Mizeraczyk,
and A. Mizuno, "EHD flow measured by 3D PIV in a narrow
electrostatic precipitator with longitudinal-to-flow wire electrode
and smooth or flocking grounded plane electrode," Journal of
Electrostatics, vol. 65, pp. 728-734, 2007.
[84] A. Niewulis, J. Podliński, and J. Mizeraczyk,
"Electrohydrodynamic flow patterns in a narrow electrostatic
precipitator with longitudinal or transverse wire electrode,"
Journal of Electrostatics, vol. 67, pp. 123-127, 2009.
[85] J. Podlinski, A. Niewulis, and J. Mizeraczyk, "Electrohydronamic
turbulent flow in a wide-plate electrostatic precipitator measured
by 3D PIV method," in Proc. of 11th International Conference
on Electrostatic Precipitation, Hangzhou, China, 2008, pp. 134-
139.
[86] J. Podlinski, A. Niewulis, and J. Mizeraczyk,
"Electrohydrodynamic flow in a wire-plate non-thermal plasma
reactor measured by 3D PIV method," European Physical
Journal D, vol. 54, pp. 153-158, 2009.
[87] J. Podliński, M. Kocik, R. Barbucha, A. Niewulis, J. Mizeraczyk,
and A. Mizuno, "3D PIV measurements of the EHD flow
patterns in a narrow lectrostatic precipitator with wire-plate or
wire-flocking electrodes," Czechoslovak Journal of Physics, vol.
56, pp. B1009-B1016, 2006.
[88] D. J. Bayless, M. K. Alam, R. Radcliff, and J. Caine, "Membrane-
based wet electrostatic precipitation," Fuel Processing
Technology, vol. 85, pp. 781-798, 2004.
[89] K. S. Poulsen and C. R. Lund, "Reduction of fine particulate
emission from ESPs," in Proc. of 11th International Conference
for Electrostatic Precipitation, Australia, 2006.
[90] X. J. Shen, S. L. Wang, P. Han, Q. Z. Zheng, Y. X. Zeng, and K.
Yan, "Visualization measurements of submicron particle
movement inside an electrostatic precipitator" (in Chinese)
Journal of Zhejiang University (Engineering Science), vol. 49,
pp. 1-8, 2015.
[91] X. J. Shen, Q. Z. Zheng, Z. Y. Ning, S. L. Wang, P. Han and K.
Yan, "PM10 and PM2.5 emission control by electrostatic
precipitator (ESP) for coal-fired power plants IV: Investigations
on electrostatic precipitation by means of 2D PIV technique" (in
Chinese), Science & Technology Review, vol. 32, pp. 43-50,
2014.
[92] K. Parker, Electrical operation of electrostatic precipitators.
IEEE Power and Energy Series 41, ISBN 0852961375, 2003, pp.
120-122, pp. 157-159, p. 200, p. 212.
[93] B. W. Zhang, R. H. Wang, and K. Yan, "Industrial applications of
three-phase t/r for upgrading ESP performance," in Proc. of 11th
International Conference on Electrostatic Precipitation, 2008, pp.
276-280.
[94] J. Zhu, Q. Zhao, Y. Yao, S. Luo, X. Guo, X. Zhang, Y. Zeng, and
K. Yan, "Effects of high-voltage power sources on fine particle
collection efficiency with an industrial electrostatic precipitator,"
Journal of Electrostatics, vol. 70, pp. 285-291, 2012.
[95] J. Stackelberg and R. W. Toenisvorst, "The three-phase power
supply for low ripple high voltage in conventional technology,"
in Proc. of 13th International Conference on Electrostatic
Precipitation, 2014.
[96] N. Grass, W. Hartmann, and M. Klöckner, "Application of
different types of high-voltage supplies on industrial electrostatic
precipitators," IEEE Transactions on Industry Applications, vol.
40, pp. 1513-1520, 2004.
[97] N. Grass, M. Steingraeber, and R. Metz, "A new mobile IGBT
inverter HV test system for electrostatic precipitators," in
Conference Record - IAS Annual Meeting (IEEE Industry
Applications Society), 2010.
[98] K. Porle, "Reduced emission and energy consumption with pulsed
energization of electrostatic precipitators," Journal of
Electrostatics, vol. 16, pp. 299-314, 1985.
[99] J. K. Nelson and L. Salasoo, "Impact of pulse energization on
electrostatic precipitation performance," IEEE transactions on
Electrical Insulation, vol. EI-22, pp. 657-675, 1988.
[100] H. S. B. Elayyan, A. Bouziane, and R. T. Waters, "Theoretical
and experimental investigation of a pulsed ESP," Journal of
Electrostatics, vol. 56, pp. 219-234, 2002.
[101] H. J. Jorgensen, "Method of controlling intermittent voltage
supply to an electrostatic precipitator," US Patent 4626261, 1986.
[102] S. Masuda, "A Pulse Voltage Source for Electrostatic
Precipitation," Conference Record IEEE/IAS 1978 Annual
Meeting. Toronto, Ontario.
[103] S. Masuda and S. Hosokawa, "Pulse energization system of
electrostatic precipitator for retrofitting application," IEEE
Transactions on Industry Applications, vol. 24, pp. 708-716,
1988.
[104] A. Zukeran, P. C. Looy, A. Chakrabarti, A. A. Berezin, S.
Jayaram, J. D. Cross, T. Ito, and J. S. Chang, "Collection
efficiency of ultrafine particles by an electrostatic precipitator
under dc and pulse operating modes," IEEE Transactions on
Industry Applications, vol. 35, pp. 1184-1191, 1999.
[105] W. Hartmann, M. Römheld, and K. D. Rohde, "High-efficiency
high-voltage pulse generator based on a fast recovery
pseudospark switch," IEEE Transactions on Plasma Science, vol.
28, pp. 1481-1485, 2000.
[106] S. L. Wang, Y. Chen, P. Han, G. Q. Zhang, Q. Z. Zheng, X. J.
Shen, S. R. Li, and K. P. Yan, "PM10 and PM2.5 emission
control by electrostatic precipitator (ESP) for coal-fired power
plants I: ESP sizing and applications" (in Chinese), Science &
Technology Review, vol. 32, pp. 23-33, 2014
[107] B. M. Song and W. L. Wu, "Power supply of ESP based on
magnetic pulse compression" (in Chinese), High Voltage
Engineering, vol. 32, pp. 60-62, 2006.
94 International Journal of Plasma Environmental Science & Technology, Vol.9, No.2, OCTOBER 2015

[108] T. Misaka, T. Oura, and M. Yamazaki, "Improvement of
reliability for moving electrode type electrostatic precipitator," in
Proc. of 10th International Conference on Electrostatic
Precipitation, Australia, 2006.
[109] A. Bäck, "Enhancing ESP efficiency for high resistivity fly ash
by reducing the flue gas temperature," in Proc. of 11th
International Conference on Electrostatic Precipitation, China,
2008, pp. 406-411.
[110] L. Q. Qi, Y. T. Yuan, and Y. W. Shi, "Influence of SO3 on
electrostatic precipitation of fine particles in flue gas" (in
Chinese), Journal of Chinese Society of Power Engineering, vol.
7, pp. 539-543, 2011.
[111] D. J. Bayless, A. R. Khan, S. Tanneer, and R. Birru, "An
alternative to additional SO3 injection for fly ash conditioning,"
Journal of the Air and Waste Management Association, vol. 50,
pp. 169-174, 2000.
[112] E. Alvarez, J. Blanco, C. Knapp, J. Olivares, and L. Salvador,
"Pilot plant performance of a SO2 to SO3 oxidation catalyst for
flue-gas conditioning," Catalysis Today, vol. 59, pp. 417-422,
2000.
[113] A. N. Zagoruiko, S. V. Vanag, B. S. Balzhinimaev, E. A.
Paukshtis, L. G. Simonova, A. M. Zykov, S. N. Anichkov, and N.
D. Hutson, "Catalytic flue gas conditioning in electrostatic
precipitators of coal-fired power plants," Chemical Engineering
Journal, vol. 154, pp. 325-332, 2009.
[114] A. Zagoruiko, B. Balzhinimaev, S. Vanag, V. Goncharov, S.
Lopatin, A. Zykov, S. Anichkov, Y. Zhukov, V. Yankilevich, N.
Proskokov, and N. Hutson, "Novel catalytic process for flue gas
conditioning in electrostatic precipitators of coal-fired power
plants," Journal of the Air and Waste Management Association,
vol. 60, pp. 1002-1008, 2010.
[115] S. Shanthakumar, D. N. Singh, and R. C. Phadke, "Flue gas
conditioning for reducing suspended particulate matter from
thermal power stations," Progress in Energy and Combustion
Science, vol. 34, pp. 685-695, 2008.
[116] K. Porle, S. Srinivasachar and B. R. Pease, "Design of
eledctrostatic precipitators after pulverized coal boilers firing low
sulfur coals," in Proc. of 7th International Conference on
Electrostatic Precipitation, 1998, pp. 602-612.
[117] H. Fujishima, Y. Tsuchiya, and S. Onishi, "Colder side
electrostatic precipitator for advanced flue gas treatment system
for coal-fired boiler," in Proc. of 7th International Conference on
Electrostatic Precipitation, 1998, pp. 542-549.
[118] G. Q. Chen, "Dust control technologies under the new emission
standard for thermal power plants" (in Chinese), Science &
Technology Review, vol. 28, pp. 90-95, 2010.
[119] J. G. Li and Y. Liu, "The effect of compositions of domestic
coal on the performance of ESP and an evaluation of ESP
adaptability" (in Chinese), Science & Technology Review, vol. 28,
pp. 104-109, 2010.
[120] S. L. Wang, "PM10 and PM2.5 emission control by electrostatic
precipitator (ESP) for coal-fired power plants II: Evaluation of
ESP Upgrading in Terms of PM10 and PM2.5 Emission
Reduction with a 660 MW generator" (in Chinese), Science &
Technology Review, vol. 32, pp. 34-39, 2014.
[121] A. F. Stein and R. D. Saylor, "Sensitivities of sulfate aerosol
formation and oxidation pathways on the chemical mechanism
employed in simulations," Atmospheric Chemistry and Physics,
vol. 12, pp. 8567-8574, 2012.
[122] J. S. Chang, "Next generation integrated electrostatic gas
cleaning systems," Journal of Electrostatics, vol. 57, pp. 273-291,
2003.
[123] A. Wang, Q. Song, G. M. Tu, H. Wang, Y. Yue, and Q. Yao,
"Influence of flue gas cleaning system on characteristics of
PM2.5 emission from coal-fired power plants," International
Journal of Coal Science and Technology, vol. 1, pp. 4–12, 2014.
[124] R. Meij and H. Te Winkel, "The emissions and environmental
impact of PM10 and trace elements from a modern coal-fired
power plant equipped with ESP and wet FGD," Fuel Processing
Technology, vol. 85, pp. 641-656, 2004.
[125] H. Fujishima, N. Maekawa, S. Ohnishi, and H. Fujitani, "Novel
electrostatic precipitation technologies in Japan - colder side ESP
and new wet-type ESP application for boiler facilities," MEGA
symposium, Chicago, Illinois, USA, 2001, pp. 1-17.
[126] S. L. Wang, Y. Chen, P. Han, B. Xu, Z. Z. Li, Z. W. Guo, Q. Z.
Zheng, X. J. Shen, S. R. Li, and K. P. Yan, "PM10 and PM2.5
emission control by electrostatic precipitator (esp) for coal-fired
power plants III: Application with 330 MW Power Plant" (in
Chinese), Science & Technology Review, vol. 32, pp. 39-42,
2014.
Huang et al. 95