Embed Size (px)
Citation preview

UMTRI-2011-46 DECEMBER 2011
RECENT MAJOR IMPROVEMENTS IN ROAD
SAFETY IN THE U.S.: CHANGES IN THE
FREQUENCY OF CRASHES OR THE SEVERITY
OF THE OUTCOME OF CRASHES?
MICHAEL SIVAK
BRANDON SCHOETTLE

RECENT MAJOR IMPROVEMENTS IN ROAD SAFETY IN THE U.S.:
CHANGES IN THE FREQUENCY OF CRASHES OR
THE SEVERITY OF THE OUTCOME OF CRASHES?
Michael Sivak
Brandon Schoettle
The University of Michigan
Transportation Research Institute
Ann Arbor, Michigan 48109-2150
U.S.A.
Report No. UMTRI-2011-46
December 2011
i
Technical Report Documentation Page
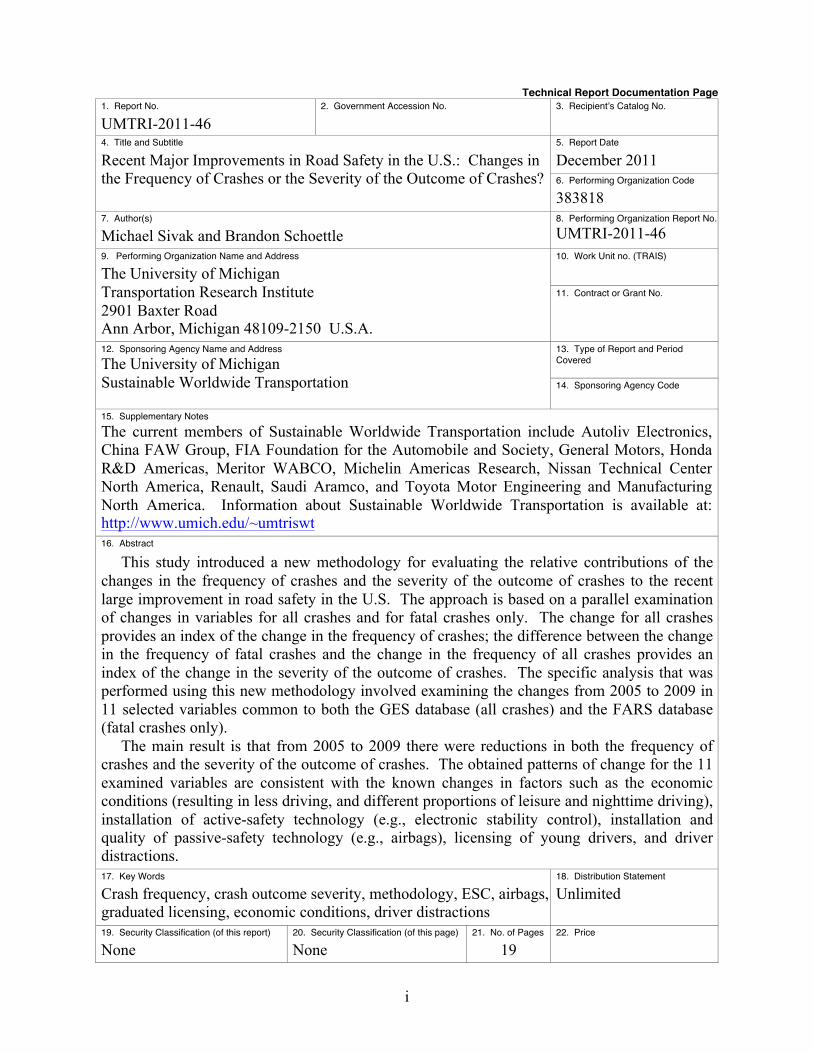
1. Report No.
UMTRI-2011-46
2. Government Accession No.
3. Recipientʼs Catalog No.
4. Title and Subtitle
Recent Major Improvements in Road Safety in the U.S.: Changes in
the Frequency of Crashes or the Severity of the Outcome of Crashes?
5. Report Date
December 2011
6. Performing Organization Code
383818
7. Author(s)
Michael Sivak and Brandon Schoettle
8. Performing Organization Report No. UMTRI-2011-46
9. Performing Organization Name and Address
The University of Michigan
Transportation Research Institute
2901 Baxter Road Ann Arbor, Michigan 48109-2150 U.S.A.
10. Work Unit no. (TRAIS)
11. Contract or Grant No.
12. Sponsoring Agency Name and Address The University of Michigan
Sustainable Worldwide Transportation
13. Type of Report and Period
Covered
14. Sponsoring Agency Code
15. Supplementary Notes
The current members of Sustainable Worldwide Transportation include Autoliv Electronics,
China FAW Group, FIA Foundation for the Automobile and Society, General Motors, Honda
R&D Americas, Meritor WABCO, Michelin Americas Research, Nissan Technical Center
North America, Renault, Saudi Aramco, and Toyota Motor Engineering and Manufacturing
North America. Information about Sustainable Worldwide Transportation is available at: http://www.umich.edu/~umtriswt
16. Abstract
This study introduced a new methodology for evaluating the relative contributions of the
changes in the frequency of crashes and the severity of the outcome of crashes to the recent
large improvement in road safety in the U.S. The approach is based on a parallel examination
of changes in variables for all crashes and for fatal crashes only. The change for all crashes
provides an index of the change in the frequency of crashes; the difference between the change
in the frequency of fatal crashes and the change in the frequency of all crashes provides an
index of the change in the severity of the outcome of crashes. The specific analysis that was
performed using this new methodology involved examining the changes from 2005 to 2009 in
11 selected variables common to both the GES database (all crashes) and the FARS database
(fatal crashes only).
The main result is that from 2005 to 2009 there were reductions in both the frequency of
crashes and the severity of the outcome of crashes. The obtained patterns of change for the 11
examined variables are consistent with the known changes in factors such as the economic
conditions (resulting in less driving, and different proportions of leisure and nighttime driving),
installation of active-safety technology (e.g., electronic stability control), installation and
quality of passive-safety technology (e.g., airbags), licensing of young drivers, and driver
distractions.
17. Key Words
Crash frequency, crash outcome severity, methodology, ESC, airbags,
graduated licensing, economic conditions, driver distractions
18. Distribution Statement
Unlimited
19. Security Classification (of this report)
None
20. Security Classification (of this page)
None
21. No. of Pages
19
22. Price

ii
Acknowledgments
This research was supported by Sustainable Worldwide Transportation
(http://www.umich.edu/~umtriswt). The current members of Sustainable Worldwide
Transportation include Autoliv Electronics, China FAW Group, FIA Foundation for the
Automobile and Society, General Motors, Honda R&D Americas, Meritor WABCO,
Michelin Americas Research, Nissan Technical Center North America, Renault, Saudi
Aramco, and Toyota Motor Engineering and Manufacturing North America.

iii
Contents
Acknowledgments ........................................................................................................................... ii
Introduction ..................................................................................................................................... 1
Method ............................................................................................................................................ 3
Results and Discussion ................................................................................................................... 4
Summary ....................................................................................................................................... 15
References ..................................................................................................................................... 16

1
Introduction
Road safety in many countries has improved greatly over the past five years. For
example, in the U.S., road fatalities dropped from 43,510 in 2005 to 32,788 in 2010—a
reduction of 25% (NHTSA, 2011a). Our previous research began an examination of
factors that have contributed to this unprecedented reduction. That research suggested
that a large part of the improvement is likely a consequence of the current economic
downturn that has affected both the amount and the type of driving in the U.S. (Sivak,
2009; Sivak and Schoettle, 2010).
In this study, we are posing the following fundamental question: Is the recent
improvement in road safety due to a reduced frequency of crashes, decreased severity of
the outcome of crashes, or both? Understanding the roles of these two aspects of crashes
is important because the two aspects are dependent on different mechanisms. For
example, active-safety interventions influence primarily (but not exclusively) the
frequency of crashes, while passive-safety interventions influence primarily the severity
of the outcome of crashes.
To answer the question posed above, we will simultaneously examine two
databases: one that includes crashes of all severities (GES1), and another that includes
fatal crashes only (FARS2). Data for two years will be analyzed: 2005 (the recent peak in
fatal crashes), and 2009 (the latest year for which both GES and FARS data are currently
available.) Possible outcomes of the analysis, given the improvements in road safety
from 2005 to 2009, are conceptually outlined in Table 1.
1 GES (General Estimates System) provides weighted estimates of crash frequencies for the entire country
that are based on a nationally representative sample of police-reported crashes of all types, ranging from
minor to fatal. 2 FARS (Fatal Analysis Reporting System) is a census of all police-reported crashes in which at least one
person dies within 30 days as a result of the crash.

2
Table 1
Possible outcomes of GES and FARS analyses, given the improvements in road safety
from 2005 to 2009.
Parameter change from
2005 to 2009 Expected pattern of change from 2005 to 2009
Frequency of
crashes
Severity of the
outcome GES FARS
Reduction No change Fewer crashes Fewer fatal crashes; a reduction
of the same magnitude as in GES
No change Reduction No change Fewer fatal crashes
Reduction Reduction Fewer crashes
Fewer fatal crashes; a reduction
of a greater magnitude than in
GES
Reduction Increase Fewer crashes
Fewer fatal crashes; a reduction
of a smaller magnitude than in
GES, or…
No change in fatal crashes, or…
More fatal crashes
Increase Reduction More crashes
More fatal crashes; an increase
of a smaller magnitude than in
GES, or…
No change in fatal crashes, or…
Fewer fatal crashes
We will use the change from 2005 to 2009 in all crashes (ΔGES) as an index of
the changes in the frequency of crashes. The difference between the change from 2005 to
2009 in fatal crashes and the change in all crashes (ΔFARS minus ΔGES) will be used as
an index of the change in the severity of the outcome of crashes. For example, let us
assume that for a given variable, the change in all crashes (ΔGES) is -10%, and the
change in fatal crashes (ΔFARS) is -15%. In this case, the change in the frequency of
crashes is -10%, and the change in the severity of the outcome of crashes is -5%.
This research is a follow up to Sivak and Schoettle (2010). In that study, we
examined the changes in the distributions of all variables in FARS from 2005 to 2008. In
this study, we analyzed the changes in several variables that have identical or similar
descriptions in both the FARS and GES databases. We compared crashes in 2005 and
2009.
3
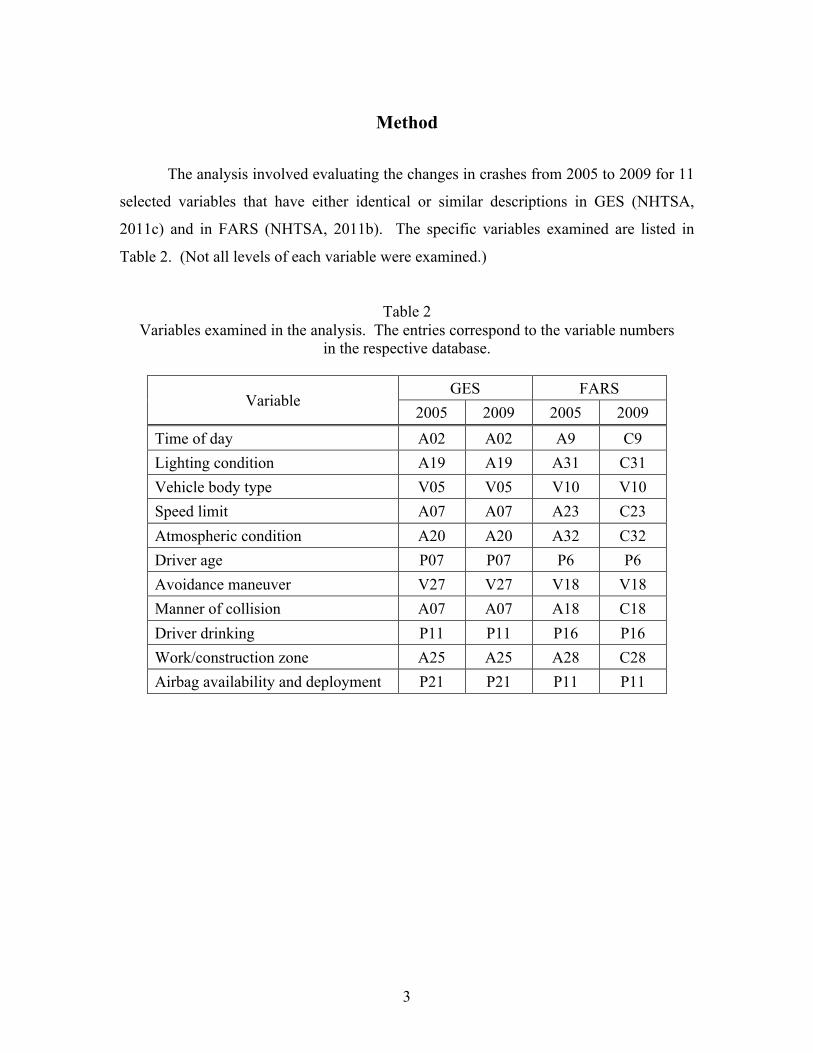
Method
The analysis involved evaluating the changes in crashes from 2005 to 2009 for 11
selected variables that have either identical or similar descriptions in GES (NHTSA,
2011c) and in FARS (NHTSA, 2011b). The specific variables examined are listed in
Table 2. (Not all levels of each variable were examined.)
Table 2
Variables examined in the analysis. The entries correspond to the variable numbers
in the respective database.
Variable GES FARS
2005 2009 2005 2009
Time of day A02 A02 A9 C9
Lighting condition A19 A19 A31 C31
Vehicle body type V05 V05 V10 V10
Speed limit A07 A07 A23 C23
Atmospheric condition A20 A20 A32 C32
Driver age P07 P07 P6 P6
Avoidance maneuver V27 V27 V18 V18
Manner of collision A07 A07 A18 C18
Driver drinking P11 P11 P16 P16
Work/construction zone A25 A25 A28 C28
Airbag availability and deployment P21 P21 P11 P11
4
Results and Discussion
Overall changes
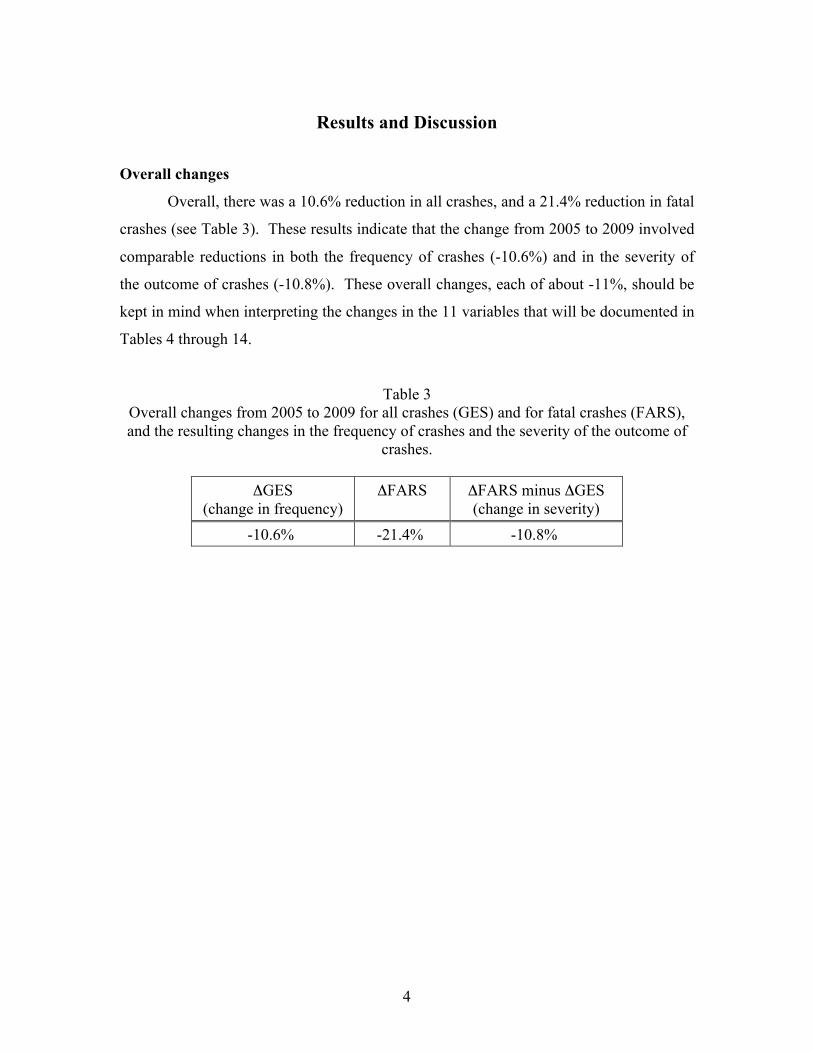
Overall, there was a 10.6% reduction in all crashes, and a 21.4% reduction in fatal
crashes (see Table 3). These results indicate that the change from 2005 to 2009 involved
comparable reductions in both the frequency of crashes (-10.6%) and in the severity of
the outcome of crashes (-10.8%). These overall changes, each of about -11%, should be
kept in mind when interpreting the changes in the 11 variables that will be documented in
Tables 4 through 14.
Table 3
Overall changes from 2005 to 2009 for all crashes (GES) and for fatal crashes (FARS),
and the resulting changes in the frequency of crashes and the severity of the outcome of
crashes.
ΔGES
(change in frequency)
ΔFARS
ΔFARS minus ΔGES
(change in severity)
-10.6% -21.4% -10.8%

5
Time of day
Table 4 lists the changes from 2005 to 2009 by time of day. As indicated in
Table 4, the reductions in both the frequency of crashes and the severity of the outcome
of crashes were present at all times of the day. The reductions in the frequency of crashes
reflect, in part, the overall decrease in driving due to the current economic downturn
(FHWA, 2011). The reduction in the frequency of crashes was greatest for the morning
rush hours (-14.2%), consistent with decreased employment. On the other hand, the
reduction in the severity of the outcome of crashes was greatest for early afternoon
(-15.1%), possibly due to a disproportionate reduction in pedestrian crashes (generally
very serious crashes) during the lunch hour and at the end of the school day.
Table 4
Changes from 2005 to 2009 for all crashes (GES) and for fatal crashes (FARS),
by time of day.
Time of day ΔGES
(change in frequency)
ΔFARS
ΔFARS minus ΔGES
(change in severity)
12:00 - 2:59 a.m. -12.3% -20.8% -8.5%
3:00 - 5:59 a.m. -12.6% -15.9% -3.3%
6:00 - 8:59 a.m. -14.2% -28.0% -13.8%
9:00 - 11:59 a.m. -10.4% -21.6% -11.2%
12:00 - 2:59 p.m. -6.3% -21.4% -15.1%
3:00 - 5:59 p.m. -11.3% -25.4% -14.1%
6:00 - 8:59 p.m. -10.2% -18.9% -8.7%
9:00 - 11:59 p.m. -12.9% -19.3% -6.4%
The possible mechanisms mentioned in this section, and in the sections to come,
are listed only as examples of mechanisms that could contribute to the observed changes
in the frequency and/or the severity of the outcome of crashes. No attempt was made to
comprehensively identify all possible mechanisms that underlie all observed changes.

6
Lighting condition
Changes by lighting condition are documented in Table 5. The largest reduction
in the frequency of crashes was for crashes in dark (-20.6%). It is likely that this effect is
a consequence of the reduced amount of leisure driving because of the current economic
conditions. (Leisure driving is done more often at night than is commuter driving.) On
the other hand, the largest reduction in the severity of the outcome was for crashes in
daylight (-12.6%).
Table 5
Changes from 2005 to 2009 for all crashes (GES) and for fatal crashes (FARS),
by lighting condition.
Lighting condition ΔGES
(change in frequency)
ΔFARS
ΔFARS minus ΔGES
(change in severity)
Daylight -10.2% -22.8% -12.6%
Dark -20.6% -25.5% -4.9%
Dark but lighted -7.3% -12.2% -4.9%
Dawn/Dusk -15.8% -24.2% -8.4%

7
Vehicle body type
Changes by vehicle body type are summarized in Table 6. All major types
showed decreases in both the frequency of crashes and the severity of the outcome of
crashes. However, for motorcycles, these reductions were small (-1.0% and -2.2%,
respectively). The reductions in the frequency of crashes involving heavy trucks (single-
unit and truck-tractor) were greater than the reductions for light-duty vehicles
(automobiles, pickups, SUVs, and minivans), likely reflecting less truck shipping because
of the economic downturn. However, the reductions in the severity of the outcome of
crashes were greater for light-duty vehicles than for heavy trucks. This is likely because
of more improvements in both active and passive safety recently in light-duty vehicles
than in heavy vehicles. Furthermore, given that in 2009 there were fewer crashes
involving heavy trucks (which tend to be more severe, and they generally involve light-
duty vehicles too), the remaining crashes involving light-duty vehicles would be expected
to be less severe in 2009.
Table 6
Changes from 2005 to 2009 for all crashes (GES) and for fatal crashes (FARS),
by vehicle body type.
Vehicle body type ΔGES
(change in frequency)
ΔFARS
ΔFARS minus ΔGES
(change in severity)
Automobile -13.0% -26.3% -13.3%
Pickup, SUV, or
minivan -8.0% -21.2% -13.2%
Motorcycle -1.0% -3.2% -2.2%
Single-unit truck -27.7% -34.1% -6.4%
Truck-tractor -31.4% -36.9% -5.5%

8
Speed limit
Table 7 presents the changes by speed limit. The reductions in both the frequency
of crashes and the severity of the outcome of crashes increased with speed limit. Both
trends are consistent with a decrease in leisure driving due to economic factors: Leisure
travel tends to occur at higher speeds than commuter travel, and leisure travel is more
risky than commuter travel because of increased involvement of both alcohol and
nighttime driving. However, the changes in the frequency of crashes did not vary greatly;
they ranged from -10.7% for 5–25 mph to -12.7% for 50–75 mph. On the other hand, the
changes in the severity of the outcome of crashes showed a greater range, from -2.6% for
5–25 mph to -11.0% for 50–75 mph. The large reduction in the severity of crashes at
high speeds is consistent with the large reduction in the frequency of crashes involving
heavy trucks (see Table 6). (Heavy trucks tend to accumulate a greater proportion of
travel at high speeds than do light-duty vehicle, and heavy-truck crashes tend to be more
severe.)
Table 7
Changes from 2005 to 2009 for all crashes (GES) and for fatal crashes (FARS),
by speed limit.
Speed limit ΔGES
(change in frequency)
ΔFARS
ΔFARS minus ΔGES
(change in severity)
5–25 mph -10.7% -13.3% -2.6%
30–45 mph -10.9% -19.4% -8.5%
50–75 mph -12.7% -23.7% -11.0%

9
Atmospheric condition
Table 8 lists the changes by atmospheric condition. Crashes in snow showed the
largest reduction in frequency (-31.5%), but their outcome became more severe (+4.9%).
On the other hand, crashes in rain became more numerous (+6.3%), but their outcome
showed the largest reduction in severity (-23.3%). Crashes in sleet and fog became less
numerous (-15.1% and -29.5%, respectively), but the severity of their outcome stayed
approximately the same (-1.2% and -1.3%, respectively). In no adverse weather, crashes
became less numerous and with less severe outcomes (-12.1% and -9.2%, respectively).
The increase in the frequency of crashes in rain is consistent with the fact that
rainfall throughout the country in 2009 was generally greater than in 2005 (NOAA,
2011a). Similarly, the large decrease in the frequency of crashes in snow is likely due to
the fact that in 2009 a larger area of the country experienced no snow than was the case in
2005 (NOAA, 2011b).
Table 8
Changes from 2005 to 2009 for all crashes (GES) and for fatal crashes (FARS),
by atmospheric condition.
Atmospheric
condition ΔGES
(change in frequency)
ΔFARS
ΔFARS minus ΔGES
(change in severity)
No adverse weather -12.1% -21.3% -9.2%
Rain +6.3% -17.0% -23.3%
Snow -31.5% -26.6% +4.9%
Sleet -15.1% -16.3% -1.2%
Fog -29.5% -30.8% -1.3%

10
Driver age
In terms of the frequency of crashes by driver age (Table 9), the largest reduction
was for those between 16 and 20 years of age (-19.6%), possibly as a consequence of (a)
improved graduated-licensing programs (e.g., Fell, Jones, Romano, and Voas, 2011), and
(b) the current economic downturn and higher gasoline prices reducing leisure driving by
young people the most (because of their more limited discretionary budget). All age
groups showed reductions in the severity of the outcome of crashes, with the largest
reduction for those between 56 and 65 years of age (-16.0%).
Table 9
Changes from 2005 to 2009 for all crashes (GES) and for fatal crashes (FARS),
by driver age.
Driver age* ΔGES
(change in frequency)
ΔFARS
ΔFARS minus ΔGES
(change in severity)
16-20 -19.6% -30.7% -11.1%
21-25 -16.2% -29.8% -13.6%
26-35 -13.9% -24.4% -10.5%
36-45 -14.6% -27.0% -12.4%
46-55 -5.6% -17.5% -11.9%
56-65 +4.6% -11.4% -16.0%
66-75 +0.6% -12.2% -12.8%
76-85 -6.1% -16.6% -10.5%
* Drivers under 16 and over 85 were not included in the analysis because of their small
numbers in both databases.

11
Avoidance maneuver
Table 10 presents the changes by avoidance maneuver. The frequency of crashes
with no avoidance maneuver increased (+8.5%), possibly reflecting an increase in driver
distractions. However, the severity of the outcome of these types of crashes decreased
(-38.4%). A similar pattern was evident for crashes with braking only (+2.9% and
-26.3%, respectively). On the other hand, for crashes when steering was performed, both
the frequency of crashes and the severity of the outcome of crashes were reduced (-23.0%
and -3.6%, respectively). A similar pattern was present for crashes with both steering
and braking (-23.9% and -6.3%, respectively). The findings of a reduced frequency of
crashes and a reduced severity of the outcome of crashes with steering (with or without
braking) are consistent with the increased penetration of electronic stability control (ESC)
on new vehicles.
Table 10
Changes from 2005 to 2009 for all crashes (GES) and for fatal crashes (FARS),
by avoidance maneuver.
Avoidance
maneuver ΔGES
(change in frequency)
ΔFARS
ΔFARS minus ΔGES
(change in severity)
None +8.5% -29.9% -38.4%
Steering -23.0% -26.6% -3.6%
Braking +2.9% -23.4% -26.3%
Steering and
braking -23.9% -30.2% -6.3%

12
Manner of collision
Crash changes by manner of collision are listed in Table 11. Front-to-front
crashes became more numerous (+4.3%), possibly due to an increase in driver
distractions. However, the severity of the outcome of these types of crashes decreased
(-28.7%), possibly because of lower speeds (see Table 7) and improved occupant
protection. For the remaining types of crashes, both the frequency and the severity of the
outcome decreased.
Table 11
Changes from 2005 to 2009 for all crashes (GES) and for fatal crashes (FARS),
by manner of collision.
Manner of
collision ΔGES
(change in frequency)
ΔFARS
ΔFARS minus ΔGES
(change in severity)
Not a collision
(single vehicle) -8.3% -17.1% -8.8%
Front-to-rear -5.0% -23.3% -18.3%
Front-to-front +4.3% -24.4% -28.7%
Angle -20.3% -30.5% -10.2%
Sideswipe -8.3% -20.4% -12.1%

13
Driver drinking
Table 12 presents information on the changes in the role of alcohol in crashes.
Drivers in crashes who were reported to be drinking were less numerous in 2009 than in
2005 (-18.5%), but the severity of the outcome of crashes with drivers reported to be
drinking increased (+4.4%).
Table 12
Changes from 2005 to 2009 for all crashes (GES) and for fatal crashes (FARS),
by driver drinking.
Driver drinking ΔGES
(change in frequency)
ΔFARS
ΔFARS minus ΔGES
(change in severity)
Yes -18.5% -14.1% +4.4%
No -13.5% -25.8% -12.3%
Unknown +10.0% n/a n/a
Work/construction zone
As shown in Table 13, crashes in work/construction zones were less numerous in
2009 than in 2005 (-42.7%), likely reflecting the decrease in road maintenance due to
economic factors. However, the severity of the outcome of these types of crashes
increased (+4.0%).
Table 13
Changes from 2005 to 2009 for all crashes (GES) and for fatal crashes (FARS),
by work zone.
Work zone ΔGES
(change in frequency)
ΔFARS
ΔFARS minus ΔGES
(change in severity)
Yes -42.7% -38.7% +4.0%
No -9.8% -21.0% -11.2%

14
Airbag availability and deployment
As shown in Table 14, crashes in which no airbags were available were fewer in
2009 than in 2005 (-47.2%), and with less severe outcome (-7.4%). On the other hand,
crashes in which an airbag deployed increased in frequency (+3.8%), but the severity of
their outcome decreased (-12.0%). This pattern is consistent with the increased
availability of airbags (and especially of side-impact airbags) and their improvement.
Finally, crashes in which an available airbag did not deploy increased in frequency, but
the severity of their outcome decreased (+42.3% and -16.0%, respectively), consistent
with a decreased frequency of crashes at high speeds (see Table 7).
Table 14
Changes from 2005 to 2009 for all crashes (GES) and for fatal crashes (FARS),
by airbag availability and deployment.
Airbag ΔGES
(change in frequency)
ΔFARS
ΔFARS minus ΔGES
(change in severity)
Not available -47.2% -54.6% -7.4%
Deployed +3.8% -8.2% -12.0%
Available but did
not deploy +42.3% +26.3% -16.0%

15
Summary
This study introduced a new methodology for evaluating the relative contributions
of the changes in the frequency of crashes and the severity of the outcome of crashes to
the recent large improvement in road safety in the U.S. The approach is based on a
parallel examination of changes in variables for all crashes and for fatal crashes only.
The change for all crashes provides an index of the change in the frequency of crashes;
the difference between the change in the frequency of fatal crashes and the change in the
frequency of all crashes provides an index of the change in the severity of the outcome of
crashes. The specific analysis that was performed using this new methodology involved
examining the changes from 2005 to 2009 in 11 selected variables common to both the
GES database (all crashes) and the FARS database (fatal crashes only).
The main result is that from 2005 to 2009 there were reductions in both the
frequency of crashes and the severity of the outcome of crashes. The obtained patterns of
change for the 11 examined variables are consistent with the known changes in factors
such as the economic conditions (resulting in less driving, and different proportions of
leisure and nighttime driving), installation of active-safety technology (e.g., electronic
stability control), installation and quality of passive-safety technology (e.g., airbags),
licensing of young drivers, and driver distractions.

16
References
Fell, C. J., Jones, K., Romano, E., and Voas, R. (2011). An evaluation of graduated
driver licensing effects on fatal crash involvements of young drivers in the United
States. Traffic Injury Prevention, 12, 423-431.
FHWA [Federal Highway Administration]. (2011). Monthly volume trends. Available
at: http://www.fhwa.dot.gov/policyinformation/travel_monitoring/tvt.cfm
NHTSA [National Highway Traffic Safety Administration]. (2011a). Early estimates of
motor vehicle traffic fatalities in 2010 (Report No. DOT HS 811 451).
Washington, D.C.: Author.
NHTSA [National Highway Traffic Safety Administration]. (2011b). Fatality Analysis
Reporting System (Versions June 13, 2006 and September 2, 2010). Available at:
http://www-fars.nhtsa.dot.gov
NHTSA [National Highway Traffic Safety Administration] (2011c). General Estimates
System (Versions August 23, 2006 and June 28, 2010). Available at:
ftp://ftp.nhtsa.dot.gov/GES/
NOAA [National Oceanic and Atmospheric Administration]. (2011a). U.S. snow
monitoring snowfall maps. Available at:
http://gis.ncdc.noaa.gov/maps/snowfall.map
NOAA [National Oceanic and Atmospheric Administration]. (2011b). U.S. climate at a
glance. Available at:
http://lwf.ncdc.noaa.gov/oa/climate/research/cag3/cag3.html
Sivak, M. (2009). Mechanisms involved in the recent large reductions in U.S. road
fatalities. Injury Prevention, 15, 205-206.
Sivak M. and Schoettle, B. (2010). Toward understanding the recent large reductions in
U.S. road fatalities (Report No. 2010-12). Ann Arbor: The University of
Michigan Transportation Research Institute.