Embed Size (px)
Citation preview

Monetary Authority of Singapore Economic Policy Group
RECENT ECONOMIC DEVELOPMENTS IN SINGAPORE 6 June 2014
2013 2014
Q2 Q3 Q4 Full Year Q1
Real Sector
Real GDP Growth, y-o-y % 4.0 5.0 4.9 3.9 4.9
Real GDP Growth, q-o-q saar % 10.2 0.7 6.9 - 2.3
Index of Industrial Production, y-o-y % 0.8 5.2 7.1 1.7 9.9
Non-oil Domestic Exports, y-o-y % -5.2 -3.6 -2.1 -6.0 -1.0
Labour Market and Prices
Unemployment Rate, sa, % (Average) 2.0 1.8 1.8 1.9 2.1
CPI-All Items Inflation, y-o-y % 1.6 1.8 2.0 2.4 1.0
Wage Growth, y-o-y % 4.0 3.3 4.7 4.3 3.2
The Singapore economy recorded slower growth in Q1 2014
GDP growth eased to 2.3% q-o-q saar (quarter-on-quarter seasonally-adjusted annualised rate) in Q1 2014, down from 6.9% in the preceding quarter. The moderation in growth was largely on account of a slowdown in the external-oriented services sectors, which reflected some weakness in regional demand and renewed uncertainties in global financial markets.
The global recovery is on track, despite a transitory setback in Q1
The G3 economies turned in a mixed performance in Q1 2014, due in part to one-off factors. While adverse weather conditions depressed economic activity in the US, the impending consumption tax hike in Japan brought forward spending and lifted growth. Asia ex-Japan saw varied outturns as well, partly on account of country-specific factors, such as ongoing reforms in China and political uncertainty in Thailand. Looking ahead, US growth is expected to pick up and underpin the global economic recovery.
Singapore’s GDP growth is expected to come in at 2–4% in 2014
Notwithstanding the slowdown in Q1 2014, the Singapore economy is expected to grow by 2–4% in 2014 as a whole, supported by a gradual improvement in the global economy. Coupled with a pickup in the IT industry, this should bolster Singapore’s external-oriented industries. Nonetheless, downside tail risks arising from vulnerabilities in the external environment remain. In addition, domestic supply-side constraints could cap the extent of the cyclical upturn.
MAS Core Inflation is likely to remain elevated While external price developments should be relatively benign for the rest of the year, domestic cost pressures, particularly stemming from a tight labour market, are likely to remain strong. Taking these factors into account, MAS Core Inflation is expected to stay elevated at 2–3% in 2014. CPI-All Items inflation should be dampened by the weakness in car prices and accommodation cost, and is projected to come in at 1.5–2.5%.

Monetary Authority of Singapore 2 Economic Policy Group
A. External Developments
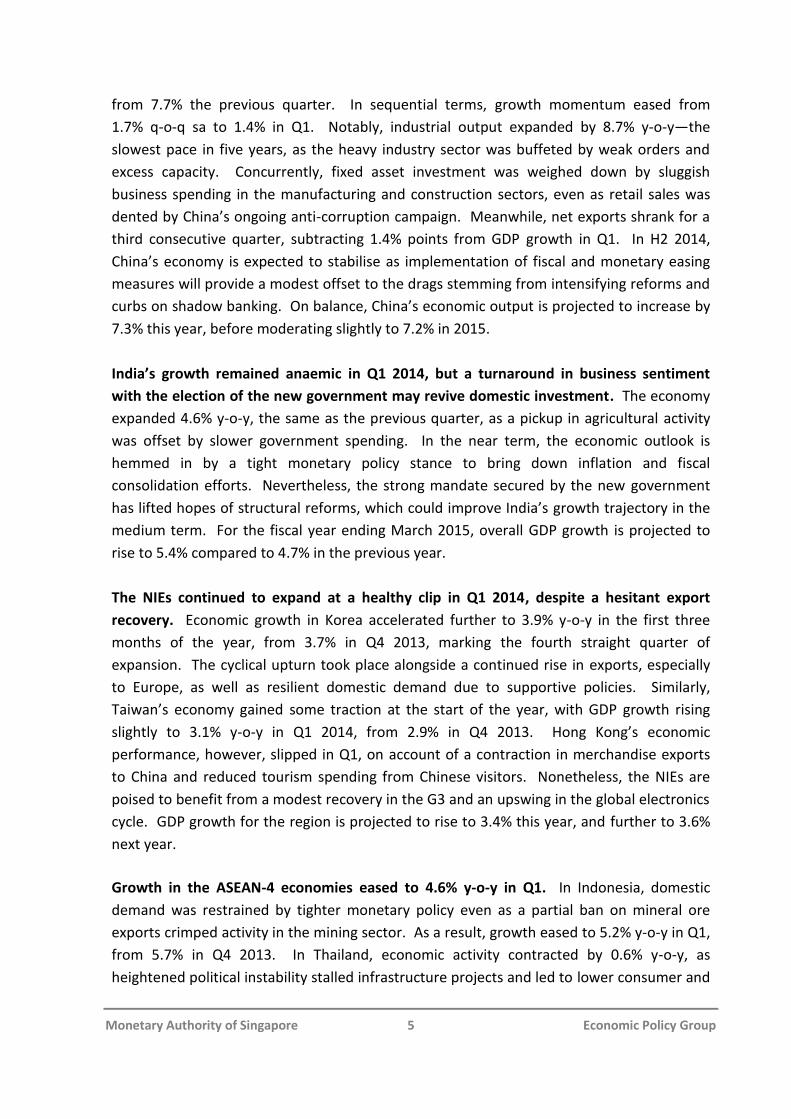
G3 growth moderated in Q1 2014, reflecting weak US economic
activity
Growth in the G3 slowed to 1.1% q-o-q saar in Q1 2014, a step-down from the average pace
of 1.8% over the four quarters of 2013. The lacklustre G3 performance was mainly
attributable to an unexpectedly large contraction in the US, where a severe winter took its
toll on economic activity. In contrast, the Japanese economy surged, boosted by a spike in
spending ahead of a consumption tax hike of 3% points which took effect in April.
Meanwhile, the Eurozone chalked up another quarter of modest growth, extending the
current recovery phase to a full year. On the whole, the G3 economies are still on track to
register stronger growth in the coming quarters, led by a rebound in the US economy.
US GDP growth contracted by 1.0% q-o-q
saar in Q1 2014, after an expansion of 2.6%
in Q4 2013. Activity slowed across the
board, although private consumption
continued to be relatively firm. Household
spending growth came in at 3.1% q-o-q saar
in Q1, a similar pace to the 3.3% recorded
the quarter before, on the back of markedly
higher expenditure on utilities and health
services. Hindered by bad weather,
however, purchases of durable and non-
durable goods expanded at a much slower pace. Meanwhile, gross private investments fell
by 11.7%, its first decline since Q4 2012, with the largest drag stemming from business
inventories. Fixed investment was also weakened by a fall in capex spending across the
board. After registering double-digit growth in Q4 2013, goods exports plunged by
9.8% q-o-q saar in Q1 2014, while imports expanded moderately, leading to a deterioration
in the trade balance. Despite some increase in federal consumption, overall government
spending also subtracted from growth slightly, due to weak state and local government
expenditures.
The pace of economic activity is expected to pick up in Q2, on the back of stronger private
spending. Leading indicators such as the ISM manufacturing PMI improved further to 55.4
in May from 54.9 in April, supported by higher production levels and new orders. Further,
the May services PMI rose to its highest level of 56.3 since August 2013. At the same time,
employment growth in April exceeded expectations—288,000 jobs were added to the
labour market, with gains across all sectors, bringing the unemployment rate down to 6.3%.
However, in the housing sector, the pace of recovery appears to have eased in the past few
2008 2009 2010 2011 2012 2013 2014
-20
-15
-10
-5
0
5
10
15
% Q
OQ
SA
AR
US
Japan
Eurozone
Q1
Growth in the US and Japan diverged in Q1.
Source: Datastream

Monetary Authority of Singapore 3 Economic Policy Group
months as higher mortgage rates slowed new home sales and house price increases.
Nevertheless, the lifting of uncertainty on the policy front contributed to improved
economic sentiment—the Conference Board Consumer Confidence Index rose to 83.0 in
May, from 81.7 the month before. Overall, US GDP growth is expected to pick up from 1.9%
in 2013 to 2.5% in 2014 and 3.1% in 2015.
The Eurozone economy continued to expand in Q1, albeit at a more subdued pace.
Growth slipped to 0.7% q-o-q saar in Q1 2014, slightly lower than the 1.0% expansion in the
preceding quarter. The German economy strengthened further, propping up growth in the
region. However, some of the other major economies in the monetary union experienced
significant setbacks—growth came to a halt in France, while Italy relapsed into a sequential
contraction as uncertainty surrounding the political transition weighed on sentiments. The
rest of the Eurozone did not fare well either, with the Netherlands and Portugal
experiencing particularly sharp declines after expanding at a healthy clip in the previous
quarter.
The ECB has embarked on further monetary easing to encourage bank lending and ward
off deflationary risks. In early June, the central bank reduced its main refinancing rate by
10 basis points and simultaneously cut the rate that banks receive on central bank reserves
to below zero for the first time. To stimulate bank lending to businesses and households,
the ECB also announced targeted longer-term refinancing operations (TLTROs) amounting
to €400 billion. Under the TLTRO programme, banks can obtain funding for up to four years
from the ECB at a concessionary interest rate, provided that they increase their lending by a
stipulated amount during that period. Overall, the Eurozone is projected to grow by 1.1% in
2014, a marked improvement from the 0.4% contraction last year but well below the
region’s historical trend.
Japan’s GDP growth surged in Q1 2014, as domestic demand was boosted by strong
private spending ahead of the tax hike. GDP jumped by 5.9% q-o-q saar in Q1 2014, from a
modest 0.3% in the preceding quarter. Households’ frontloading of consumption
expenditure intensified, bringing private consumption growth to 8.5% in Q1, from 1.5% in
Q4 2013. Meanwhile, private non-residential investment rose by a robust 21%. However,
the buoyancy in domestic demand was partly offset by a negative contribution from net
exports, making it a drag on growth for the third consecutive quarter.
The consumption tax hike is likely to cause a fall-off in Japan’s growth in Q2 2014,
although a reversion to potential in H2 is possible. Past experience suggests that the spurt
in spending in Q1 will be followed by a retrenchment in the immediate aftermath of the tax
increase. In the latter half of the year, growth should regain some momentum, supported
by a tight labour market and positive impulses from a fiscal stimulus package which will

Monetary Authority of Singapore 4 Economic Policy Group
offset part of the effects of the tax hike. For 2014 as a whole, the Japanese economy is
expected to grow by 1.3%, slightly slower than the 1.6% posted in 2013.
Headline CPI inflation in the G3 was little
changed in Q1 2014, although it masked
divergences across countries. While the
Eurozone continued to face mild
disinflationary pressures from excess
capacity and low energy costs, CPI inflation in
both the US and Japan edged up slightly. In
the US, higher transport costs drove headline
inflation to 1.4% in Q1. Japan’s inflation rate
rose from 1.4% in Q4 2013 to 1.5%, as the
core component of the CPI trended upwards,
reflecting a further narrowing of the output gap. As the consumption tax hike will raise
Japan’s headline inflation over the course of the year, average CPI inflation in the G3
economies is projected to come in higher at 1.6% this year, compared to 1.3% in 2013.
Asia ex-Japan turned in a mixed performance in Q1 2014
Asia ex-Japan’s economic performance was
impacted by a host of idiosyncratic factors.
While export growth either remained firm
or picked up in Taiwan, Korea, Malaysia and
the Philippines, other countries did not do
as well—Indonesia, for example faced the
negative effects of the ban on mineral ore
exports. Apart from exports, GDP growth
was also impacted by domestic factors such
as economic restructuring in China and
political unrest in Thailand. The slowdown
in Chinese economic activity spilled over to
Hong Kong, given the latter’s strong linkages
to the mainland. Although sluggish
investment kept GDP growth below 5% for a
second straight financial year in India, there is rising confidence that the newly-elected
government would enact policies which will bolster the country’s economic prospects.
The Chinese economy continued to lose steam in Q1 2014, amid external and domestic
headwinds. Consequently, China’s GDP increased by a slower 7.4% y-o-y in the quarter,
2008 2009 2010 2011 2012 2013 2014
-10
-5
0
5
10
15
% Y
OY
India
China
ASEAN-4*
NIEs*
Q1
2008 2009 2010 2011 2012 2013 2014
-4
-2
0
2
4
6
% Y
OY
US
Japan
Eurozone
Q1
Eurozone inflation continues to fall.
Source: Datastream
Growth in Asia ex-Japan moderated in Q1.
Source: CEIC
* Regional groupings are weighted by Singapore's non-
oil domestic exports (2009-2011 average)
Note: NIEs refers to Hong Kong, Korea and Taiwan
while ASEAN-4 refers to Indonesia, Malaysia, Thailand
and the Philippines
Monetary Authority of Singapore 5 Economic Policy Group
from 7.7% the previous quarter. In sequential terms, growth momentum eased from
1.7% q-o-q sa to 1.4% in Q1. Notably, industrial output expanded by 8.7% y-o-y—the
slowest pace in five years, as the heavy industry sector was buffeted by weak orders and
excess capacity. Concurrently, fixed asset investment was weighed down by sluggish
business spending in the manufacturing and construction sectors, even as retail sales was
dented by China’s ongoing anti-corruption campaign. Meanwhile, net exports shrank for a
third consecutive quarter, subtracting 1.4% points from GDP growth in Q1. In H2 2014,
China’s economy is expected to stabilise as implementation of fiscal and monetary easing
measures will provide a modest offset to the drags stemming from intensifying reforms and
curbs on shadow banking. On balance, China’s economic output is projected to increase by
7.3% this year, before moderating slightly to 7.2% in 2015.
India’s growth remained anaemic in Q1 2014, but a turnaround in business sentiment
with the election of the new government may revive domestic investment. The economy
expanded 4.6% y-o-y, the same as the previous quarter, as a pickup in agricultural activity
was offset by slower government spending. In the near term, the economic outlook is
hemmed in by a tight monetary policy stance to bring down inflation and fiscal
consolidation efforts. Nevertheless, the strong mandate secured by the new government
has lifted hopes of structural reforms, which could improve India’s growth trajectory in the
medium term. For the fiscal year ending March 2015, overall GDP growth is projected to
rise to 5.4% compared to 4.7% in the previous year.
The NIEs continued to expand at a healthy clip in Q1 2014, despite a hesitant export
recovery. Economic growth in Korea accelerated further to 3.9% y-o-y in the first three
months of the year, from 3.7% in Q4 2013, marking the fourth straight quarter of
expansion. The cyclical upturn took place alongside a continued rise in exports, especially
to Europe, as well as resilient domestic demand due to supportive policies. Similarly,
Taiwan’s economy gained some traction at the start of the year, with GDP growth rising
slightly to 3.1% y-o-y in Q1 2014, from 2.9% in Q4 2013. Hong Kong’s economic
performance, however, slipped in Q1, on account of a contraction in merchandise exports
to China and reduced tourism spending from Chinese visitors. Nonetheless, the NIEs are
poised to benefit from a modest recovery in the G3 and an upswing in the global electronics
cycle. GDP growth for the region is projected to rise to 3.4% this year, and further to 3.6%
next year.
Growth in the ASEAN-4 economies eased to 4.6% y-o-y in Q1. In Indonesia, domestic
demand was restrained by tighter monetary policy even as a partial ban on mineral ore
exports crimped activity in the mining sector. As a result, growth eased to 5.2% y-o-y in Q1,
from 5.7% in Q4 2013. In Thailand, economic activity contracted by 0.6% y-o-y, as
heightened political instability stalled infrastructure projects and led to lower consumer and

Monetary Authority of Singapore 6 Economic Policy Group
business spending. While external and domestic demand remained firm in the Philippines,
this was met primarily through a sharp drawdown in inventories. Consequently, the
increase in GDP was more moderate at 5.7%, compared to 6.3% in the previous quarter.
Bucking the regional trend, growth in Malaysia picked up from 5.1% to 6.2% y-o-y,
supported by strong exports and robust private investment.
Growth in the ASEAN-4 economies is expected to moderate to 4.8% this year, from 5.0%
in 2013, with the anticipated pickup in external demand only partially offsetting the
downshift in domestic demand. In Indonesia, domestic demand will remain subdued amid
a tight monetary policy, while the anticipated pickup in exports may be capped by weak
commodity prices. Economic activity in Malaysia will continue to be underpinned by the
ongoing export upturn and a strong pipeline of investments under the Economic
Transformation Programme, which will help to counteract the dampening effects of higher
inflation and tighter financial conditions on domestic demand. While the rollout of
infrastructure projects and currently flush liquidity conditions should sustain economic
activity in the Philippines, rising inflation and concerns over financial imbalances could lead
to a tighter monetary policy that will in turn temper growth. In Thailand, military
intervention has restored a functioning government administration, which could pave the
way for a tentative economic recovery. However, the country is still expected to
underperform relative to the region, and the risk of a further escalation in political tension
remains.
CPI inflation in Asia ex-Japan moderated to
3.4% in Q1 2014, from 4.2% in the previous
quarter. In China and the NIEs, inflation
remained subdued, amid stable commodity
prices and limited demand-side pressures.
While still elevated, inflation in India eased in
Q1 as a result of lower food inflation. In
ASEAN, however, adverse weather
conditions in the Philippines as well as
unfavourable base effects arising from
subsidy rationalisation efforts led to a higher
inflation print. Overall, inflation in Asia ex-
Japan is expected to moderate slightly to
3.7% in 2014 from 3.9% last year, as the
effects of lower food production due to El Niño and narrowing output gaps in the NIEs are
offset by downward price pressures arising from excess capacity in China.
2008 2009 2010 2011 2012 2013 2014
-4
0
4
8
12
16
% Y
OY
India**
ChinaASEAN-4*
NIEs*
Q1
Source: CEIC
* Regional groupings are weighted by 2012 nominal
GDP
** India's series uses CPI (Industrial Workers) prior to
2012
Headline inflation dipped in India and China.

Monetary Authority of Singapore 7 Economic Policy Group
Table 1: Consensus Forecasts of GDP Growth
2012 2013 Forecast
2014 2015
Percent
Industrial
US 2.8 1.9 2.5 3.1
Japan 1.4 1.6 1.3 1.3
Eurozone −0.6 −0.4 1.1 1.4
UK 0.3 1.7 2.9 2.5
NIEs
Hong Kong 1.5 2.9 3.4 3.5
Korea 2.3 3.0 3.6 3.7
Taiwan 1.5 2.1 3.2 3.6
ASEAN
Indonesia 6.3 5.8 5.3 5.8
Malaysia 5.6 4.7 5.1 5.0
Thailand 6.5 2.9 2.3 4.2
Philippines 6.8 7.2 6.4 6.3
China 7.7 7.7 7.3 7.2
India* 4.5 4.7 5.4 6.0
Source: CEIC and Consensus Economics, May 2014 *Refers to fiscal year ending Mar

Monetary Authority of Singapore 8 Economic Policy Group
Growth in the global IT industry slowed in Q1 2014 on the back of
weak US demand
Global chip sales rose by 1.5% q-o-q sa in Q1
2014, less than half the pace of
expansion in the preceding two quarters.
Notwithstanding this moderation, growth in
semiconductor sales appear to be on a
continued, if modest, uptrend since the
trough in mid-2011. Amid broadly supportive
global economic conditions, semiconductor
sales are expected to pick up more briskly
towards the end of the year.
The Q1 2014 slowdown in chip sales reflected
mainly the steep decline in the US market.
This was due in part to inclement weather
conditions, which dampened production
activity and weighed on business confidence.
As a result, electronics spending—particularly
in the corporate segment—retracted
significantly. In contrast, demand in Asia
accounted for the bulk of the growth in chip
sales early this year. However, the increase
stemmed mainly from demand in Asian
countries outside China, as the latter saw a
slowdown in retail sales of IT products.
Turning to supply-side developments,
semiconductor inventories rose further in Q1
2014, following an uptick in Q4 2013. The
increase in stockpiles likely occurred as a
result of over-production for the year-end
holiday season and weaker-than-expected
consumption appetite, alongside tepid
investment demand. Nonetheless, barring
severe negative shocks in demand conditions,
concerns over a significant inventory
overhang is unlikely to materialise. Notably,
consolidation among major DRAM players in
2013 Q2 Q3 Q4 2014
-4
-2
0
2
4
6
% P
oin
t C
ontr
ibution t
o Q
OQ
SA
Gro
wth Asia Pacific Japan Europe Americas
Q1
Q12004 2006 2008 2010 2012 2014
-3
-2
-1
0
1
2
-30
-20
-10
0
10
20
QO
Q S
A %
Gro
wth
QO
Q S
A %
Gro
wth
Global Chip Sales(LHS)
Foreign GDP(RHS)
Q1
0.40
0.41
0.42
0.43
0.44
0.45
0.46
0.47
0.48
2011 2012 2013 2014
US
$
Q1
Global chip sales growth slowed in Q1 2014.
Source: Semiconductor Industry Association, CEIC
and EPG, MAS estimates
Source: Semiconductor Industry Association and
EPG, MAS estimates
The average global selling price of semiconductors was flat in Q1 2014.
Source: WSTS
Demand in Asia remained strong, which offset the decline in revenues in the US.
Monetary Authority of Singapore 9 Economic Policy Group
the sector should help stabilise supply conditions. Against this backdrop, semiconductor
prices levelled off in Q1 2014 following two straight quarters of gains.
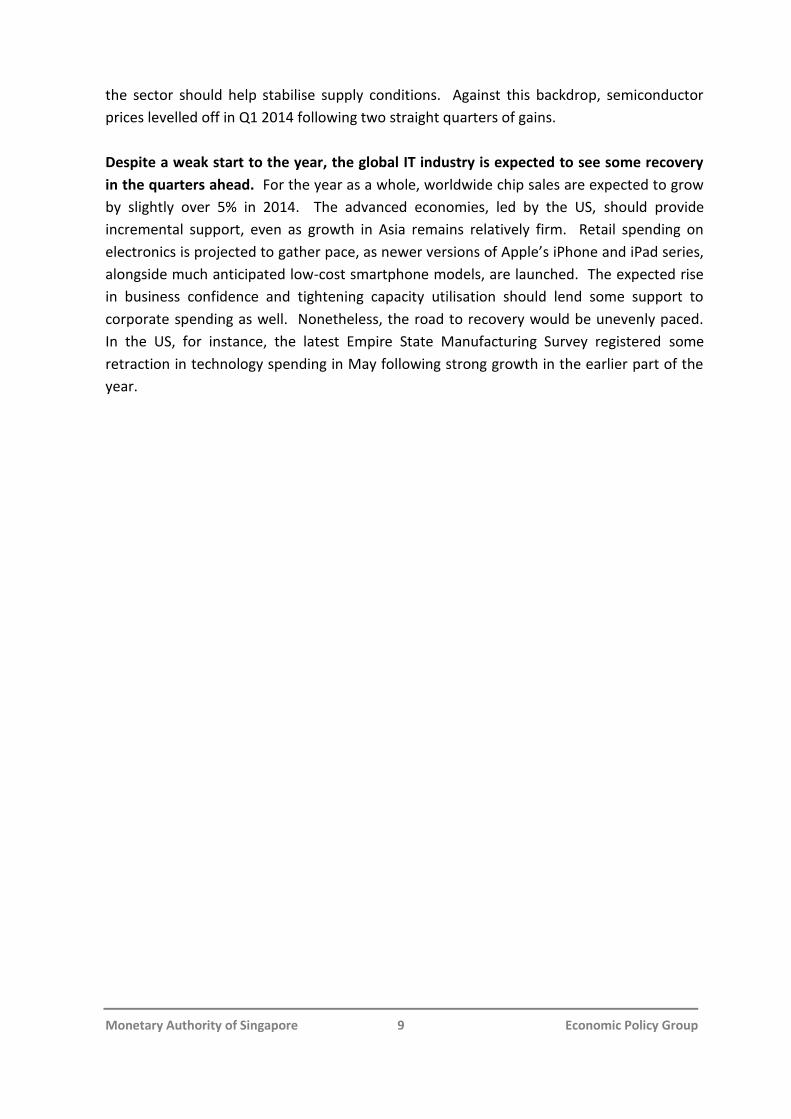
Despite a weak start to the year, the global IT industry is expected to see some recovery
in the quarters ahead. For the year as a whole, worldwide chip sales are expected to grow
by slightly over 5% in 2014. The advanced economies, led by the US, should provide
incremental support, even as growth in Asia remains relatively firm. Retail spending on
electronics is projected to gather pace, as newer versions of Apple’s iPhone and iPad series,
alongside much anticipated low-cost smartphone models, are launched. The expected rise
in business confidence and tightening capacity utilisation should lend some support to
corporate spending as well. Nonetheless, the road to recovery would be unevenly paced.
In the US, for instance, the latest Empire State Manufacturing Survey registered some
retraction in technology spending in May following strong growth in the earlier part of the
year.

Monetary Authority of Singapore 10 Economic Policy Group
B. Domestic Developments
The Singapore economy posted a moderate expansion in Q1 2014
The Singapore economy slowed in Q1 2014, with GDP rising by 2.3% q-o-q saar, compared
to 6.9% in the previous quarter. Most of the trade-related industries saw some pullback in
Q1 2014. Concomitantly, sectors dependent on domestic demand slowed, partly reflecting
weaker activity in private sector construction and softer demand for real estate services.
The manufacturing sector recorded strong
gains in Q1 2014, rising by 11.9% q-o-q saar,
following an increase of a similar magnitude
in the preceding quarter. The robust
performance was largely on account of a
surge in pharmaceutical output. Abstracting
from this typically volatile segment, there
were broad-based retractions across the rest
of the manufacturing sector. In particular,
the domestic electronics cluster shrank in
Q1, following four straight quarters of
sequential expansion, due in part to
inclement weather conditions in the US which dampened both consumer and corporate
demand. Sharp contractions were seen in the data storage, PC peripherals and info-
communication & consumer electronics segments. Within the transport engineering
cluster, marine & offshore engineering also experienced a pullback in output even as order
books remained healthy for the year. In contrast, the chemicals cluster grew at a healthy
clip, largely on the back of capacity expansion within the petrochemicals segments.
Notwithstanding the stellar performance of the manufacturing sector, the trade-related
services industries weakened. The slowdown in the US and China had taken a toll on the
wholesale trade sector in Q1 2014, as reflected by the contraction in re-exports to these
two economies. The moderation in wholesale activity in turn weighed on the transport and
storage sector.
Meanwhile, the financial services sector ceded some momentum in Q1 2014 and
expanded by 3.5% q-o-q saar, down from a buoyant 26.0% in the previous quarter. The
marked step-down in growth was largely due to a pullback in the sentiment-sensitive
clusters, as global financial markets retracted on a resurgence of jitters over possible risk
events. These included a sharper-than-expected slowdown in China triggered by a crisis in
the shadow banking sector, a disorderly unwinding of quantitative easing and the attendant
2012 Q2 Q3 Q4 2013 Q2 Q3 Q4 2014
-20
-10
0
10
20
30
40
QO
Q S
AA
R %
Gro
wth
Manufacturing ex-Pharma*
Manufacturing
Q1
Manufacturing sector buoyed by a surge in pharmaceutical output.
* EPG, MAS estimates
Monetary Authority of Singapore 11 Economic Policy Group
effects on global liquidity conditions, and an escalation of the conflict in Ukraine. Alongside
muted investor appetite, trading activity in the local bourse was largely flat in the quarter
and fund raising activities by corporates dwindled. There were only three IPOs with a total
market capitalisation of $412 million in Q1, compared with the six IPOs worth $718 million
in the quarter before. In the intermediation segments, domestic loan growth eased to 2.3%
q-o-q, from 5.1% the quarter before, in part due to a slowdown in property-related lending
amid a cooling housing market. Robust activity in the general insurance segment, however,
provided some support and anchored overall growth for the financial sector.
The domestic tourism industry posted a slight sequential improvement in early 2014.
Following a weak performance in Q4 2013, visitor arrivals recovered somewhat in Q1 2014
driven by MICE (Meetings, Incentives, Conferences and Exhibitions) events like the
Singapore Airshow. Consequently, demand for accommodation services remained firm,
with hotel occupancy rates rising to 87.0% sa in Q1 2014, higher than the 86.0% registered
in the preceding quarter.
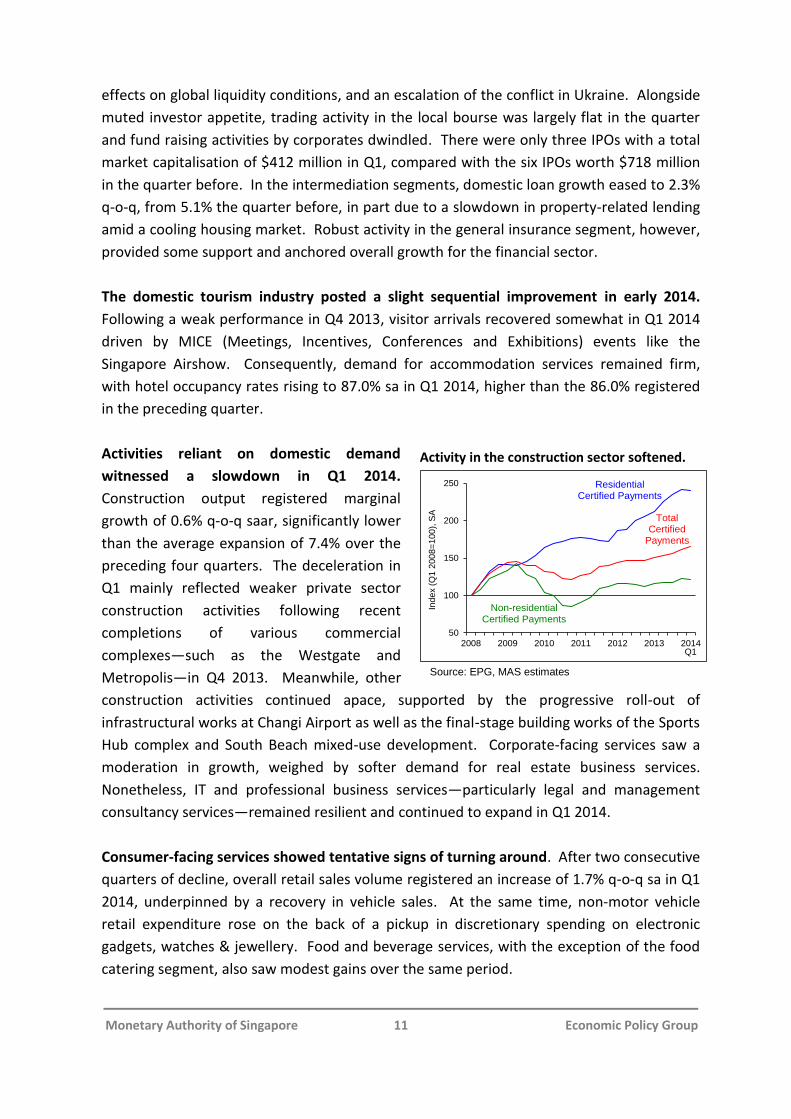
Activities reliant on domestic demand
witnessed a slowdown in Q1 2014.
Construction output registered marginal
growth of 0.6% q-o-q saar, significantly lower
than the average expansion of 7.4% over the
preceding four quarters. The deceleration in
Q1 mainly reflected weaker private sector
construction activities following recent
completions of various commercial
complexes—such as the Westgate and
Metropolis—in Q4 2013. Meanwhile, other
construction activities continued apace, supported by the progressive roll-out of
infrastructural works at Changi Airport as well as the final-stage building works of the Sports
Hub complex and South Beach mixed-use development. Corporate-facing services saw a
moderation in growth, weighed by softer demand for real estate business services.
Nonetheless, IT and professional business services—particularly legal and management
consultancy services—remained resilient and continued to expand in Q1 2014.
Consumer-facing services showed tentative signs of turning around. After two consecutive
quarters of decline, overall retail sales volume registered an increase of 1.7% q-o-q sa in Q1
2014, underpinned by a recovery in vehicle sales. At the same time, non-motor vehicle
retail expenditure rose on the back of a pickup in discretionary spending on electronic
gadgets, watches & jewellery. Food and beverage services, with the exception of the food
catering segment, also saw modest gains over the same period.
2008 2009 2010 2011 2012 2013 2014
50
100
150
200
250
Ind
ex (
Q1
20
08
=1
00
), S
A
Residential Certified Payments
Total Certified
Payments
Non-residential Certified Payments
Q1
Activity in the construction sector softened.
Source: EPG, MAS estimates

Monetary Authority of Singapore 12 Economic Policy Group
The domestic economy is expected to expand by 2–4% in 2014
The global economy remains on track for a stronger pick-up this year, underpinned by
growth momentum in the advanced economies. While there was some slippage in Asia ex-
Japan exports in Q1 2014, this was due in part to a temporary weather-related retraction in
US demand.
Notwithstanding the slowdown in growth momentum in Q1 2014, conditions are broadly
supportive of a modest growth trajectory for the Singapore economy for the rest of the
year. GDP growth in Singapore is forecast to come in at 2–4% in 2014. Gradual
improvements in the global economy, alongside a pickup in the IT industry, should provide
support to Singapore’s external-oriented industries. In particular, sectors that are closely
tied to demand in the advanced economies, such as the manufacturing and transport-
related services, are expected to be the largest recipients of positive spillovers from the G3-
led recovery. Services industries with sizable exposure to emerging Asia, such as tourism1
and general insurance2, could also be supported by steady growth in the ASEAN economies.
Meanwhile, the domestic-oriented sector is expected to be resilient, buttressed by public
sector-driven infrastructure expansions. These include the construction of the Thomson
and Eastern Region MRT lines; healthcare facilities such as hospitals at the Jurong Lakeside
District; and 40,000 new HDB homes in the Tampines North, Punggol Matilda and Bidadari
regions.
Nonetheless, there are potential external and domestic headwinds to growth. Financial
market volatility in response to the pace of exit from QE and political instability in various
parts of the world could weigh on investor and business sentiments in the near term.
Ongoing policy adjustments in China may also have spillover consequences on growth in the
region. On the domestic front, supply-side constraints could translate into higher business
costs and limit the extent of the cyclical upturn.
1 In 2013, 77% of visitors who arrived in Singapore were from the Asian region.
2 In 2012, Asia accounted for 60% of Singapore’s total insurance exports. The insurance business in Singapore comprises life insurance which is more domestic-oriented and general insurance which is more external-oriented. The general insurance business provides coverage for a wide range of risks such as fire, marine and aviation, motor, workmen's compensation and public liability.

Monetary Authority of Singapore 13 Economic Policy Group
C. Labour Market and Consumer Prices
Job creation slowed in Q1 2014
Preliminary estimates show that overall employment gains moderated to 24,900 in Q1
2014, from 40,600 in Q4 2013, with job creation slowing across all sectors. The services
sector expanded employment by 21,900, lower than the 31,800 increase in the previous
quarter, due to the cutback in hiring in the retail trade and hospitality-related segments
after the year-end festive season. Hiring sentiments were also weaker in the manufacturing
and construction sectors. Manufacturing shed 1,200 workers, following modest gains of
900 a quarter earlier. Construction added 4,000 jobs, the lowest quarterly increase in three
years, partly due to the completion of several major projects such as the Marina Coastal
Expressway and Westgate shopping mall.
In line with the slower pace of job creation,
the seasonally-adjusted overall
unemployment rate rose slightly to 2.1% in
Q1 2014, from 1.8% in Q4 2013, while the
resident unemployment rate inched up to
2.9% from 2.7% the quarter before. The
increase in the resident unemployment rate
was accompanied by a moderation in
resident wage growth, from 4.7% y-o-y in Q4
2013 to 3.2% in Q1 2014. Wage increments
slowed mainly in the public administration & defence and education sectors, while
remaining at above the historical average for most other sectors.
Going forward, labour demand is expected to be firm, as the economic environment stays
generally favourable. However, the tight labour supply will constrain employment growth,
thereby exerting upward pressure on wages.
MAS Core Inflation picked up in April, while CPI-All Items inflation
rose due to temporary base effects.
MAS Core Inflation, which excludes the cost of accommodation and private road transport,
edged up to 2.3% y-o-y in April, from 2.0% in each of the two preceding quarters, as
domestic cost increases continued to pass through to consumer prices. Meanwhile, CPI-All
Items inflation was volatile due to base effects associated with car prices. It eased from
2.0% in Q4 2013 to 1.0% in Q1 2014, but picked up to 2.5% in April.
2008 2009 2010 2011 2012 2013 2014
1.5
2.0
2.5
3.0
3.5
4.0
-20
0
20
40
60
80
Pe
r C
en
t, S
A
Ch
an
ge
s in
Em
plo
ym
en
t ('0
00
)
Services Industry (LHS)Goods Producing Industries (LHS)Overall Unemployment Rate (RHS)
Q1
Overall unemployment rate rose in Q1.

Monetary Authority of Singapore 14 Economic Policy Group
Services inflation firmed recently, after falling temporarily in Q1 2014 due to the high
base for household services cost a year ago. 3 It rose to 2.7% in April, from 2.5% in Q1
2014, led by the increase in public transport fares and cost of holiday travel.
Food prices rose at a faster pace, while oil-related items were no longer a drag on
inflation. Food inflation came in at 3.1% in April 2014, about half a percentage point higher
than in the last two quarters, due to sharper price increases for both non-cooked food and
prepared meals. Meanwhile, prices of oil-related items rose by 1.0% in April 2014, after
declining in the preceding two quarters, on account of higher petrol pump prices.
Private road transport cost increases have been volatile due to the fluctuations in COE
premiums. COE premiums plunged on a sequential basis in March-April 2013 following the
implementation of the financing restrictions on motor vehicle loans, after reaching a high in
January 2013.4 Mainly as a result of these base effects, private road transport cost fell by
4.5% y-o-y in Q1 2014, before climbing by 5.7% in April 2014. Meanwhile, accommodation
cost continued to rise at a slower pace as housing rentals softened.
MAS Core Inflation is expected to remain
elevated and average 2–3% in 2014.
External price developments should be
relatively benign for the rest of the year,
given ample supply buffers in major
commodity markets and modest inflation in
most of Singapore’s key import source
countries. However, domestic cost
pressures, particularly stemming from a
tight labour market, are likely to be strong
and will remain the primary source of
inflation.
CPI-All Items inflation is projected to come in at 1.5–2.5% in 2014. CPI-All Items inflation is
expected to rise further in the very short term due to the low base a year ago when COE
premiums fell, but it should ease through the second half of 2014. For the whole year, car
prices are likely to add negligibly to inflation. Given the large supply of newly-completed
housing units coming into the market, imputed rentals on owner-occupied accommodation
are expected to stabilise this year.
3 The base for household services cost was high since February last year due to the new regulation on mandatory weekly
rest day or compensation in-lieu for foreign domestic workers. 4 COE premiums in a particular month are reflected in the CPI for private road transport in the following month.
2008 2009 2010 2011 2012 2013 2014
-2
0
2
4
6
8
% Y
OY
MAS Core Inflation
CPI-All Items Inflation
Apr
MAS Core Inflation firmed in recent months amidst volatility in CPI-All Items inflation.

Monetary Authority of Singapore 15 Economic Policy Group
D. Macroeconomic Policies
Monetary Policy: In April 2014, MAS reaffirmed the prevailing
monetary policy stance
The Singapore economy is projected to
grow at a moderate pace in 2014. Global
growth will be anchored by the recovery in
the advanced economies. Alongside a
modest turnaround in the global IT cycle,
this should provide support to regional
demand and thereon to Singapore’s
external-oriented industries as a whole.
Meanwhile, the domestic-oriented sectors
are expected to remain resilient, supported
by ongoing capacity expansions in the
healthcare and education segments, and
construction of transport infrastructure. Nevertheless, the overall growth outlook remains
modest, as GDP growth is likely to be capped by binding labour market constraints amid
economic restructuring. For the full year, GDP growth should come in at 2–4%.
Domestic core inflationary pressures are likely to persist in 2014. Aggregate demand in
the Singapore economy is expected to increase in line with the pickup in the global
economy. At the same time, amid high levels of resource utilisation in the labour market,
wage pressures will persist and the pass-through to consumer prices is likely to continue.
MAS Core Inflation is thus expected to pick up to 2–3% in 2014 from 1.7% in 2013.
MAS thus kept the S$NEER policy band on a modest and gradual appreciation path in April
2014, with no change to its slope, level or width. This policy stance was assessed to be
appropriate for containing domestic and imported sources of inflation, and ensuring
medium-term price stability as a basis for sustainable growth.
98
99
100
101
102
103
104
Oct Jan Apr Jul Oct Jan AprIn
de
x (1
-5 O
ct 2
01
2 A
vera
ge
=1
00
)
2012
Appreciation
Depreciation
indicates release of Monetary Policy Statement
2013 2014
MAS maintained the gradual and modest appreciation path of the S$NEER policy band in April 2014. October 2013.

Monetary Authority of Singapore 16 Economic Policy Group
Fiscal Policy: The FY2014 Budget focused on supporting the
economy’s restructuring process and achieving more equitable
growth over the longer term
The overall budget for FY2013 is estimated to have recorded a surplus of $3.9 billion (1.0%
of GDP), higher than the $2.4 billion projected. This was due to stronger-than-expected
revenues from stamp duties and vehicle quota premiums, as well as delays in public
infrastructure projects which contributed to lower development expenditures.
Budget 2014 built on the restructuring efforts put in place since Budget 2010. First, it
sharpened the incentives for firms to invest and reduce their reliance on labour. To
encourage firms to invest, the Budget extended the Productivity and Innovation Credit (PIC)
scheme for another three years, and introduced PIC+ for small and medium enterprises
(SMEs), which increased the expenditure cap on firms’ qualifying activities. At the same
time, the Budget also announced targeted measures to boost productivity in the
construction sector: levies for the least-skilled foreign workers were increased, while firms
were encouraged to retain higher-skilled workers for longer.
Second, the Budget sought to promote process transformation and innovation in firms.
To help businesses to scale up the use of information technology, the Budget provided
generous subsidies for SMEs adopting ICT-based productivity solutions and firms pioneering
emerging technology solutions. Budget 2014 also extended the duration where companies
could qualify for tax deductions on R&D expenditures. This should encourage firms to
invest in R&D and innovation.
This year’s budget also made further strides in strengthening social safety nets and
improving social mobility. Budget 2014 introduced the Pioneer Generation Package, which
will benefit approximately 450,000 Singaporeans aged 65 and above. These “pioneers” will
get additional subsidies at government outpatient clinics, top-ups to their Medisave
accounts, and subsidies for MediShield Life premiums. In addition, the Budget made an
incremental step to enhance healthcare affordability for all Singaporeans, by hiking CPF
rates for Medisave by one percentage point for all workers. Following last year’s efforts to
raise the capacity and quality of pre-school education, this year’s budget included more fee
assistance for kindergartens for those in lower and middle-income families, and raised
subsidies for children with special needs so as to improve their access to early intervention
services.
For FY2014, the government has projected an overall budget deficit of $1.2 billion (0.3%
of GDP). This includes special transfers, top-ups to trust and endowment funds, and
revenue from net investment returns. The basic balance, which includes special transfers
only, is projected to be in a deficit of $0.8 billion (0.2% of GDP).

Monetary Authority of Singapore 17 Economic Policy Group
Summary of Fiscal Position
FY 2012 FY 2013 Revised FY 2014 Budgeted
$billion % of GDP $billion % of GDP $billion % of GDP
Operating Revenue
55.8 15.5 57.1 15.1 59.5 15.3
Total Expenditure 49.0 13.6 52.3 13.9 56.7 14.6
Operating Expenditure
36.4 10.1 40.4 10.7 42.9 11.0
Development Expenditure
12.6 3.5 11.9 3.2 13.8 3.5
Primary Surplus/Deficit (-)
6.8 1.9 4.8 1.3 2.8 0.7
Less: Special Transfers Excluding Top-ups to Endowment and Trust Funds
1.5 0.4 3.2 0.9 3.6 0.9
Basic Surplus/Deficit (-)
5.4 1.5 1.6 0.4 (0.8) (0.2)
Less: Top-ups to Endowment and Trust Funds
7.4 2.1 5.6 1.5 8.5 2.2
Add: NIR Contribution
7.9 2.2 7.9 2.1 8.1 2.1
Budget Surplus/Deficit (-)
5.8 1.6 3.9 1.0 (1.2) (0.3)
Note: Figures may not tally due to rounding Source: Ministry of Finance
____________________________ Note: Labour market statistics were obtained from the Ministry of Manpower, while trade and index of industrial production (IIP) data were provided by IE Singapore and EDB respectively. All other data in this document were obtained from the Building and Construction Authority, Department of Statistics, Ministry of Trade and Industry, unless otherwise stated.
Monetary Authority of Singapore 18 Economic Policy Group
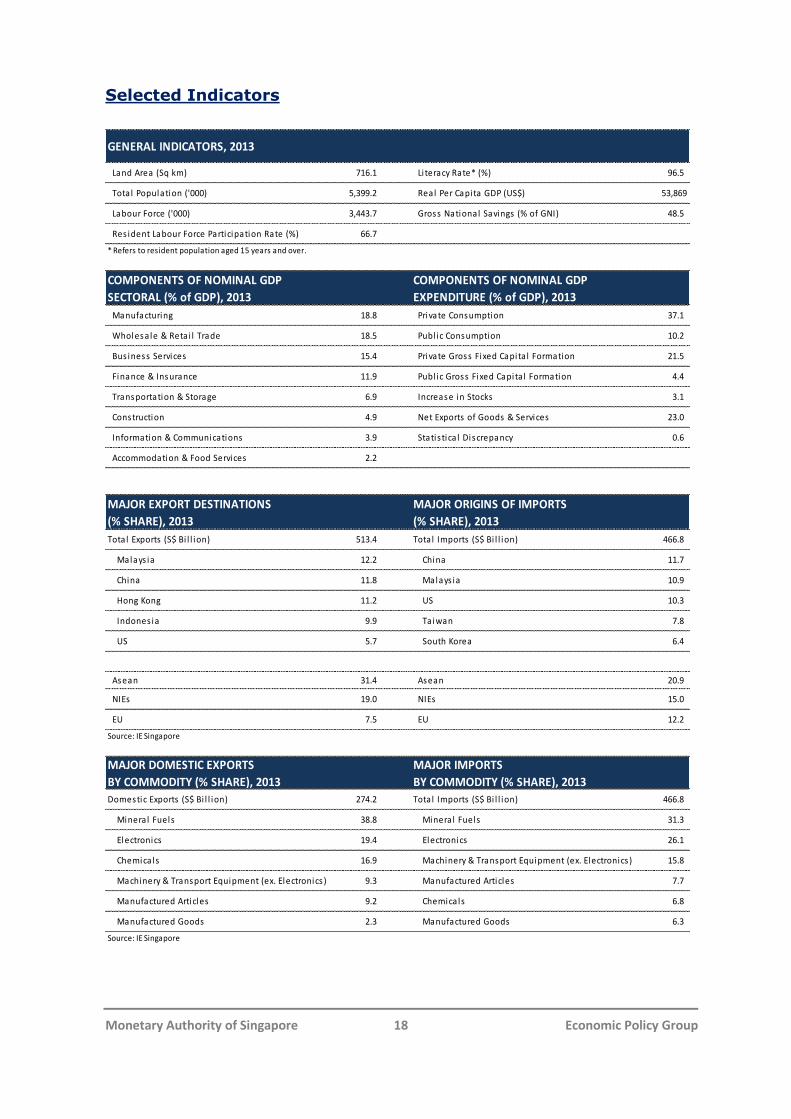
Selected Indicators
Land Area (Sq km) 716.1 Li teracy Rate* (%) 96.5
Tota l Population ('000) 5,399.2 Real Per Capita GDP (US$) 53,869
Labour Force ('000) 3,443.7 Gross National Savings (% of GNI) 48.5
Res ident Labour Force Participation Rate (%) 66.7
* Refers to resident population aged 15 years and over.
COMPONENTS OF NOMINAL GDP
SECTORAL (% of GDP), 2013
COMPONENTS OF NOMINAL GDP
EXPENDITURE (% of GDP), 2013
Manufacturing 18.8 Private Consumption 37.1
Wholesa le & Reta i l Trade 18.5 Publ ic Consumption 10.2
Bus iness Services 15.4 Private Gross Fixed Capita l Formation 21.5
Finance & Insurance 11.9 Publ ic Gross Fixed Capita l Formation 4.4
Transportation & Storage 6.9 Increase in Stocks 3.1
Construction 4.9 Net Exports of Goods & Services 23.0
Information & Communications 3.9 Statis tica l Discrepancy 0.6
Accommodation & Food Services 2.2
MAJOR EXPORT DESTINATIONS
(% SHARE), 2013
MAJOR ORIGINS OF IMPORTS
(% SHARE), 2013
Total Exports (S$ Bi l l ion) 513.4 Tota l Imports (S$ Bi l l ion) 466.8
Malays ia 12.2 China 11.7
China 11.8 Malays ia 10.9
Hong Kong 11.2 US 10.3
Indones ia 9.9 Taiwan 7.8
US 5.7 South Korea 6.4
Asean 31.4 Asean 20.9
NIEs 19.0 NIEs 15.0
EU 7.5 EU 12.2
Source: IE Singapore
MAJOR DOMESTIC EXPORTS
BY COMMODITY (% SHARE), 2013
MAJOR IMPORTS
BY COMMODITY (% SHARE), 2013
Domestic Exports (S$ Bi l l ion) 274.2 Tota l Imports (S$ Bi l l ion) 466.8
Minera l Fuels 38.8 Minera l Fuels 31.3
Electronics 19.4 Electronics 26.1
Chemica ls 16.9 Machinery & Transport Equipment (ex. Electronics ) 15.8
Machinery & Transport Equipment (ex. Electronics ) 9.3 Manufactured Articles 7.7
Manufactured Articles 9.2 Chemica ls 6.8
Manufactured Goods 2.3 Manufactured Goods 6.3
Source: IE Singapore
GENERAL INDICATORS, 2013

Monetary Authority of Singapore 19 Economic Policy Group
OVERALL ECONOMY 2012 2013 2012 Q4 2013 Q1 2013 Q2 2013 Q3 2013 Q4 2014 Q1 Mar-14 Apr-14
GDP at current prices (S$ bil) 358.5 372.8 92.0 91.0 92.5 93.2 96.2 96.0 na na
GDP (US$ bil) 286.9 297.9 75.2 73.5 74.0 73.5 77.0 75.6 na na
Real GDP Growth (YOY % change) 2.5 3.9 2.9 1.5 4.0 5.0 4.9 4.9 na na
Real GDP Growth (QOQ SAAR % change) na na 7.6 1.9 10.2 0.7 6.9 2.3 na na
By Sector (YOY % change):
Manufacturing 1/ 0.3 1.7 -0.2 -6.3 0.8 5.3 7.0 9.8 12.1 4.6
Electronics 2/ -11.3 3.5 -10.6 -11.1 0.3 7.4 19.4 10.2 8.6 -8.8
Non-electronics 2/ 6.2 0.9 4.4 -4.2 1.0 4.3 2.5 9.7 13.6 10.3
Finance & Insurance 1.8 10.8 4.5 13.2 11.1 8.3 10.5 5.4 na na
Business Services 5.5 4.3 5.8 4.1 4.5 4.3 4.3 3.4 na na
Construction 8.6 6.1 7.8 5.4 6.1 5.6 7.3 6.7 na na
Transportation & Storage 5.2 3.2 5.5 -0.8 2.6 5.8 5.1 4.9 na na
Information & Communications 6.0 4.3 4.5 4.5 4.4 4.6 3.6 3.3 na na
Wholesale & Retail Trade -0.1 6.1 -0.2 4.6 6.8 6.4 6.4 5.4 na na
Accommodation & Food Services 2.3 4.5 2.0 4.2 5.4 5.0 3.4 0.9 na na
By Expenditure Component (YOY % change):
Consumption 3.1 4.1 1.7 5.0 3.8 3.3 4.2 -0.8 na na
Private 3.9 2.6 3.6 2.9 2.8 2.6 2.1 2.8 na na
Public -0.1 9.9 -5.4 11.0 9.2 5.9 12.9 -10.1 na na
Gross Fixed Capital Formation 8.9 -1.9 9.7 -4.6 -1.8 3.4 -4.6 -1.1 na na
Private 8.9 -2.4 9.6 -6.1 -1.7 4.4 -6.1 -4.2 na na
Public 8.6 0.3 10.5 1.9 -2.0 -1.1 2.0 11.7 na na
External Demand 1.5 3.6 1.7 -2.7 4.3 6.8 6.0 6.8 na na
TRADE
Total Exports, fob (YOY % change) -0.9 0.6 -5.1 -8.7 -0.2 5.8 6.0 7.6 7.9 5.6
Non-Oil Domestic Exports 0.5 -6.0 -4.2 -12.5 -5.2 -3.6 -2.1 -1.0 -6.6 0.9
Re-Exports -3.5 6.2 -8.1 -6.1 9.1 7.9 14.2 12.9 19.9 6.4
Total Imports, cif (YOY % change) 3.2 -1.6 -0.4 -9.3 -4.0 5.9 1.4 6.8 15.3 5.8
WAGE-PRICE INDICATORS
Unemployment Rate (SA,%) 2.0 1.9 1.8 1.9 2.0 1.8 1.8 2.1 na na
Average Nominal Wages (S$ per month) 4,433 4,622 4,773 4,948 4,329 4,212 4,998 5,108 na na
Consumer Price Index Inflation (YOY % change) 4.6 2.4 4.0 4.0 1.6 1.8 2.0 1.0 1.2 2.5
MAS Core Inflation (YOY % change) 2.5 1.7 2.0 1.6 1.6 1.7 2.0 2.0 2.0 2.3
FINANCIAL INDICATORS 3/
S$ Exchange Rate Against: (end-period)
US Dollar 1.2221 1.2653 1.2221 1.2436 1.2652 1.2572 1.2653 1.2605 1.2605 1.2565
100 Japanese Yen 1.4214 1.2061 1.4214 1.3205 1.2797 1.2834 1.2061 1.2252 1.2252 1.2271
Euro 1.6151 1.7452 1.6151 1.5892 1.6535 1.6975 1.7452 1.7328 1.7328 1.7347
Interest Rates (end-period, % p.a.)
3-month Fixed Deposit Rate 0.14 0.14 0.14 0.14 0.14 0.14 0.14 0.15 0.15 0.15
3-month S$ SIBOR 0.38 0.40 0.38 0.38 0.37 0.37 0.40 0.41 0.41 0.40
Prime Lending Rate 5.38 5.38 5.38 5.38 5.38 5.38 5.38 5.35 5.35 5.35
Money Supply (end-period)
Broad Money, M2 (YOY % change) 7.2 4.3 7.2 8.5 9.1 7.5 4.3 2.0 2.0 1.4
Straits Times Index (end-period) 3,167.1 3,167.4 3,167.1 3,308.1 3,150.4 3,167.9 3,167.4 3,188.6 3,188.6 3,264.7 YOY % change 19.7 0.0 19.7 9.9 9.4 3.5 0.0 -3.6 -3.6 -3.1
GOVERNMENT BUDGET 4/
Operating Revenue (S$ mil) 54,284 57,054 13,030 13,531 15,522 15,475 12,525 13,481 na na
Total Expenditure (S$ mil) 47,271 52,329 11,787 17,323 9,738 11,645 13,624 16,721 na na
Operating Expenditure 34,810 40,390 8,555 13,698 6,788 9,240 10,664 13,033 na na
Development Expenditure 12,461 11,939 3,232 3,625 2,949 2,405 2,960 3,688 na na
Primary Surplus/Deficit (S$ mil) 7,013 4,725 1,243 -3,792 5,785 3,831 -1,099 -3,239 na na % of GDP 2.0 1.3 1.4 -4.2 6.3 4.1 -1.1 -3.4 na na
BALANCE OF PAYMENTS
Current Account Balance (% of GDP) 17.5 18.3 13.8 15.0 20.6 20.1 17.5 17.0 na na
Goods Balance 22.1 22.8 19.3 18.7 24.1 24.0 24.0 21.6 na na
Services Balance 0.3 0.3 0.1 0.8 0.2 0.8 -0.7 -0.7 na na
Primary Income Balance -2.4 -2.4 -2.9 -2.2 -1.5 -2.4 -3.5 -1.6 na na
Secondary Income Balance -2.6 -2.3 -2.7 -2.3 -2.3 -2.3 -2.3 -2.3 na na
Capital & Fin Account Balance (% of GDP) -8.1 -12.6 1.9 -4.7 -14.6 -20.4 -10.5 -15.7 na na
Direct Investment 16.6 12.4 15.5 14.9 12.6 10.6 11.4 15.7 na na
Portfolio Investment -22.7 -15.8 -32.0 -22.0 -4.2 -4.5 -32.0 -24.1 na na
Financial Derivatives 5.4 -0.4 2.4 0.4 -0.9 -0.4 -0.8 -1.2 na na
Other Investment -7.5 -8.7 16.0 1.9 -22.1 -26.1 10.9 -6.1 na na
Overall Balance (% of GDP) 9.1 6.1 14.7 9.6 5.8 1.0 8.0 0.5 na na
Official Foreign Reserves (US$ mil) 5/ 259,307 273,065 259,307 258,186 259,816 268,103 273,065 272,941 272,941 275,239 Months of Imports 8.2 8.8 8.2 8.3 8.4 8.6 8.8 8.7 8.7 8.7
Source:1/
Monthly data from Index of Industrial Production, EDB2/
Data from Index of Industrial Production, EDB3/
Straits Times Index from SGX. All other indicators from MAS.4/
Ministry of Finance5/
MAS
na: Not ava i lable