Embed Size (px)
Citation preview
rmNc, iuriReport No. 560a-MAI 3-Excutive Directo
r ermanent OfficeCp
Recent Economic DeveloD fe Copy
and Prospertc of M&AbAXAiLAIMA I -.9 r~ % L--F -. I I U 11-4114V v I
January 14, 1975
itU4111y rurogdrams DepaLtmnLuLt 11
Eastern Africa Region
Not for Public Use
Document of the International Bank for Reconstruction and Developmentinternational Development Association
_ _11 ___
This report was prepared for official use only by the Bank Group. It may notbe published, quoted or cited without Bank Group authorization. The Bank Group doesnot accept responsibility for the accuracy or completeness of the report.
Pub
lic D
iscl
osur
e A
utho
rized
Pub
lic D
iscl
osur
e A
utho
rized
Pub
lic D
iscl
osur
e A
utho
rized
Pub
lic D
iscl
osur
e A
utho
rized
CURRENCY UNIT
The Malavi Kwacha (K)
K3CGAN(YE RATE
The Malawi Kwacha was pegged to thp npond. sterling intil Novem.ber 1973. Sincethen, it has been calculated on a daily basis according to a weighted averageof the TUS '$ and the pundn- For the prn-ose of this rep-ort,- tihe foel ova-I
exchange rates have been used
1964-66 1967 1968-70 1971 1972 1973 1974
K1.00=US $ 1.40o 1.383 1.200 1.216 1.260 1.173 1.200US 1 .00=K 0.7?1 0.723 o.833 0.822 0.794 o.853 0o833
FISCAL YEARS
January 1, December 31 until end 1968Januarv 1. 1969 March 31. 1970 (15 months)April 1 - March 31, since 1970
WE;T.TlTS ANTl MEASTTRES
Al thouih M>l.ri is offini nl lv ronvert.ina from the nRritiih Tminn?r_al
system of measurement to the-metric system, practically no metric unitsare as yet in commnn usage. Many nrnits in this report have had to beconverted.
1 kilometer = 0.62 mile1 square kil. = 0.3861 square m,ile
1 hectare = 2.47 acres1 r+tr c +on = 1.10 long ton
0.984 long ton
TABLE OF CONTENTS
Page No.
COUNTRY DATA
SUMMAR-Y AND CONCLUSIONS .......... ........ . i L iii
I. * INTRODUCTION .................................. .
II. RECENT ECONOMIC DEVELOPMENTS ........... ..........
A. The Growth of the Economy ...... * ........ 1
Output ...... ,.. ........
Savings and Investment ................ 3
Employment .. . . .......... 4
B. Income Distribution ........ 6
C. Public Finance . ............... 8
D. External Financing . ......... * ..........*.*.*...*.*. *, 12
III. MAJOR SECTORS ... 16
A. Agriculture ................ 16
Smallholder Agriculture .... ............ 18
Estates Agriculture .................. 21
Policies and Future Developments .22
B. Industry ............. , , 23
C. Education and Training .... ** ............... 27
D. Transport ........................ . 30
IV. POLICY ISSUES AND PROSPECTS .34
ANNEX 1 - Income Distribution
STATISTICAL ANNEX
MAP
This report is based on the findings of a mission that visited Malawi in
April/May 1974. The mission was composed of Roger Kev (mission chief),
Gottfried Ablasser (agricultural economist) and Andrew Hilton (economist).

LIST OF TEXT TABLES
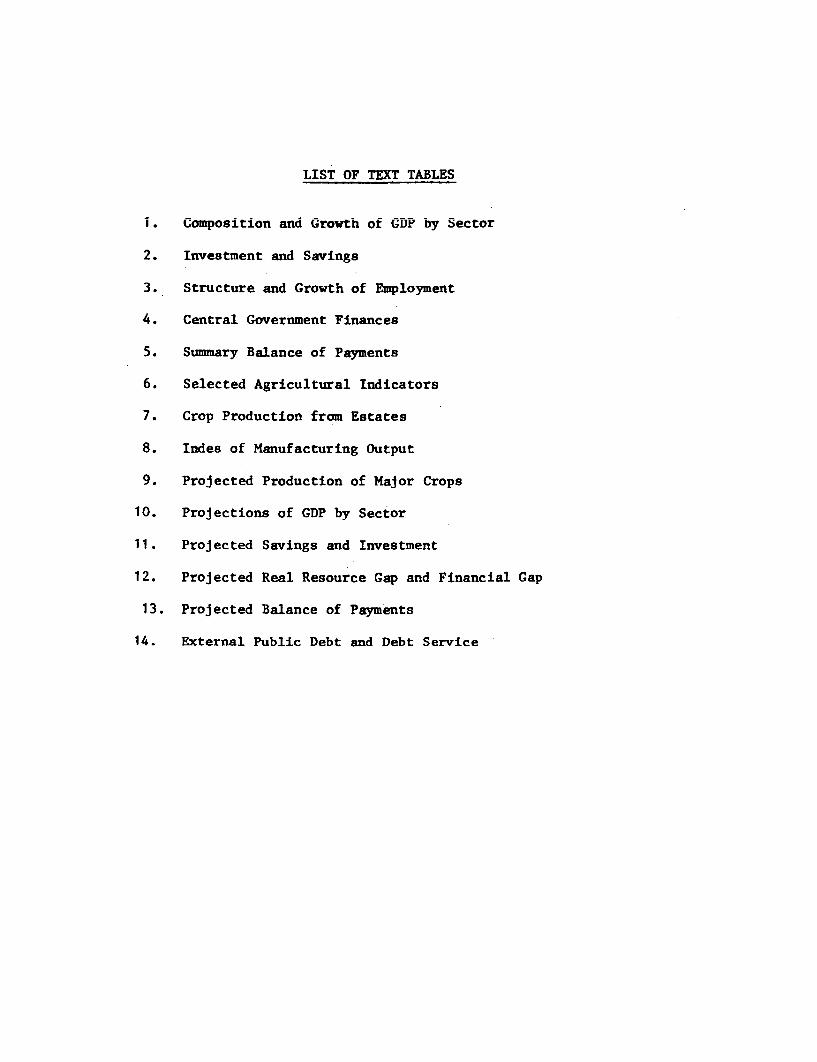
1. Composition and Growth of GDP by Sector
2. Investment and Savings
3. Structure and Growth of Employment
4. Central Government Finances
5. Summary Balance of Payments
6. Selected Agricultural Indicators
7. Crop Production from Estates
8. Indes of Manufacturing Output
9. Projected Production of Major Crops
10. Projections of GDP by Sector
11. Projected Savings and Investment
12. Projected Real Resource Gap and Financial Gap
13. Projected Balance of Payments
14. External Public Debt and Debt Service


Page I of 3 paegs
ODMnRY DATA - KALAWI
AMLA PCUI.ATION NSITY!IR 1,8km 2e Tr.7__liic (eid-197 2)
102 Psr ka2of arable land
SOCIAL NDIATOfiS
Reoferenoe CountriesNKIAVI ~ Somali Tansania Ys...
MNF ZRE OAflT U (,%TIAS BASIS) 1 .. i /a BOL /a 120 3,670 A
DUMORAPMCM MM- rate (per tousand) .. 54 Lb [.7 47 /9 14~.4
Crude teath rate (per w.ocusansd) . 22 22 / .
rnfant mertaility raet (Per thousand lise births) I8.8 Ld 16m65i 1,38 39 11. 3 73
Gpo., Me ductiw. rate j2 3.2 3.2 3.0 3.2 1.2Population growth rate tj2.2 2.6 2.4A 3.0 0 7PPpulation growth rate - urban 7Lf 7 5 .. ~6.2~Age structure (persan t)
0-in L.SA 8./ 146 C 23.715-66 5o7 527 52 5 4 65 ced over S7I 4. 234 .9
Dersendocy ratio 1.0 X 0.9 ~Ti 0.9A~ 0.9 Tc.m 0.8
Urban PoPulation as psroent of total .. 6 ~.6/bco 80 Family planning: NM of acoeptor cumulativs (thou..) ..
No. of uoors (1 of married wmen) ..
ToMMbor form. (thouaaods) .. 2,300 If 1,002 La 5,750 /c.h 2,100 loPercetage employed in agriculture .8 808/ch 1Percentage umemployed 8. if 20 88. 3c l
I DISTRIBUTIONPeroent Of naionlh6J income reoeived by hbltest 5% .. 27 ~.X,_ a . 34. 22 9.!Pearoeart of national moons received by highest 20% 44i./ai . 60 / 18 5Peroent of nainlinocome reneived by lowest 20% 4.1 . LPercent of national income received by lowest 40% .. 21Jsa IC1. Ic 1. /.o
MISMtI?0 0F LARD OiNCmHIA owned by top 1(5 of aes...
o-med bY aaelleat 10% of cvaers ..
N M P ca 35,000 A 75,250 21,180 fl,570 /h 690Population Per borning person . 16.090 a 3 .220 /u 1,890 Th 210population per hoepital bed 94.0 v 68.0 570 - 702 7h 100 /W
Per capita calorie supply as % of(requiramonta 78 98 72 Li 69 119Per capita Protein ouPPIY, total (puce per day) L6 9 /x 63 57 y 1.3 89
Of Which,eaniua and pulse 6 7 36Death rats 1-4. yeers /76T 9. 27 .. 23 0.62
Aijia 8 prmay chool enrafleent ratio 39 37 10 37/ 98Adjusfted co iayschool enrollmeont ratio 1 3 4. 3/9 87Tears Of a8ooling provided, firsft and cecond level IL. 11. 11-18 13 13Vocational enroll1Ment AS % of sac, school enrollment 21. 3 2 baa 3 /q 32Adult literacy rate % 5ZZ. 7ob.ac ..- 99 lao
Ave-rage Mc. of persons per rcosa (urbans) .. 1.9 Ic . 0.9 /0dpercent of occupied units without piped water .. 78/9. 4E 3aAccess to electricity (as % Of total PuPulation) .. 16 /c. 97 /adPercet of tura1 population conncted to elcrct . 0.0 _
1 Lciv ra per 1000 population 9 /e 20 18 15 /94f 325Passenger cars per 1020 population .2 /at 2 3 /9fj 219 /afElectric power consuaption (kvho p.c.) 10 ar 32 7 29 lb 2,981newsprict censumptim p.c. kg per year -0.03 /ad 0.01. 0.6 Z& 0.1 30.3
Motess Figures refer either to the latest periods or to acocousit of enviromsental temperature, body veigbt., andthe latest years. latest periods refer in principle to dIistribution by age man sex of national populations.the years 1956-60 or 1966-70; the latest years in pmi- /6 Prtein stiowdards (requir.ementso fur all countriesas tbciple to 1960 and 1970. lished by USDA Economic Research Sermite provide for~ a mininmuA9 The Per Capita DsNP esatimte ias at market prices for allowance of 60 grams of total protein per day, and 20 gras of
ea'c other thani 1960, calculated by the same coniversion anial- and pulse protein, of which 10 pens should he animatechnique as the 1972 World lank Atlas. pr"t.ain. Th-aseat.andazds &~are msht!mrta hoeo
L2 Averags number of daughters per women of reproductive grass of total protein and 23 grans of ani-al protein as an,age, average for the world, proposed by TAO in the Third World FoodF Ppulation growth rates a"e for ths decades ending in , Survey. __1960 end 197. IL, Sono tdes.., haveo *aggeaed th,tad t.rtso cideRafitic of undsr 15 ansd 65 end over age brackets to apes 1 through 4. ma be .sed as a first approxiatino index ofthose in labor fomes bracket of ages 15 throwu)h 68.. malnutrition.~,PAO reference atarndarda represent p1sysiologhcal re. /8 Percetage enrolled of cor~respoding p-opulation of sched1 agequiremects for norwel activIty and health, taking asdfra o ec o" ty
/a 1,,; 1 19711 /c 19671 Ld l?531 4e 1?60-72; If 7cirtrate; /p All township. snd tmc,planning areas an- all district centersa; & Tanganyika; aL 15 gazetted townships, 1957-67; Lj Agglomerationsof 20D or more inhabitants; /9 1962, UK estimate for African population; a9 1966; /m Ratio of population under15 and 65 and over. are berckats ino those in lq-&8 age bracket; LA Ratio of population under 15 and 65 and overto, total labor force; La. 16 gesetted townsships; 1971 La1968; LL Urban only;Economically active population; L 1962; Lt Includes midwives; /' 1963; /w 1969; ~A 1961-63;196L-66; Exicluding Faeroe Isands and Greenland; /an Ehcludes private cocastional schools; /ab 15 years andover;i~ Defir tin,,,. 16!,,.,., A 96Sni. L±e T,,,.i,I.e. 5,,tharsn R-hnd.,lA o-nd ZAmbl-4, Iaf Ter-_Li,,l..w,hOperated by police or other governmm.t security orgcisations; /9aA 1961; Lh Coverage of data inc...plsts;
alHouseholds.
*Deasark has been aslacted as an objective ccuntry, becauss it is an example of a emall, denssely populated, but highly developedcountry. Nalawi has sought incieasing assistance fras Densmark in recent years.
HIS Janu-ary 10, 1975
Page 2 of 3 pages
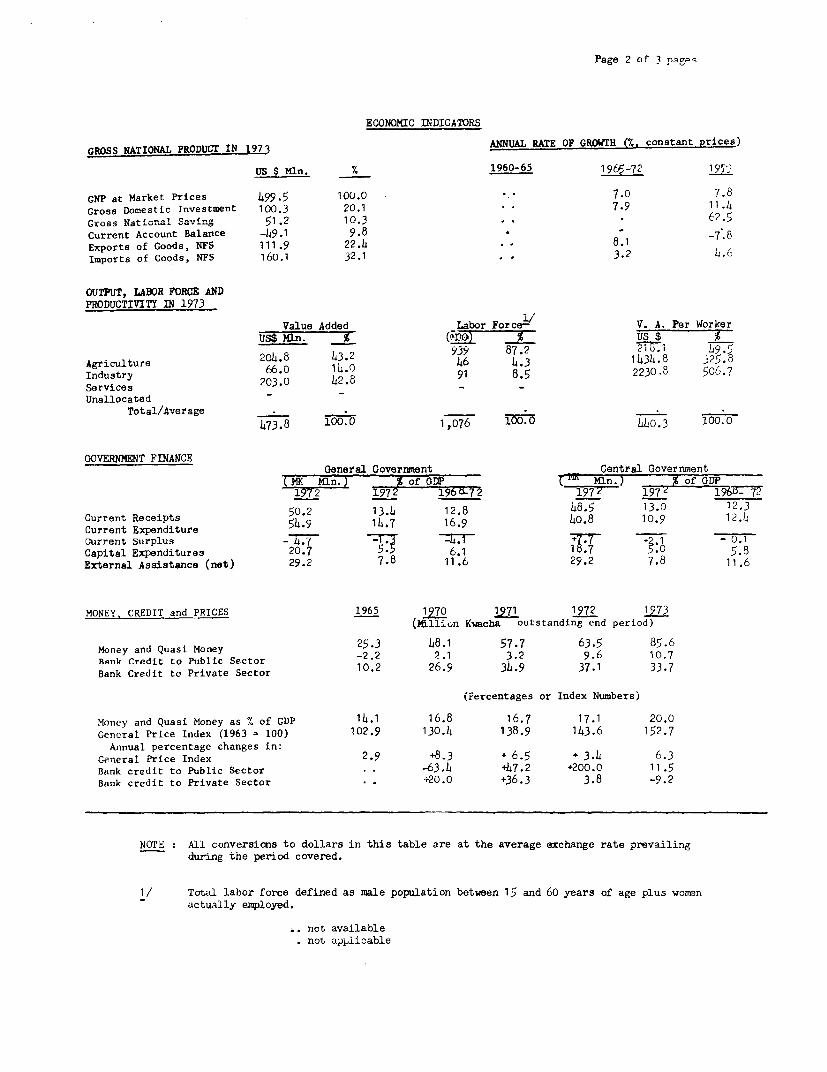
ECONOMIC INDICATORS
GROSS NATIONAL PRODUCT IN 1973 ANNUAL RATE OF GROWrH (Z. constant prices)
US $ Mn. % 1960-65 1965-72 19'
cNP at Market Prices 499.5 10o.o .7 7.0 7.8Gross Domestic Investment 100.3 20.1 . . 7.9 11.4Gross Natior.al Sa"Fing 5:1 .2 10.3 62 =5Current Account Balance -49.1 9.8 .7.8Exports of Goods, NPS 111.9 22.4 8.1 -7 Imports of Goods, NFS 160.1 32.1 , 3.2 .C)
OUTPUT, LABOR FORCE ANDPRODUCTIVITY IN 1973
Value Added Labor Force- V. A. Per WorkerAdde Laor Frce ______I_____US$ Kin. X . usa $__
2014.8 143.2 939 87.2 el19.Agriculture 204.o 143.0 46 .4.3 1 434.8 32 .
aricute 2 o 91 8.5 2230.8 506.7Iedustry 203.0 142.8
UnallocatedTotal/Average
473.8 l 00.0 1,076 I0Th 440.3 100.0
GOVERNM4T FINANCEGeneral Government Central Government
(K Mln, 4 of GDP Min.) Of GDP197 2 197 2 19 6 7_ 2 ~ 197 Z 7 _
Current Receipts 50.2 13.4 12.8 40.5 13.0 12.3Current Expenditure 514.9 114.7 16.9 14o.8 10.9124
Current Surplus -4.7 +4 1 - 0.1Capital Expenditures 20.7 5 6.1 10.7 5.0 5.8Ercternal Assistance (net) 29.2 7.8 11.6 29.2 7.8 11.6
MONEY, CREDIT and PRICES 1965 1970 1971 1972 1973(.fllion Kiacha outstanding end period)
Money and Quasi Money 25.3 48.1 57.7 63.5 85.6Bank Credit to Public Sector -2.2 2.1 3.2 9.6 10.7Bank Credit to Private Sector 10.2 26.9 34.9 37.1 33.7
(Percentages or Index Numbers)
Money and Quasi Money as % of GDP 14.1 16.8 16.7 17.1 20.0Gencral Price Index (1963 = 100) 102.9 130.14 138.9 143.6 152.7
Annual percentage changes in:General Price Index 29.3 l6.5 4.3-4 6.3Bank credit to Public Sector -. -63.4 +47.2 +200.0 11.5Bank credit to Private Sector . ;20.0 +36.3 3.8 -9.2
NOTE : All conversions to dollars in this table are at the average exchange rate prevailingduring the period covered.
1/ Total labor force defined as male population between 15 and 60 years of age plus womenactually emrployed.
.. not availablenot apilicable
Page 3 of 3 pages
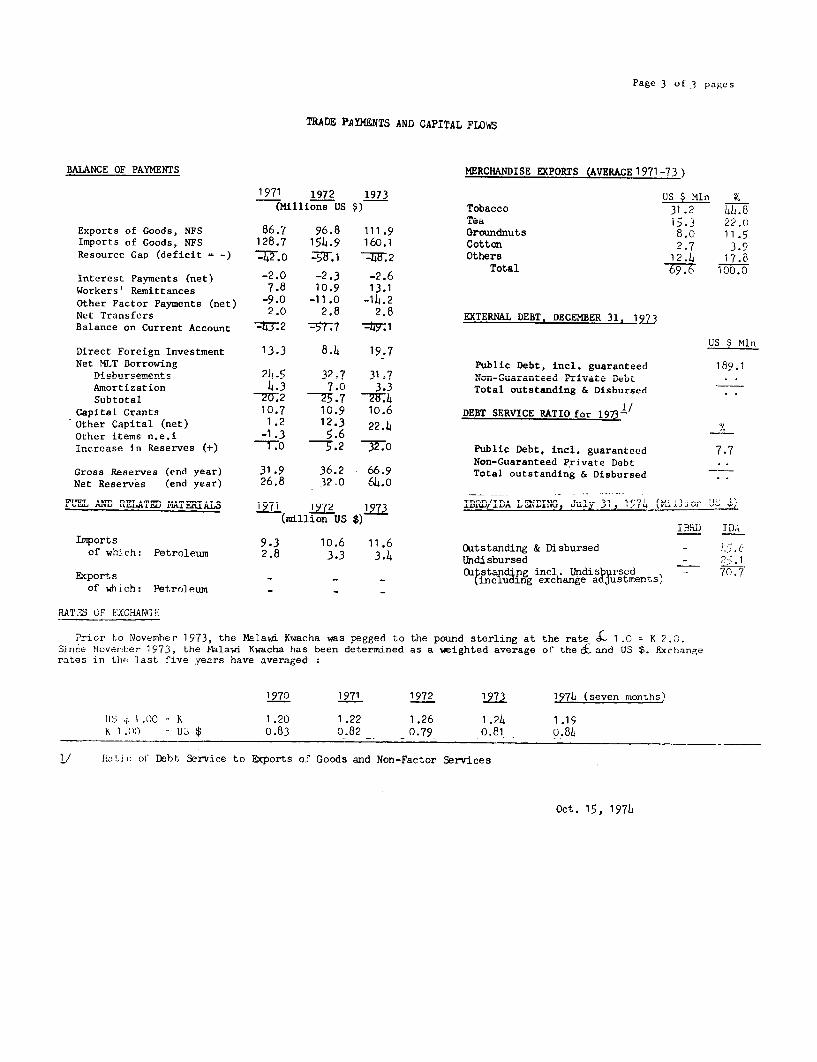
TRADE PAYMEIJTq ANJT OADTIAT Fw'n
BALANCE OF PAYMENTS MERCHANDISE EXPORTS (AVERAGE 1971-73)
1971 1972 1973 US $Mln V.(Millions US $) Tobacco 31.2 44.8
Tea 15.3 22.0Exports of Goods, NFS 86.7 96.8 111.9 Groamdnuts 8.0 11.5Imports of Goods, NFS 128.7 154.9 160.1 Cotton 2.7 3.9Resource Gap (deficit = -) -42.o -T.1 --4.2 Others 12.4 17.8
Interest Payments (net) -2.0 -2.3 -2.6 Total 7 100.0Workers' Remittances 7.8 10.9 13.1Other Factor Payments (net) -9.0 -11.0 -14.2Net Transfers 2.0 2.8 i .8 EXTERNAL UEBT, DECE ER 31, 1973Balance on Current Account tjy.2 -5r7 -4y.
US S MlnDirect Foreign Investment 13.3 8.4 19.7Net MLT Borrowing Public Debt, incl. guaranteed 189.1
Disbursements 2h4 32.7 31=7 Non-Guaranteed rivate DebtAmortization 4.3 7.0 3.3 Total outstanding & DisbursedSubtotal 27T2 2 -5.7 -ZF4 I/
Capital Grants 10.7 10.9 10.6 DEBT SERVICE RATIO for 1973-'Other Capital (net) 1 .2 12.3 22.4 %Other items n.e.i -1.3 5.6Increase in Reserves (+) 1.0 5.2 32.0 Public Debt, incl. guaranteed 7.7
Non-Guaranteed Private DebtGross -Reserves (end year), 31.9 36.2 66.9 Total outstandin'g& DisbuseNet Reserves (end year) 26.8 32.0 64.o Dursed
F' 4-.A1 Ahm R IA TSALAP~ 19(1 197-2 1973 IBRD/IDA LDING, Jul ,1, 1,71 ( U-,,(million US $)IBU IDA
Imports 9.3 10.6 11.6 Outstanding & Disbursed-of which: Petroleum 2.8 3.3 3.14 Undisbursed -
Ecports - - - Cat.standing incl. U.disbursed - 70.7of which : Petrnum - - (including exchange adjustments)
RATZS OF EXCHANGE
Prior to November 1973, the Malawi Kwacha was pegged to the pound sterling at the rate £ 1.0 = K 2.C.aiuce November 1973, the Malawi Kwacha has been determined as a weighted average of' the &and US $. Exchangerates in th* last five years have averaged
i970 1971 1972 1973 1974 (seven months)
US I .00 K 1.20 1.22 1.26 1.24 1 .19h 1.()0 -- US $ 0.83 0.82 0.79 0.81 o.80
Lj/ Hta-ic oi Debt Service to Exports o.- Goods and Non-Factor Services
Oct. 15, 1974

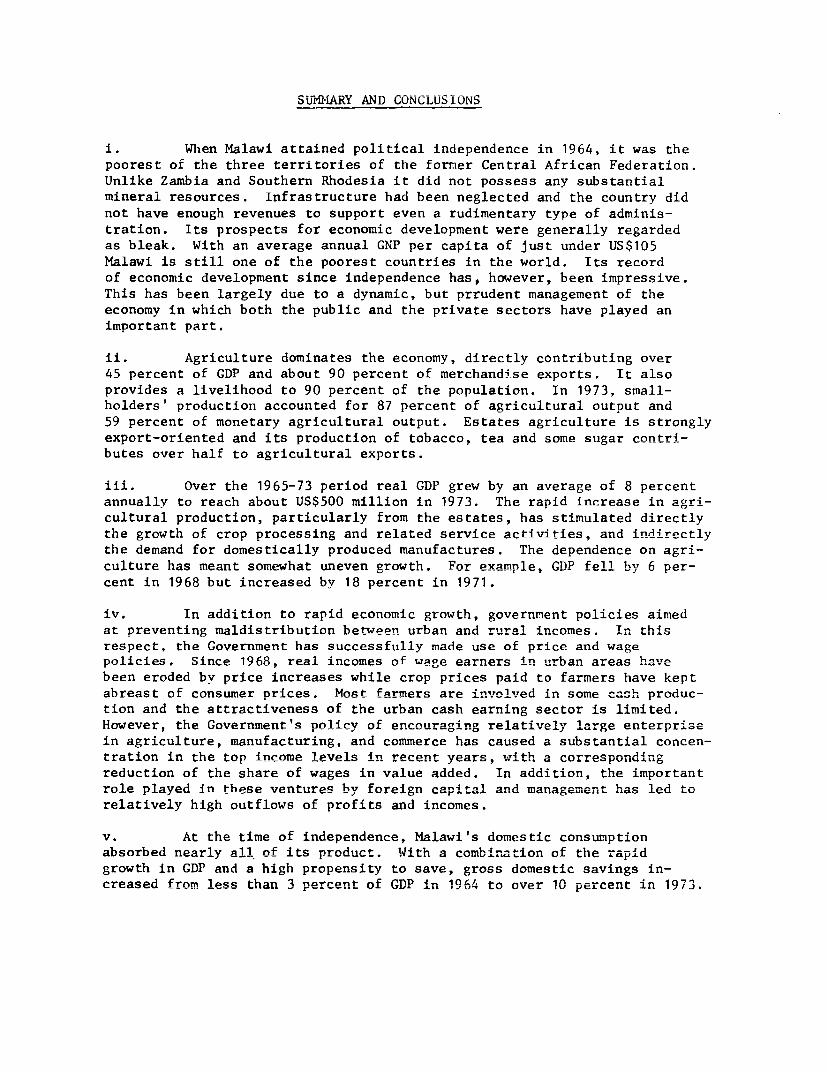
SUritiA±Y AN)D CONCLUSIONS
i. When Malawi attained political independence in 1964, it was thepoorest of the three territories of the former Central African Federation.Unlike Zambia and Southern Rhodesia it did not possess any substantialmineral resources. Infrastructure had been neglected and the country didnot have enough revenues to support even a rudimentary type of adminis-tration. Its prospects for economic development were generally regardedas bleak. With an average annual GNP per capita of just under US$105Malawi is still one of the poorest countries in the world. Its recordof economic development since independence has, however, been impressive.This has been largely due to a dynamic, but prrudent management of theeconomy in which both the public and the private sectors have played animportant part.
ii. Agriculture dominates the economy, directly contributing over45 percent of GDP and about 90 percent of merchandise exports. It alsoprovides a livelihood to 90 percent of the population. In 1973, small-holders' production accounted for 87 percent of agricultural output and59 percent of monetary agricultural output. Estates agriculture is stronglyexport-oriented and its production of tobacco, tea and some sugar contri-butes over half to agricultural exports.
iii. Over the 1965-73 period real GDP grew by an average of 8 percentannually to reach about US$500 million in 1973. The rapid increase in agri-cultural production, particularly from the estates, has stimulated directlythe growth of crop processing and related service activities, and indirectlythe demand for domestically produced manufactures. The dependence on agri-culture has meant somewhat uneven growth. For example, GDP fell by 6 per-cent in 1968 but increased by 18 percent in 1971.
iv. In addition to rapid economic growth, government policies aimedat preventing maldistribution between urban and rural incomes. In thisrespect, the Government has successfully made use of price and wagepolicies. Since 1968, real incomes of wage earners in urban areas havebeen eroded by price increases while crop prices paid to farmers have keptabreast of consumer nrices- Most farners are involved in some cash produc-tion and the attractiveness of the urban cash earning sector is limited.However, the Government's nolicv of encouragling relatively large enterprlsein agriculture, manufacturing, and commerce has caused a substantial concen-tration in the ton income levels in recent years, with a correspondingreduction of the share of wages in value added. In addition, the importantrole played in these ventures by foreign capital and managementI has led torelatively high outflows of profits and incomes.
v. At the time of independence, Malawi's domestic consumptionabsorbed nearly all of its product. With a combination of the rapidgrowth in GDP and a high propensity to save, gross domestic savings in-creased from less than 3 percent of GDP in 1964 to over 10 percent in 1973.
- ii -
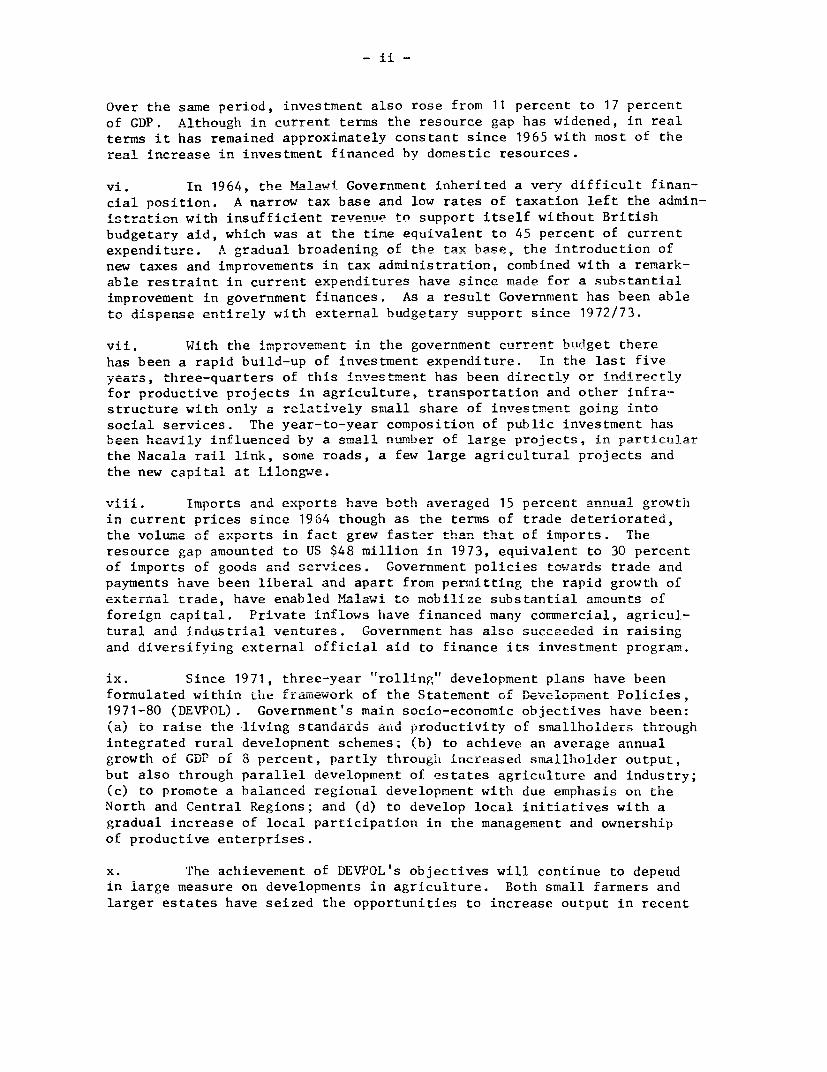
Over the same period, investment also rose from 11 percent to 17 percentof GDP. Although in current terms the resource gap has widened, in real
terms it has remained approximately constant since 1965 with most of the
real increase in investment financed by domestic resources.
vi. In 1964, the MAlawi Government inherited a verv difficult finan-
cial position. A narrow tax base and low rates of taxation left the admin-istration with insufficient rpvpnuP to sunnort itself without Britishbudgetary aid, which was at the time equivalent to 45 percent of currentexpend4ture. A -radual broadenina of the tax base, the introduction of
new taxes and improvements in tax administration, combined with a remark-able restraint in current expenditures havep inrp made for a substantial
improvement in government finances. As a result Government has been ableto dispense ent'irel with external budgetary support sinre 1972/73.
vii, With th4 e imrovement in tila government turront htifdgt there
has been a rapid build-up of investment expenditure. In the last fiveyears, three=quarters of this investment has been directly nor indirectlv
for productive projects in agriculture, transportation and other infra-structure with only a relatively small share of investment going intosocial services. The year-to-year composition of public investment hasbeenr heavily influenced by a small number of large projects.; in nartirular
the Nacala rail link, some roads, a few large agricultural projects and
Lhe new capital at Llong e-.
Viii. Timports and exports have both averaged 15 percent annual growthin current prices since 1964 though as the terms of trade deteriorated,the volume of exports in fact gew faster than that of imports. The
resource gap amounted to US $48 million in 1973, equivalent to 30 percentof ir,ports of goodds anA se-vices. Government policies towairAs trade and
UL L L. -. L - -IJL L'.------ -----
payments have been liberal and apart from permitting the rapid growth ofexternal trade, have enabled Malawi to mobilize substantial amounts offoreign capital. Private inflows have financed many commercial, agricul-
tural and ind-ustrial ventures. overnmLent has allso succeeded in rais4ng
and diversifying external official aid to finance its investment program.
ix. Since 1971, three-year "rolling" development plans have been
lormulated withiin the LrarLie-wor'k ofL the Stater,ent of Development Polidies,
1971-80 (DEVPOL). Government's main socio-economic objectives have been:
(a) to raise tne iiving standards adiiU productivity of sriL,adLLlhoLdUers throughl
integrated rural development schemes; (b) to achieve an average annual
growth of GDP or 8 percent, partly through increased smallhloluer output,
but also through parallel development of estates agriculture and industry;
(c) to promote a balanced regional development with due emphasis on the
North and Central Regions; and (d) to develop local initiatives with a
gradual increase of local participation in the management and ownership
of productive enterprises.
x. The achievement of DEVPOL's objectives will continue to depend
in large measure on developments in agriculture. Both small farmers and
larger estates have seized the opportunities to increase output in recent
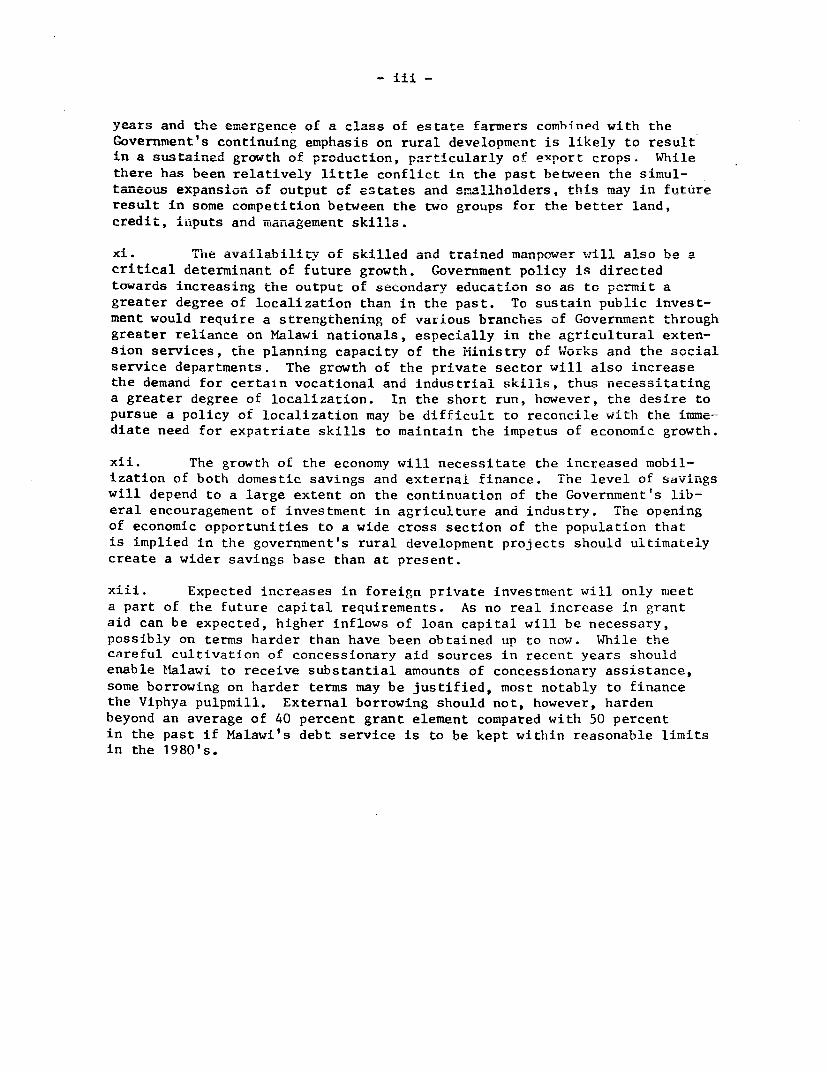
years ard the emergence of a class of estate farmers combined with theGovernment's continuing emphasis on rural development is likely to resultin a sustained growth of production, p.articularly of export crops. While
there has been relatively little conflict in the past between the simul-taneous expansion of output of estates and smallholders, this may in futureresult in some competition between the two groups for the better land,
credtuL , inputs ad n,t.anagement skills.
xi. Th e availaubl Jy of. si.L.Ledu andU trained m-anpoer will also be a
critical determinant of future growth. Government policy is directed
towards increasing the output of secondary education so as to permit a
greater degree of localization than in the past. To sustain public invest-
ment would require a strengthening of various Dranches of Governmentr through
greater reliance on Malawi nationals, especially in the agricultural exten-sion services, the planning capacity of the Ministry of Works andU the socialservice departments. The growth of the private sector will also increasethe demand for certain vocational and industrial skills, thus necessitatinga greater degree of localization. In the short run, however, the desire to
pursue a policy of localization may be difficult to reconcile with-I the ixtie=
diate need for expatriate skills to maintain the impetus of economic growth.
xii. The growth of the economy will necessitate the increased mobil-
ization of both domestic savings and external finance. The level of savings
will depend to a large extent on the continuation of the Government's lib-
eral encouragement of investment in agriculture and industry. The openingof economic opportunities to a wide cross section of the population that
is implied in the government's rural development projects should ultimately
create a wider savings base than at present.
xiii. Expected increases in foreign private investment will only meeta part of the future capital requirements. As no real increase in grant
aid can be expected, higher inflows of loan capital will be necessary,
possibly on terms harder than have been obtained up to now. While thecareful cultivation of concessionary aid sources in recent years should
enable Mlalawi to receive substantial amounts of concessionary assistance,
some borrowing on harder terms may be justified, most notably to financethe Viphya pulpmill. External borrowing should not, however, harden
beyond an average of 40 percent grant element compared with 50 percentin the past if Malawi's debt service is to be kept within reasonable limits
in the 1980's.

I. INTRODUCTION
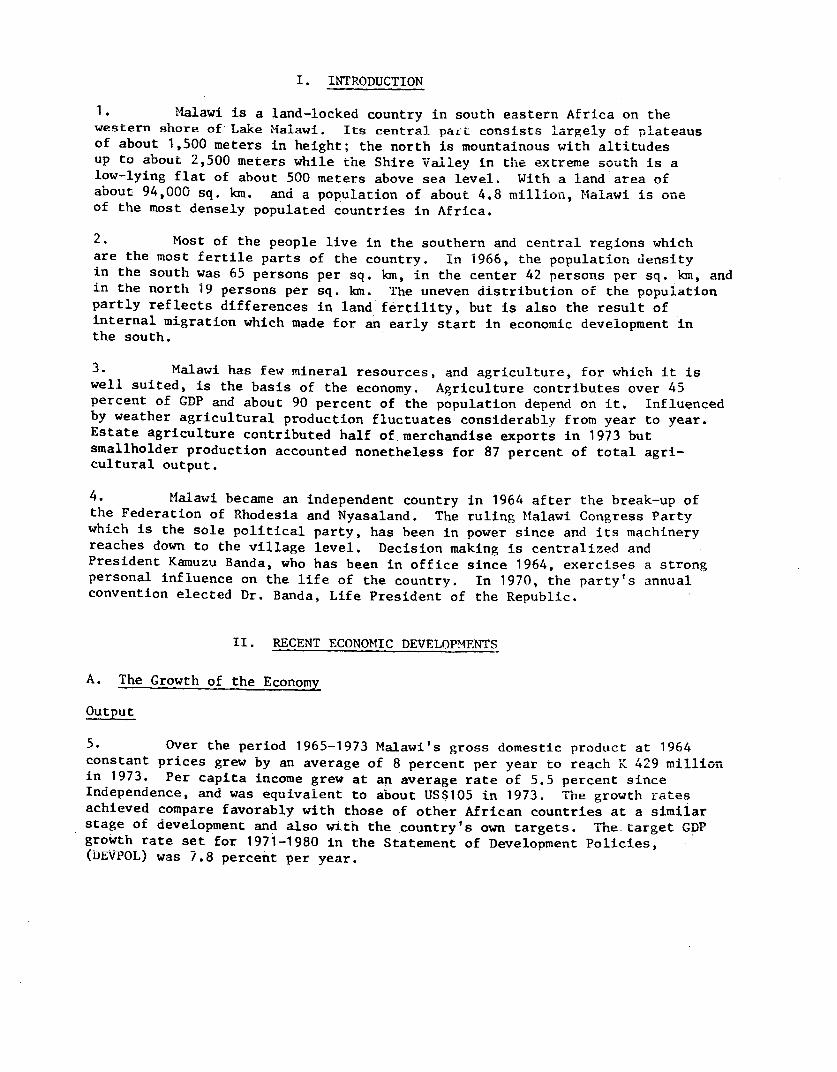
1. Mtalawi is a land-locked country in south eastern Africa on thewestern shore of Lake Malawi. Its central part consists largely of plateausof about 1,500 meters in height; the north is mountainous with altitudesup to aDout 2,500 meters while the Shire Valley in the extreme south is alow-lying flat of about 500 meters above sea level. With a land area ofabout 94,000 sq. 'km. and a population of about 4.8 million, Malawi is oneof the most densely populated countries in Africa.
2. Most of the people live in the southern and central regions whichare the most fertile parts of the country. In 1966, the population densityin the south was 65 persons per sq. km, in the center 42 persons per sq. km, andin the north 19 persons per sq. km. The uneven distribution of the populationpartly reflects differences in land fertility, but is also the result ofinternal migration which made for an early start in economic development inthe south.
3. Malawi has few mineral resources, and agriculture, for which it iswell suited, is the basis of the economy. Agriculture contributes over 45percent of GDP and about 90 percent of the population depend on it. Influencedby weather agricultural production fluctuates considerably from year to year.Estate agriculture contributed half of merchandise exports in 1973 butsmallholder production accounted nonetheless for 87 percent of total agri-cultural output.
4. Malawi became an independent country in 1964 after the break-up ofthe Federation of Rhodesia and Nyasaland. The ruling Mlalawi Congress Partywhich is the sole political party, has been in power since and its machineryreaches down to the village level. Decision making is centralized andPresident Kamuzu Banda, who has been in office since 1964, exercises a strongpersonal influence on the life of the country. In 1970, the party's annualconvention elected Dr. Banda, Life President of the Republic.
II. RECENT ECONOMIC DEVELOPMENTS
A. The Growth of the Economy
Output
5. Over the period 1965-1973 Malawi's gross domestic product at 1964constant prices grew by an average of 8 percent per year to reach 'K 429 mrillionin 1973. Per capita income grew at an average rate of 5.5 percent sinceindependence, and was equivalent to about US$105 in 1973. Tne growth ratesachieved compare favorably with those of other African countries at a similarstage of development and also with the country's own targets. The target GDPgrowth rate set for 1971-1980 in the Statement of Development Policies,-(DEVPOL) was 7.8 percent per year.
-2-
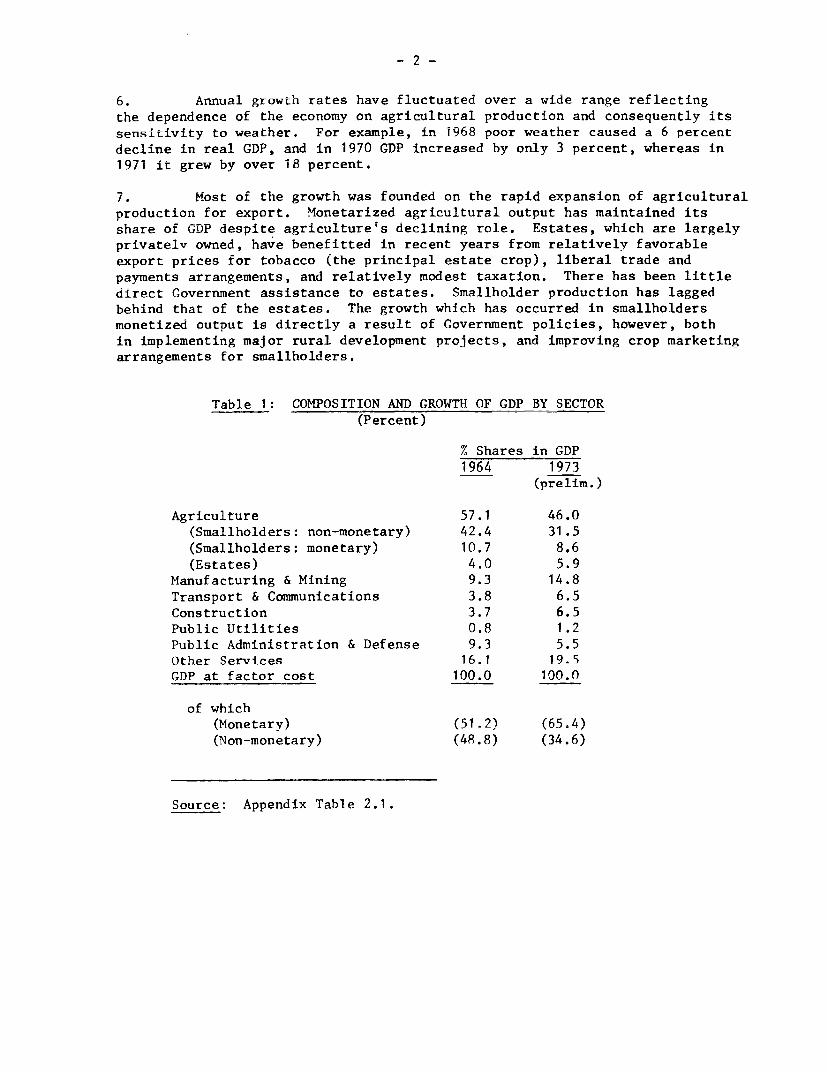
6. rAnnual growth rates have fluctuated over a wide range reflectingthe dependence of the economy on agricultural production and consequently itssensitivity to weather. For example, in 1968 poor weather caused a 6 percentdecline in real GDP, and in 1970 GDP increased by only 3 percent, whereas in1971 it grew by over 18 percent.
7. Most of the growth was founded on the rapid expansion of agriculturalproduction for export. Monetarized agricultural output has maintained itsshare of GDP despite agriculture's declining role. Estates, which are largelyprivatelv owned, have benefitted in recent years from relatively favorableexport prices for tobacco (the principal estate crop), liberal trade andpayments arrangements, and relatively modest taxation. There has been littledirect Government assistance to estates. Smallholder production has laggedbehind that of the estates. The growth which has occurred in smallholdersmonetized output is directly a result of Government policies, however, bothin implementing major rural development projects, and improving crop marketingarrangements for smallholders.
Table 1: COMPOSITION AND GROWTH OF GDP BY SECTOR(Percent)
% Shares in GDP1964 1973
(prelim.)
Agriculture 57.1 46.0(Smallholders: non-monetary) 42.4 31.5(Smallholders: monetary) 10.7 8.6(Estates) 4.0 5.9
Manufacturing & Mining 9.3 14.8Transport & Communications 3.8 6.5Construction 3.7 6.5Public Utilities 0.8 1.2Public Administration & Defense 9.3 5.5Other Services 16.1 19.5GDP at factor cost 100.0 100.0
of which(Monetary) (51.2) (6564)(Non-monetary) (48.8) (34.6)
Source: Appendix Table 2.1.
-3-
8. Much of the stimulus behind the rapidly increasing output in themanufacturing and some service sectors has come from agriculture. Theincreased output of export crops has necessitated a comparable increase inprimary processing. distributive and re-mmprrinl aetivities; while the cashincomes generated by the export of agricultural products have generated awider demand for consumer goods, many of whirh are mantifarrtirPd Ine'allv
9. The growth nroaes has been further stimulnted hu the high invest-ment program, which has promoted a rapid expansion of construction and bywage remittanrpS frnm Malawiann orkers abroad, which have served to generategreater consumer demand. The overall share of the services sector has remainedstable- during the period, despite the growth of transport and co^m^ercralactivities, reflecting restraint in expenditures on public administrationanrd dPfp,nQw tjhnan ^ 1n4-A - 4._4 rTnD __ .1A14A-A from 9 3 o A R Aprc
Savins and Invest..ent
10. At1 the uiM=. of Independence 'Mlcaawi's dom,estic consum,ption abusorbednearly all of its product. For many years the Government incurred a deficiton its recurrent bDUdg6-et wh-iCIhI wa-S finnery-rts--deay U~LLvs .LcuuLCLz UuuiCL llul W":i nanced Dy Dr.LL.l5l L)UUgtL.ULY bUpPULL.
With a combination of rapid growth in GDP and a high marginal propensity tosave, gross domestic savings if increased from iess tnan 3 percent of GDP in1964 to 10.6 percent in 1973. National savings increased more slowly asthe fiscal posit'ion improved and U.K. budgetary support was gradually eliminated.
11. Gross domestic investment rose at an average annuai rate of 25percent; as a percentage of GDP it increased from 11.3 percent in 1964 to17.4 percent in 1973. The share of the public sector in gross fixed capitalformation averaged a little over 50 percent during this period. A breakdownOL capital formation by sector is not available, but there has clearly been ahigh concentration in transport and agriculture. The fast liquidating natureof many private investments has kept the incremental capital/value added ratioaround 2.0, despite the concentration of public investment in infrastructureprojects with less immediate impact on output. Towards the end of the period,the incremental capital/value added ratio may have been around 1.9 comparedwith 2.1 at the beginning as several of these infrastructure schemes reachedmaturity and began to realize economic benefits.
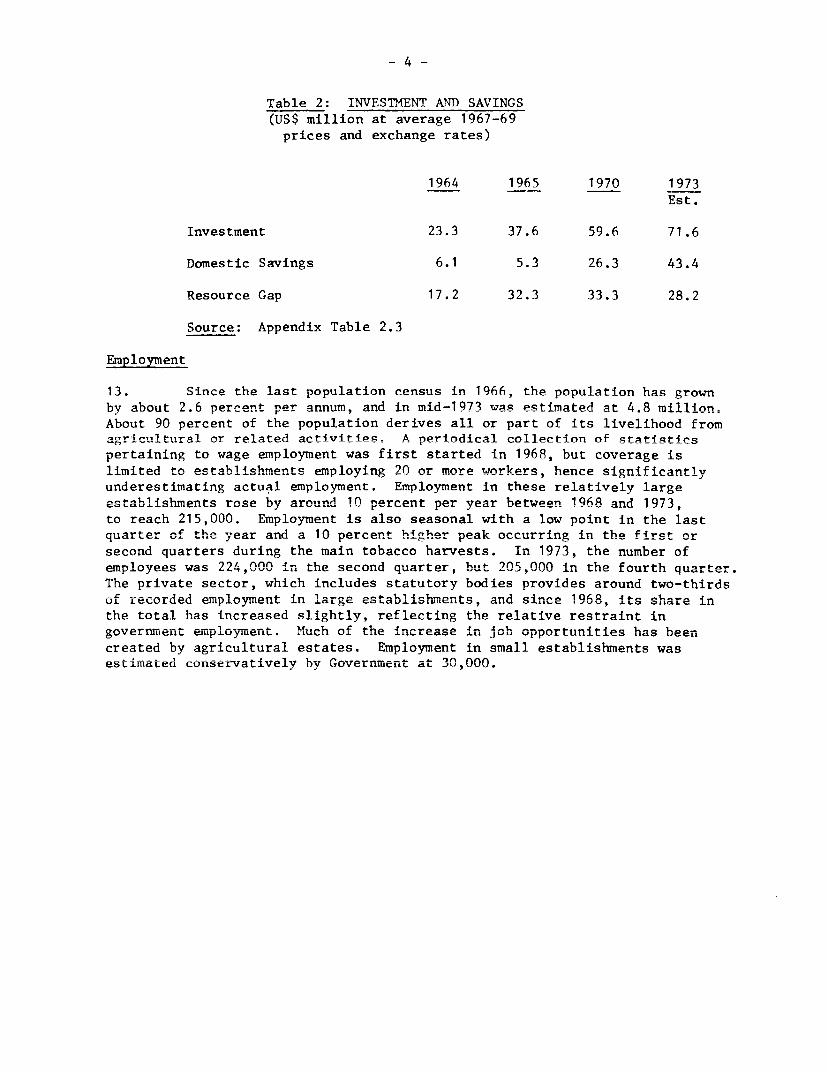
12. Since 1964 the rate of growth of investment in current prices hasexceeded that of savings, with the result that Malawi's resource gap haswidened considerably. As most investment goods were imported the rise inimport prices in recent years has considerably eroded the purchasing powerof external finance, and in fact the resource gap in real terms has been moreor less constant at US$30 million since 1965. Domestic savings, which finan-ced only 26 percent of investment in 1964, financed 61 percent in 1973.
1/ Averagie 1967-6Q pvri4acs nA-ehange rates are widely used in this reportas a basis for constant price data expressed in US dollars.
- 4 -
Table 2: INVESTMENT AND SAVINGS(US$ million at average 1967-69prices and exchange rates)
1964 1965 1970 1973Est.
Investment 23.3 37.6 59.6 71.6
Domestic Savings 6.1 5.3 26.3 43.4
Resource Gap 17.2 32.3 33.3 28.2
Source: Appendix Table 2.3
Employment
13. Since the last population census in 1966, the population has grown
by about 2.6 percent per annum, and in mid-1971 was Pstimated at 4.8 million.About 90 percent of the population derives all or part of its livelihood fromagricultur--1 on-r related activities. A periodical collection of statistirspertaining to wage employment was first started in 1968, but coverage is
limited to establishments employIng 90 nr more workers, hence significantiyunderestimating actual employment. Employment in these relatively largeestablishments rose by around 10 nercent per year between 1968 and 1973,
to reach 215,000. Employment is also seasonal with a low point in the last
quarter of the year arnd a 10 percent higher peak occurring in the first or
second quarters during the main tobacco harvests. In 1973, the number of
er,ip'loyees was 224,000 in the second qua-ter, but 205,000 in the fourth quarter.
The private sector, which includes statutory bodies provides around two-thirds
oL recorded em,plo-yment in Large establish...ents, anA since 1968, its slhare ir.
the total has increased slightly, reflecting the relative restraint ingoverrirtent eipLoyLuent. Much ofi the increase in Job opportunities has b.een
created by agricultural estates. Employment in small establishments was
estimated conservatively by Government at 30,000.
- 5 -
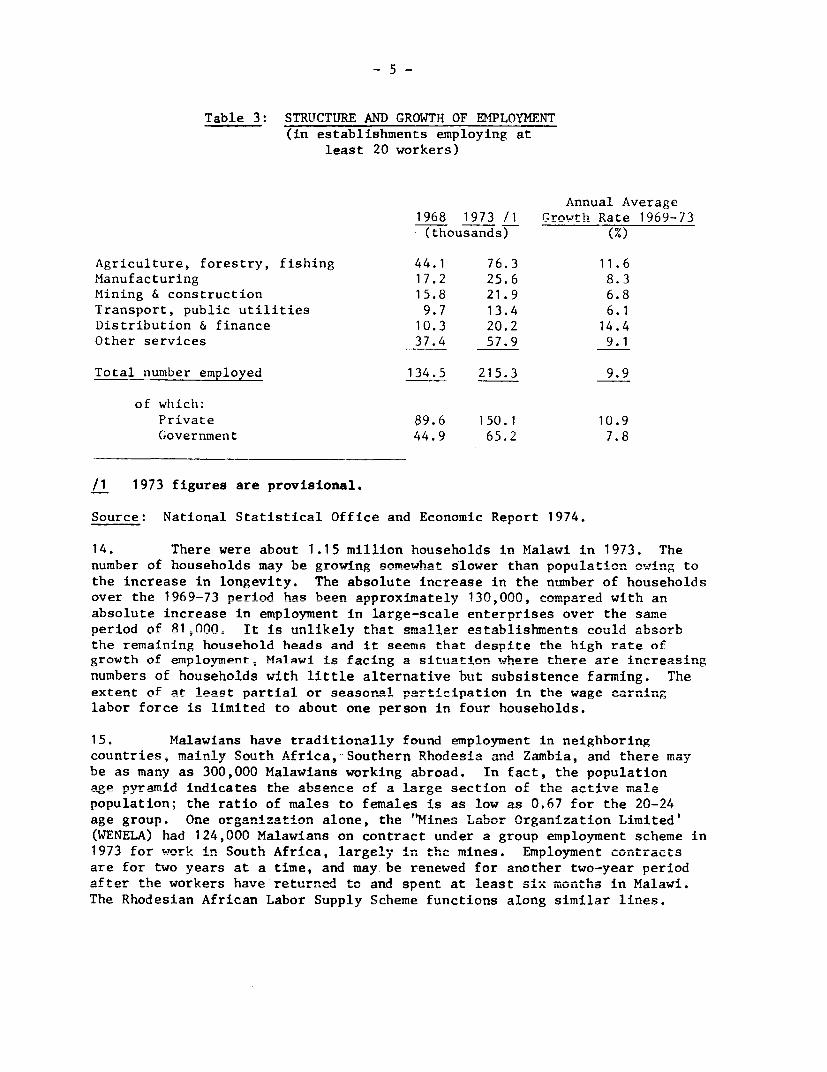
Table 3: STRUCTURE AND GROWTH OF DEPLOYMENT(in establishments employing at
least 20 workers)
Annual Average1968 1973 /1 Grnowth Rate 1969-73(thousands) (%)
Agriculture, forestry, fishing 44.1 76.3 11.6Manufacturing 17.2 25.6 8.3Mining & construction 15.8 21.9 6.8Transport, public utilities 9.7 13.4 6.1Distribution & finance 10.3 20.2 14.4Other services 37.4 57.9 9.1
Total number employed 134.5 215.3 9.9
of whicih:Private 89.6 150.1 10.9Government 44.9 65.2 7.8
/1 1973 figures are provisional.
Source: National Statistical Office and Economic Report 1974.
14. There were about 1.15 million households in Malawi in 1973. Thenumber of households may be growing somewhat slower than population owing tothe increase in longevity. The absolute increase in the number of householdsover the 1969-73 neriod has been approximately 130,000, compared with anabsolute increase in employment in large-scale enterprises over the sameoeriod of 81O00W It is unlikely that smaller establishm,ents could absorbthe remaining household heads and it seems that despite the high rate ofgrowth of emplovment; Malawi is farcnv a situation where there are increasin-numbers of households with little alternative but subsistence farming. Theextent of at leant nartial or seasonal partici-ation in the wage earninglabor force is limited to about one person in four households.
15. Malawians have traditionally found employment in neighboringcountries, mainly South Africa, -Southern Rhodesia and Zambia, and there maybe as many as 300,000 Malawians working abroad. In fact, the populationagei nvra-…id indicates the absence of a large sectior. of the active mzlepopulation; the ratio of males to females is as low as 0.67 for the 20-24age group. One organzation alone, the "Mines Lsbor Organ.ization `LL4r.LiLe
(WENELA) had 124,000 Malawians on contract under a group employment scheme in1973 for work in South Africa, largely in the mines. EUmployment contractsare for two years at a time, and may be renewed for another two-year periodafter the workers have returned to and spent at least six months in MalawiThe Rhodesian African Labor Supply Scheme functions along similar lines.
- 6 -
16. Historically, an outlet for excess labor supply has been supplied bythese opportunities for employment abroad, which have been expanding rapidlyfor several years. More recent-y, the Government's focus on rural developmentschemes to improve the conditions of life in rural areas has probably alsobeen responsible for removing some of the potential pressure for employment.Thus, despite the apparent increase in the number of households whose mainalternative i4s subsistence farming, there h,as 'Deen l"ittle evider.ce of excesslabor supply. Rural-urban migration has been kept under control, and thegr^wth rate of the population of Blantyre h.as in fact lbeen estiLmated' at only6.5 percent per annum. Both these figures are relatively low compared withother African countries at a similar level of development. 'Urban unemploy-ment has also not been a major problem - the Blantyre Sample Census found only3.1 percent of the labor for.e 4n Blantyre une.IIployeU.
17. As long as employment poss 't.lLes remain available abroad, it isunlikely that Malawi will suffer from widespread unemployment. EmploymentopportunLtites '£n Joutl Ai'rca are Likely to continue to be available, probablyin increasing numbers, though there are indications of rising difficulties forforeign workers in Zambia and less favorable employment conditions in SouthernRhodesia. The stabilization (or even reduction) of the number of Malawiansemployed abroad would transfer rm-uch greater pressure onto the domestic labormarket, and would underscore the need to promote attractive self-employmentopportun'ties in the smalilholder farming sector and other smallscaleactivities.
B. Income Distribution
18. Government policy towards the distribution of incomes has beenformulated within the longer term aims or DEvvOL, and is linked both toregional objectives and wage and price policies. The rationale underlyinggovernment policy is the following. Minimum wage rates have been appliedin Malawi since the early 1960's and have reportedly been adjusted only inresponse to changes in productivity. This policy was aimed at (a) avoidingany widening of income disparities between urban and rural workers, (b) pre-venting wage cost increases in the agricultural output of estates fromjeopardizing the competitiveness of Malawi's exports, and (c) broadening themarket for local industry to bring about a demand-induced expansion ofdomestic production. Specific measures to encourage industrialization werealso taken and have resulted in the creation of a small urban class.
19. Since 1968 real incomes of wage employees have been eroded by priceincreases. The GDP deflator rose by about 30 percent in the 1969-1973 period,while average earnings of all wage workers increased by only 11 percent. InBlantyre the low income price index went up by 30 percent while the minimumwage index rose by 18 percent. In other urban areas prices probably increasedmore slowly, but minimum wages rose by only 9 percent.
20. At the same time prices paid to farmers for their crops have keptabreast of consumer price increases. The mission estimates 1/ that 1973 farm
1/ Based on an index of crop prices weighing each crop by its share in totalADMARC purchases from 1968 to 1973.
-7-
prices were about 28 percent above their 1968 levels Even assuming noincrease in productivity, earnings would therefore have stayed more or lessconstant i: term-s. of their purchasing power. Ir fact evidencefrom rural development project areas in particular, suggests that productivitybs rise,.. It even seems that farmers 1have even fared better than wage workers
in agricultural estates where average earnings increased by about 20 percentin ~ the 0I-7 perio.oUU
The 'LLLUtc rpt'es bLetween urba. a.L-d rural areas has thus -ro-
bably been reduced since 1968. Even in 1968 it was not extreme. Annual cashrece'Lpts per rural househoold averaged 'U 40 in 1 7 WhiLL Le thle minru, wage ir
urban areas other than Blantyre was equivalent to about K 90. The current gap,as perceived by a typical farmer with little education or em-uployable skills,between his earning capacity in farming and in the likely urban employmentalternatives is probably not great, particularly when the higher cost of urbanliving is taken into account.
22. The success of Government policy in minimizing the gap between urbanand rural incomes has held the pace of urbanization to a low level and hascontributed to low levels of urban unemployment. As a result, excesses ofpoverty are conspicuously absent in Malawi, while urban development has so farnot involved the extremes found in many large cities of the world. In economicterms this aspect of Government policy also appears to have justified itself bywidening the market for domestic manufactures and reducing the demand forimports. The success of import substituting industry in Malawi is due in nosmall part to the wideness of the markets for its products, and it is likelythat a greater concentration of incomes or wider urban-rural income disparitieswould have led to levels and types of demand that could only be met throughthe import market.
23. However, the Government's policy of encouraging large manufacturesand agricultural estates has been accompanied by relatively high financialreturns to those with the ability and willingness to develop new productiveenterprises. This has made for a substantial concentration of incomes intorelatively few hands over recent years. Thus, while there is a close balancebetween the incomes of the vast majority of the population, there has also beena tendency for a small number to increase their overall share in incomes. Onthe basis of various data relative to 1969, the mission estimated that thepoorest 40 percent of the population probably received about 25 percent of in-comes, and the next 40 percent of the population about 30 percent of incomes.On the other hand the top 5 percent may have had as much as 30 percent of in-comes. That there has been a trend towards greater concentration is shown bythe fact that the share of wages and salaries in value added 1/ in bothagricultural estates and industry has declined since 1968, indicating a highershare for profits, dividends, depreciation and direct taxes. This concentration,which on the surface suggests a growing income disparity has to be seen in the
1/ Va'Lue aaded here excludes interest, corresponding to net output as definedin Government publications.
- 8 -
context of Malawi's growth objectives and the purpose served by a high andgrowing level of profits. The structure of company tax heavily favors the re-investment of profits over their distribution. No tax is levied on the former.i h- as been a malJor an essential actor iLn ensurLng thLa prof"Lts are used
not for conspicuous consumption by a small elite but for financing the contin-uing growth of innvestment. If a concept of disposable personal incomeincluding only the distributed part of profits were used for in-comue comapaeuisons, the intra-personal distribution of income would be lessskewed than is otherwise suggested. The concentration of ownership of assetsimpliedain the longer run'cycurrent trends is considered by government as aprice to be paid for the development of the private sector economy.
C. Public Finance 1/
24. At Independence, the Malawi Government inherited a very difficultfinancial position from the former Central African Federation Government. Anarrow tax base and a low level of taxation enabled only just over half ofthe expenditures on Revenue Account 2/ to be financed from local resources,the balance being met by the United Kingdom mainly in the form of grants. Im-provements in government finance have been achieved by restraining expendi-tures on Revenue Account to a modest rate of growth (averaging 8 percent peryear since independence), while revenues increased at a much more rapid rateof 15 percent per year. In 1972/73, this account was balanced without externalsupport for the first time.
1/ The public sector includes, in addition to Central Government, localauthorities and 13 state-owned corporations. Local authorities receivemost of their funds from Central Government, either as personal taxescollected on their behalf or outright grants. Public corporationsgenerally operate on a commercial basis, with access to commercial andgovernment sources to meet capital finance requirements.
2/ Government maintains two budgetary accounts -- a Revenue Account whichis credited with tax and other receipts, and which finances mainly re-current expenditure, and a Development Account into which foreign loansare paid, and which finances mainly capital expenditures. The fiscalyear was January-December until the end of 1969, an exceptional 15 monthsfrom January 1969 to March 1970, and April-March since then.
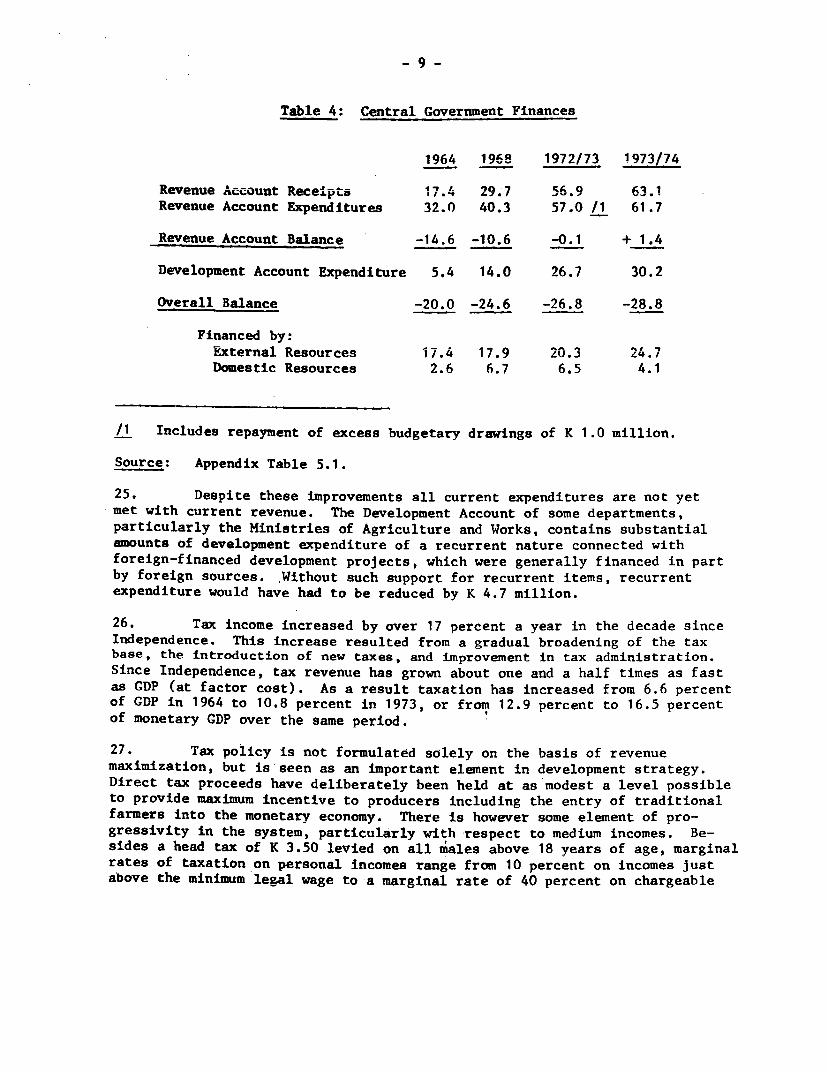
Table 4: Central Government Finances
1964i- 1968 1972/73 1973/74
Reve-Uue Accout Recceipts I.4 7 5,6.9 63.1Revenue Account Expenditures 32.0 40.3 57.0 /1 61.7
Revenue Account Balance -14.6 -10.6 -0.1 + 1.4
Development Account Expenditure 5.4 14.0 26.7 30.2
Overall Balance -20.0 -24.6 -26.8 -28.8
Financed by:External Resources 17.4 17.9 20.3 24.7Domestic Resources 2.6 6.7 6.5 4.1
/1 Includes repayment of excess budgetary drawings of K 1.0 million.
Source: Appendix Table 5.1.
25. Despite these improvements all current expenditures are not yetmet with current revenue. The Development Account of some departments,particularly the Ministries of Agriculture and Works, contains substantialamounts of development expenditure of a recurrent nature connected withforeign-financed development projects, which were generally financed in partby foreign sources. .Without such support for recurrent items, recurrentexpenditure would have had to be reduced by K 4.7 million.
26. Tax income increased by over 17 percent a year in the decade sinceIndependence. This increase resulted from a gradual broadening of the taxbase, the introduction of new taxes, and improvement in tax administration.Since Independence, tax revenue has grown about one and a half times as fastas GDP (at factor cost). As a result taxation has increased from 6.6 percentof GDP in 1964 to 10.8 percent in 1973, or from 12.9 percent to 16.5 percentof monetary GDP over the same period.
27. Tax policy is not formulated solely on the basis of revenuemaximization, but is seen as an important element in development strategy.Direct tax proceeds have deliberately been held at as modest a level possibleto provide maximum incentive to producers including the entry of traditionalfarmers into the monetary economy. There is however some element of pro-gressivity in the system, particularly with respect to medium incomes. Be-sides a head tax of K 3.50 levied on all miales above 18 years of age, marginalrates of taxation on personal incomes range from 10 percent on incomes justabove the minimum legal wage to a marginal rate of 40 percent on chargeable
- Lu -
incomes above K 11.000. Company taxation has also been devised to attractprivate foreign investment. Company income is taxed at 40 percent, with a5 percent surcharge for companies not registered in Malawi. This surchargeis, however, not paid where companies can demonstrate that the inrcome wouldnot be liable for tax in the country of origin, thus avoiding excessiveremittance abroad because of differential tax liability. Wnile 40 percent isnot particularly low, there are special deductions which can be claimed byfarmers and industrialists including generous capital allowances. in 1973/74,company tax was expected to yield K 10.1 million and personal taxes K 7.8million out of a total tax revenue of K 43.5 million. Direct taxation hastended to grow somethat slower than other taxes.
28. Instead of direct taxes, a more indirect system has been preferred,with relatively greater emphasis on consumption. Domestic consumer goods aretaxed in part by excise taxes, and in part by surtax, introduced in 1970/71and which now provides over one-fifth of tax revenues. This tax is a goodexample of Malawi's policy to extend indirect taxation. Essentially a salestax levied at the wholesale level on domestic and imported goods, surtax isbasically progressive because food is excluded, and because it is levied onthe value of products after excise or import duties. As excise tax is leviedonly on a limited number of luxury items and import taxes are higher onluxuries, this increases the degree of luxury taxation. At the same time,investment is encouraged because capital goods are excluded. These featuresare combined with the advanitages of simplicity, ease of administration, widecoverage and 1/ minimal collection costs. Imported goods are taxed at ratesup to 60 percent and averaging 15 percent. The tariff structure is thus usedto protect domestic industry in certain cases, as well as to raise revenue.
29. Fccurrent expenditures for social services, particularly education,increased rapidly after Independence, as a response to the need to improveon the low education levels then prevailing- The share of qorial serviresin the Revenue Account budget rose from 18 to 26 percent from 1964 to 1968,where it has stabilized in recent years. The share of agriculture fluictutatedbetween 6 percent and 8 percent, from 1964 to 1974 while the share of infra-strucrture, such as transnort, posts and commimnrntions, and public works
declined from 21 percent to 13 percent. Administration and security expend-itures rose in the first years of Independence but have since had a combinedshare of 25 percent. At Independence, one-fifth of expenditure on RevenueAccount expenditure was claimed by public debt service, with the proportionfalling to around 10 percent in the late 1960s, reflecting an increase in,grant aid to Malawi. IJith increased borrowing i-,n ------ yer,i priuaLY cars, in jCIL L±AU1ar,
for the Nacala railway link, public debt service has risen again, and nowaccounts for 16 percent of the expenditure.
I I U~L L L .. WS, .. . L~£ L L IL~ IL~U£ iI~LL a eit/ Fruit machines which are an insignificant share ofL imports are taxes
at 100 percent. Protection of industry has generally been modest, withrates pragmatiLca L'Ly determLined wIlere a possible monopoly Eituation mightexist. Industries are ultimately expected to become competitive andprotectilon may be withdrawn. AIn two tj'er system o tarifr protection isoperated to minimize abuse of protection.
30.~I-n 191710, thle Gver,-ment introluced three-year ceilings on recurrentexpenditures of individual Ministries as a new method of budgetary controladu plann'1rLg. Ii. le present ceilings, which are net oUL LincoUme f r Om1 d epartr,IentL
services, have been successfully applied and allow annual increases of 10prcent1L £or Ltne Ministries OI worKs and Agriculture, oI 7.5 percent for cneMinistries of Education and Health, of 5 percent for the university and of4 percent for most other Ministries and departments. Tne system of three-year ceilings is linked to the three-vear rolling budget system that hasbeen adopted for development expenditures. Tne first year of the three-yearprogram contains firm figures and proposals while the figures for the secondand third years are indications of further investment contemplated by theGovernment. The approach is innovative, and combines an approach to planningwith flexibility that has proved successful so far in implementing theobjectives of the 10-year Statement of Development Policies.
31. Concurrently with the improvements in the recurrent budget, thegovernment outlays on Development Account rose from K 5.4 million in 1964to over K 34 million in 1973/74. The share of economic infrastructure,mainly transportation and agriculture, increased from 67 percent in 1964-68to 74 percent in 1969-73, while the share of social infrastructure, mainlyeducation and health, was reduced from 23 to 8 percent. The change in thecomposition of the development budget during 1969-73 was heavily influencedby a small number of large projects, particularly the Nacala railway link,some roads, a few large agricultural projects, and the first phase of thenew capital city at Lilongwe. The lack of basic transport infrastructurewith which the Government was faced at Independence justified a relativelylarge weight for this sector in development expenditures, both in the con-struction of an internal highway network from north to south, and in providingalternative links to the sea.
32. In the absence of budgetary savings until 1973, most of the develop-ment outlay since 1964 was financed by external assistance, which averagedK 22 million annually for the last five years. Throughout the period, theUnited Kingdom remained the single main source of foreign aid, although ofdiminishing importance. Aid from the U.K. -to Malawi has gradually changedfrom grants to soft loans, and from contributions to the recurrent budgetto only aid to the development budget. In this process, total disbursementsfrom the U.K. decreased from K 17 million (70 percent grants) in 1964 to K 9million (95 percent grant) in 1973/74. While the U.K. reduced its aid,Malawi was able gradually to mobilize finance from other foreign sources,both bilateral (mainly South Africa, Germany, Canada, Denmark and U.S.A.)and multilateral (mainly World Bank Group), so that sources other than theU.K. now provide about 70 percent of Malawi's external capital assistance.To date, direct government borrowing has only been on the most concessionaryterms.
33. Domestic borrowing remains relatively small. It is tailored to theneed to provide a local contribution to externally financed nroiec-t and tofinance projects which generally do not attract external finance. During thepast five years; domestic borrowing averaged K 5.3 millinn per year. The main
- 12 -
instrument for Government's domestic borrowing are securities with maturitiesranging between two and twenty years (locally rpeiqtprpd stork)- The ReserveBank issues these securities and holds any unsubscribed balances. The bankingsyst- hka hbn, hold4in about 20-25 npre-ont of tha ln.ocl raeictaerA ctntL-
during recent years. Outside the banking system, the most important subscribersare local financlal4 f institutions such as the Post Office Savings Bank, insurance
companies, and a building society.
34. The financial position of the public sector in toto has been ratherstronger than that of Government alone. Careful financial management ofpublic enterprises has succeeded in making the majority profitable. Minor-leic its A are generally incurred by the Smi..lholder TeSa Authty, Uth Capital
City Development Corporation and Malawi Broadcasting Corporation (which israte ^ v4 _. ..k14 A.4AE 2 A,^ k.. MA1 .. 4 Railways.
operated *Ln any Lcas as a L V UJ pLsV yisX iay X s W4 O -
On the other hand, the Agricultural Development and Marketing Corporation(A h- ADC)% has - nrt larg surpluses in r1 - t - years, a g K 6¶1-WJLJ-LLUXt,J iiat ~ r,=LICL a LMU .a OUtIt ~ l L C%_LC1 y a M,aVZL.2r,.LL1, I U .U
million, which have outweighed by far not only the small losses of certainpublic corporatiLons, but aLso the surpluses oL otLers. tOveraLL pUUliL cUL
porations probably generated combined surpluses of around K 7 million beforetax Ln eachl ofl thle 'Last LlV years, which have graduualy become 'arger thlanthe deficits of Government. 1971 was the first year in which real publicsavings were achieved. In 1972, pub.l savings we I .0 equiv-
alent to 4 percent of domestic savings, and while no definite figures are yetavailable, greater savings may have been realized in 1973.
D. External Financing
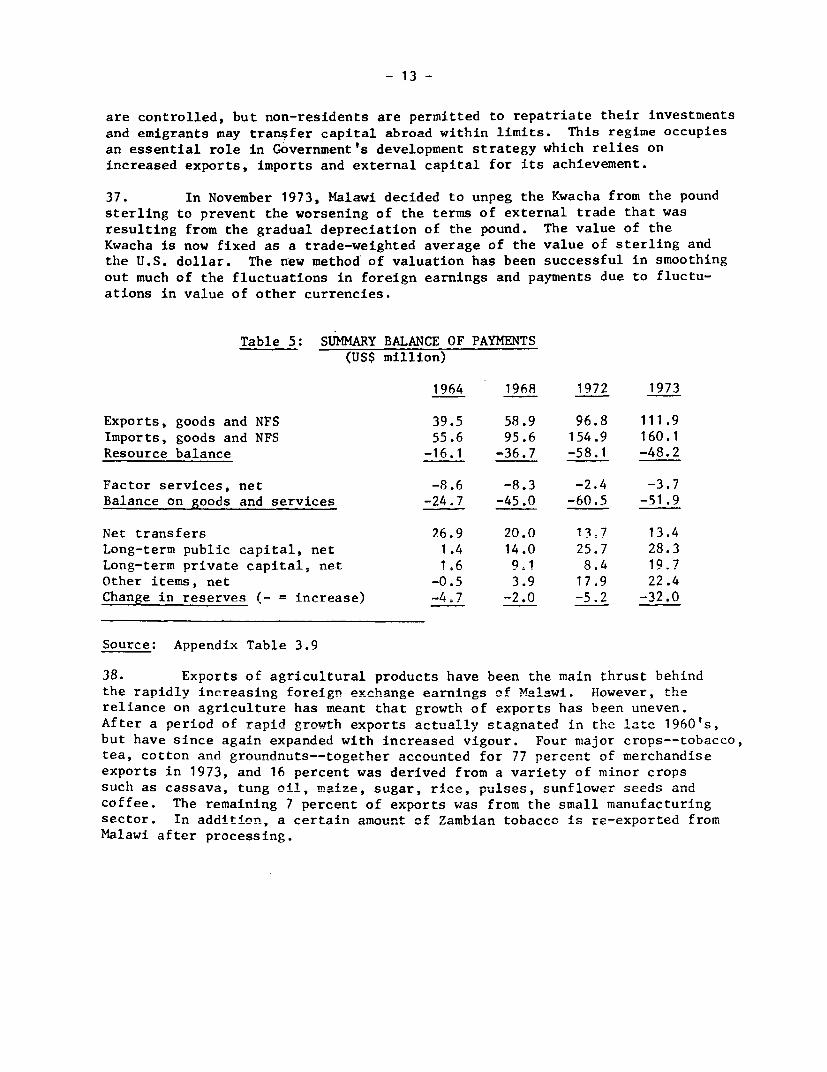
35. Over the period 1965-1973, Malawi's exports and imports in currentprices (including non-factor services) have both risen at just under 15percent annually. The resource gap has risen from US$16.1 million in 1964to USS48.2 million in 1973, averaging slightly less than 35 percent of totalimports throughout the period. Tnere have been increasing wage remittancesbv Malawians working abroad, which reached about US$15 million in 1973. Thuscatching up with the amount of investment incomes paid abroad in recentyears. Net transfers have declined substantially, owing to the phasing outof British budgetary aid. The reduction of budgetary aid has been accompaniedby increased capital inflows to both public and private sectors. Foreignexchange reserves were gradually built up and, as of the end of 1973,stood at $67 million, equivalent to 6 months' imports.
36. Government policy towards trade and payments has been liberal. In1973 exports plus imports were equivalent to 54 percent of GDP in value. Asa general rule, imports originatinig in the sterling area are free of license,while those originating in GATT countries outside the sterling area are underopen general license. The only restrictions on payments and transfers forcurrent transactions are those applied to foreign exchange allocations fortravel and a few other invisibles. There are no restrictions on the transferabroad of dividends and profits of non-resident controlled companies providedthat no recourse is made to local borrowing. Outward transfers of capital
- 13 -
are controlled, but non-residents are permitted to repatriate their investmentsand emigrants may transfer capital abroad within limits. This regime occupiesan essential role in Government's development strategy which relies onincreased exports, imports and external capital for its achievement.
37. In November 1973, Malawi decided to unpeg the Kwacha from the poundsterling to prevent the worsening of the terms of external trade that wasresulting from the gradual depreciation of the pound. The value of theKwacha is now fixed as a trade-weighted average of the value of sterling andthe U.S. dollar. The new method of valuation has been successful in smoothingout much of the fluctuations in foreign earnings and payments due to fluctu-ations in value of other currencies.
Table 5: SUMMARY BALANCE OF PAYMENTS(US$ million)
1964 1968 1972 1973
Exports, goods and NFS 39.5 58.9 96.8 111.9Imports, goods and NFS 55.6 95.6 154.9 160.1Resource balance -16.1 -36.7 -58.1 -48.2
Factor services, net -8.6 -8.3 -2.4 -3.7Balance on goods and services -24.7 -45.0 -60.5 -51.9
Net transfers 26.9 20.0 13.7 13.4Long-term public capital, net 1.4 14.0 25.7 28.3Long-term private caDital. net 1.6 9.1 8.4 19.7Other items, net -0.5 3.9 17.9 22.4ChanRe in reserves (- = increase) -4.7 -2.0 -5.2 -32.0
Source: Appendix Table 3.9
38. Exports of agricultural products have been the main thrust behindthe rapidly increasing foreign exchange earnings of Malawi. However, thereliance on agriculture has meant that growth of exports has been uneven.After a period of ranid grnwth exports actually stagnated in the late 1960's,but have since again expanded with increased vigour. Four major crops--tobacco,tea, cotton and groundnuts--together accounted for 77 percent of merchandiseexports in 1973, and 16 percent was derived from a variety of minor cropssuch as cassava. tunp oil, maize, sugar, rice, pulses, sunflower seeds andcoffee. The remaining 7 percent of exports was from the small manufacturingsector. In addition, a certain amount of ZaM.bian tobacco is re-exported fromMalawi after processing.
- 14 -
39. In 1973, exports of agricultural crops produced by agriculturalestates exceeded 50 percent of total merchandise exports for the first time,prompted by the expansion of areas under cultivation by estates in recentyears, combined with favorable Government policies and higher internationalprices in 1973. Most of the increase in exports from estates has beenachieved through volume increases or by systematic movement into higherquality grades of tea and tobacco. Export of smallholder crops has grownless rapidly than estates crops; the volume of exports of some crops suchas vroundnuts; cotton and pulses has stagnated or declined over the lastfive years, while the volume of exports of other crops such as tobacco andrice has increased. Export prices of smallholders crops have, however, risenfaster than those of estate crops on averages.
40. The volume of exports in 1973 rose by 4.6 percent, while exportprices rose by 9Q8 nprr-nt- Tobacco and tea exnorts hoth rose substantia11yby volume, by 12 and 15 percent respectively, although these figures concealniquaity c-hanogs Th. volium in^rpaspe weprp stim,latnpid in the rca of the
former by an 8 percent price rise and in the case of the latter by favorablegrowing conditions. On the other hand the vuim of many other crops fell,including groundnuts, cassava, maize and cotton. In the case of all theseproducts the decline in volume was cushioned by in-ea-e in pri-c Su- and
rice have both been introduced into Malawi's exports in recent years, and in1973 both attained record volumes and prices. For the f4rst t4me the two
crops were able to make a significant contribution to export earnings of 4percent each.
. 1 L M 4o A4ec!.. f.hJ 4. 0 , e L e . i. Aer h nd se importJ - ,4- A 1 / j .7 _ S I ICLIzOL .F# _ssu11 L, V 1s IIX|L<LV/Iv* sXWL
since 1964, showed important structural changes. The share of consumer goodshlas decreased -Prom. 49 percent of m,erchandise 4n !964 to 28O ppercent in 1973.IL0 ci.L ca c £ LJL t2 p ic i L_ J UI_ A L.iLuuOc . ,U-t Li. £.)V ~ L LI I 1 J -
This reflects the substitution by the production of a number of local indus-tries oL gooUs previAous'ly imLILportedU. Mlost o'L thle new consumer goodus i'UnLustrLes
are based on imported raw materials. Important exceptions are cotton process-ing and the umanuf'acture of textiles, sugar and somue beverages, in wnicn tne
nature or volume of local raw materials endows Malawi with a comparative ad-vantage. imports of industrial raw materiais have grown more rapidly thanother imports, their share increasing from 29 to 40 percent in the 1965-1973period. Tne import of intermediate goods, particularly cement and buildingmaterials has grown rapidly to meet the needs imposed by increasing investment.Fuel and petroleum products accounted for about M percent of merchandise im-ports in 1973, and were some 30 percent greater in value than two yearspreviousiv. Recent oil price increases have not yet affected Malawi substan-tially, but total payments for fuel and petroleum products can be expected todouble from 1973 to 1974.
42. in 1973 the volume of imports declined by 9 percent, which afterallowing for a 12 percent increase in prices, implied an overall growth ofimport values of 3 percent. The decline in volume was due to reduced importsof capital goods and an exceptional decline in building and constructionmaterials imports. The volume of construction work undertaken by the Ministryof Works fell as several major works were completed, and private building
- 15 -
aciv4it- in Blantyre annd T gwe anlsoe fell of-f slightl Simultaneously;
the domestic production of building and construction materials increased byalmost 25 percent and competed effectively with imported produicts- There was
a reduction in the volume of imports of transport equipment for Malawi Railways,andI -in additon 1972 volume figur- w-r- raise hby the 4 mnnfrt nf n RAr 1-il&u X UA.L 1 -1 I -s s - | vv - ---- -j -.. , E-^ -- &^~
jet for Air Malawi. The overall decline in volume of imports does not suggestany~~1__ logtr, as n th-e level ofg AemandI in Malawi. In fact imports of
aiy IQ 1 JLr,-LCLtL ii .LL L -LIA .L V u - I L .. . .. o
consumer goods and most intermediate goods, apart from those related to con-struction, rose in volume in 1973. Th.e overall balance on non factor servicesremains negative due to the high incidence of freight and insurance charges on
Ma.law.' s ow,. trad'e.
*4. ractor service receipts lave grow.. Ja_ Ls Ltan pay si.
Independence, and the deficit on factor services was reduced to US$3.7 mil-
lion by 1973 compared to a deficit of US$8.6 M.Lillion in 1964. The number ofMalawians abroad working under the various mines labor recruitment schemeshas increased and at the same time wage rates paid have rLsen also. Assuch schemes provide for compulsory savings to be remitted to the workers'home country, there has been a rapid build-up of wage remittances, whichreached USS15 million in 1973 three times their level at Independence.Simultaneously, the growing use of technical assistance necessitated bythe development program and the increased number of expatriates in managerialpositions in the private sector has raised remittances abroad of earningsand profits. In total profits, interest and dividends reached US$15 millionin 1973, while earnings remittances were US$4 million.
44. Net transfers declined by just over 40 percent since Independenceto USS12.8 million in 1973, mainly as a result of the phasing out of Britishbudgetary aid. On the other hand, public long-term capital inflows havegrown, as British Development loans were increased, and as other assistancewas obtained from multilateral and bilateral sources. Inflows of publiccapital reached a peak in 1970 when the financing requirements for theNacala rail link were highest, but have generally shown an upward trendreaching US$28.4 million in 1973. Until 1972, most loans were made directlyto Government, with relatively little borrowing by public corporations.In 1972, significant borrowing was made for the first time by public enter-prises which to date have drawn on some commercial loans as well as theexisting channels of external public assistance that are being used by Govern-ment. The Government's policy has been to diversify and extend the sourcesof external aid as much as possible, and has been successful in this regard.
Whereas at Independence 90 percent of aid (grants and loans) originatedin the United Kingdom, aid donors now include West Germany, Canada, UnitedStates, Denmark, South Africa, African Development Bank, UNDP, and the WorldBank Group. Additional sources are still being sought, and are expected to
include the European-Development Fund, once negotiations have been completedfor associate membership in the European Economic Community.
- 16 -
45. Encouraged by the libera1 nrocedures on foreign exchange transac-tions and profit and capital repatriation and by other domestic policiesfavorabe1 to the onperatlons of private enter-rise, there has been a growth"in the amount of private capital inflows. Whereas they were minimal duringthe mid 1960s, these inflows amounted to US$,19.7 ,million in 19'73, Just over40 percent of total long-term capital inflow. The conditions accorded toprivate capital, particular!y re-ardin- taxat4on, are liberal. Clearlycaution would be essential in making any adjustments, given the role thatMalawi wishes private capital (external and internal) to pl-ay in the develop=-ment process.
46. Net foreign exchange reserves have risen every year since 1969.A particularly large rise was achieved in 1973, when reserves doubUed toUS$65 million or 6 months' imports. In a period of international inflationand co-m.odity price adjustments , iLt may ue desirable to old o1 lig amounts ofreserves and in this respect the windfall gains of 1973 may serve a usefulpurpose in th.. e years to come.
47. The external public debt of Malawi hdas increased as U.K. grantshave been replaced by loans and as other committed loans were disbursed.At the end of 1973, public sector externally held debt amounted to US$189.1million. The terms of overall assistance have hardened gradually as grantswere withdrawn, tLough a determi-uination to use whatever concessionary fundsmight be available has meant a gradual softening of the terms of new commit-ments. The average termLs of Government debt at the end of 1973 were equiva-lent to 2 percent interest and an average maturity of 25 years, though thetLerm,s of other public debt were raised by a loan of US$5 million incurredduring 1973 on commercial terms. Debt service on public debt in 1973 wasUS$11 million or about 10 percent of export earnings (including non-factorservices). This ratio remains well within the country's debt carryingcapacity.
III. MAJOR SECTORS
A. Agriculture
48. Agriculture is the mainstay of Malawi's economy, currently accountingfor almost half of GDP and providing the main occupation for most of the ruralpopulation, as well as over one-third of modern wage employment. Agriculturalcommodities account for most of the country's foreign exchange earnings andprovide raw materials for domestic industry. About 5.3 million hectares(about half of the total land area) are arable, of which 1.7 million arepresently utilized, three-quarters for maize production. Although there isunused arable land, much of this is classified as marginal, and the unevenpopulation density has in fact meant land has been relatively scarce in someareas. Despite reasonably good soils, the mountainous nature of the countryprecludes mono-cropping without special conservation measures in all butthe most favorable areas.
- 17 -
49. Prompted by a belief that further increases in acreage would leadto erosion, loss of fertility and the possibility of an ultimate shortage ofland, particularly in the Southern Region, the Government adopted as the mainobjective of agricultural policy rises in the productivity of smallholdersto realize an exportable surplus of various crops such as groundnuts, rice,cotton, tobacco and cassava and maintain self-sufficiency in food staples. 1/Secondly, to increase production of exportable crops still further, Governmentprovided a liberal institutional framework to encourage the development ofagricultural estates. Given Malawi's lack of mineral or manufactured goodsfor export, the role of these estates in the development process has beencrucial. They have concentrated on export crops and thus provided a rapidlygrowing source of foreign exchange, and in 1973 this accounted for half ofexports. At the same time, the expansion of estates has proved an effectivemeans of supplementing cash incomes in rural areas. Government's policy hasbeen to avoid direct intervention in estates development, preferring to limititself to defining the framework within which estates can operate.
50. The basic food crop is maize; other food crops are pulses, ground-nuts, cassava, rice; sugar and wheat. The princinal expnort crons are tobacco,tea, groundnuts, and cotton, with some export of foodcrop surpluses, notablynulses; cassava, rice and, more recently, maize. In 1973, 69 percent ofagricultural production was for subsistence. Estate production accounts forthree fifths of marketeAd out-ut. It mainly consists of tea, certain varietiesof tobacco, tung oil and some sugar.
/ n Uetailed review of' smallholder agricuLture is available in thae IBRDreport entitled-Agricultural Sector Review, Malawi, No. 235a datedDecember 28, 1973.
- 18 -
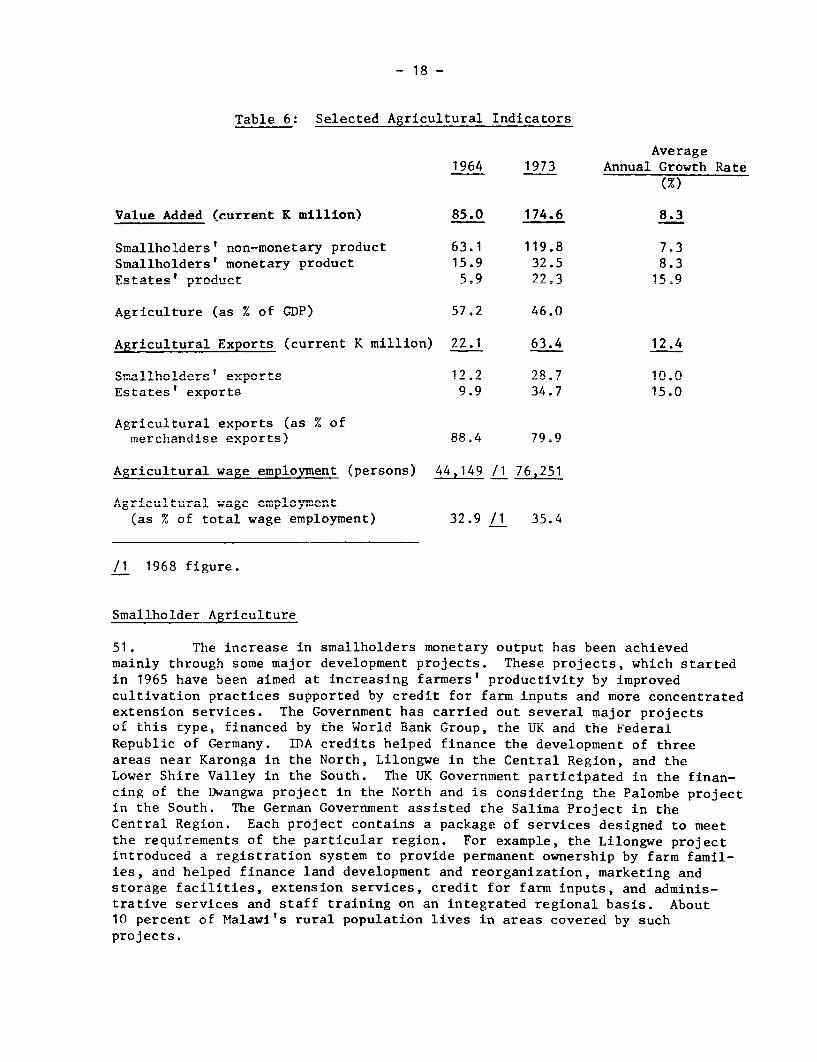
Table 6: Selected Agricultural Indicators
Average1964 1973 Annual Growth Rate
M%)
Value Added (current K million) 85.0 174.6 8.3
Smallhnldepr! non-monetarv Droduct 63.1 119.8 7.3Smallholders' monetary product 15.9 32.5 8.3Estates' product 5.9 22-3 15.9
Agriculture (as L nf GnP' '7-2 46.0
Agricultural Exports (current V million) 22.1 63.4 12.4
Sm1llholders't expts 12 89R7 lA nEstates' exports 9.9 34.7 15.0
Agricultural exports (as % ofmerchandise exports) 88.4 79.9
Agricultural wage em.ploym-entflLAgr4CU.L ural wage emlymn
(as % of total wage employment) 32.9 /1 35.4
/I 1968 figure.
Smallholder Agriculture
51. The increase in smallholders monetary output has been achievedmainly through some major development projects. These projects, which startedin 1965 have been aimed at increasing farmers' productivity by improvedcultivation practices supported by credit for farm inputs and more concentratedextension services. The Government has carried out several major projectsof this type, financed by the World Bank Group, the UK and the FederalRepublic of Germany. IDA credits helped finance the development of threeareas near Karonga in the North, Lilongwe in the Central Region, and theLower Shire Valley in the South. The UK Government participated in the finan-cing of the Dwangwa project in the North and is considering the Palombe projectin the South. The German Government assisted the Salima Project in theCentral Region. Each project contains a package of services designed to meetthe requirements of the particular region. For example, the Lilongwe projectintroduced a registration system to provide permanent ownership by farm famil-ies, and helped finance land development and reorganization, marketing andstorage facilities, extension services, credit for farm inputs, and adminis-trative services and staff training on an integrated regional basis. About10 percent of Malawi's rural population lives in areas covered by suchprojects.
- 19 -
52. Little is known about the efficiency of investment in extensionschemes. A World Bank survey on the performance of the Lilongweproject could only conr1lude in qualita-tivP terms that the nroiect has had apositive effect on cultural practices, and has been successful in encourag-ing the use of fertilizers, credit and other innruts Howevevr; owine to the
wide variety of services provided, the cost of these projects per family isrelatively high ranging from K 450 to K 1000 per fnmily. The need to reacha wider proportion of the population at a lower unit cost is apparent, anda proposed National Rural Development Program. (NRDP) to achieve this ob4ec-tive is presently being considered by Government.
53. The basic concept underlying such a program should be to maximizethe returns on existing resources anL inves-LtmUents --A increasing the latteronly after marginal returns begin to decrease. This approach would be incontrast with the past approatch ofL Goverrau,ent whLi 'chL L-a" injected sizableinfrastructure improvements at the outset of the development sequence. ForeAdmple, a sh-ift in approach muight lead to thle udrelopm.ent of project areaaround existing roads, research stations or market centers, enabling maximumbenefLit to bve made o01 tlehLr presence f0or certa'Ln serCLvices, providing other
services as necessary to enable potential benefits to be realized. The lower-ing of unit costs that this wou;li entail would enable wider proportions of thepopulation to be reached. One of Government's proposals is to integrate therural development effort horizontally by defining development foci, andorganizing activities around these. Administrative and institutional in-frastructure might be used to cover a continuously expanding geographicalarea, and hence technical experience and innovations specifically suited toa given planning area could gradually be transferred outwards until muchwider geographic coverage was achieved. Existing major development projectscould serve as some of the development foci, enabling use to be made ofstaff already trained for these projects.
54. In addition to the major rural development project, there arevarious settlement schemes aimed at increasing in an orderly fashion theacreage cultivated, especially in the less densely populated areas. Some ofthese schemes are linked to the major development projects, while others func-tion independently. Government's objective was originally to settle about1,000 families annually, though only half these numbers were actually settied,and unit costs have tended to be high, averaging over K 500 per dryland farmer.Implementation difficulties adversely affected settlement results. Participantswere drawn from Malawi Young Pioneers (one-third) and local inhabitants (two-thirds). A number of Young Pioneers, sometimes as much as 50 percent of theoriginal settlers left the scheme after a relatively short time, and in somecases local participants were not available in sufficient numbers to occupyall available plots. An initial step should be to proceed to a more compre-hensive evaluation of the problems of existing settlement schemes. In caseswhere present settlement schemes are under-utilized, their insertion into aNational Rural Development Program could be beneficial.

- 20 -
55. O..e c-lusion of the Bank repnort (on. cit. page 28) was that
smallholder credit needs were not adequately met. Many smallholders pre-viously served during the project imnl1epntatinn found themselves without
access to credit once the development phase was completed. In view of the
high cost of providing credit to this sector, Government has some reservations
about continuing to provide credit with the present structure of charges, and
is cos'L.er'.rg continuing creAit on a- experitental basis with higher charges,
56. UovernLmenLt agricultural price polic-y has generall favored export
crops in line with production objectives. Prices paid to smallholders are
controlled uy Governr,.ent , wit the aim, inter alia, of selding smailholders
from fluctuations in prices. The Agricultural Marketing and Development
Corporation (AUrARC) an-ouices its pr-ices far enough in advance to be useful
to farmers in their planting decisions, and are generally held constant
throughout a cropping season. A"DARC prices are guaranteed minima, and are
not binding on sales to local private traders though export crops have to
pass through ADHARC. Helped by risirlg export prices, AD.MARC has been verysuccessful in avoiding downward price movements which, it is believed, would
have a strong disincentive effective. In general, however, prices have been
well below export parities, enabling substantial surpluses to be accumulated
by ADMARC. Higher farm prices were offered irn 1974, with increases ranging
generally from 20 percent to 40 percent for groundnuts, cotton, pulses, sun-
flower seed, sesame, castor seed and wneat. There was also a r'ise of 40 per-
cent in the farm price of maize. Smallholder tobacco prices remained unchanged,
but a second payment will be made at the end or thre season depending on
realized prices.
57. While raising prices of export crops is clearly consistent with
Government's desire to raise exports, increasing foodcrop prices may also be
necessary to achieve the goal of self-sufficiency in food staples. Keeping
producer prices of these to previous levels dampens increases in consumer
food prices, and thus plays a part in Government's wage-price policy. However,
changes in relative prices between export and food crops could alter produc-
tion patterns significantly, assuming that producers respond to price incen-tives. This could compromise the country's basic food supply, particularlyfor urban consumers, by reducing the incentive to concentrate on increased
production of foodcrops. Moreover, relatively lower prices for foodcropscould affect financial returns in some rural development projects where maize
and paddy constitute major components. Continuing attention should be givento these aspects and foodcrops prices revised if evidence appears that the
possibilities outlined above are actually occurring.
58. The nutritional diet is generally satisfactory. But recent study
by a Freedom From Hunger Campaign nutrition team indicated that in certain
areas nutritional problems exist, owing to general food shortage. Among the
suggestions (which Government supports) were that the Ministry of Agriculture
be made responsible for a food and nutrition program within the presentextension services effort, future projects containing a nutrition component.
Staffing and funding difficulties are at present slowing progress in this
respect. A nutrition unit is also being established in the Ministry of Health.
- 21 -
Estates Agriculture
J. Es'ltatLes agriculture ir. Malawi'u dates bUackll to th'e colonr.ial -periodL-U
prior to 1964, when freehold or leasehold titles to land were given mainlyto expatrjLate fLaruers uy the coloni'.1 administration. Ln ger.eral, freeholdtitles were given to tea growers and leasehold titles to other producers.Most estates established prior Lo independence remain in producLion. Some74 still exist, with an average size of 200 ha. Shortly after Independence,Government adopted a policy of maintaining Lhe estates as productive concernsand later on amplified this policy to one of gradual expansion. Only Malawinationals are granted new leases. Resourceful individuals, including (poli-tical personalities) civil servants are encouraged to establish new estateswith initial assistance in land selection from the Ministry of Agriculture.Such new estates are exclusively on a leasehold basis and produce mainlytobacco. Only Malawi nationals are granted new leases. Although Governmentencourages estates, it provides little active support to operators, preferringto concentrate on smallholders. Management, input supply, marketing and, withthe exception of INDEBANK, financing are left entirely to the private sector.Estates are taxed, like corporations, at the rate ot 4u percent of unretainedprofits.
60. In 1973, there were about 400 estates averaging 380 ha, occupyinga total of 3 percent of Malawi's arable land. The expansion of output andexports has been rapid in recent years, particularly of flue-cured tobacco,which has a more complicated curing process than other tobacco, but also ahigher value and better market. Much of the increased tobacco production hasbeen permitted by efficient management. The system of management on manyflue-cured tobacco estates is to employ workers on a piece-work basis, withall activities performed by wage labor. Burley tobacco in constrast isgenerally produced under a 'visiting tenants' system, whereby estates aredeveloped in plots which are leased to villagers under annually renewablecontracts. Tenants are generally housed on the estates and may continue tooperate family farms outside the estates. As regards cultural practices,the manager provides advice which is binding on tenants. International res-trictions on trade with Southern Rhodesia have limited that country's tobaccoindustry, with the result that many farm managers have been willing to moveto Malawi.
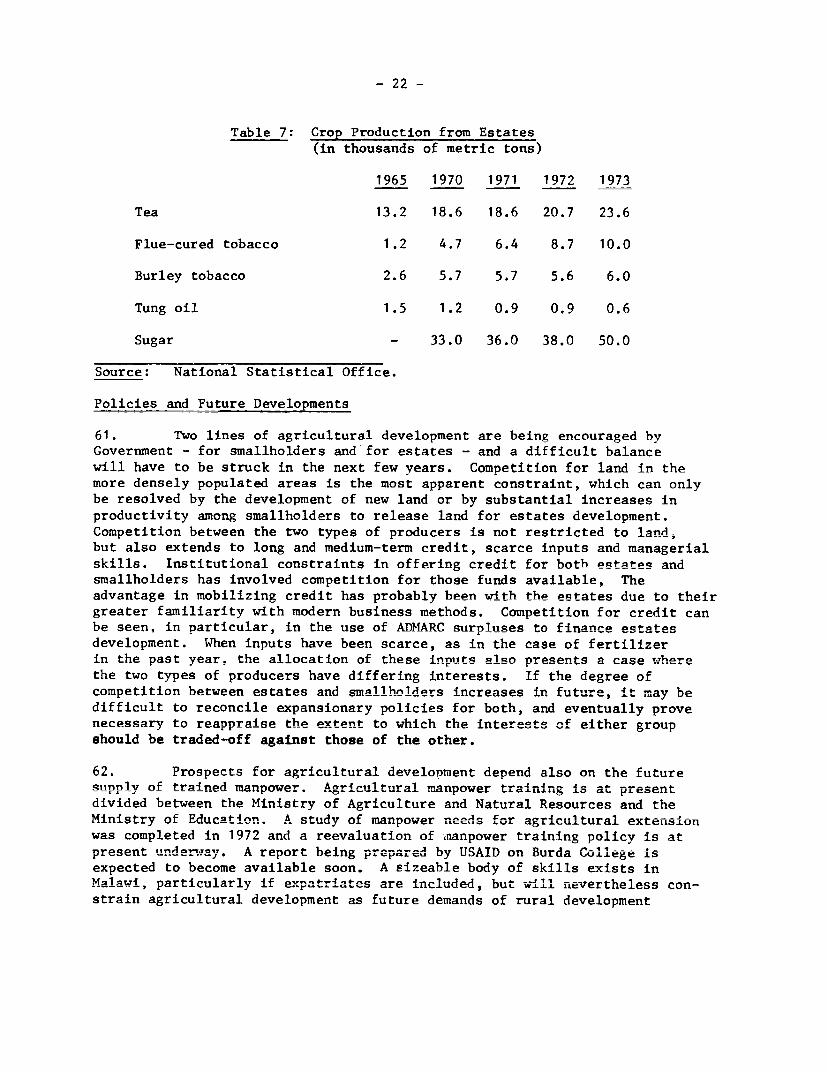
- 22 -
Table 7: Crop Production from Estates(in thousands of metric tons)
1965 1970 1971 1972 1973
Tea 13.2 18.6 18.6 20.7 23.6
Flue-cured tobacco 1.2 4.7 6.4 8.7 10.0
Burley tobacco 2.6 5.7 5.7 5.6 6.0
Tung oil 1.5 1.2 0.9 0.9 0.6
Sugar - 33.0 36.0 38.0 50.0
Source: National Statistical Office.
Policies and Future Developments
61. Two lines of agricultural development are being encouraged byGovernment - for smallholders and for estates - and a difficult balancewill have to be struck in the next few years. Competition for land in themore densely populated areas is the most apparent constraint, which can onlybe resolved by the development of new land or by substantial increases inproductivity among smallholders to release land for estates development.Competition between the two types of producers is not restricted to land,but also extends to long and medium-term credit, scarce inputs and managerialskills. Institutional constraints in offerine credit for both estates andsmallholders has involved competition for those funds available, Theadvantage in mobilizing credit has probably been with the estates due to theirgreater familiarity with modern business methods. Competition for credit canbe seen, in particular, in the use of ADMARC surpluses to finance estatesdevelopment. When inputs have been scarce, as in the case of fertilizerin the past year, the allocation of these inputs also nresents a case wherethe two types of producers have differing interests. If the degree ofcompetition between estates and smallholders increases in future, it may bedifficult to reconcile expansionary policies for both, and eventually provenecessary to reappraise the extent to which the i.terests of either groupshould be traded-off against those of the other.
62. Prospects for agricultural develonment depend also on the futuresupplv of trained manpower. Agricultural manpower training is at presentdivided between the Ministry of Agriculture and Natural Resources and theMinistry of Education. A study of manpower needs for agricultural extensionwas completed in 1972 and a reevaluation of -nanpower training policy is at-resent undervwa-. A report bein.g prepared bUA T oBATT u Coll
* . VJLy onLLL 'ur! J a Co "~uege isexpected to become available soon. A sizeable body of skills exists inMalawi, particularly if expatriates are included, but -wJll nevertheless con-strain agricultural development as future demands of rural development
- 23 -
programs increase. The capacity of Government to employ larger numbers ofagricultural extension workers is also subject to a funding constraint. Inview of the relatively long-time lag between investment in training facilitiesand the achievement of maximum output of institutions, it may not be tooearly to begin planning for the likely longer-term needs of the 1980'sdepending on what approach to agriculture is finally adopted. For someyears, existing institutions can still be expected to produce sufficientagriculturally trained personnel to meet requirements, but in the late 1970sand beyond, a very steep rise in manpower requirements can be expected,particularly if a National Rural Development Program is adopted and extendedto new areas. The annual requirements of a national program alone between1980-85 could be around 50 degree and diploma holders, and 180 certificateholders, implying that present institutions would be unable to meet totalneeds. If a localization policy is also pursued in agriculture, this wouldimpose additional strain on existing institutions.
B. Industry
63. The share of manufacturing in GDP is relatively high (14.8 percentin 1973) for a country at Malawi's income level. Until a few years ago,manufacturing industries mainly processed agricultural commodities for localconsumption and export. Recently, several new industries have been establish-ed to produce consumer goods for the domestic market. Their establishmentwas the main factor responsible for the rapid growth of the sector, whosevalue added has grown by 13 percent p.a. in constant prices since 1964.Between 1964 and 1971, the value added in current prices 1/ by consumer goodsindustries grew by an average 24 percent a year and their share in totalmanufacturing production increased from 19 percent in 1964 to 40 percent in1971. These consumer goods industries substituted for goods which werepreviously imported, notably textiles, footwear, sugar and beverages. Thenet output of export industries, based on local supplies of agriculturalproducts grew by an average 7 percent a year between 1964 and 1971, but itsgrowth fluctuated in line with agricultural production. The share of exportindustries in total manufacturing output dropped from 23 percent in 1964to 14 percent in 1971.
1/ Excluding interest payments. The term "value added" as used herecorresponds to the Malawi Government concept of net output.
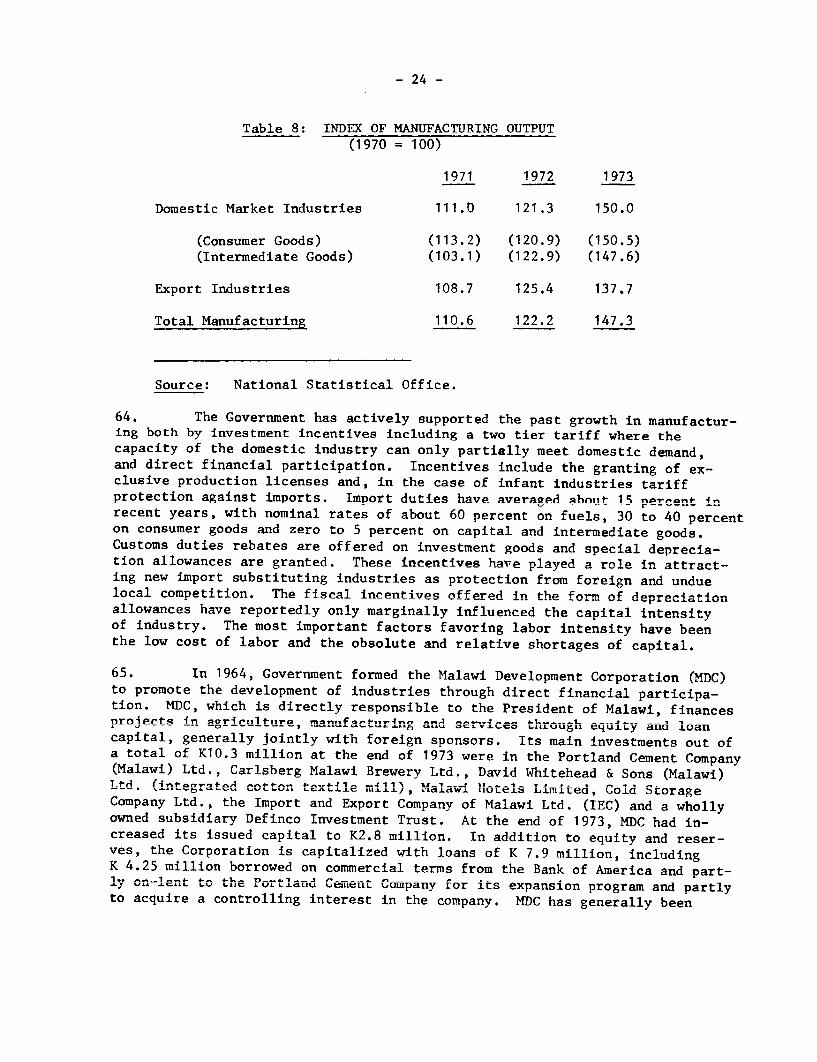
- 24 -
Table 8: !NDEX OF MANUFACTURING OUTPUT(1970 = 100)
1971 1972 1973
Domestic Market Industries 111.0 121.3 150.0
(Consumer Goods) (113.2) (120.9) (150.5)(Intermediate Goods) (103.1) (122.9) (147.6)
Export Industries 108.7 125.4 137.7
Total Manufacturing 110.6 122.2 147.3
Source: National Statistical Office.
64. The Government has actively supported the past growth in manufactur-ing both by investment incentives including a two tier tariff where thecapacity of the domestic industry can only partially meet domestic demand,and direct financial participation. Incentives include the granting nf ex-clusive production licenses and, in the case of infant industries tariffprotection against imports. Import duties have averaged abotit 1I percent inrecent years, with nominal rates of about 60 percent on fuels, 30 to 40 percenton consumer goods and zero to 5 percent on capital and intermediate goods.Customs duties rebates are offered on investment goods and special deprecia-tion allowances are granted. These incentives have played a role in attract-ing new import substituting industries as protection from foreign and unduelocal competition. The fiscal incentivps offered in tha fo-.m of depreciationallowances have reportedly only marginally influenced the capital intensityof industry. The most imnortant fartnrs faunvring labor in.ten.sity have beenthe low cost of labor and the obsolute and relative shortages of capital.
65. In 1964, Government formed the Malawi Development Corporation (MDC)to nromntp the development of industries through direct financial particlpa-tion. MDC, which is directly responsible to the President of Malawi, financesnr-i ert.s in ncyri ev,,lt-wr,a mn ,jfA--_4- -…ro i r--- -a --------- , I -_ f u LaLLVUdLl toqU.LLy anU loancapital, generally jointly with foreign sponsors. Its main investments out of2 total of K10.3 m411in- at the enAd of 1973 -were in the Portland Cement Company(Malawi) Ltd., Carlsberg Malawi Brewery Ltd., David Whitehead & Sons (Malawi)Ltd. (integrated cotton textile mill), Malawi Hotels Limited, Cold Storage
Company Ltd., the Import and Export Company of Malawi Ltd. (IEC) and a whollyowned subsidiary Definc I.^.nvestr.,ent T-LUSt. AL the end of 19;3, mDC had in-creased its issued capital to K2.8 million. In addition to equity and reser-ves, the Corporation is capital'zed with loans of K 7.9 million, includingK 4.25 million borrowed on commercial terms from the Bank of America and part-ly on-lent to the Portland Cemient Company for its expansion program and partlyto acquire a controlling interest in the company. MDC has generally been
- 25 -
involve loan financing of industry until profitability has been demonstrated,at which point, the loan is converted to equity. Although MDC is primarilyparticipating in financially viable projects, because of its public owner-ship, social considerations are also important in its investment decisions,including the employment effect, capital intensity, and location.
66. The wish to permit MDC greater freedom in the application of sociallydesirable criteria has led to the creation of a new development finance cor-poration INDEBANK to concentrate on purely commercial projects. The initialcapital of K4 million is held in equal shares by the Government (throughADMARC), and the British, Dutch and German public aid agencies. To date,total commitments are K 4.65 million of which one-fifth has been for agricul-ture, one-fifth for agro-industries, two-fifths for manufacturing, and theremaining one-fifth for other commercial ventures. INDEBANK was designed tofinance joint ventures between foreign and local partners. So far, lessthan 10 percent of total commitments have been to wholly Malawian-ownedcompanies.
67. In addition to its primary function of marketing smallholders'crops, ADMARC is increasingly taking an interest in agricultural processingindustries. In this regard, there appears to be some overlapping with thefunctions of MDC and INDEBANK, which also emphasize the preparation of andinvestment in slowly maturing activities, including agricultural processing.A clear delineation of the functions of all three organizations is missing,though coordination is assured through Government's close watch over publiccorporations. Given the scarcitv of skilled personnel and firnancil resourcesMalawi can ill afford duplication and competition within the public sector.
68. Before setting up any new enterprise, an industrial licence isrequired. This establishes some control over industry, though furtherexpansion requires no official approval, unless a variance to the existinglirence is renuired. Between 1967 a.d 101731, 107 14 L. withfew applicants turned down. These licences sanctioned the creation of 4,400jobs at an averave canital Cost of K 3,140.
69. One of the aims of Gov-r-nt policy 4or industry is -le de.velop-ment of indigenous participation in manufacturing both in terms of ownershipand management. All investors are treated alike, irrespective of the s'zeof their investment or of national origin. This has had the inevitableeffect of favoring relatively larger1 andA often oreign-o-wn.ed ar-.d ma….agecompanies.
70. Smaller enterprises are handicapped by the limited availabilityof credit. At present, there is no readily access,ible institutionalsource of funds below K 20,000, except the commercial banks. Commercialbanks ger.erally require greatLer secOuriLty than U.osL small-scale businessmen
- 26 -
couldU off er. Governument has tried to overcome this by requiring 50 percentof bank loans to be made to Malawians, but this has had the main effect oftiLghten'Lng the credit market for foreign enterprises, with much of the increasein credit to Malawians absorbed by public corporations and larger Malawianfirms. Both nDC and INDEBANK are aware of the shortfall of small-scalecredit, but neither is in a position to fill the gap. MDC has indicatedthat loans of K 10,000 might be considered but lacks significant appraisalcapacity for large numbers of small loans, is unable to provide managementconsulting services, and would probably be unable to supervise small loans.Only through its wholly owned subsidiary, the Import and Export Company,wnich is involved in the development of a light industrial estate at Liwonde,has it had any significant impact on small-scale business. INDEBANK is alsoconstrained by a lower limit of K 25,000 for its loans (though has not yetmade a loan of less than K 100,000) and by its limited appraisal and super-visory capacity. It has offered to act as a focus for some sort of newcredit arrangement for small-scale industry, and has frequently in the pastreceived requests for loans of K 600 - K 1,000 which it could not service.It is likely that the impetus for any new arrangement would require supportfrom both Government and some external source.
71. Government's policy to localization has had little effect indeveloping a class of indigenous entrepreneurs. Moral suasion is currentlyused in preference to mandatory training of indigenous counterparts. Thenumber of expatriates in Malawi may be increasing by up to 200 per year, andthe presence of foreigners in high and intermediate positions could depressindigeneous entrepreneurial drive. MDC operates a training scheme and hassome responsibility for localization of management. As the number ofexpatriates in firms associated with MDC is only about 150, this trainingprogram can only have a limited impact. Graduates and diploma holders fromthe University of Malawi are recruited for specialized or general nosts. Thevare subsequently attached to expatriate managers with a view to ultimatelocalization. Desirable as this program has been, one of its side effectshas been to absorb into foreign-owned industry many of those who mighthave been able to spearhead the development of locally owned industrvy
72. The prospects for industrial development will depend unon thefuture growth pattern of agricultural incomes. Obvious opportuniies forestablishing import substituting industries have now been taken un and futuregrowth is more likely to be in terms of expanding existing industry.Additional processing facilities for agricultural industrfes will also beneeded.
73. The future size of the industrial sector in Malawi will dependgreatly on the degree of success of one major project, the proposed pulp millin the Viphya highlands, for which detailed plans are presently being madeand financing sought (including from the World Bank). The cost of the projectis likely to be over K 270 million, and would clearly necessitate very largeamounts of debt and eauity financing from external sources. The main impactof the project on the economy, however, would not be felt until around 1980,
- 27 -
when the project can be expected to account for a quarter of value added inmanufacturing, as well as contributing directly to other sectors such astransport and distribution. About 20 percent of Malawi 's export earningswould also be derived from the project. The project involves the processing
of extensive forest plantations which have been under development since the
1950s, and which grow particularly well in the climate of the Viphya plateau.A preinvestment study was carried out with UNDuP f'nancing and the World Banrk
as executing agent, which reported in 1973 that the optimal use of the forest
would be for pulp rather than timber. This pre-investment study is now being
followed up with detailed transport engineering studies financed by IDA, with
additional financing to cover the cost of technical assistance to project
preparation. The Government has set up a public corporation, VIPCOR, which
is responsible for planning and will ultimately implement the project. VIPCOR
is at present engaged in assembling from various commercial, technical and
financial offers a consortium for the project while awaiting the outcome of
technical studies. Government has already made several basic decisions
concerning the project: plant capacity is to be 150,000 tons of pulp per
year, and the target date for first production is 1978; logs are to be trans-
ported by road to Chinteche, where the mill is to be located. Evacuation of
the pulp is to be by lake transport to Chipoka and onwards by rail to the
Mozambique part of Beira.
C. Edi.cation and Training
74. The broad issues of training, manpower development and education
are of primary concern to Government. A manpower survey was earned out forthe Economic Planning Division in 1971 to assess manpower needs until 1980
and this has been translated in an Education Plan by the Ministry of Educa-
tion. A Manpower Assessment and Utilization Unit is also attached to the
Ministry of Labour, which has responsibility for planning manpower needs and
providing for the localization of expatriates. In addition a variety of
Ministries have specific training programs in their respective sectors. In
the past coordination and organization of the wide range of actions haspresented some difficulty, of which the Government is aware. Recently a
National Advisory Council on Technical Education and Training was established
under the chairmanship of the Permanent Secretary for Education. This could
go some way towards integrating the various training efforts, and provide
some of the coordination that is necessary in particular between formal
education and vocational training.
75. The formal educational system consists of 8 years of primary educa-
tion followed by 4 years of secondary education leading to the Malawi Certifi-
cate of Education, and university courses of 3 or 4 years duration. A Junior
Certificate can be earned after two years secondary education. The system
also includes a sixth form course for students with a Malawi Certificate of
Education who, after two years, may obtain a Higher Certificate of Education
and/or Cambridge A levels - a prerequisite for entrance to many universities
abroad.
- 28 -
76. Primary education enrolled 537,301 students in 1973/74, 90 percentin Government-assisted schools. Enrolment ratios are highest in the econo-mically depressed North, where early exposure to missionary influence hasgenerated a strong desire for education. The student-teacher ratio averages50:1, though rural schools have greater difficulty in attracting teachers,partly because of poor housing. Fees are charged of K 1.50 per year up tograde 5, then increasing to K 3.50, and, incidentally, also causing somestudents to drop out. These amounts should be seen against the low levelsof income in rural areas, for example comparing fees with the minimum wageof 25 tambaba per day. The primary school curriculum is under review for asecond time and although agriculture does not enter the curriculum untilgrade 6, has a more practical orientation in other subjects than was the casebefore the first curriculum reform in 1969.
77. Only 17 percent of primary school certificate holders gain access tosecondary education, in which enrollment was 13,700 at the end of 1973. De-spite the higher enrolment rates in primary education in the North, relativelyfewer students gain access to secondary education. Student-teacher ratiosaverage 20:1, and half the teachers are expatriates. Curricula are stillrather literary despite the introduction of the Malawi Certificate to replacethe former Cambridge Certificate. Beyond secondary education is the Univer-sity of Malawi comprising three member colleges, and enrolling 970 studentsin 1973. The University is heavily dependent on 80 percent expatriate staffing.About 320 Malawians are pursuing studies abroad.
78. The formal education system has several strong points: (i) Govern-ment's strict financial control over the secondary system, such that expan-sion is closely geared to availability of both capital and recurrent funds:(ii) the external productivity of secondary and university education is highin the sense that virtuallv all graduates find emnlovment: (iif) the intro-duction of agricultural courses into primary, secondary and teacher trainingeducation shows a willingness to imnrove currrcrula within the establishPdstructure. Most schools now have school gardens, and agriculture is a compul-qnrv quibiprt in a11 schnn1s; and (iu) finrllv in snite of an auvrage level
of per capita incomes of K84, as much as 65 percent of the relevant age groupfind n1lto'c in aoarAc 1_-5
79. The Goverreant's a ~rr ttite-- to wards further educational reform, espe-cially changes in the structure of education is cautious, particularly on suchquestio-s as the length of p-.i.4mr,y education, the need for r.on-formal educatin4 ,and the need for coordination among agencies concerned with non-formaltrain.ing. Nonetheless, it is aware of some of th11-Le drawbacks of Che presentLeducational system of which the principal ones are: (i) the internal efficiencyof education is low with highl repetition and lurop-outL rates atG all 'leve'ls,especially in the early years. For example, less than 40 percent of studentsenter'ing schoo'L ln 196,, hadU reached gradue u b y 1U970. ThibLs raises the re-current cost of producing a primary school graduate considerably. In 1971,thlie actuadl cost per graduuate produuceud was R200, but since tLhe average uniLtcost per student year was approximately K 10, the complete eight-year cycle
- 29 -
of primary education should have cost K 80. The efficiency of the presentsystem could therefore be improved since its cost is more than twice what itshould be; (ii) enrolment ratios are low at the secondary level, where only3 percent of the age group are enrolled. Since a shortage of secondary grad-uates appears to exist and graduates are readily employed, this has led tostrong pressure for expansion. Government tries to offer access to scarcesecondary places notonly on the basis of student performance, but also ofthe geographical origin of students (iii) the quality of primary educationcould also be improved by an upgrading of facilities in rural areas, includingteachers' houses,school furniture and teaching materials. Part of the pro-bleim is'that primary'educationil facilities are provided by local educationauthorities whose main revenues are school fees. In addition, 78 percent ofteachers do not reach the standards considered adequate by Government. whilein service training-or upgrading courses for teachers are by correspondenceand do not permit the teacher to a nuaint himself fully with imnrovedmethods.
80. Malawi's plans for the future of its formal education system arebased on the mannnwpr neepdq nrncted in -he 1971 'Mannpwer Rm*uArvP adcor'ngcto which the need for high and intermediate manpower would rise by 14 percentper annutm betweein 1971 anAd 1980,' th a greater growth of nreed occurrirnglater in the decade. The most pronounced increases in requirements would befor te=^hni4clly ar. d vo t.ior 4.4l -trai.e specialsts, where short--ages would
occur without a restructured school system. The pace of localization wouldbe a key determInant of the demand for certain skills, along with the rate ofeconomic growth. The Educational Plan was drawn up to restructure formal_educat on4__ *. .LflA
5A a4____. 7 A A _,v _ L. * __,A ._ L LL0 LA. CZ a __L. AL _U*L C- * O -_
ture throughout Government activities. Increased coordination by the Ministryof Educatio.'. of poL-vseconAa.y foLual ad. all inLr.moal educatior. couWld greatlyfacilitate the achievement of the Plans objectives.
81. The Plan calls for 55 percent enrolment of the relevant age groupin primary euucatiLon graues 1-8) by 1980, curricuium revision Lo LtaK accountof rural needs, and the establishment of 24 schools, one in each district, toserve as moJels tLo the l-ca L l ed2- ucat.Lon auLthoritieS. ror seconUdary ducatiLLn, a
more rapid growth of enrolment is envisaged by raising pupil-teacher ratios.'r - -I -o - A - - - - - - -The quL ity of schools Js to be improvea, but only one new school is plannedwhich would be in a district which at present has no secondary school. Their.crueasd output of secondary schoois could be iargely justified by localiza-tion alone. The Education Plan clearly places greatest emphasis on secondaryeducation in accordance with the 'Manpower Survey'. Tnis survey nas beencriticized for the rigidity of some of its assumptions regarding entry requi-rements for certain occupations, and it could be argued that if theseassumptions were modified, a more efficient use of resources would be to up-grade primary courses ro prepare school leavers for entry directly into theeconomy or into vocational training schemes.
82. Informal, vocational and technical training in general falls outsidethe scope of the Minitstry ot Education, and, as explained, is undertaken bya variety of agencies, ranging from the colleges of the University of Malawi,
- 30 -
colleges run by the Ministry of Agriculture. snecial schools for mpdiraltraining, Malawi Correspondence College, Ministry of Labor schemes and theMalawi Young Pioneers. However, the Ministry of Edusatinn dos treachpractical subjects through technical schools and a Polytechnic.
83. Despite the wide range of possibilities, the overall capacity ofthese colleges and training schemes iq very 1imited in coLmparison both tothe number of school leavers and, for certain skills, relative to nationalnppds. AA the nrpesnt supply of places is limited entry standards, whI4hare generally defined in terms of the Junior Certificate or other formalexaminations, may be rather high. Rather than maintaining these-the number of places available could be increased: the general level ofappli_ants qualifications .woult r fall more clo1- into line withthe work that they will ultimately perform. In view of future manpower re-niirpma.nts, th exvpnsion of n-4-f4r.ra cin ourses could ube of criticalimportance.
84. Agricultural training institutions are at present capable of meetingthe requirements of the rural develop.ent schLemes and o0th…er agri _ut~~~~flflICLLL LIU~CL r£ .LL;UI LU LadL
projects that are in place or envisaged in the immediate future. A NationalRuraln np,elinnmont- Progrrm. woulId be an element in the Governument's developmer,tplans, that would require some adjustment of present training facilities, asexplained in the seCtion on agriculture. In the 1980s, the annual require-ments of diploma and certificate holders can be expected to rise rapidly,and a review of training needs atL the outset of NRDP -would be timely.
85. No co,.,prehensive plan for expansuon or regulation of industrialtrade training exists, but estimates are available for both supply and
UdemaL-L of skilled arti'sans. The Mlnistry o0 Labor has estimated the needs ofindustry for apprentices, which for many categories of workers would signifi-cant'Ly exceeu tle 10" estLuiates of output from apprenticeship schemes. Thetraining of medical personnel has been examined by the WHO in its NationalHealth Plan. The greatest needs to achieve the goals of the health planare for medical assistants, for the training of whom a school is to beestablished in Lilongive with an output of about 70 assistants by 1980in line with national needs.
D. Transport
86. Malawi's transport network at Independence was inadequate for thecountry's needs. Government has therefore had to give transport high priorityin its investment program, and between 1964 and 1973, devoted K 69 million,or over one-third of its development budget to transportation.
87. The main transport facilities are fairly well developed in thesouthern half of the country where economic activity is greatest, but manyrural areas, particularly in the northern half of the country, do not havereliable all-weather connections with administrative and market centers. Forinternal trade, road transport predominates while most export and import
- 31 -
traffic is carried by the railway, which connects with Indian Ocean portsvia rail lines through neighbouring Mozambique. The domestic transportsystem comprises about 10,860 kilometers of road, about 708 kilometers ofrailway, shipping on Lake Malawi and regllqr air services to nine airportsand airfields.
88. The Government influences the transport sector through ownershipof major carriers: i.e., Air M-alai and Malawi Railways, includir.g thelatter's two subsidiaries: Lake Service Limited which handles nearly alltransport on Lake Malaw., nAnA Road Motor Services Limited, a large truckingcompany. The Government-owned entities are under the jurisdiction of theMinistry of Transport and Comi.-nications which is also responsile forregulating private carriers, mainly those in road transport. Entry into theroad transport intustry is relatively unrestricted; while permits from theMTC are required for either hauling one's own goods or providing for-hireservice, applicants need oaly demonstrate fin,ancial responsi 4biliy and nomirn-al demand. In practice, permits are issued freely and there are numeroussmall private tra-^-rs.
89. Road density, amounting to 2.25 kilometers per 1,000 inhabitants, isabout average compared to other countries at a similar stage of development;the extremely poor qualIty of most of the network results, however, in hightransport costs. Some 1,245 kilometers (11%) of roads are paved and an addi-tional 507 kilometers (5%) are engineered gravel standard; the rest are earth.Road transport accounted for some 440 million ton-kilometers in 1972 or almostt-o-thirds of total fre'Lght trarric in the country.
90. The main railway line extends from Salima in the Central Region,through Blantyre, to the extreme southern border where it connects with theMozambique line to the port of Beira. A recently completed branch line (101kilometers) offers an alternative route to the sea, extending eastward fromNkaya and connecting with the Mozambique line to the port of Nacala on theIndian Ocean. An extension westward from Salima to Lilongwe is planned,financing for -which has recently been obtained from the Canadian Governmentwhich is also helping to finance rehabilitation of the older, main line.From Lilongwe to the Zambian border a further 71 miles is also to be built withSouth African financing.
91. Despite increasing road competition, rail traffic, in terms ofton-kiloumeters, has grown at an average of more than 12 percent annuallysince 1964, largely because of increasing import-export traffic. In 1972,the railway carried out about 1.1 million tons of freight and about 990,000passengers. In 1972, the railway accounted for about 219 million ton kilo-meters or almost one-third of total freight transport, with imports andexports accounting for one-half to two-thirds of the total and over 70percent of rail revenue. Malawi Railways had made losses from 1970 to1972, but the considerable increase in Zambian transit freight contributedto a reversal in 1973 when a profit of K 900,000 was made.
- 32 -
92. Freight and passenger transport on Lake Malawi is provided by LakeService Limited, a subsidiary of Malawi Railways. Although traffic volumeshave bDeen relatively ligilt, allountULng to only an estimated 28,000 tons offreight and some 105,700 passengers in 1972, lake transport provides an im-portant alternative means of transport for the remote northern areas of thecountry. At present about three-quarters of the traffic is northbound, origi-natlng at Chipolka whicn is served by the railway, but this pattern may changeas the impact of ongoing development prolects in the north is felt, notablythe Karonga Rural Development Project. In addition, lake transport will in-crease in importance if the proposed pulp mill at Chinteche in the NorthernRegion is developed in connection with the Viphya project. The volume offreight could be multiplied as much as sixfold, and special facilities wouldbe needed for bulk transport of the pulp.
93. Air Malawi, a Government-owned airline, provides domestic serviceto nine airports within the country as well as to several neighboring coun-tries. It has generally been profitable in its operations. Only the airportat Chileka, near Blantyre, can handle long-range jet aircraft: it serves asthe country!s international airport and is also the most important domesticallybecause of its proximity to the main commercial center and former capital.Some 224,200 passengers and 2,200 tons of freight were handled there in 1972.Following a recent feasibility study, the Government has decided to developa second international airport for the new capital at Lilongwe, for which itis seeking financing.
94. Malawi's present transport policy has three broad aims: (i) toimprove the administrative, social and economic integration of the country bylinking all three regions with reliable all-weather connections: (ii) to en-courage agricultural development by improving access to rural areas; and (iii)to assure efficient and reliable access to the sea for the transport of exportand imports. To these ends, the Government is undertaking an extensive trans-port development program: numerous road studies are in progress and, asstated above, investments are planned or underway in rail, lake and air trans-port. DEVPOL envisaged prospective investment in transport at about 30percent of total public investment projected for the period.
95. Coordination of transport planning is the responsibility of theEconomic Planning Division of the Office of the President and Cabinet afterreview of proposals put forward by the several Ministries concerned; mostimportantly, the Ministry of Works and Supplies (NWS) for roads and theMinistry of Transport and Communications (MTC) for all other modes. Thiscoordination could be improved if the Economic Planning Division had morestaff. The development of each mode has so far been achieved withoutelaborate planning. While modal development has so far tended to becomplementary rather than competitive, several investments about to be under-taken strongly suggest the need for an adeqnuate analysis of the trade-offsbetween competing modes. Such analysis may be possible for future planningas the Economic Planning Division has recently employed a transport economist
- 33 -
with experience in this field. A U.K.-financed consultant is undertaking a
one-year transport planning study for the Division aimed at assessing the
development priorities in the sector for the period 1975 - 1985, but is
concentrating more on producing a highways plan. Government intends to
improve the collection of highway traffic statistics to permit meaningful
planning of investments.
96. Transport rates for all modes are fixed by MTC. Rail rates and
road rates have both been revised upwards recently, and the structure of rail
rates has been changed to improve the competitiveness of rail transport
vis-a-vis road transport. As a result of these revisions, which averaged
about 20 percent for rail, 25 percent for road freight, and 15 percent for
road passengers. both modes are now expected to cover entirely their direct
operating costs.
97. One aspect of planning that has received relatively little attention
has been the allocation of resources between new construction and the main-
tenance of existing roads. Highway expenditures on construction have aver-
aged K 5.3 million annually during the past four years. Recurrent highway
expenditures have grown considerably in recent years from K 0.8 million in
1967 to an estimated K 2.2 million in 1974, but remain far short of actual
needs. Annual maintenance expenditures in 1973 amounted to only K 350 per
kilometer for paved roads, K 400/dkm for grnvel roads and K 155/km for earth
roads, whereas a consultant's study has estimated that about K 725, K920 and
K 205 per kilometer respectively are required annually to keep these roads
in good condition.
98. The Regional Divisions of the MWS are responsible for maintainingthe classified road system with the exception of distrirt roads Unfor-
tunately, the District Councils, which have responsibility for the latter,
have been unable to ma4nt-ain them because of inadequate staff, funds and
maintenance capacity, and district roads have largely been neglected. A
pilot program for distr4ct roaAs w111 be carried out shortly to determine
how they might best be developed and maintained.
99. The Roads Department's maintenance operations are largely mechanized,
though manual labor is used wwhen feasible. Because of problems with avail-
ability of equipment, the MWS in 1971 created the Plant and Vehicle Hire
OrganizatiLon which is responsible for procuring anA maintair.in all Go-%lhertent-
owned equipment and vehicles; it rents equipment to the Roads Department at
rates Uasedu on te cost ofL purchasing anA maintain-I- the -pm.ent As aresult of this, centralized management, availability and utilization of equip-
ment have improved substantially. Despite this, however, and the existence
of a reasonably well-trained cadre of maintenance personnel in each of the
regions, the level oL maiLntenance operations is rather low, largely because
the funds allocated have been held to a minimum. The Ministry of Finance is
aware of the link between development and recurrent expenditures, and has beenobliged to hold maintenance to the minimum satisfactory level in view of
overall funding s'nortages.
- 34 -
!V. POTICY ISSUES AND PROSPECTS
100. In 1971, a Statement of Development policies (DEVPOL) was publishedwhich provided a general frLamework within L hich the Governm.ent operates athree-year "rolling plan" subject to annual revision. The concept of rela-
ve.Ly L irmL short[teL m L targets wLLLIn thLle LndLicative guil of a Len-yearstatement of policy objectives is an interesting and commendable approach.DLEVPO contalns guidCellnes l L ll Ul CUIaUrIIIe ic 'u"LcLaors Up tU IJUV an'
states the Government's main socio-economic objectives, among which are:
(a) to raise living standards and productivity in the rural areas;
(b) to achieve an average annual growth of the domestic productof 8) percent through tiLhe paradLle'l Udeve'Lopment;ofsm OL sr.l'ho Lderoutput, estates' agriculture and industry:
(c) to promote a more balanced regional development with anemphasis on the Central ana Northern regions; and
(ud to UeveLop local LiLtLatLves wLitl a grauuaJl increase of' localparticipation in the economy.
101. In the intervening years since the DEVPOL projections were made,economic developments both within and outside Malawi have modified, in somecases substantially, the context in which decisions must be made. Thediscussion of performance in the major sectors has attempted to assess theeffect of these developments on sectoral policies. This final section willdiscuss Malawi's overall macroeconomic prospects in the light of recentdevelopments and the emerging policy issues.
102. The country's ability to realize its high growth target of 8 percentwhile improving income distribution by raising living standards and produc-tivity in the rural areas depends critically on several distinct factors,which include: (i) the leading role of agricultural output and related ac-tivities; (ii) implementation of the Viphya project; (iii) the possibilityof continuously overcoming the shortage of skilled manpower; (iv) thecountry's ability to generate and mobilize sufficient savings; and (v) theavailability of future external technical and financial assistance. On manyof these points, the Government's objectives are in support of one another,hence justifying a certain optimism that the main targets can be achieved,though there are other aspects, already brought out in the discussion of thespecific sectors, where the interactions between the various objectives andconstraints suggest that certain targets may be more difficult to achieve.
103. The leading role of the agriculture sector will depend to a greatextent on the economy's responsiveness to Government's efforts. The largeestates have seized the opportunities to increase agricultural output inrecent years. At the same time experience with agricultural schemes has
- 35 -
shown that farmers respond positivelv to the availability of services andinputs coupled with remunerative crop prices. The sensitivity of farmersto crop prices may, however, necessitate a re-evaluation of certain aspectsof pricing policy. Producer prices for some staples are lagging somewhatbehind export crop prices. If such a policy were to continue, it mightcause farmers to shift their production patterns, exnose the economy topossible food shortages if adverse weather or other conditions prevail,and cause financial returns to fall in project areas geared to such crops.While there has been relatively little conflict in the past between theparallel development of estates and smallholder farming, this will becomemore substantive in future. Continued expansion of estates may result ingreater competition with smallholders for credit, inputs, and the betterland while affecting cultural practices on adjacent land. The lack ofcredit to small-scale farmers may also impede agricultural growth in thelonger run.
104. For all these reasons, Government has reassessed its originalcash crop production targets for agriculture, as set out in DEVPOL. Thesenew targets indicate a likely zrowth of monetized agricultural productionof around 6.5 percent per year as compared to the original projection ofa 10 nersent rate. The growth of non-monetary agricultural production isstill hypothesized to be in line with the growth of the population at justover 2.5 nerrent.
105. Estimates ef th-e gronwth of monetizedi agriculture are based onspecific crop by crop projections, taking into account projects currentlyeoing uindertaknn nr which nre nntiipnntad hpforo 19Rn. ProAttrtinn PqtimAtPAcorrespond in large measure with those outlined in the Agricultural SectorReview. Increased smailholder production i antip4nated t-n 'h lareplv within
the context of major development projects.
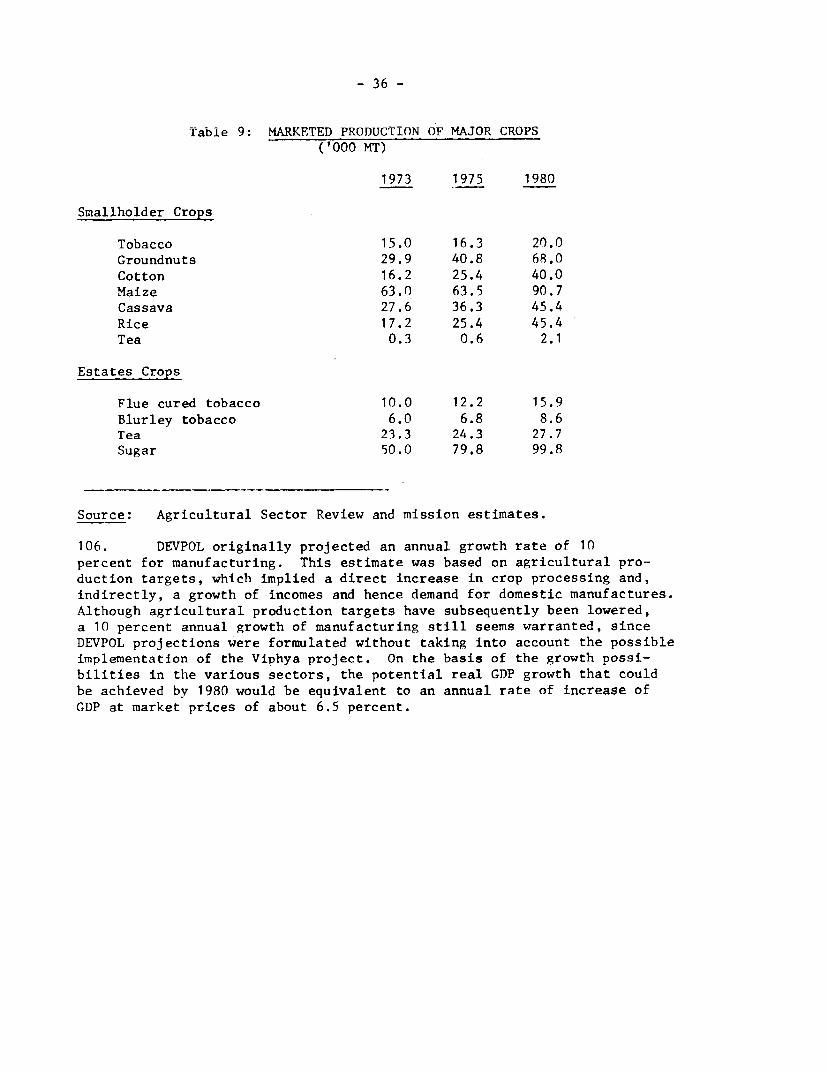
- 36 -
Table 9: MARKETED PRODUCTION OF MAJOR CROPS('000 MT)
1973 1975 1980
Smallholder Crops
Tobacco 15.0 16.3 20.0Groundnuts 29.9 40.8 68.0Cotton 16.2 25.4 40.0Maize 63.0 63.5 90.7Cassava 27.6 36.3 45.4Rice 17.2 25.4 45.4Tea 0.3 0.6 2.1
Estates Crops
Flue cured tobacco 10.0 12.2 15.9Blurley tobacco 6.0 6.8 8.6Tea 23.3 24.3 27.7Sugar 50.0 79.8 99.8
Source: Agricultural Sector Review and mission estimates.
106. DEVPOL originally projected an annual growth rate of 10percent for manufacturing. This estimate was based on agricultural pro-duction targets, which implied a direct increase in crop processing and,indirectly, a growth of incomes and hence demand for domestic manufactures.Although agricultural production targets have subsequently been lowered,a 10 percent annual growth of manufacturing still seems warranted, sinceDEVPOL projections were formulated without taking into account the possibleimplementation of the Viphya proiect. On the basis of the growth possi-bilities in the various sectors, the potential real GDP growth that couldbe achieved by 1980 would be equivalent to an annual rate of increase ofGDP at market prices of about 6.5 percent.
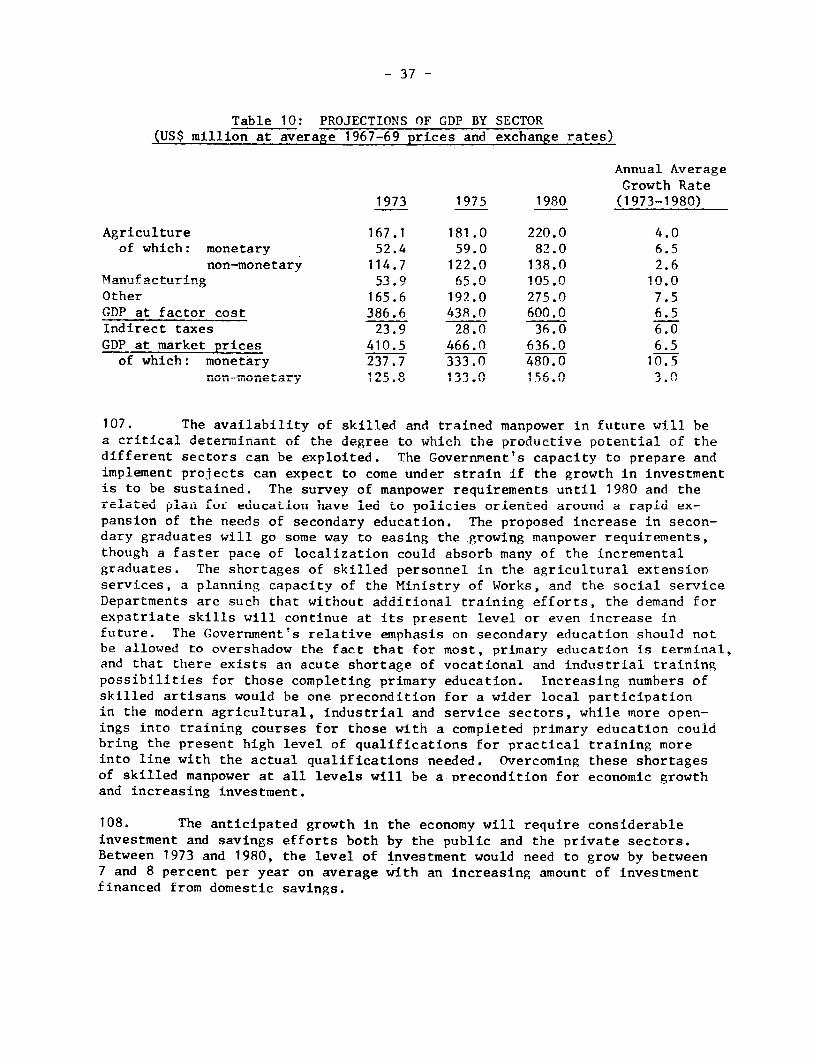
- 37 -
Table 10: PROJECTIONS OF GDP BY SECTOR(US$ million at average 19167-69 prices and exchange rates)
Annual AverageGrowth Rnte
1973 1975 1980 (1973-1980)
Agriculture 167.1 181.0 220.0 4.0nf which: monetary 52.4 59.0 82.0 6.5
non-monetary 114.7 122.0 138.0 2.6Maniifacturing 53.9 a5. 105.0 10.0Other 165.6 192.0 275.0 7.5GDP at factor cost 386.6 438.0 600.0 6.5Indirect taxes 23.9 28.0 36.0 6.0CDP at market prices 40I.5 4."L 6. 6.5
of which: monetary 237.7 333.0 480.0 10.5non= .L.onetary 125. 1.0 I ,. 0 3.I . J -7 .'^
107. The availability of skilled and trained manpower in future will bea critical determinant of the degree to which the productive poten;tal Of tile
different sectors can be exploited. The Government's capacity to prepare and£111plement proUects can expect to come under strain if tne growth in investmentis to be sustained. The survey of manpower requirements until 1980 and therelated plan for education nave led to policies oriented around a rapid ex-pansion of the needs of secondary education. The proposed increase in secon-dary graduates will go some way to easing the growing manpower requirements,though a faster pace of localization could absorb many of the incrementalgraduates. The shortages of skilled personnel in the agricultural extensionservices, a planning capacity of the Ministry of Works, and the social serviceDepartments are such that without additional training efforts, the demand forexpatriate skills will continue at its present level or even increase infuture. The Government's relative emphasis on secondary education should notbe allowed to overshadow the fact that for most, primary education is terminal,and that there exists an acute shortage of vocational and industrial trainingpossibilities for those completing primary education. Increasing numbers ofskilled artisans would be one precondition for a wider local participationin the modern agricultural, industrial and service sectors, while more open-ings into training courses for those with a completed primary education couldbring the present high level of qualifications for practical training moreinto line with the actual qualifications needed. Overcoming these shortagesof skilled manpower at all levels will be a precondition for economic growthand increasing investment.
108. The anticipated growth in the economy will require considerableinvestment and savings efforts both by the public and the private sectors.Between 1973 and 1980, the level of investment would need to grow by between7 and 8 percent per year on average with an increasing amount of investmentfinanced from domestic savings.
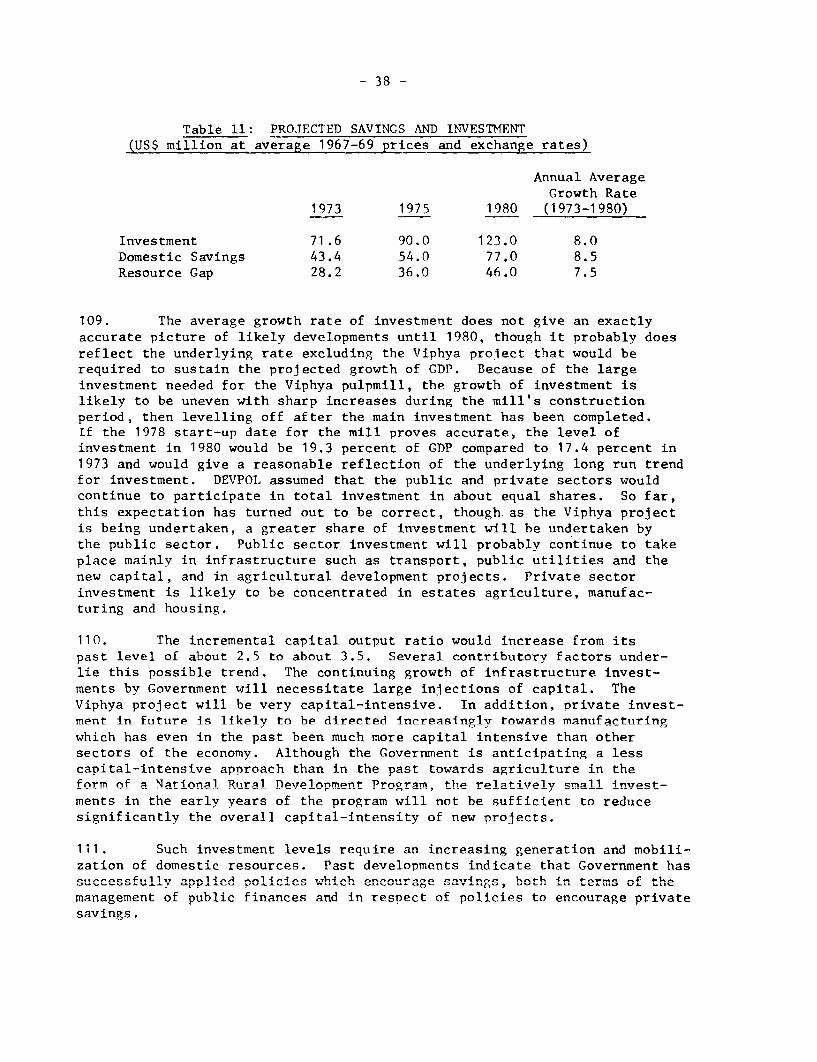
- 38 -
Table 11: PROJECTED SAVINGS AND INVESTMENT(US$ million at average 1967-69 prices and exchange rates)
Annual AverageGrowth Rate
1973 1975 1980 (1973-1980)
Investment 71.6 90.0 123.0 8.0Domestic Savings 43.4 54.0 77.0 8.5Resource Gap 28.2 36.0 46.0 7.5
109. The average growth rate of investment does not give an exactlyaccurate picture of likely developments until 1980, though it probably doesreflect the underlying rate excluding the Viphya project that would berequired to sustain the projected growth of GDP. Because of the largeinvestment needed for the Viphya pulpmill, the growth of investment islikely to be uneven with sharp increases during the mill's constructionperiod, then levelling off after the main investment has been completed.If the 1978 start-up date for the mill proves accurate, the level ofinvestment in 1980 would be 19.3 percent of GDP compared to 17.4 percent in1973 and would give a reasonable reflection of the underlying long run trendfor investment. DEVPOL assumed that the public and private sectors wouldcontinue to participate in total investment in about equal shares. So far,this expectation has turned out to be correct, though as the Viphya projectis being undertaken, a greater share of investment will be undertaken bythe public sector. Public sector investment will probably continue to takeplace mainly in infrastructure such as transport, public utilities and thenew capital, and in agricultural development projects. Private sectorinvestment is likely to be concentrated in estates agriculture, manufac-turing and housing.
110. The incremental capital output ratio would increase from itspast level of about 2.5 to about 3.5. Several contributory factors under-lie this possible trend. The continuing growth of infrastructure invest-ments bv Government will necessitate large iniections of capital. TheViphya project will be very capital-intensive. In addition, private invest-ment in future is likelv to he directed increasinglv towards manufartiringwhich has even in the past been much more capital intensive than othersectors of the economyv Althoutgh the Governmpnt is anticinptinga lesscapital-intensive apnroach than in the past towards agriculture in theform of a National Rural DvPulpnnmPnt Program, the rplntivelv small invest-
ments in the early years of the program will not be sufficient to reduceci cnificrnt-l thie overall capin4t-n1nte-nsityF of ryne ro4et
111. Such investment levels require an increasing generation and mob-li
zation of domestic resources. Past developments indicate that Government hassuccessfully applied po l ic i e s which encourage savin,s , bDoth in te4,,rs 0 t-e
management of public finances and in respect of policies to encourage private
- 39 -
112 . J.T rIC Lapid iL.VpCrmLL tL of GUVerLLL.mCeLnL finCalnciaaLdl .L L L toiton can
expect to become somewhat more difficult as increasing demands for recurrentexpenditure are Likely to arise and as he more oUv'Lous adi easily admin-
istered tax sources are exhausted. Investments which are currently beingund-3ertaken or p'lanned -"'l 1-lpose a nee' 'or riksing 'leve'ls ol' recurrentULLU L .MNL UL ~ 4L U W.L.L.L .LIILL C ILCI[ UL L bl4 i ve U lT uJ7 ftexpenditure, for example in providing adequate extension staff for ruraldevelopr..et proLJects, iLn stafLdL'LLag nIew edUucatiLonal and traLning facilities,and in maintaining an extending road network, as well as other economicin1frastructure. Greater revenue could be yielded by some increase in pro-fits and property taxes, though these should clearly not be raised to thepoint where they would be a disincentive. At the same time, many or themore obvious sources of indirect tax revenue have now been tapped, so thatthe future expansion of tax revenues will rely on the tax system being fairlysensitive to the growth of the economy. These two factors could make forgreater difficulty in future revenue-raising. With prudent management,most public corporations should continue to contribute to the generationor financial resources ror investment. Tne aesire to maintain the tlow offunds from ADMARC (the main source) may, however., be difficult to reconcilewith the need to provide definite price incentives to farmers by raisingfarm prices in line with export parities.
113. The mobilization of private savings will depend to a largeextent on the availability of profitable investment opportunities, notonly in agriculture, but also in other sectors. Opportunities for privateinvestment will probably continue to be provided in the framework of therural development projects, and through maintaining a liberal frameworkfor agricultural estates and industry to work within. The opening ofeconomic opportunities to a wide cross-section of the population that isimplied by Government's approach to agriculture and the desire for greaterlocalization of industry will undoubtedly induce additional savings amongthose who at present have no such opportunities available, and will ulti-mately create a wider savings base than at present. Nonetheless, in theimmediate years to come, concentration on redistributive objectives maymake the realization of high levels of savings more difficult than ifpolicy were concentrated on the development of estates and industry, wherehigher rates of domestic savings are currently obtained. DEVPOL projecteda marginal savings rate of 18 percent during the 1970s. So far this targethas not been fully achieved, despite high export prices for agriculturalcrops.
114. Apart from encouraging savings in the form of direct investment byfarmers and industrialists, the Government is also encouraging the mobiliza-tion of savings through financial intermediaries. These include buildingsocieties, commercial banks, and the post office savings bank which recentlyraised its interest on deposits from 4 to 5 percent. The general structureof interest rates paid on savings has also been raised by increasing therates paid on locally registered stock from 8 to 9.5 percent for 10 yearstock and from 6.75 to 8 percent on 5 year stock. This has resulted in agreater placing of locally registered stock outside the Central Bank. Infuture these developments are expected to assist the resource mobilizationeffort.
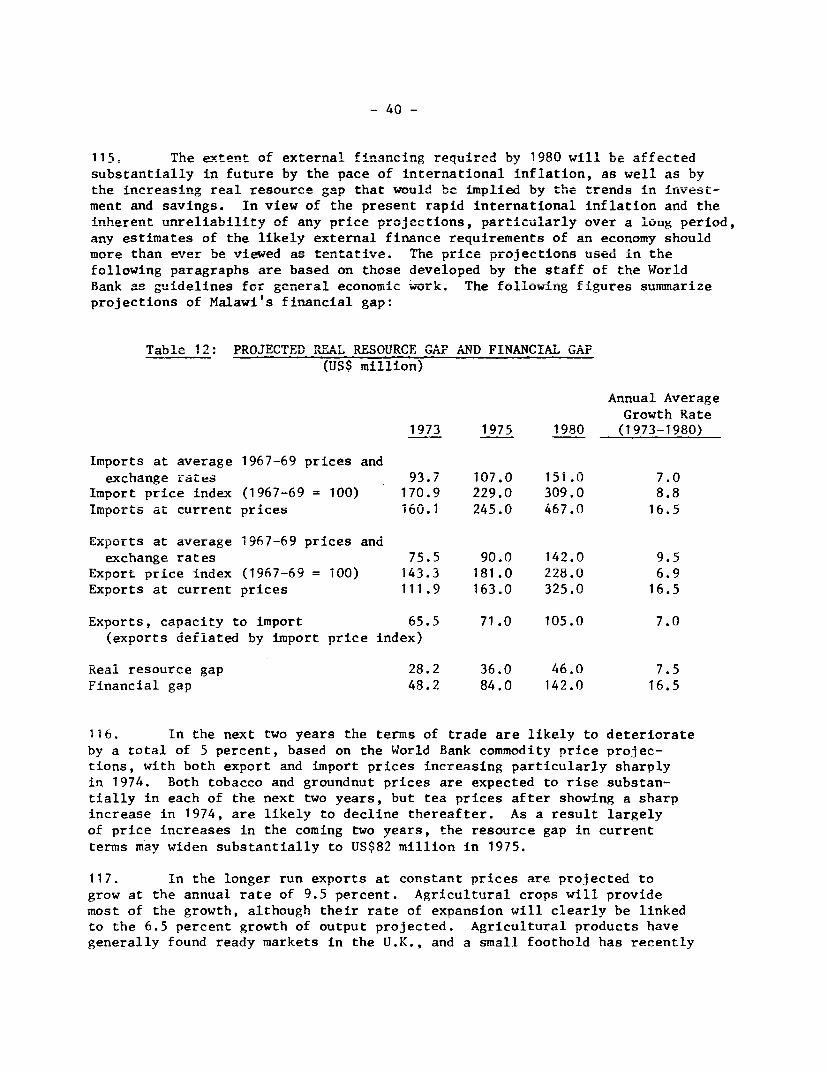
- 40 -
115 The extent of e-xternal financing required by 1980 will be affectedsubstantially in future by the pace of international inflation, as well as bythe increasing real resource gap that *ould be 4implied by the trenrds in invest-ment and savings. In view of the present rapid international inflation and theinherent unreliability of any price projections, pareicularly over a long period,any estimates of the likely external finance requirements of an economy shouldmore than ever be vie4ed as tentative. The price projections used in thefollowing paragraphs are based on those developed by the staff of the WorldBank as 6 idelines for general econom'ic work. The follo-wing figures summarizeprojections of Malawi's financial gap:
Takle 12 FROJKCTD UAL RES uLiarC GAP AND FINANCIAL GAP(US$ million)
Annual AverageGrowth Rate
1973 1975 1980 (1973-1980)
Imports at average 1967-69 prices andexcldange rates 93.7 107.0 151.0 7.0
Import price index (1967-69 = 100) 170.9 229.0 309.0 8.8Iumports at current prices 160.1 245.0 467.0 16.5
Exports at average 1967-69 prices andexchange rates 75.5 90.0 142.0 9.5
Export price index (19n7-69 = 100) 143.3 i81.0 228.0 6.9Exports at current prices 111.9 163.0 325.0 16.5
Exports, capacity to import 65.5 71.0 105.0 7.0(exports deflated by import price index)
Real resource gap 28.2 36.0 46.0 7.5Financial gap 48.2 84.0 142.0 16.5
116. In the next two years the terms of trade are likely to deteriorateby a total of 5 percent, based on the World Bank commodity price projec-tions, with both export and import prices increasing particularly sharplyin 1974. Both tobacco and groundnut prices are expected to rise substan-tially in each of the next two years, but tea prices after showing a sharpincrease in 1974, are likely to decline thereafter. As a result largelyof price increases in the coming two years, the resource gap in currentterms may widen substantially to US$82 million in 1975.
117. In the longer run exports at constant prices are projected togrow at the annual rate of 9.5 percent. Agricultural crops will providemost of the growth, although their rate of expansion will clearly be linkedto the 6.5 percent growth of output projected. Agricultural products havegenerally found ready markets in the U.K., and a small foothold has recently
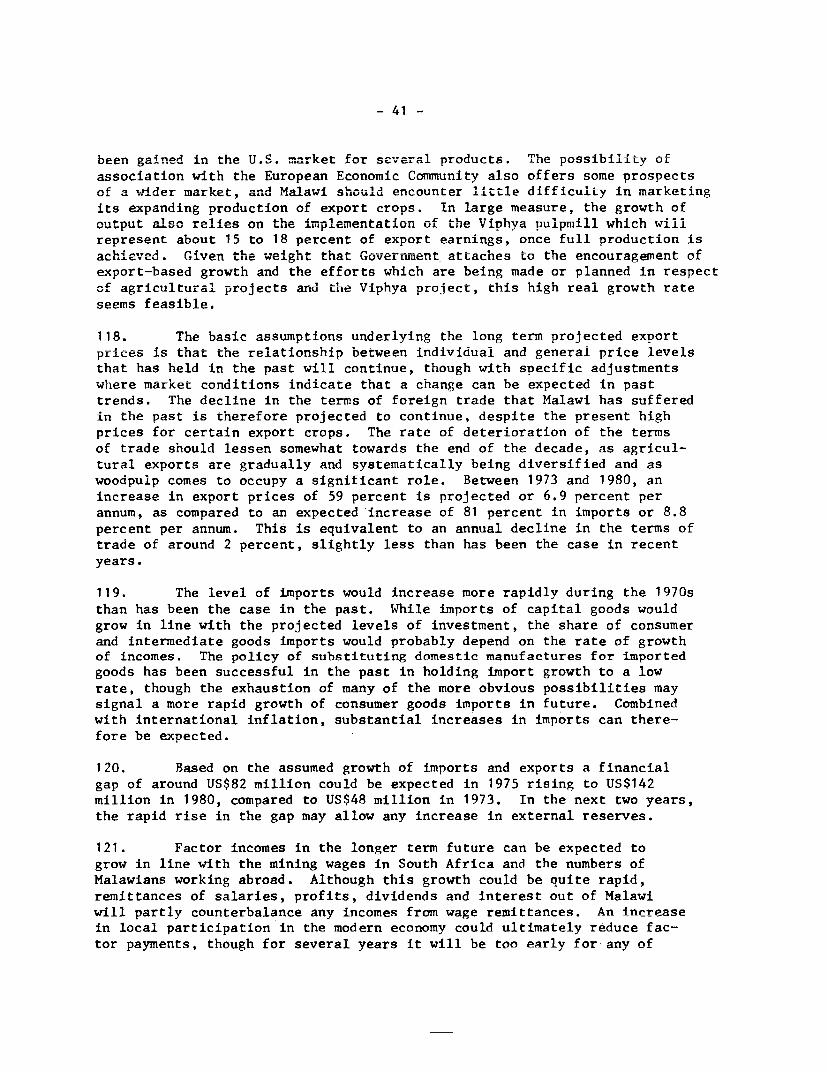
- 41 -
been gained in the U.S. market for several products. The possibilLty ofassociation with the European Economic Community also offers some prospectsof a wider market, and a. lawi should encounter little difficulty in marketingits expanding production of export crops. In large measure, the growth ofoutput also relies on the implementation of the Viphya pulpmill wnich willrepresent about 15 to 18 percent of export earnings, once full production isachieved. Given the e1gh that Government attach-es to tne encouragement ofexport-based growth and the efforts which are being made or planned in respectof agricultural projects and the Viphya project, this high real growth rateseems feasible.
118. The basic assumptions underlying the long term projected exportprices is that the relationship between individual and general price levelsthat has held in the past will continue, though with specific adjustmentswhere market conditions indicate that a change can be expected in pasttrends. The decline in the terms of foreign trade that Malawi has sufferedin the past is therefore projected to continue, despite the present highprices for certain export crops. The rate of deterioration of the termsof trade should lessen somewhat towards the end of the decade, as agricul-tural exports are gradually and systematically being diversified and aswoodpulp comes to occupy a significant role. Between 1973 and 1980, anincrease in export prices of 59 percent is projected or 6.9 percent perannum, as compared to an expected increase of 81 percent in imports or 8.8percent per annum. This is equivalent to an annual decline in the terms oftrade of around 2 percent, slightly less than has been the case in recentyears.
119. The level of imports would increase more rapidly during the 1970sthan has been the case in the past. While imports of capital goods wouldgrow in line with the projected levels of investment, the share of consumerand intermediate goods imports would probably depend on the rate of growthof incomes. The policy of substituting domestic manufactures for importedgoods has been successful in the past in holding import growth to a lowrate, though the exhaustion of many of the more obvious possibilities maysignal a more rapid growth of consumer goods imports in future. Combinedwith international inflation, substantial increases in imports can there-fore be expected.
120. Based on the assumed growth of imports and exports a financialgap of around US$82 million could be expected in 1975 rising to US$142million in 1980, compared to US$48 million in 1973. In the next two years,the rapid rise in the gap may allow any increase in external reserves.
121. Factor incomes in the longer term future can be expected togrow in line with the mining wages in South Africa and the numbers ofMalawians working abroad. Although this growth could be quite rapid;remittances of salaries, profits, dividends and interest out of Malawiwill partly counterbalance any incomes from wage remittances. An increasein local participation in the modern economy could ultimately reduce fac-tor payments, though for several years it will be too early for-anv of
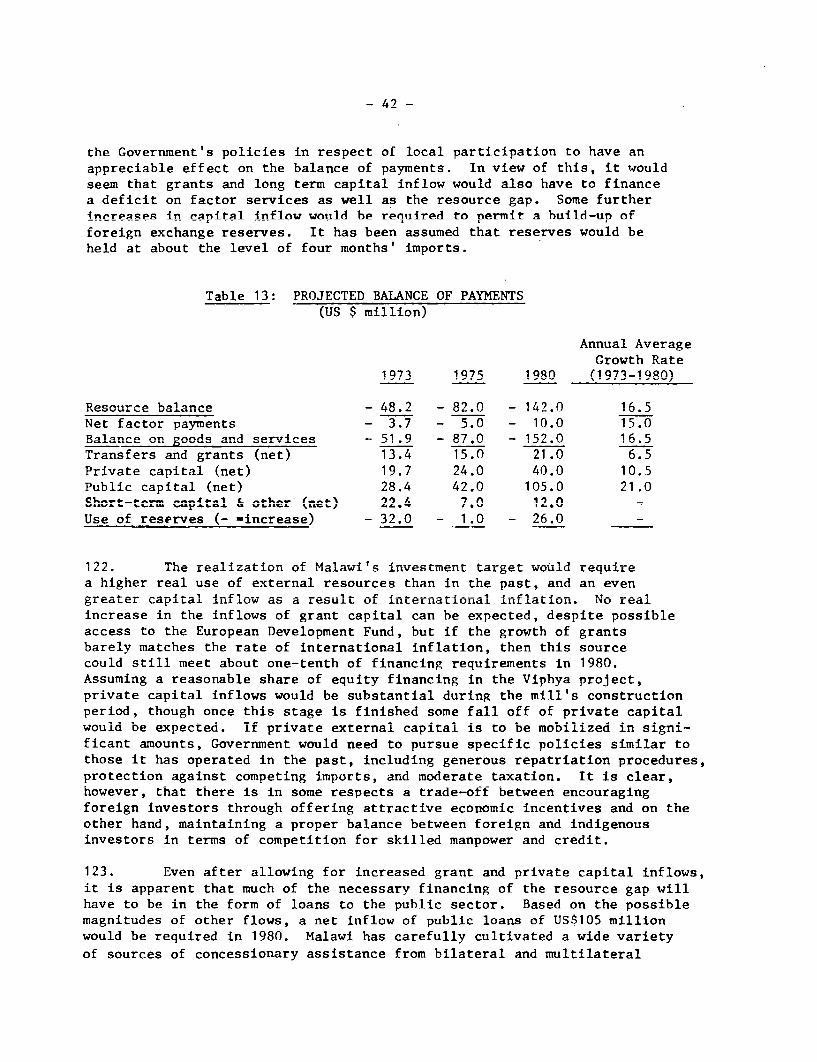
- 42 -
the Government's policies in respect of local participation to have anappreciable effect on the balance of payments. In view of this, it wouldseem that erants and lone term canital inflow would also have to financea deficit on factor services as well as the resource gap. Some furtherinrreaqes in canital inflow would be renuired to nermit a build-un offoreign exchange reserves. It has been assumed that reserves would beheld at ahniit thp level of four months' imnorts.-
Table 13: PROJECTED BALANCE OF PAYMENTS(TUS C mI1llIon)
Annual nAI?e%ragey,
Growth Rate1973 1975 1980 (1973-198n)
Resource balance - 48 /.Q 9 - 8. Q 14 .0 I n 1 r.RNet factor payments - 3.7 - 5.0 - 10.0 15.0Balance on goods and se3ices - 51.9 - 87.0 - 152.0 16.5Transfers and grants (net) 13.4 15.0 21.0 6.5Private capital \(net,-'/ 10.7 A 40.0 10M5Public capital (net) 28.4 42.0 105.0 21.0S.hort-te. cap-'ta' r- other (r.et) 22.4A 7.0 12. =
uJlW L.--~ .wks \& tL L L ~ £.&. I*'
Use of reserves (- =increase) - 32.0 - 1.0 - 26.0 -
I122. IT_he realization of Malawi's i.-.estmnent target wouldreue4_ *- 1LLA -L d1. i1. LL L71 1d.~ bL .LLVb l.iL ~ WULUU L --4uLL U
a higher real use of external resources than in the past, and an evengreater capiLtal inLfow as a result oL iLnternat'Lonal inflatLion. No rea'lincrease in the inflows of grant capital can be expected, despite possibleaccess to the European Dev-elopment Fund, but if the growtn oL grantsbarely matches the rate of international inflation, then this sourcecoulu still meet about one-tenth of financing requirements in 1980.Assuming a reasonable share of equity financing in the Viphya project,private capital inflows would be substantial during tne miiis constructionperiod, though once this stage is finished some fall off of private capitalwould be expected. If private external capital is to be mobiiized in signi-ficant amounts, Government would need to pursue specific policies similar tothose it has operated in the past, including generous repatriation procedures,protection against competing imports, and moderate taxation. It is clear,however, that there is in some respects a trade-off between encouragingforeign investors through offering attractive economic incentives and on theother hand, maintaining a proper balance between foreign and indigenousinvestors in terms of competition for skilled manpower and credit.
123. Even after allowing for increased grant and private capital inflows,it is apparent that much of the necessary financing of the resource gap willhave to be in the form of loans to the public sector. Based on the possiblemagnitudes of other flows, a net inflow of public loans of US$105 millionwould be required in 1980. Malawi has carefully cultivated a wide varietyof sources of concessionary assistance from bilateral and multilateral
- 43 -
agencies. Wnile this past policy will continue to yield benefits in futurein terms of large inflows of funds, it is unlikely that such an inflowcould be achieved entirely on concessionary terms, and Government policytowards external borrowing may require some modification to include borrow-ing on more commercial terms. Some evidence of movement in this directionhas been seen in two recent commercial loans incurred by public corporations.
124. The average terms of past borrowing by the Malawi Government havebeen extremely soft. The average terms of debt outstanding at theend of 1973 were 2 percent interest repayable over 25 years, equivalentto a grant element of about 52 percent after discounting at a rate of 10percent. With the improvement of public sector finances that is occurringand the country's demonstrated ability to generate a high growth of foreignexchange earnings, some borrowing on more commercial terms would not imposean unduly high burden of debt services.
Table 14: PUBLIC EXTERNAL DEBT AND DEBT SERVICE(current US $ million)
1973 1980 1985 1990
Debt outstanding at year end 189.1 650.0 1170.0 1420.0Debt service 11.3 49.0 105.0 170.0Debt service as % of debt outstanding 6.0 7.5 9.0 12.0Debt service as % of export earnings 7.7 15.0 17.0 14.0
125. Total disbursements on external public loans of US$570 million(including US$120 million for the Viphya proiect are likely to be neededbetween 1974 and 1980. If the terms of future borrowing excluding theViphya project were permitted to harden to an average of 4 nercent interestand a 20 year maturity (including 4 years of grace), while all borrowing forthe Viphya project were on commercial terms; the likelv leve1s of futuredebt service would still remain within the debt carrying capacity of thecountry. Debt service, which was equivalent to 10 nperrent of export earn-ings in 1973, would gradually rise to a peak of about 17 percent of exportearnings in 1985. Thereafter a decline in the debt service ratio could beexpected as service on the Viphya project diminishes. The terms of borrow-ing outlined above (excluding Vinhva) are equivalent to a 40 percent grantelement as compared to over 50 percent in recent years. While it will bein Malawi's interest to exercise nrudence in managing the country's externaldebt and to seek as large a proportion as possible of total foreign borrow-ing on concessional terms, it appears in conclusion that it will not beimprudent to supplement these resources with conventional term borrowingsin the order of magnitude suggested.

AJNNEX I
Page 1
INCOME DISTRIBUTION
Government Policy
1. The distribution of personal incomes is intimately related to therelations between urban and rural areas, and hence incomes and prices policyholds a central role in the Malawi Government's concerns. Wage earnersaccount for only a small proportion of the economically active population,and the main source of future increases in incomes must necessarily be risingproductivity in smallscale agriculture. It would be contrary to this broadpolicy to create a privileged position for urban wage earners by artificiallyinflating their incomes, since this would be reflected in increased pricesfor domestically manufactured goods, thus causing a relative and perhapsabsolute reduction in the real incomes of farmers. Not only would this de-press the living standards of the mass of the population, but would also actas a disincentive to increased effort in the agricultural sector. High dif-ferentials between rural and urban incomes may also promote an increasingflow of job-seekers into thhe towns causing serious social and political pro-blems, including the possibility of high unemployment. So far this effecthas not been apparent, partly because of the outlet offered by opportunitiesfor employment abroad.
2. Minimum wage rates have been applied in Malawi since the early1960s, when they were introduced partly on social grounds, partly with theaim to widen the market for local industry and bring about a demand-inducedexpansion of domestic production. Accompanied by specific measures to protectand encourage import substitution, this policy has had some success since itsintroduction, though it has tended also to create a small privileged urbanclass with increasingly import-oriented consumntion tastes About half ofMalawi's exports consist of estate-grown crops where one of the major costsis that of agricultural labor. Any rise in wage costs not related to produc-tivity could adversely affect the output of these estates and jeopardize theachievement of export targets. Accordingly; Malawi has adopted the policyof adjusting wages only in response to changes in productivity and, in parti-cular, avoiding actions which increase the income gap between urban and ruralworkers.
3. Comprehensive income distribution studies as such are not avail-able for Malawi. Nonetheless, several other surveys have been made by Gov-ernment which contain relevant information, and certain statistics which arecollected annually provide data useful for a survey of income distribution.The Household Income and Expenditure Survey for Urban Areas and AgriculturalEstates, 1968 (HIES) and the National Smnple Sur.ey of Agriculture, 1968/69(NSSA) are two major sources of information. The principal drawback in usingdivergent sources of data comes in aggregating to give a complete picture ofincome distribution nationwide. Additional data is contined in the AnnualRenorts of the Comnissioner of Taxes and other unpublished sources, which havenot, however, been taken into account in the following discussion.
ANNFX 1Page 2
Smalhlde 11-f far.m.ers
-~~~ 1. - cond cte Xn th r l
with the aim of obtaining information on, interalia, household income andand eA4edtr ir . *the monetar sector of the ruru
1al econo.y. Tho. sanmfl a
covered households in villages but excluded households attached to non-traditional elem,ents -in rural areas, sucht as t-rauding centers, mission-s,estates and Government stations, as well as urban areas. According to the1966C Population Census, th-ese various excluin accoun fo 8.2 ------ o
Malawi's population, indicating that the survey results apply to the remain-ing 91.0 percent.
5. No'A was not specificaLLL.L.Ly Udeig.eLdU LU L itatanL.LLLC ana LL .Lysis of
rural incomes from the standpoint of the income recipient, but certain sub-aggregates can 'De Iateu with some au'uLtona'l cross-tabulation, though thleaggregation process will tend to overstate the evenness of distribution.Only cash transactions are inciuded, thus ignoring completely the very import-ant subsistence element of rural incomes. Nevertheless, to the extent thatmonetization reflects interaction with the non-tradiLtonal sector of theeconomy, NSSA can serve as an indicator of the relative "openness"t, in thetrading sense, or rural income units. As certain good's associated with ahigher standard of living can only be acquired from the modern sector on acash basis, the absolute magnitude of the cash portion of total income alsoserves as an indicator of thy financial constraint in improving rural livingconditions. The sub-aggregates singled out here for analysis are districtsand farm size classes.
6. Average cash receipts from all sources 1/ ranged from K 20.68 inFt. Johnson district to K 66.09 in Blantyre district. if districts areranked according to average cash receipts per holding and distribution curveis plotted, it can be seen that the distribution is not particularly uneven.The districts with the lowest 40 percent of the holdings (Mangochi, Dedza,Salima, Nkhota Kota, Mzimba, Ntchisi, Kasungu and Mulanje) accounted for 29.7percent of total cash receipts, while the highest 10 percent (NKhata Bay,Karonga and Blantyre) had 15.6 percent of receipts.
7. The NSSA makes a distinction between cash incomes from farming andthose from other sources. The distribution of incomes from farming is some-what more skewed, ranging from average receipts per holding of K 1.63 inMulanje district to K 24.98 in Chikwawa district. Reranking districts accord-ing to average farm cash incomes, the districts with the lowest 40 percent ofthe holdings have 13.5 percent of farm incomes, while the top 10 percent has12.4 percent. It is, however, clear that low farm incomes are mitigated byhigher non-farm incomes, since using this revised ranking, the distribution
1/ For Malawi as a whole, total recorded cash receipts included consumercredit (2.2 percent) and savings withdrawals (4.1 percent) in additionto receipts from all other sources.
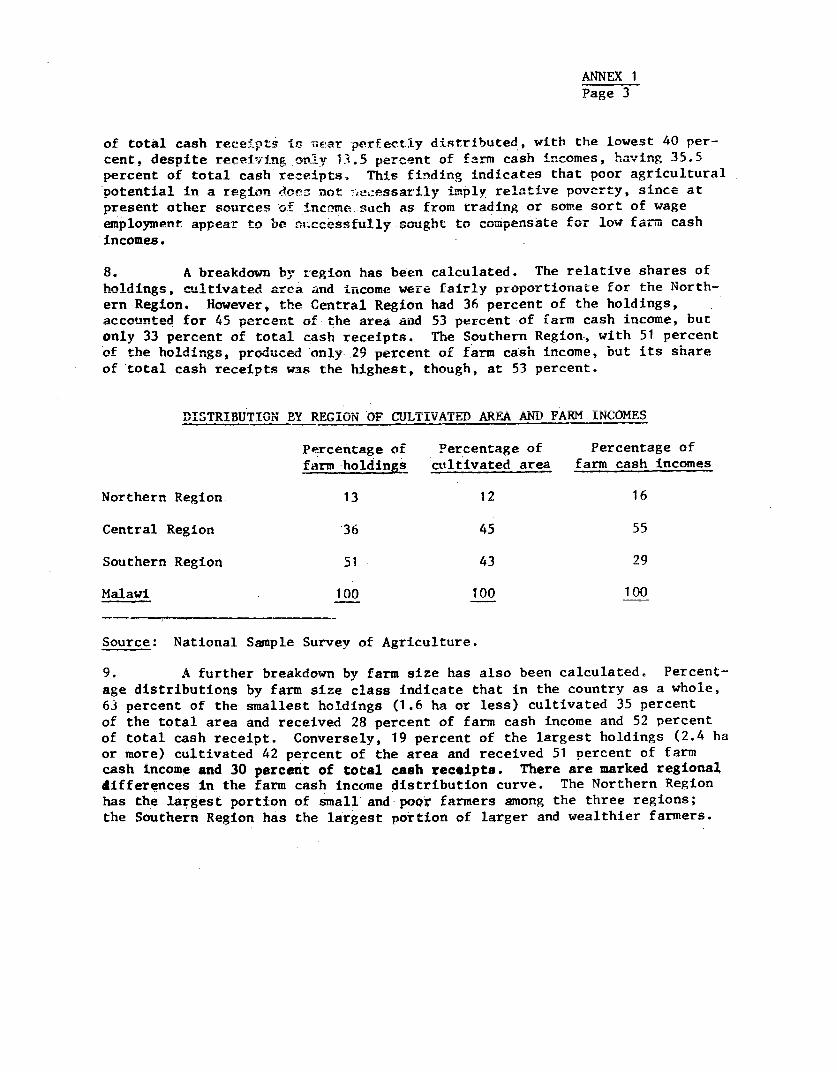
ANNEX 1Page 3
of total cash receiPts .s i. ar perfectly distributed, with the lowest 40 per-cent, despite recei-,ing nn-^y i1.5 percent of farm cash incomes, having 35.5percent of total cash receipts. This finding indicates that poor agriculturalpotential in a reglon donz not --. e;-essarily imply relative povert, since apresent other sources of income such as from trading or some sort of wageemployment ap1rpRr to be nuccissfully sought to compensate fowr low fa.,. cashlincomes.
8. A breakdown by region has been calculated. The relative shares ofholdings, cultivated area a.,d Lncome were £LLairly proportionate for the North-ern Region. However, the Central Region had 36 percent of the holdings,accounted for 45 percen- of the area and 53 percent or farm cash income, butonly 33 percent of total cash receipts. The Southern Region-, with 51 percentof the holdings, produced 'only-29 percent of farm cash income, but its shareof total cash receipts was the highest, though, at 53 percent.
TV.L,IpTR>LUTLIN P,iY REGION OF CULTIVATED AREA AND FA-RM INCOMES
Percentage of Percentage of Percentage offarm holdings ctltivated area farm cash incomes
Northern Region 13 12 16
Central Region 36 45 55
Southern Region 51 43 29
Malawi 100 100 100
Source: National Sample Survey of Agriculture.
9. A further breakdown by farm size has also been calculated. Percent-age distributions by farm size class indicate that in the country as a whole,63 percent of the smallest holdings (1.6 ha or less) cultivated 35 percentof the total area and received 28 percent of farm cash income and 52 percentof total cash receipt. Conversely, 19 percent of the largest holdings (2.4 haor more) cultivated 42 percent of the area and received 51 percent of farmcash income and 30 percent of total cash receipts. There are marked regionaldifferences in the farm cash income distribution curve. The Northern Regionhas the largest portion of small and poor farmers among the three regions;the Southern Region has the largest portion of larger and wealthier farmers.
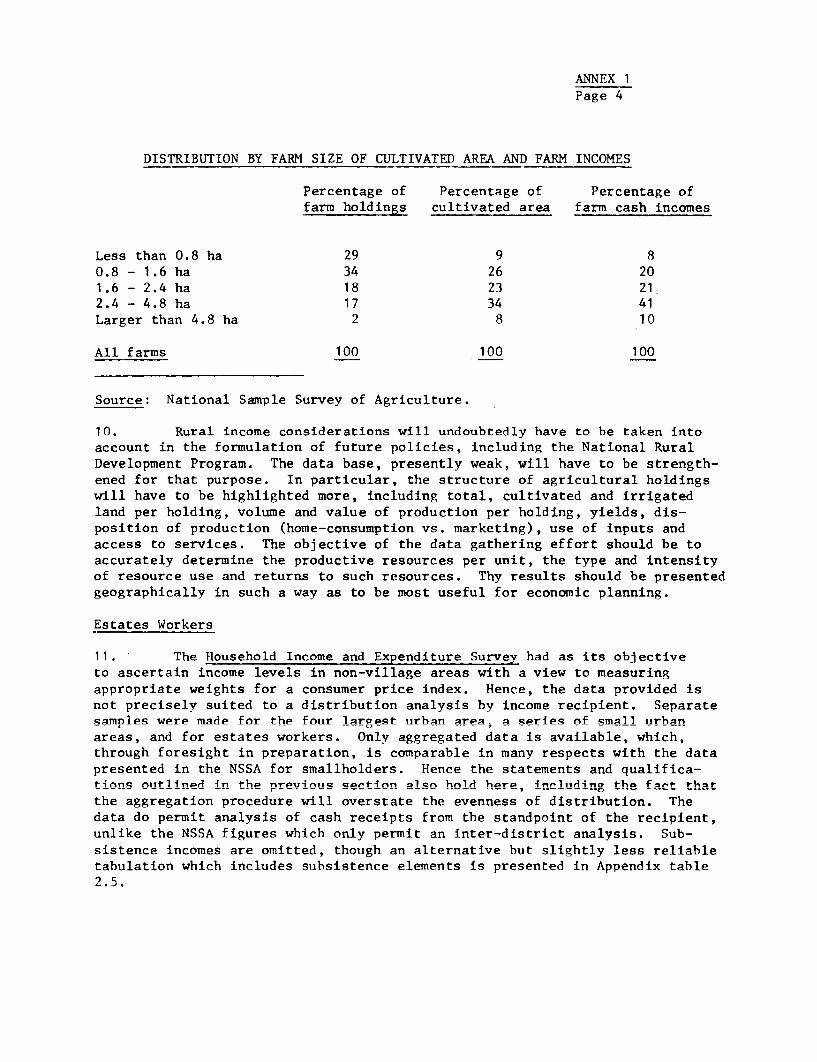
ANNEX 1
Page 4
DISTKIBULION fBi FARM SIZE OF CULTIVALED ARJEA AND FAKn INCOMES
Percentage of Percentage of Percentage otfarm holdings cultivated area farm cash incomes
Less than 0.8 ha 29 9 80.8 - 1.6 ha 34 26 20
1.6 - 2.4 ha 18 23 212.4 - 4.8 ha 17 34 41
Larger than 4.8 ha 2 8 10
All farms 100 100 100
Source: National Sample Survey of Agriculture.
10. Rural income considerations will undoubtedly have to be taken intoaccount in the formulation of future policies, including the National RuralDevelopment Program. The data base, presently weak, will have to be strength-ened for that purpose. In particular, the structure of agricultural holdingswill have to be highlighted more, including total, cultivated and irrigatedland per holding, volume and value of production per holding, yields, dis-position of production (home-consumption vs. marketing), use of inputs andaccess to services. The objective of the data gathering effort should be toaccurately determine the productive resources per unit, the type and intensityof resource use and returns to such resources. Thy results should be presentedgeographically in such a way as to be most useful for economic planning.
Estates Workers
11. The Household Income and Expenditure Survey had as its obiectiveto ascertain income levels in non-village areas with a view to measuringannronriate weilhts for a consumer nrice index. Hence; the data orovided isnot precisely suited to a distribution analysis by income recipient. Separatesamples were made for the four largest urban area, a series of smal1 urhanareas, and for estates workers. Only aggregated data is available, which,through foresight in nrenaratinn- is onmnarahlp in manv rpenersn with thp data
presented in the NSSA for smallholders. Hence the statements and qualifica-tinnq outlined in the nrpuinous sezt-inn alsn hold here, includino the fa,-t- that
the aggregation procedure will overstate the evenness of distribution. Thedata do permit a.nalysis of cash receipts fro vm t-he atandpoint of the reciplent,unlike the NSSA figures which only permit an inter-district analysis. Sub-si ti LOLenc.e incomL.esae re oitt C edL , Lt hLou gh an a lt ern,at b .L CDu t 0., 1 4-11 less rel- -1 4 iable
tabulation which includes subsistence elements is presented in Appendix tableI, .
ANNEX 1
Page 5
12. The majority of estates workers have low cash receipts depsitebeing involved in the modern agriculture sector. Over 80 percent of house-holds have cash receipts under K 140, while the average receipts are K 116.Nonetheless, this compares relatively well with the average of K 40 for small-holder farmers. The organization and land use on estates is in many casessuch as to allow continuing subsistence production to supplement money incomes.HIES estimates that the value of subsistence production averages equivalent toabout one-third of cash receipts, though an average implies that in some casesthis proportion will be lower and in others higher. Competition for laborbetween estates work and subsistence production, particularly at peak seasonscould reduce the amount of food that a household can produce. Dwelling costson estates are relatively low compared with urban areas, as on some estatessimple housing is provided free. The poorest 40 percent of estates workershave 27 percent of total cash receipts, while the richest 10 percent havearound 26 percent. Amongst estates workers the range of incomes is thereforenot particularly skewed: though an important dimension is lacking through theexclusion of estate owners and managers in the total. If these individualswere included, a substantially more skewed distribution would emerge. Accord-ing to the Annual Survey of Economic Activities, 1971, only 52 percent of netoutput of tea, tobacco and sugar estates was accounted for by waRes and salar-ies, leaving 48 percent to cover direct taxes, depreciation dividends andprofits. This implies a high concentration of income in the hands of estatesowners, with perhaps as much as one-third of total income accruing to verysmall number of owners.
Urban areas
13. Four distinct areas were covered in HIES - Blantvyre, Zomba, Li1ongwe
and Mzuzu - plus a grouping of small urban areas. The results indicateconsiderably higher cash receipts iban n areas than on estates or
in rural areas, with the highest averages tending to be in the largest areas.The skewness of distribution is also much greater than in rural areas and on
estates, and with more skew distributions tending to coincide with the largerurban areas. The following figuares summarize some basic data on distribution
of cash receipts in urban areas.
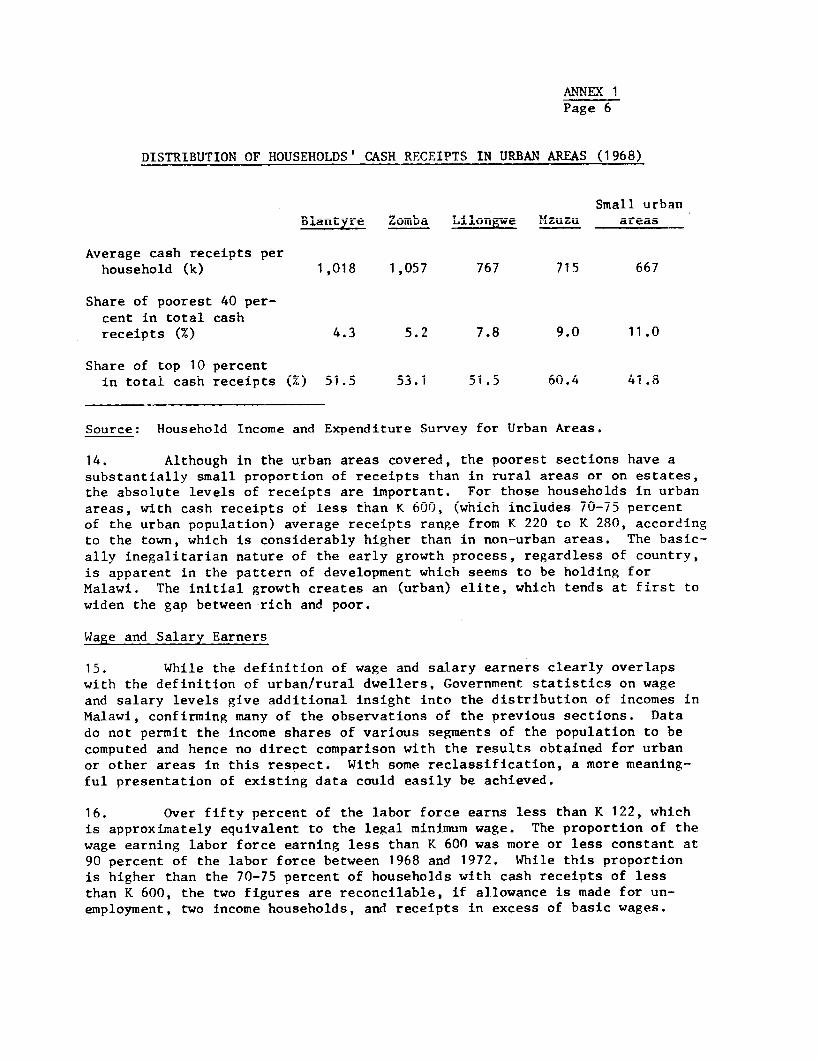
AMNEX 1
Page 6
~ t~1~ 11(~~TT'.' I fAL'T D *EUTnl'I TMJ ?TDD~AX ADt'AC (inONODISTRIBDUTIONT OF" HOUS"EnOLDS t %.C%OL RFJ,CEIPTS IN _L_UVpUZU11 ArLAC! \(1968)
Small urbanBlantyre Zou.ba Lilornwe Mzuzu areas
Average cash receipts perhousehold (k) 1,018 1,057 767 715 667
Share of poorest 40 per-cent in total cashreceipts (x) 4.3 5.2 7.8 9.0 11.0
Share of top 10 percentin total cash receipts 51.5 53.1 51.5 60.4 41.8
Source: Household Income and Expenditure Survey for Urban Areas.
14. Although in the urban areas covered, the poorest sections have asubstantially small proportion of receipts than in rural areas or on estates,the absolute levels of receipts are important. For those households in urbanareas, with cash receipts of less than K 600, (which includes 70-75 percentof the urban population) average receipts range from K 220 to K 280, accordingto the town, which is considerably higher than in non-urban areas. The basic-ally inegalitarian nature of the early growth process, regardless of country,is apparent in the pattern of development which seems to be holding forMalawi. The initial growth creates an (urban) elite, which tends at first towiden the gap between rich and poor.
Wage and Salary Earners
15. While the definition of wage and salary earners clearly overlapswith the definition of urban/rural dwellers, Government statistics on wageand salary levels give additional insight into the distribution of incomes inMalawi, confirming many of the observations of the previous sections. Datado not permit the income shares of various segments of the population to becomputed and hence no direct comparison with the results obtained for urbanor other areas in this respect. With some reclassification, a more meaning-ful presentation of existing data could easily be achieved.
16. Over fifty percent of the labor force earns less than K 122, whichis approximately equivalent to the legal minimum wage. The proportion of thewage earning labor force earning less than K 600 was more or less constant at90 percent of the labor force between 1968 and 1972. While this proportionis higher than the 70-75 percent of households with cash receipts of lessthan K 600, the two figures are reconcilable, if allowance is made for un-employment, two income households, and receipts in excess of basic wages.
ANNEX 1
Page 7
Relative Price and Wage Changes
17. Changes in the real purchasing power of earnings of different
occupational or social groups provide one index of movements in the distribu-
tion of incomes. To be completely reliable would require that fixed propor-
tions of the population belong to each group, an assumption that is clearly
not true for Malawi, where increasing proportions of thye population are being
babsorbed into the wage earning and urban groups.
18. It is clear from available wage and price indices that the relative
real earnings of modern sector wage earners have been eroded by inflation
since 1968. Average earnings - both generally and in specific sectors -
have risen at under half the rate of consumer prices, with Government em-
ployees probably irsing least. Shifts in thv composition of the Government's
labor force make accurate comparison difficult. Agricultural earnings appear
to have risen by more than other sectors, but have still not kept pace with
prices, while for those paid only the legal minimum wage, the view is similar.
The fact that prices have risen faster than earnings could implys a widening
of profit margins over the 1968-1973 period, which is in fact supported by
the Annual Survey of Economic Activities. The overall trend for many sectors,
including estates, agriculture and industry has been for a smaller share of
net output to be spent on wages and salaries.
19. An index of producer prices for agricultural crops indicates that
prices have more or less kept abreast of consumer price inflation. This
reflects the Govprnment's wishes to improve the conditions of life in rural
areas and may provide part of the reason for the apparent success of policy
in holding rural-urban milration to a minimum. Even though producer prices
have risen relatively faster than earnings in other sectors, the same pheno-
menon of increasing "nrofit marains" is anparent here too, though the profit
maker here is ADMARC, the parastatal Agricultural Development and Marketing
Corporation, ExnPOt nrices of crons have in general risen more rapidly than
producer prices..
Overall Income Distribution
20. Aggregation of all available data is not feasible, but it. is clear
that distribution of incomes throughouit the eeonomv is skewed in favor of
the urban and modern sectors. Available data refer to cash receipts but even
allowing for the levelling effect of subsistence incomes for the maiority of
the population as a main means of livelihood, it is doubtful that the poorest
40 percent of the population - almost exclusivevly rral - receives more than
25 percent of incomes. The top 10 percent of the population mav have about
35 percent of incomes and the top 5 percent as much as 30 percent of incomes.
There is a distinct gap between urban and rural areas.
21. Nonetheless, the Government's policies to assure an equitable dis-
tribution are having some success. Real extremes of poverty are conspicniously
ANNEX 1
Page 8
absent in Malawi, while urban development has so far not involved the extremesfound in many large cities of the developing world. The policies applied havetended to keep the majority of urban dwellers or wage earners at the low endof the scale, thus limiting the urban-rural gap as perceived by a typicalfarmer with relatively little education or skills in terms of his earningcapacity in the cities. The skewness of distribution is more due to the highrewards which accrue to those with specialized skills or abilities, particu-larly in the form of profits. This in turn has been one of the factors be-hind the increasing levels of savings. There is reason to believe that thepresent policies of Goverment will prove effective in avoiding the more ad-verse aspects of urbanization and the extremes of income maldistribution.
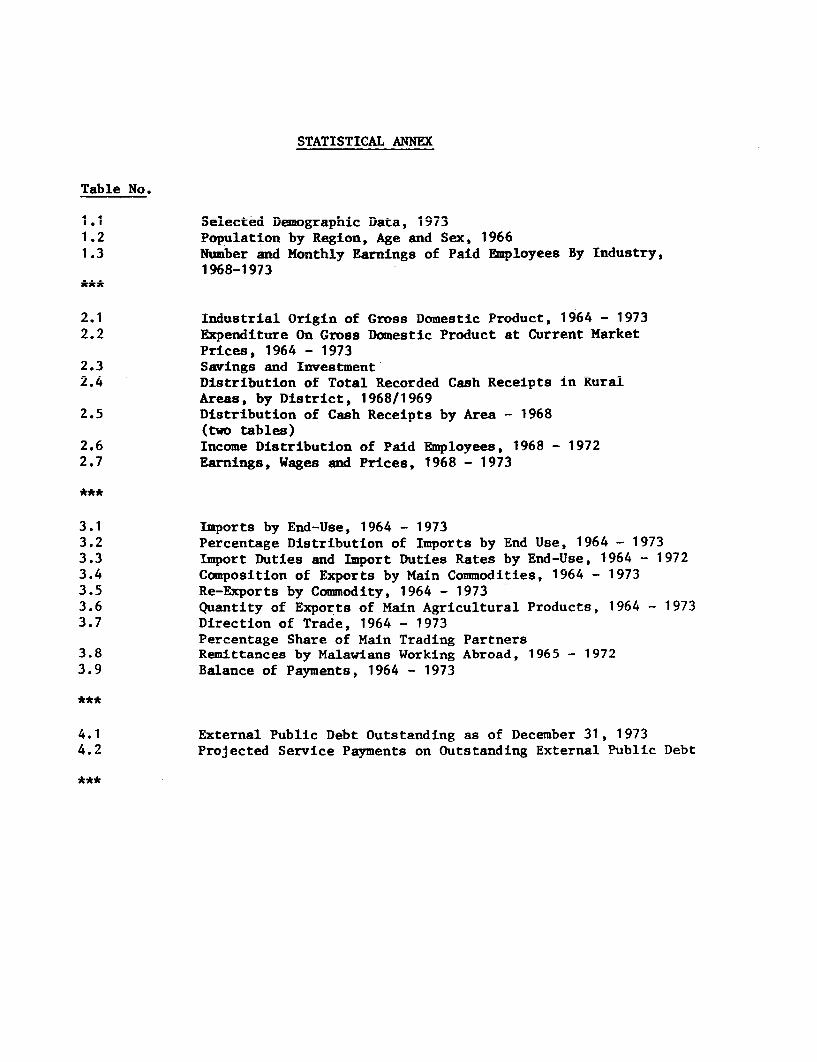
STATISTICAL ANNEX
TabUe 'do.
1.1 Selected Demographic Data, 19731.2 Population by Region, Age and Sex, 19661.3 Number and Monthly Earnings of Paid Employees By Industry,
1968-1973
2.1 Industrial Origin of Gross Domestic Product, 1964 - 19732.2 Expenditure On Gross Domestic Product at Current Market
Prices, 1964 - 19732.3 Savings and Investment2.4 Distribution of Total Recorded Cash Receipts in Rural
Areas, by District, 1968/19692.5 Distribution of Cash Receipts by Area - 1968
(two tables)2.6 Income Distribution of Paid Employees, 1968 - 19722.7 Earnings, Wages and Prices, 1968 - 1973
3.1 Imports by End-Use, 1964 - 19733.2 Percentage Distribution of Imports by End Use, 1964 - 19733.3 Import Duties and Import Duties Rates by End-Use, 1964 - 19723.4 Composition of Exports by Main Commodities, 1964 - 19733.5 Re-Exports by Commodity, 1964 - 19733.6 Quantity of Exports of Main Agricultural Products, 1964 - 19733.7 Direction of Trade, 1964 - 1973
Percentage Share of Main Trading Partners3.8 Remittances by Malawians Working Abroad, 1965 - 19723.9 Balance of Payments, 1964 - 1973
4.1 External Public Debt Outstanding as of December 31, 19734.2 Proiected Service Pavments on OutstandinR External Public Debt
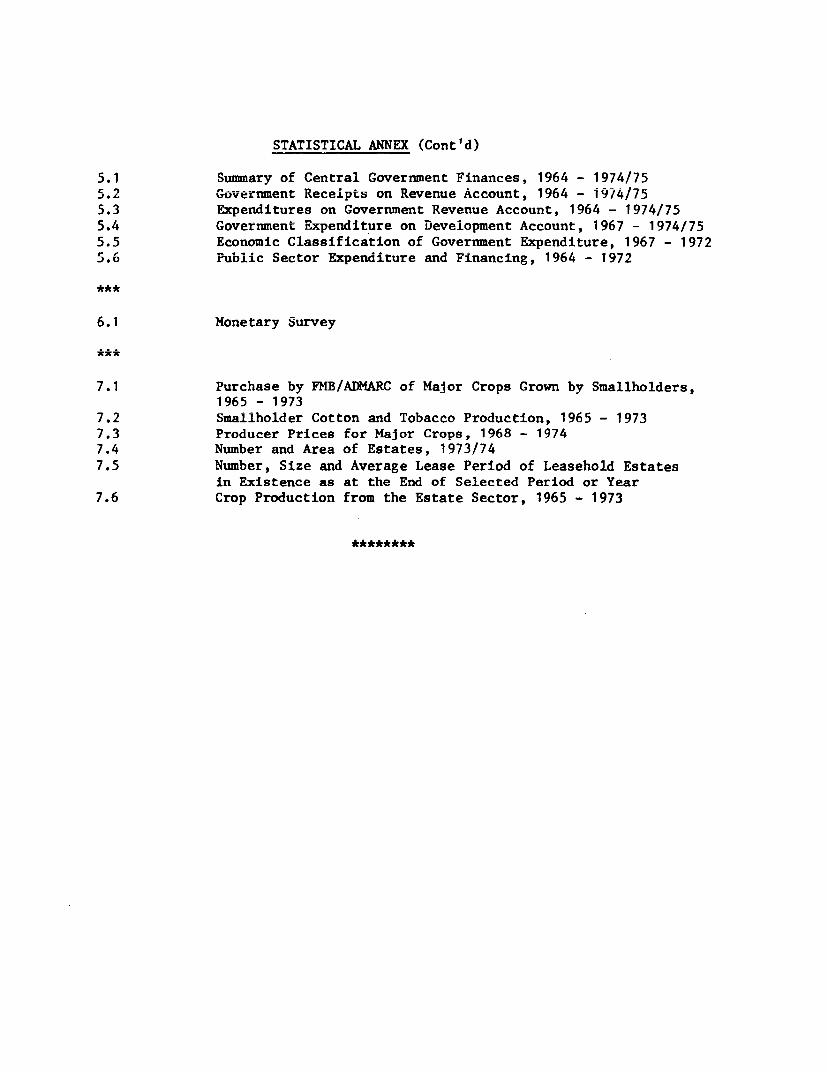
STATISTICAL ANNEX (Cont'd)
5.1 Summary of Central Government Finances, 1964 - 1974/755.2 Government Receipts on Revenue Account, 1964 - 1974/755.3 Expenditures on Government Revenue Account, 1964 - 1974/755.4 Government Expenditure on Development Account, 1967 - 1974/755.5 Economic Classification of Government Expenditure, 1967 - 19725.6 PuDlic Sector Expenditure and Financing, 1964 - 1972
6.1 Monetary Survey
7.1 Purchase by FMB/ADKARC of Major Crops Grown by Smallholders,1965 - 1973
7.2 Smallholder Cotton and Tobacco Production, 1965 - 19737.3 Producer Prices for Major Crops, 1968 - 19747.4 Number and Area of Estates, 1973/747.5 Number, Size and Average Lease Period of Leasehold Estates
in Existence as at the End of Selected Period or Year7.6 Crop Production from the Estate Sector, 1965 - 1973
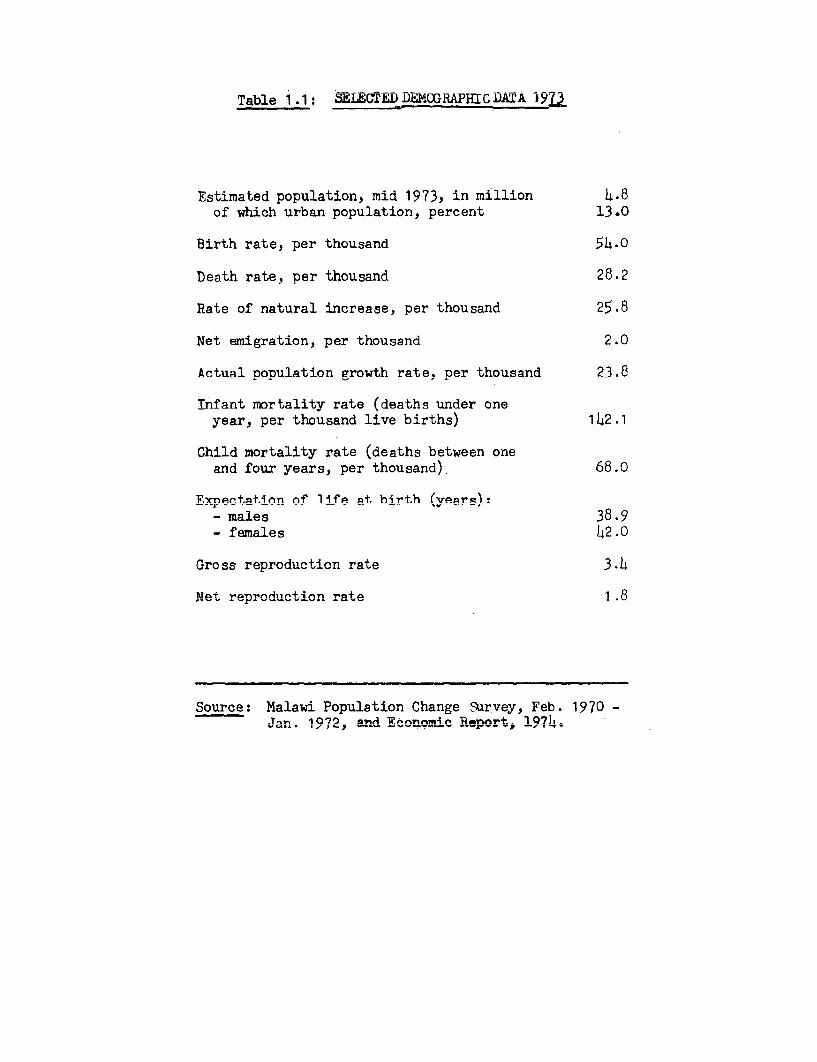
Table 1 .1: MIEDDEMGRAPHICIAAIYY9
Estimated population, mid 1973, in million 4.8of which urban population, percent 13.0
Birth rate, per thousand 54.0
Death rate, per thousand 28.2
Rate of natural increase, per thousand 25.8
Net emigration, per thousand 2.0
Actual opDulation growth rate, per thousand 23.8
Infant mortality rate (deaths under oneyear, per thousand live births) 142.1
Child mortality rate (deaths between oneand four years. ner thousand) 68.0
Exnectation of 1lfe Pt birth (year)!
- males 38.9- fmn .Ies 42 -0
Gross o rce: M wiPopulati Cr , 1
Net reproduction rate A.
Source: Malawi Population Change Survey., Feb. 1970-Ja.1070, aitid Ricot^y^Ac P.eb-nortj 1Q7)i
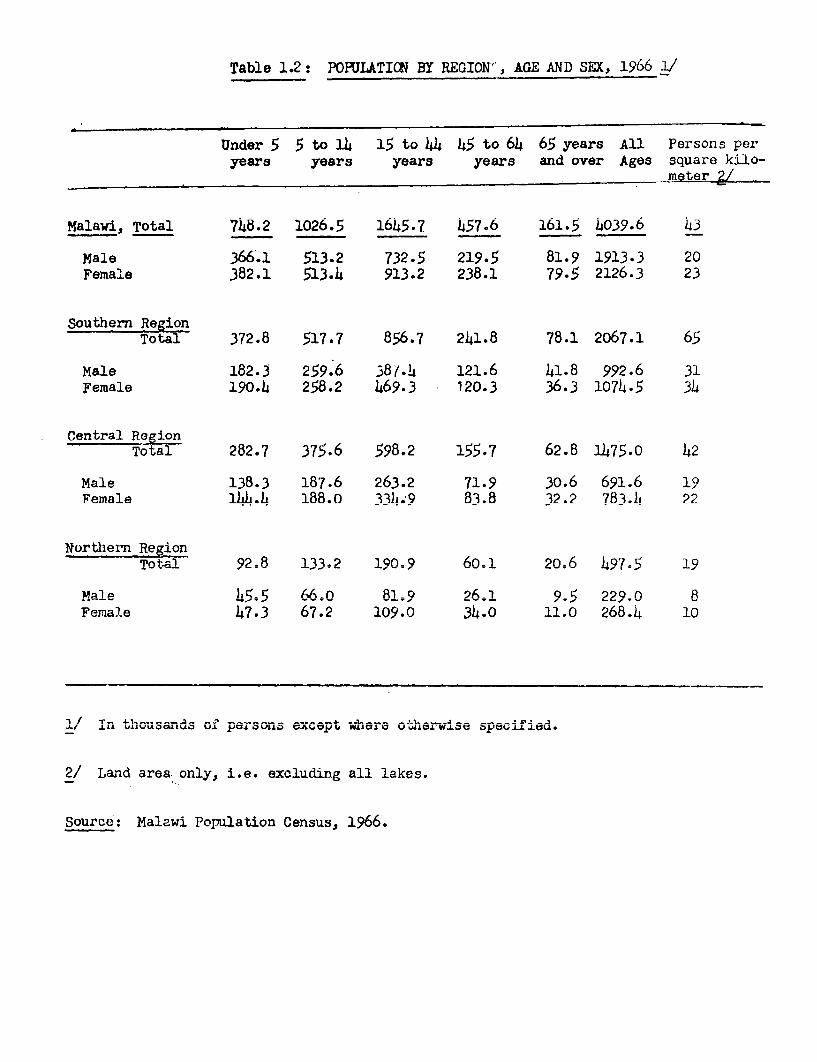
Table 1.2: POFULATICN BY REGION', AGE AND SEX, 1966 1V
Under 5 5 to 14 15 to 44 45 to 64 65 years All Persons peryears years years years and over Ages square kilo-
Malawi, Total 748.2 1026.5 1645.7 457.6 161.5 4039.6 43
Male 366.1 513.2 732.5 219.5 81.9 1913.3 20Female 382.1 513.4 913.2 238.1 79.5 2126.3 23
Southern RegionTotal 372.8 517.7 856.7 241.8 78.1 2067.1 65
Male 182.3 259.6 381.4 121.6 41.8 992.6 31Female 190.4 258.2 469.3 120.3 36.3 1074.5 34
Central ReeionTotal 282.7 375.6 598.2 155.7 62.8 1475.0 42
Male 138.3 187.6 263.2 71.9 30.6 691.6 1°Female 144.L 188.0 33h.9 83.8 32.2 783.h 22
Nortlern Regionmi-.n1 92,8 133.2 190.9 60,1 2 6 497.5 9
Male 45.5 66.0 81.9 26.1 9.5 229.0 8Female 47.3 67.2 109.0 34.0 11.0 268.4 10
±1 LA LfJIUL&0LLUO VJ.L P0O1J1L AA.&tovy, WAAlil- Uwltn1WLot: cipj~ui.LJ .LU
2/ Land area only, i.e. excluding all lakes.
Source: Malawi Population Census, 1yOo.
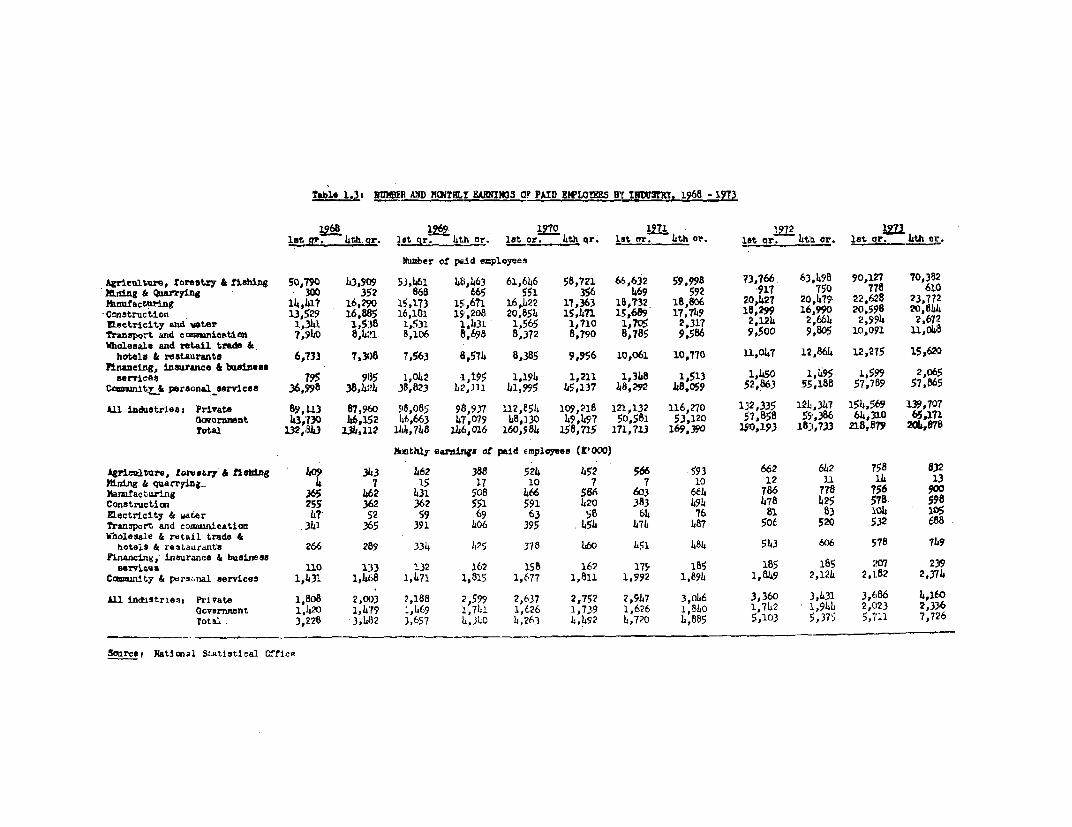
abl1ej 1.: RWR AxD KOIrTLr EAuwrnas a0 PAID EWPLOUS T IlHDVIMT 968 -:l27
ls?68 1* .1970. 1'71 IR2l 19721at _ q e 4rth . c lt or. et or lath or. let otr. .4th or.
Number of paid employees
Agricultore, forestry & fishing 50o,70 43,9o !;3,,461 1.83,463 61,646 58,721 65,632 59,998 73,766 63,498 90,127 70,382Ening & Qnartying 300 352 868 665 551 356 469 592 917 750 7t8 610Mnuafacturing 14,417 16,290 15,173 15,671 16,022 17,363 18,T32 18,806 20,427 20,479 22,628 23,772Cosatruction 13,529 16,885 16,101 15.208 20,854 15,471 15,689 17,749 18,299 16,990 20,598 20,824flectricity and Inter 1,.341 1,538 1,5 1J431 1,565 1,no 1,705 2,317 2,121h 2,664 2,9994 2,672fransport and cuamnnifltJ@a 7,94h0 8,41;. 8,106 81,698 8,372 8,790 8,785 9,586 9,500 9,805 10,091 11,018Wholesale and retail trade &
hotele & restaurants 6,733 7,3)8 7,563 8,571. 8,385 9,956 10,061 10,770 11,047 12,8664 12,275 15,620Financing, insurance & buztnesa
earrnt es95 9985 1,01t2 1,195 1,194 1,211 1,348 1,513 1,450 1,495 i,599 2,065CoWOiflitL& personalservices 36,'998 38,41.4 38,823 42,111 41,995 45,137 h8,292 48.059 52,863 55,188 57,789 57,865
All industriesi Private 89,L13 87,960 98,085 96,937 L2,0854 109,218 121,132 116,270 132,335 124,347 i54,569 139,707Omernrmat 143,730 46,152 1a6,663 1.7,079 1,8,130 49,4917 50,58± 53,120 57,858 59,386 64,310 6,171Total 132,8153 13b,rL2 114,718 146,016 160,9S84 158,725 171,713 169,390 190,193 l183,733 218,879 20&,878
smthly earnirgs of paid emploees (k'OOo)
AgricuItere, forvstrI & flseng 4.09 343 462 388 524 452 566 .593 662 642 7,58 832Ytning & quarrying- 4 7 15 17 10 7 7 10 12 11 14 13Manufactaring .365 1452 43± 508 466 566 fi3 664 786 778 7'56 9goConstruction Z55 3/!2 362 551 591 420 383 494, 478 425 578 598E.ectrictty & water 47' 52 59 69 63 58 61 76 81 63 304 1C5Transport and comLamtcatian 341 365 391 106 395 454 Oh71 1.87 506 520 532 688Wholesale & retail trade &
hotels & restaurdnts 266 289 334 425 378 460 5l1 h8L 543 606 578 719Financing, insurance & business
services 110 133 132 162 158 16,2 179 185 185 1S .207 239Caomnitcy & persunal services 1,1531 1,4638 1,471 1,815 1,677 1,811 1,592 1,89? 1,849 2,124 2,182 2,374
A11 inclestriest Private 1,1308 2,003 2,188 2,599 2,637 2,7512 2,947 3,o46 3,360 3,431 3,686 4 160GOvernment 1,420 1,1479 1,1469 1,741 1,626 1,739 1,626 1 B80 1,742 1,941 2,023 2,336Total .3,'228 -3,482 3,657 I,38LO ,2k63 1.492 h,720 4 885 5,103 5,375 5,711 7,7.26
Soarce, Naticnal Statistical Of-fice
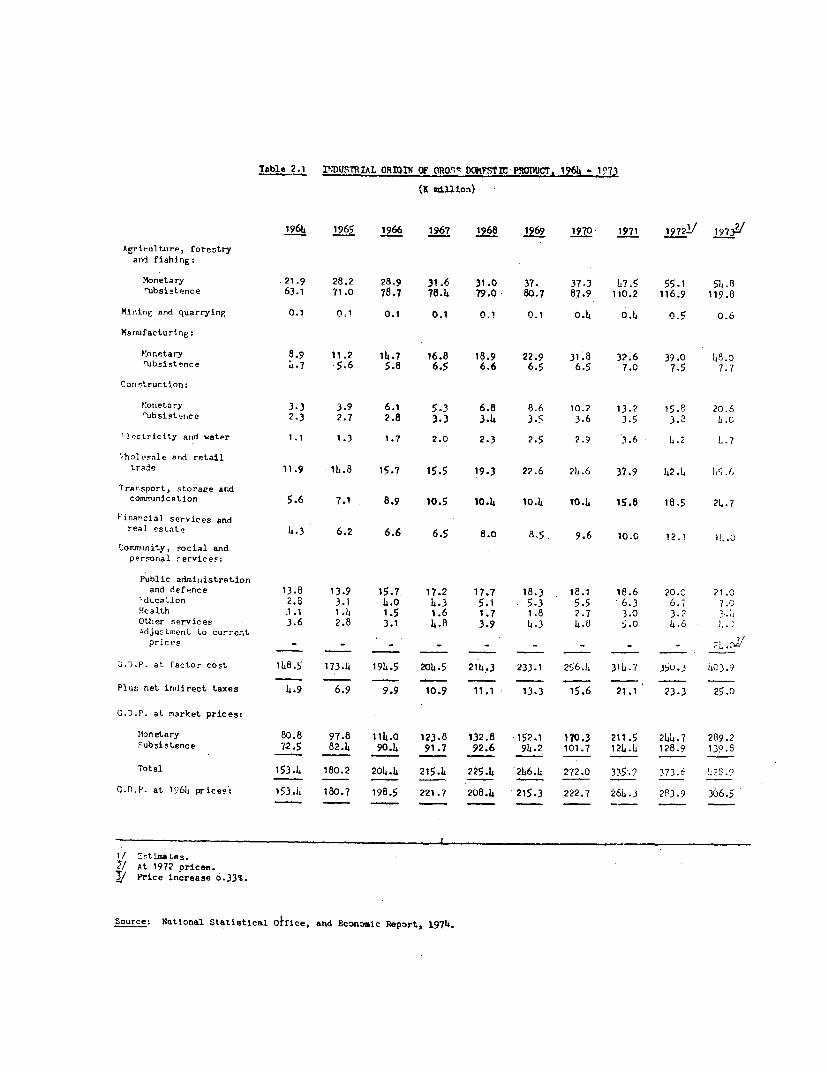
Teble 2.1 IP.USTRIAL ORIIN OF GRO;t) D0IFST!C PRODUCT, 1964 1973
(K d -i32n)
1964 1965 1966 1967 1968 1969 1970 1971 19722/ 193/
Agrirulture, rorectrvanid fishing:
Monetary -21.9 28.2 28.9 31 6 31.0 3?. 37.3 47.5 55.1 54.eDubsistence 63.1 71.0 78.7 78.4 79.0 80.7 87.9 110.2 116.9 119.8
Minine and nuarrvine 0.1 0.1 0.1 0.1 0=1 0.1 Al, 0.4 0=S 0.6
M;anufacturing:
Monetary 8.9 11.2 11.7 16.8 18.9 22.9 31.8 32.6 39.0 48.0rubcistrnce 4-7 5.6 5.8 6.5 6.6 6.5 6.5 7.0 7.5 7.7
Cornstruction:
Mornetary 3.3 3.9 6.1 5.3 6.8 8.6 10.2 13.2 15.8 20.6Dubsistwnce 2.3 2.7 2.8 3.3 3.14 3.5 3.6 3.5 3.2 L.C
'Icctricity and watpr 1.1 1.3 1.7 2.0 2.3 2.5 2.9 3.6 - L.2 L.7
' ho] esale And retailtrade 11.9 1h.8 15.7 15.5 19.3 22.6 24.6 37.9 L2.4 115 .6
Transport, storage andcormunication 5.6 7.1 8.9 10.5 10.4 10.4 10.4 15.8 18.5 214.7
Financial services andreal esLtac 4-3 6.2 6.6 6.5 8.0 8.5, 9.6 10.0 12 1 fl.
0orr.r,,nity, social andpersonal cervices:
Public adniinistrationand defence 13.8 13.9 15.7, 17.2 17.7 18.3 18.1 18.6 20.0 21.0
Fdrca±Lon 2.8 3.- 14.0 14.3 5.1 5.3 5.5 6.3 6.7 7.CHealth .1.1 1.4 1.5 1.6 1.7 1.8 2.7 3.0 3.2 ,,Other services 3.6 2.8 3.1 4.8 3.9 1.3 4.8 5.0 4.6 [.0adjuctment to current
prices - - - - - - - -
G.D.P. at factor cost 148.5 173.4 194.5 204.5 214.3 233.1 256.4 314.7 350.3 4c0.9
Plus net indirect taxes 4.9 6.9 9.9 10.9 11.1 13.3 15.6 21.1 23.3 25.0
G.D).P. at market prices:
Monetary 80.8 97.8 114.0 123.8 132.8 152.1 170.3 211.5 244.7 289.2Subsistence 72.5 82.4 90.4 91.7 92.6 94.2 101.7 124.4 128.9 139.8
Total 153.4 180.2 204.14 215.14 225.4 22h6.4 272.0 335.,2 373.S 112.9
G.Dl.P. at 1964 pricest 153.1i i80.7 198.5 221.7 208.4 215.3 222.7 264.3 283.9 306.5
1/ OrtIma te s.2/ At 197i orices./ Price increase 6.33%.
Source: National Statiatical office, and Economic Report, 1974.
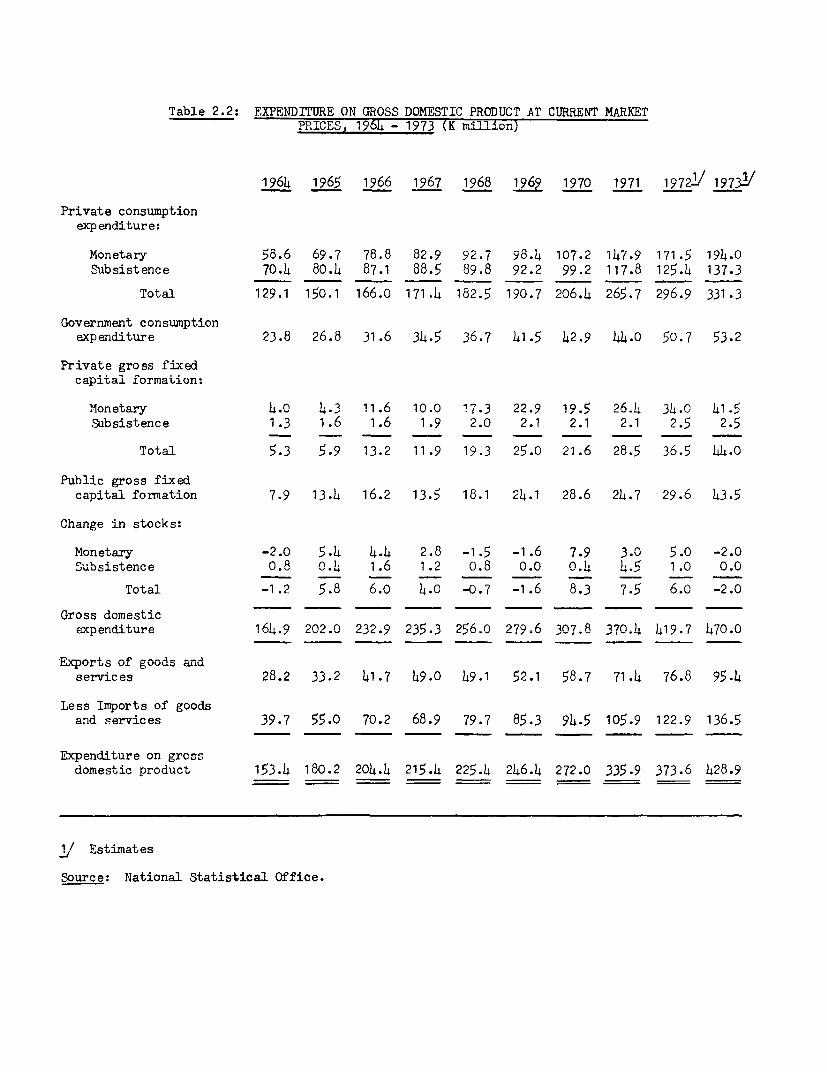
Table 2.2: EXPENDITURE ON GROSS DOMESTIC PRODUCT AT CURRENT MARKETFP. I C ES, 1 9 64 = 1973 (K mi" -I-'o5L..n)JA
1964 1965 1966 1967 1968 1969 1970 1971 19722/ 19731/
Private consumptionexp enditur e:
Monetary 58.6 69.7 78.8 82.9 92.7 98.4 107.2 147.9 171.5 194.0Subsistence 70.4 80.4 87.1 88.5 89.8 92.2 99.2 117.8 125.4 137.3
Total 129.1 150.1 166.0 171.4 182.5 190.7 206.4 265.7 296.9 331.3
Government consumptionexpenditure 23.8 26.8 31.6 34.5 36.7 41.5 42.9 44.0 50.7 53.2
Private gross fixedcapital formation:
Monetary 4.0 4.3 11.6 10.0 17.3 22.9 19.5 26.4 34.0 41 5Subsistence 1.3 1.6 1.6 1.9 2.0 2.1 2.1 2.1 2.5 2.5
Total 5.3 5.9 13.2 11.9 19.3 25.0 21.6 28.5 36.5 44.0
Public gross fixedcapital formation 7.9 13.4 16.2 13.5 18.1 24.1 28.6 24.7 29.6 43.5
Change in stocks:
Monetary -2.0 5.4 4.4 2.8 -1.5 -1.6 7.9 3.0 5.0 -2.0Subsistence 0.8 0.4 1.6 t1.9 0.8R 0.0 0o.1 00o
Total -1.2 5.8 6.o 4.0 -0.7 -1.6 8.3 7.5 6.0 -2.0
Gross domesticexpenditure 164.9202.0 232.9 235.3 256.0 279.6 307.8 370.4 419.7 47-0
Exports of goods andservices 28.2 33.2 41.7 49.0 49.1 52.1 58.7 71.4 76.8 95.4
Less Imports of goodsand services 39.7 55.0 70.2 68.9 79.7 85.3 94.5 105.9 122.9 136.5
EXpen,.J..Jt.ure on grossdomestic product 153.4 180.2 204.4 215.4 225.4 246.4 272.0 335.9 373.6 428.9
1i ES+n m ates
Source: National Statistical Office.
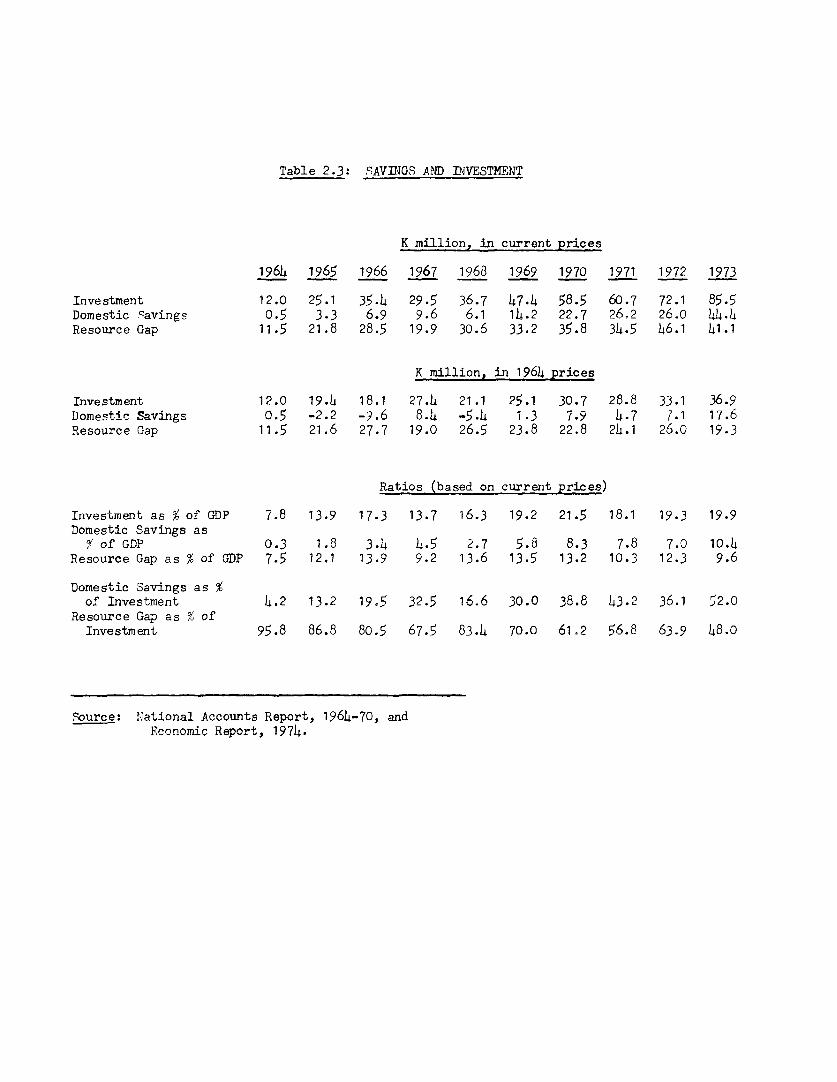
Table 2.3: SAVINGS AND INVESTMENT
K million, in current prices
1964 1965 1966 1967 1968 1969 1970 1971 1972 1973
Investment 12.0 25.1 35.4 29.5 36.7 47.4 58.5 60.7 72.1 85.5Domestic savings 0.5 3.3 6.9 9.6 6.1 14.2 22.7 26b2 26b0 44.4Resource Gap 11.5 21.8 28.5 19.9 30.6 33.2 35.8 34.5 46.1 41.1
K million, in 1964 prices
Investment 12.0 19.4 18.1 27.4 21.1 25.1 30.7 28.8 33.1 36.9nom-estic Savings 0.5 =2.2 -9.6 8.4 -5.4 1.3 7.9 4.7 7.1 17.6Resource Gap 11.5 21.6 27.7 19.0 26.5 23.8 22.8 24.1 26.0 19.3
Ratios (based on current prices)
Investment as % of GuDP 7.8 13.9 17.3 13.7 16.3 19.2 21.5 18.1 19.3 19.9Domestic Savings asZof GDP 0.3 1.8 3.4 4.5 2.7 5.8 8.3 7.8 7.0 10.4Resource Gap as % of GDP 7.5 12.1 13.9 9.2 13.6 13.5 13.2 10.3 12.3 9.6
Domestic Savings as %of Investment 4.2 13.2 19.5 32 5 16.6 30.0 38.8 143.2 36.1 52.0Resource Gap as , ofInvestment 95.8 86.8 80.5 67.5 83.4 70.0 61-2 56-8 63.9 148.0
cSource: National Accounts Report, 1964-70, andEconomic Report, 1974.
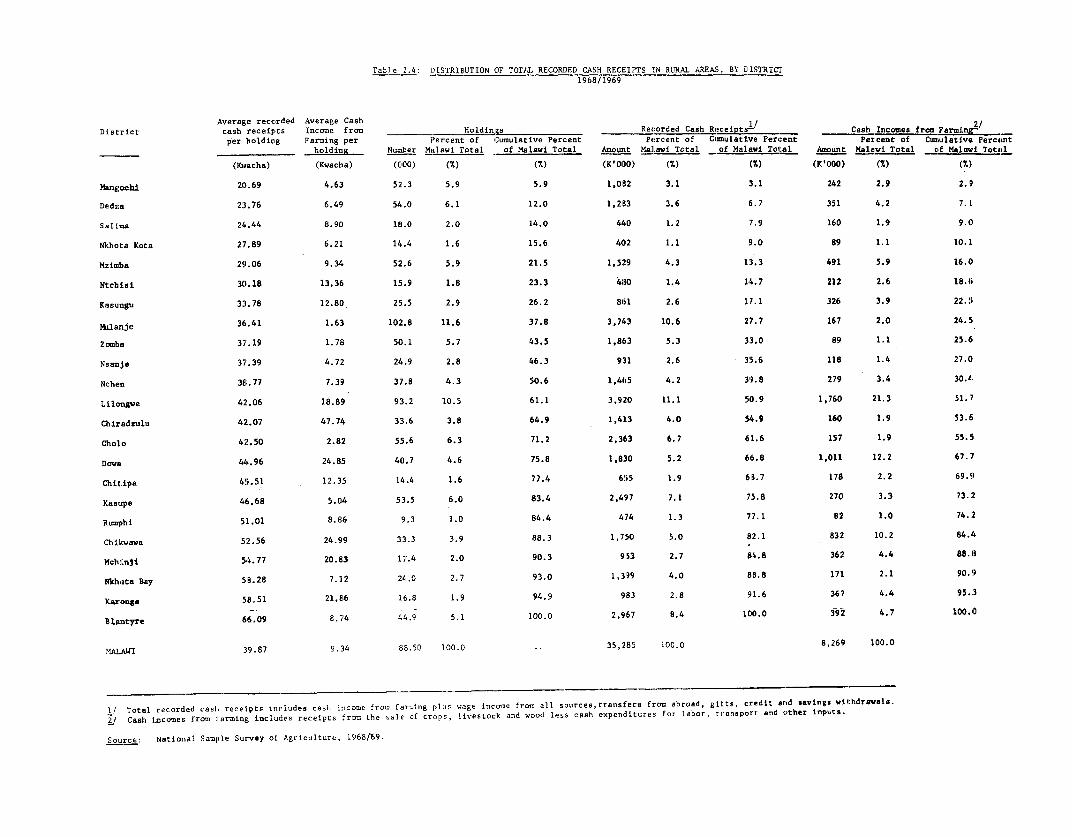
Tabl e 2.4: DISTRIEUTION OF TOTAL RECORDED CASH RECEIPTS EN RUITAI AREAS, BY DISTRIcr1968 /1969
Average reccorded Average CashDise:rict cash receipts Income from _ iHoldings 12 Re:orded Cash Receipt/- Cash Incomes from Farming
per holding Farming per P'ercent of Cumulative Percent Percent of Curmulative Percent Percent of Cumiulative Percentholding Number Mailawi Total of Malawi Total Amount Malawi Total of Malavi Total Amounit Malawi Total cif Malawi Total
(Kwiacha) (Kwacha) (000) (%) (7.) (K'WOOD) (%) (%) (K'OOO) (%) (%)
Mangochi 20.69 4.63 52.3 5.9 5.9 1,082 3.1 3.1 242 2.9 2.'9
Dedz:a 2:3.76 6.49 54.0 6.1 12.0 1,2133 3.6 6.7 351 4.2 7.1
Salima 24.44 8.90 18.0 2.0 14.0 4'40 1.2 7.9 160 1.9 9.0
Nkhcta Kota 27.89 6.21 14.4 1.6 15.6 402 1.1 9.0 89 1.1 10.1
Mziaba 29.06 9.34 52.6 5.9 21.5 1,529 4.3 13.3 491 5.9 16.0
Ntcbisi 30.18 13.36 15.9 1.8 23.3 410 1.4 14.7 212 2.6 18.6
Kasungu 33.78 12.80 25.5 2.9 26.2 861 2.6 17.1 326 3.9 22.5
MRiLanje 36.41 1.63 102.8 11.6 37.8 3,743 10.6 27.7 167 2.0 24.5'
Zomba 37.;19 1.78 50.1 5.7 43.5 1,863 5.3 33.0 89 1.1 25.6i
Nsanje 37.39 4.72 24.9 2.8 46.3 9:11 2.6 3:5.6 118 1.4 27.0
Nchen 3E.77 7.39 37.8 4.3 50.6 1.465 4.2 39.8 279 3.4 30.4
Lilongve 42.06 18.89 93.2 10.5 61.1 3,920 11.1 50.9 1,760 21.3 51.7
Chiradzulu 4!2.07 47.74 33.6 3.8 64.9 1,413 4.0 54.9 160 1.9 53.-6
Cholo 42.50 2.82 55.6 6.3 71.2 2,363 6.7 61.6 157 1.9 55.5
DowsV 44.96 24.85 40.7 4.6 75.8 1,8:10 5.2 66.8 1,011 12.2 67.7
Chitipa 45.51 12.35 14.4 1.6 77.4 655 1.9 68.7 178 2.2 69.9
Kasupe 46.68 5.04 53.5 6.0 83.4 2,4917 7.1 75.8 270 3.3 73.2
Rumrphi 5,.01 8.86 9.3 1.0 84.4 474 1.3 77.1 82 1.0 74.:2
Chikwawa 52.,56 24.99 321.3 3.9 88.3 1,7'50 5.0 82.1 832 10.2 84.4
Mchinjl 54.77 20.E83 17.4 2.0 90.3 953 2.7 64.8 362 4.4 88.18
Nkhata Bay 58.28 7.12 24.0 2.7 93.0 1,399 4.0 88.8 171 2.1 90.9
Kaxroga 58.51 21. 86 16.8 1.9 94.9 983 2.8 91.6 367 4.4 95.:3
Blarityre 65.09 8. 74 44. 9 5.1 100.0 2,9157 8.4 10D.0 39 4.7 100.0
MALAII 39.87 9.:1b 88.50 100.0 35,2B5 100.0 8,269 100.0
1/ Total recorded cash receipts iucludes cash ':ncome fro,;: faroing plus wage income from all sources,transfers from abroad, gifts, credit and savings withdrawals.g/ Cash incomes from iarming includes receipts fror ehe sale of crops, livestock and wopod less cash expenditures for labor, t-ansport and other inpots.
Source: National Sample Survey of Agriculture, 1968/69.
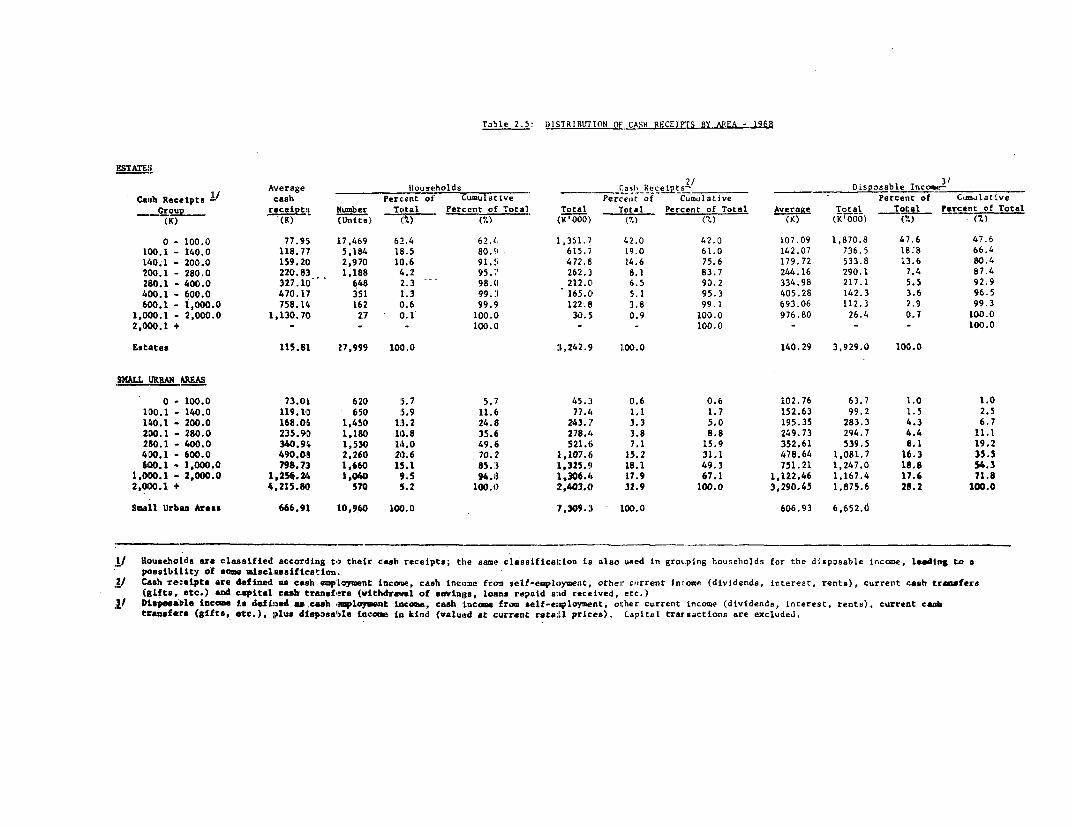
Table 2.51 DISTRIBUrION OF CASH !RECEIIS bY AREA -968
ESTATES
~~i;~ Receipts -- Avterage Households ___ ___ Cs Recets2~' : ____ ipsbe1cCaith Recottpts ] ceash Percent of umulatve Perceut of Cumulative Percentc of C,=Dulative
Groul? L receipt,, I 1uzber Total Percent of Total Total Total Percent of Total Average Total To:al Percelnt of Total
(K) (K) (Units) 1% () ( (V 000) (7) (M) (K) (K000) (v.) (%)
0 - 100.0 77.95 17,469 62.4 62.4 1,351.7 42.0 42.0 107.09 1,870.8 47.6 47.6
100.1 - 140.0 118.77 5,184 18.5 80.59 615.7 19.0 61.0 142.07 736.5 113:8 66.4
140. 1 - 200.0 159.20 2,970 10.6 91.5 472.6 14.6 75.6 179.72 533.8 13.6 80.4
200.1 - 280.0 220.83 1,188 lo.2 95.7 262.3i 8.1 83.7 244.16 290.1 7.4 87.4
210. - 400.0 327.10) 648 :2.3 98.( 212.Ci 6.5 93.2 334.98 217.1 5.5 92.9
400. 1 - 600.0 470.17 351 1.3 99.3 165.0 5.1 95.3 405.28 142.3 3.6 96.5
60)0.1 - 1,000.0 758. 14 162 0.6 99. 9 122;El 3.8 99.1 693.06 112.3 2.9 99.3
1,04D0.1 - 2,000.0 1,130.70 27 - 0.1 100.0 30.5 0.9 100.0 976.80 26.4 0D.7 100.0
2,000.1 + - - - 100.1 - - 100.0 - - - 100.0
Estates 115.81 27,999 100.0 1,242.9 100.0 140.29 3,929.0 100.0
SM}LL URAN AREAS
0 - 100.0 73.01 620 5.7 5.7 45.3 0.6 0.6 102.76 63.7 1.0 1.0
100.1 - 140.0 l19.101 650 3.9 11.6 77.4 1.1 1.7 152.63 99.2 1.5 2.5
1,40.1 - 200.0 168.0.6 1,450 13.2 24.13 24 3. 7 3.3 5.0 195.35 283.3 4.3 6.7
2D0.1 - 280.0 235.9D 1,180 10.8 35.15 278.4 3.8 8.8 249.73 294.7 4.4 11.1
280.1 - 400.0 340.94 1,530 14.0 49.6 521.6 7.1 15.9 352.61 539.5 8.1 19.2
400. 1 - 600.0 490.08 2,260 20.6 70. 2 I ,107.t6 15.2 31.1 478.64 1,081.7 16.3 35.5
G0DD. I - 1,000.0 798.73 1,660 1l.1 85.3 1,325.9 18.1 49.3 751.21 1,247.0 18.8 54.3
1,0D0.1 - 2,000.0 1,254.24 1,040 9.5 94.13 1,306.i 17.9 67.1 1,122.46 1,167.4 17.6 71.8
2,010.1 + 4,215.801 570 S.2 100.0 :2,403.0 32.9 100.0 3,290.45 1,875.6 28.2 100.0
Small Urban Areas 666.91 10,960 100.0 7,309.3 ]100.0 606.93 6,652.0
LI Households d rie clasasified according to their cash receipts; the same classificat:ion is also used in grouping households for the disposable income, 1eading to a
posstbility of s= misclasasification.2I Cssh Teceipts are defined as caesh employment incotte, casih income from self-employment, other currernt income (dividends, interest, rents), current cash trsfere
(gifts, etc.) end cepital crah transfiers (vwthdrfaal of sevinlgs, loans retpaid asd recoived, etc.)Ot D.p.eelble incoe Lis defined asecash ea1lorwnt Liscome, cash Income from self-emsployment, other cuLrrent income (dividends, interest, rents), current casb
treansfeirs (gifts, olte.), lplus disposable Inome ii kind (valued at current retalil prices). Capitesl transactions are excluded.
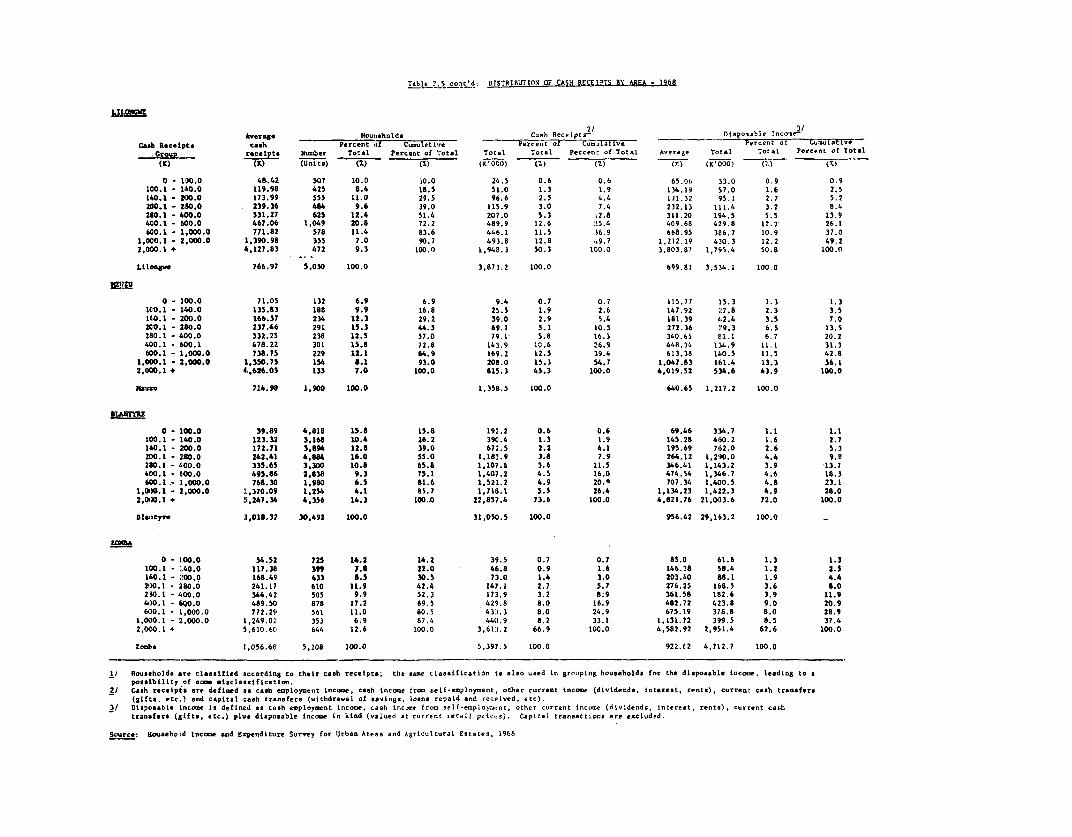
T able_?.5 co-td, DisrRIBUTIO OP CQASH RECEZI..jBY.AREA -.)Sik
"'i-
Average -Houoieholds Cash Rcleiprl D__spo-bl___ __-___
Cahreceps Toh ereta Percent ofTtl oa I.. Perentof ofMoToi1ve-l Total Toeta Perc.it of Tta
(K) (K) (Units) (. (7.) - (cOOl)5) (T7.) 7.) - I 100 1. (.
0 -"10.0 4&.42 507 10.0 10.0 24.5 0.6 0.6 65.06 33.0 0.9 0.9
1100, 140.0 119.98 425 8.4 18.5 51.0 1.3 1.9 134.1I1 57.0 1.6 2.5
140.1 -2130.0 173.99 555 11.0 29.5 96.6 2.5 4.4 Ifl. 32 95.1 2.7 5.2
200.1 - 2.0.0 239.56 484 9.6 39.0 115.9 3.0 7.4 232.1:1 111.4 3.2 8.4
280.1 - 400.0 331.27 625 12.4 51.4 207.0 5.3 :12.8 311.20 194.5 5.5 13.9
400.1 -1000.0 467.06 1.049 20.8 72.2 489.9 12.6 735.4 409.611 429.8 12.2 26.1
800.1 - 1,000.0 771.82 578 11.4 83.6 446.1 11.5 316.9 668.95 386.7 10.9 37.0
1,000.1 - 2,000.0 1,390.98 355 7.0 90.7 493.8 12.8 49.7 1.212. 19 430.3 12.2 49.2
2.000.1 + 4.127.83 472 9.5 100.0 1,94.8.3 50.3 100.0 3.803.87 1,715.4 50.8 100.0
Lilscegv 766.97 5,050 100.0 3.873.2 100.0 699.83 3,534.1 100 0
0 -100.0 71.05 132 6.9 6.9 9.1. 0.7 0.7 115.77 1.5.3 1.3 1.3
lCrO.L - 140.0 135.83 18e 9.9 16.8 25.5 1.9 2.6 147.92 27.8 2.3 3.5
14.0.1 - 200.0 166.57 234 12.3 29.2 39.0 2.9 5.4 181.39 42.4 3.5 7.0
2NO.1I - 280.0 237.46 291 13.3 44.5 69.1 5.1 10.5 272.36 719.3 6.5 13.5
2o.0.I - 400.0 332.25 23.8 12.5 57.0 79.1 5.8 16.3 340.65 El1. 1 6.7 20.2
400.1 - 600.1 478.22 301 15.8 72.8 143.9 10.6 26.9 448.31 1:14.9 11.1 31.3
6c0. 1 - 1,000.0 738.75 229 12.1 84.9 169.2 12.5 39.4 613.38 140.5 11.5 42.8
1,000.1I - 2,000.0 1,350.73 154 8.1 93.0 208.0 15.3 54.7 1.047.83 161.4 13.3 56.1
2,000. 1 4 4,626.03 133 7.0 100.0 615.3 45.3 100.0 4,019.52 534.6 63.9 100.0
NXU3s0 724.9 1,900 100.0 1,358.5 100.0 640.65 1.2:17.2 100.0
8LiRrTRz
0 -100.0 39.89 4,818 15.8 15.8 192.2 0.6 0.6 69.46 334.7 1.1 1.1
100.1 140.0 123.3.2 3.168 10.4 26.2 390.4 1.3 1.9 145.28 460.2 1.6 2.7
16-0.I 1 200.0 172.71 3.894 12.8 39.0 67:1. 5 2.2 4.1 195.69 762. 0 2.6 5.3
200.1 - 210.0 242.41 4.886 16.0 55.0 1.183.9 3.8 7.9 264.12 1,290.0 4.4 9.8
280. 1 - 400.0 333.63 3.300 10.8 63.8 1,107.6 3.6 11.5 346.41 1, 143. 2 3.9 -13.7
400. 1 - 600.0 495.86 2,838 9.3 75.1 1,407.2 4.5 16.0 474.54 1,3446.7 4.6 18.3
840.1.- 1,000.0 768.30 1.980 6.3 81.6 1,521.2 4.9 20.0 707.34 1,400.5 4.8 23.1
1000D.1 I 2,000.0 :1,370.09 1,234 4.1 80.7 1,7181.1 5.3 26.4 1,134.23 1,4:22.3 4.9 28.0
2,0010.1 + 5, 247. 34 4,356 14.3 100-0 22.8517.4 73.6 100.0 4,821.76 21,01)3.6 72.0 100.0
Biastyn 1,0181.32 30,692 100.0 31,0Mo.5 100.0 956.42 29,163.2 100.0 -
ZOIGA
0 -1,00.0 54.52 725 14.2 14.2 39l.5 0.7 0.7 85.0 61.6 1.3 1.3
1130.1 - 140.0 117.381 399 7.6 22.0 46. 8 0.9 1.6 146.38 38.4 1.2 2.5
1,40.1I - 200.0 168.49 433 6.5 30.5 7:1.0 1.4 3.0 203.40 88.1 1.9 6.4
200.1 -n28.0 241.17 610 11.9 42.4 147. 1 2.7 5.7 276.25 168.5 3.6 8.0
280. 1 - 400.0 344.42 505 9.9 52.~ 1 731.9 3.2 8.9 360.58 182.6 3.9 11.9
40)0.1 -h1d0.0 489.50 878 17.2 69.5 4291.8 8.0 16.9 482.72 423.8 9.0 20.9
400.1 -I1,000.0 772.251' 561 11.0 80.5 43:1.3 8.0 24.9 675.19 378.8 8.0 28.9
1.010.-1 -2 2,000. 0 1,249.02! 353 6.9 87.4 441. 9 8.2 33.1 1,131.72 399.5 8.5 37.4
2.0.20.1 + 1, 610.~60I 644 12.6 100.1 3,61:3.2 66.9 1,00.0 4,582.92 2,951.4 62.6 100.0
Zod6a 1,056.68: 3,208 100.0 5,397.5 100.0 922.62 4,712.7 100.0
1/ Rouseholds jare classified according to their casi, receipts; the son.e cIassification La also used in, gr-aplng households f,,r the diisposable inco., leading toa
possibility of oss misclasssficat io,n.2) Cash receipiEa are defined a. cashs employment incoss, csah incoqe frn e.1i-en,ploye.~t, other current Income (dividends, interest, rents). c.rrent cash transfers
(gifts, etc.) and capital cash trnasfers (uithdrawal of savings, loans repaid and rec,v.ld. etc).
3/ Disposable Lncon,e Is defined as c,iah employment Incom, cash inc-me Ics, nlf-epl.y?a-t. other c.rrent Incos,.e (dividends, tntere,,t, rents), current cas,h
transfers (gifts., etc.) plus disposable inc-m in kind (val.ed at c-rrent recall p,ic.s). CapItal transoct,.onm are excluded.
Sc.arce: Ho,aahoLd incane end Expenditure Survey for llrban Areas and Agricol1tural tstates. 1968
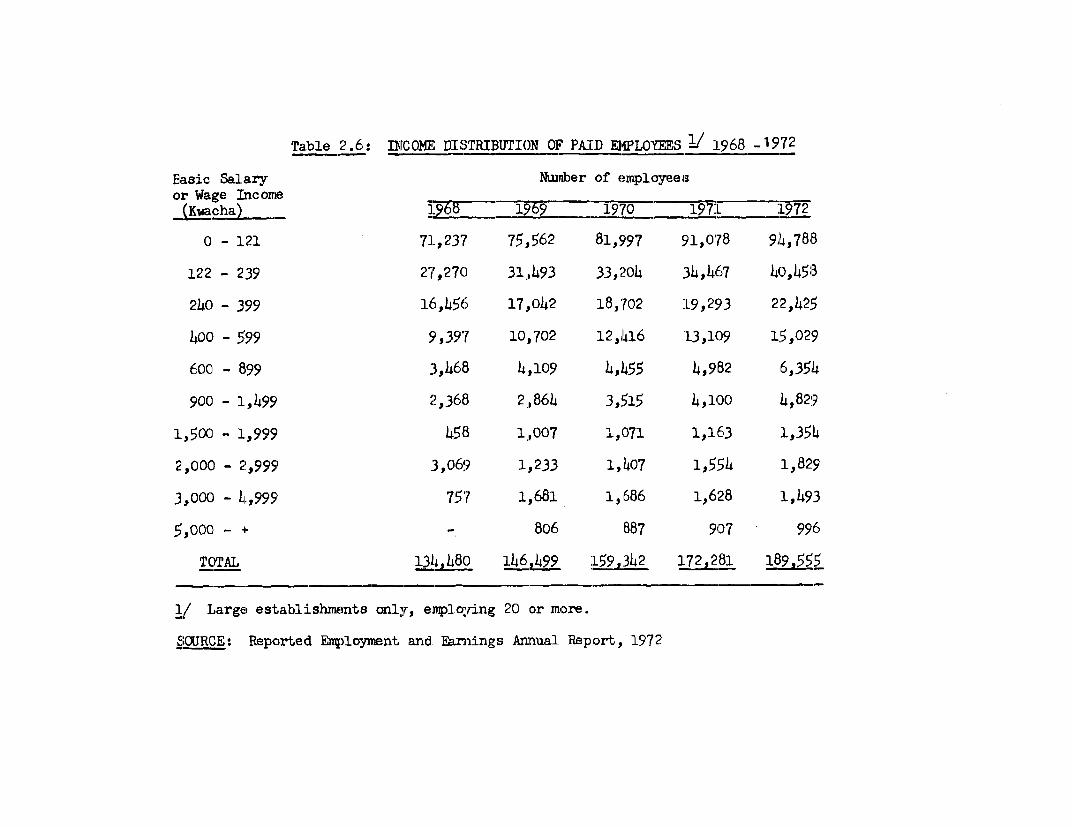
Table 2.6: MCOM1 DISTRIBUTI(N OF PAID EIPLOYMS 1 :L968 _1972
Basic Salary Nunber of employeesor Wage Income_J(KIacha) 19709
0 - 1.21 71 ,237 75 ,562 81,997 91,0'78 94,788
122 - 239 27',27() 31,493 33,204 34,1467 4o.,458
240 - 399 16,456 17,,042 18,'702 -9,29 3 22,425
40c0 - 599 9,397 10,702 12,416 :13,1409 15,029
60C0 - 899 3,468 4,109 4,455 4,982 6,354
go9 - 1,499s 2,368 2,864 3,1515 4,1010 4,82,9
1,500 - 1,999 4583 1,007 1,1371 1,163 1,354
2,000 - 2,999 3,069 1,233 1,407 1,554 1,829
3,000 - 4,999 757 1,681 11,686 1,628 1,493
5,000 - - 806 887 907 996
TOTAL 134,480) 1461499 159,342 172 281 189,555
1/ large establishments only, employ-ing 20 or more.
'LaJRCE: Reporte Etl)loynrent and. Earnings Annual Report, 1972
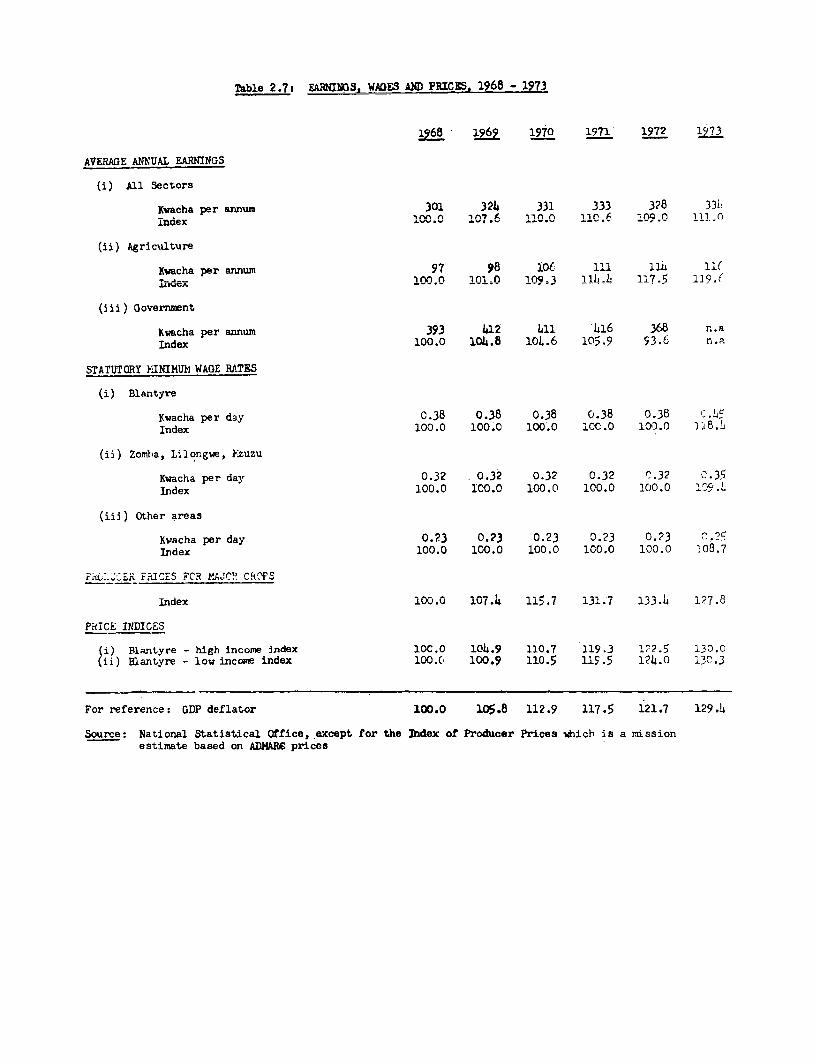
Table 2.73 EARNIS, 'WAES AND PRICES, 1968 -973
1968 1969 1970 1971 1972 1973
AVERAGE ANNUAL EARNINGS
(J) All qrt-trs
Kwacha per annum 301 324 331 333 328 331!
index 100.O 107.6 110.0 110.6 109.0 111-0
(ii) Agriculture
Kvacha per annum 97 98 106 111 11 11(index 100.O 101=0 109.3 i 11L4 117.5 119.(
(iii) Government
Kvacha per annum 393 412 4li u16 368 n.aIndex 100.0 10L.8 104.6 105.9 53.6 n.a.
STATUTORY KINIMUM WAGE RATES
(i) Blantyre
Kvacha per day C.38 0.38 0.38 0.38 0.38 C.145Index 100.0 100.0 100.0 C00.O 100.0 al8.L
(ii) Zombia, Lilongie, Mzuzu
Kwacha per day 0.32 0.32 0.32 0.32 C0.32 C..35
Index 100.0 IC0.0 100.0 100.0 100.0 '¢9.L
(iii) Other areas
Kwacha per day 0.23 0.23 0.23 0.23 0.23 .Index 100.0 100.0 100.0 100.0 100.0 108.7
r.i;.Wi F!.-RICES FCR KAJCP CROFS
index iOO.O 107.4 115.7 131.7 133.14 127.8
PRICE INTDICES
(i) Blantyre - high income index 10C.0 104.9 110.7 119.3 12,.5 130.0
(ii) can-tyzv - low .ncme ..d 4nd I'--t 100 .9... 11.. 1C
For reference: GDP deflator 100.0 105.8 112.9 117.5 121.7 129.14
Source: National Statistical Office, except for the Index of Produicer Prices i-hich is a missionestimate based on ADMAR6 prices

Table 3.1 fi'WOUTS BY END-USE, 1964 - 19731'K thousand)
196h4 1965 l196 1967 1968 1969 1970 1970 19(1 1972 197w'r . D, b ('. i. Goods mainly for Iirnal
consw,lption a
Motor cars nuidbicycles 1,24824 1,968 2,128 2,236 2,0248 2,(5f 2,519 3,0512 ?,Yy) ,'?; 3,38'Iiece good; 3,922 6,498 5,318 4,l430 3,996 3,770 3,046 3,506 3,906 2,1(4 5,16rMolnier s!idir 562 534 578 682 900 942 986 1,892 2,283 2,606 2,91t)
Otilr 7,958 11,452 12,514 12,754 12,626 12,002 13,063 14,545 15,497 Ie, 103 20,11,0
Total 13,926 20,452 20,538 20,102 19,570 18,770 19,614 22,997 24,200 ,7,111 31,6iO6
Capitn) equipment:
'v:l. ort. iquip[m tnt.'.e. 2,1724 2,636 14,970 4,986 7,02)4 1,384 8,107 8,923 9,6Pr
5 12, ' ,28
Other 2,006 3,526 6,914 4,968 8,768 7,978 9,014 Ma 07 10,37. 1 1243(
Total 4,180 6,16? 11,894 9.9524 151792 15,362 17;121 18j730 20,07; 26, h 241,7 6
Ml4terialfi for building,rov,sl.ruction 1,808 2,746 3,242 3,4h 6
4,334 5,99ss 5,078 6,128 7,h2j 3 1,'4c 9,72.
Othe -oods mainly fori.r,.mcd i _consumption:
Pr) roleum productsr.i.e. 1,038 1,070 1,426 1,546 2,158 2,332 2,617 !.,479 5,325 5,792 6,940
I r .: tools anid misc-eŽl]aneoun applicances 550 7924 1,106 1,258 1,6224 1,8ho 2,854 3,365 I,,osc 3,068 3,$i55
Other 6,688 8,942 14.L87$ 13,362 13,392 15,782 22,703 25,316 27,037 L 35,630
70tao 8,276 10,806 17,2406 16,166 17,172 19,954 28,174 33,160 36,402 37,h24? b6,022'
___I _ !;50 638 1,036 1,124 1,318 1,396 1,380 1,2465 1,371 1,2,1 1,142
Totr'a,l .s f.o.b. ?Iij6s l40,80$J 54,292 50,852 5!8,1 80 61,1.78 711,367
c.i.f. adjustment 3,637 5,182 67,95 ZIT 798 7.808 11.113Total imports, c.i.f. 32,277 45,986 61,187 57,310 65,569 69,286 82.48o 82,0480 89,750 102,994 113,2('?
j 19)6,-70 valued at f.o.b., 1970-73 at c.i.f. prices.i roviniona].
;oirrce: DINatiorial ^tatistical Office.
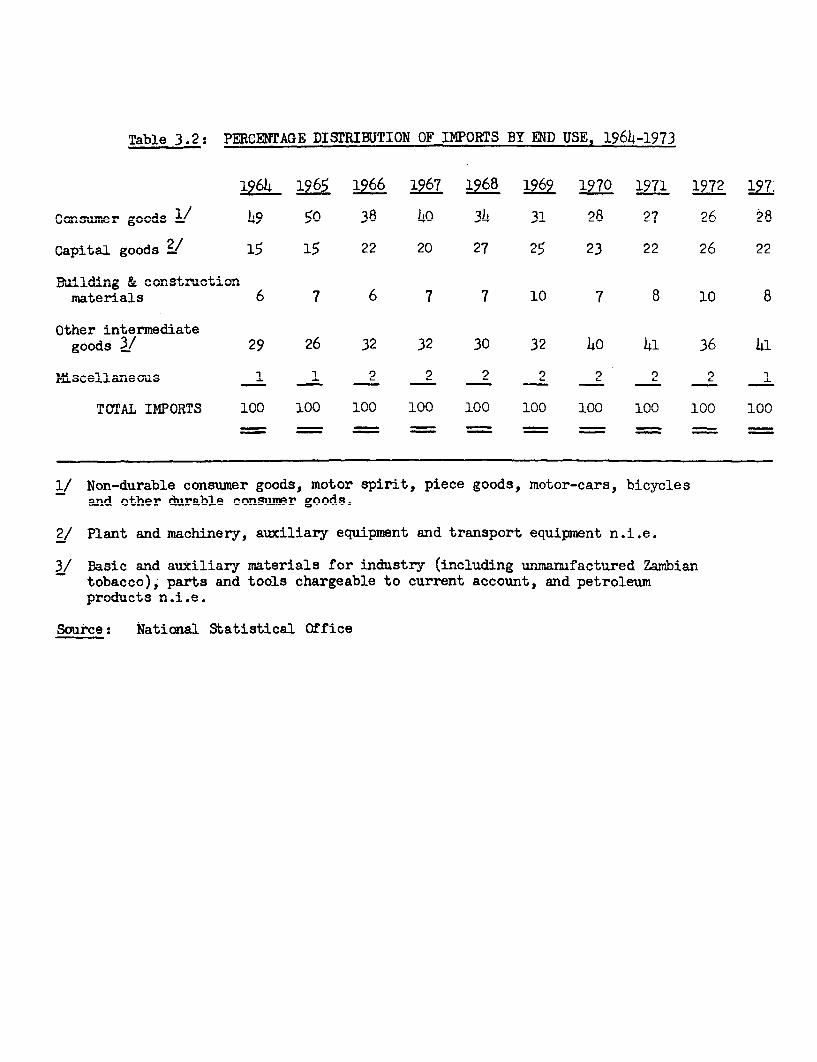
Table 3.2: PERCENTAGE DISTRIBUTION OF IMPORTS BY END USE, 1964-1973
1964 IA I 1 (hh A IQ7 18R I9Q6 1Q70 1Q71 1 Q79 107'
CnOnvrr goods 1.49 50 38 40 34. 31 28 27 26 28
l goods2/ , I< 99 9n 97 2< 23 22 26 22
naterials 6 7 6 7 7 10 7 8 10 8
Other intermediategood 3/ 29 26 32 32 30 32 O 41 36 h
)ftscellaneous I 1 2 2 2 o 2 2 2 1
fOfVWAT TUDAWq1C 100 100 100 100 100 100 1nn 100 - 100 100
1/ Non-durable consumer goods, motor spirit, piece goods, motor-cars, bicyclesand~ ot+her ^riabhe conn-imr goOdS4
2,/ Plant an.d .imachinery, au_xiliary euninpment and tran-port eqnuipm.ent n. 4.e
3 4/ Dsi ar.d a 1l4arwr ,n+als fr%v. inAdi c+.-mr (4 .1 inA v r,,ion4+v4rd 7
9lS
tobacco), parts and tools chargeable to current account, and petroleumn'nAA n+ Q n 4 AiJ vV.. | U~ S*. *.
a,.... T.4- U,aiv^ Q4 a+is+viol (W4'4 na
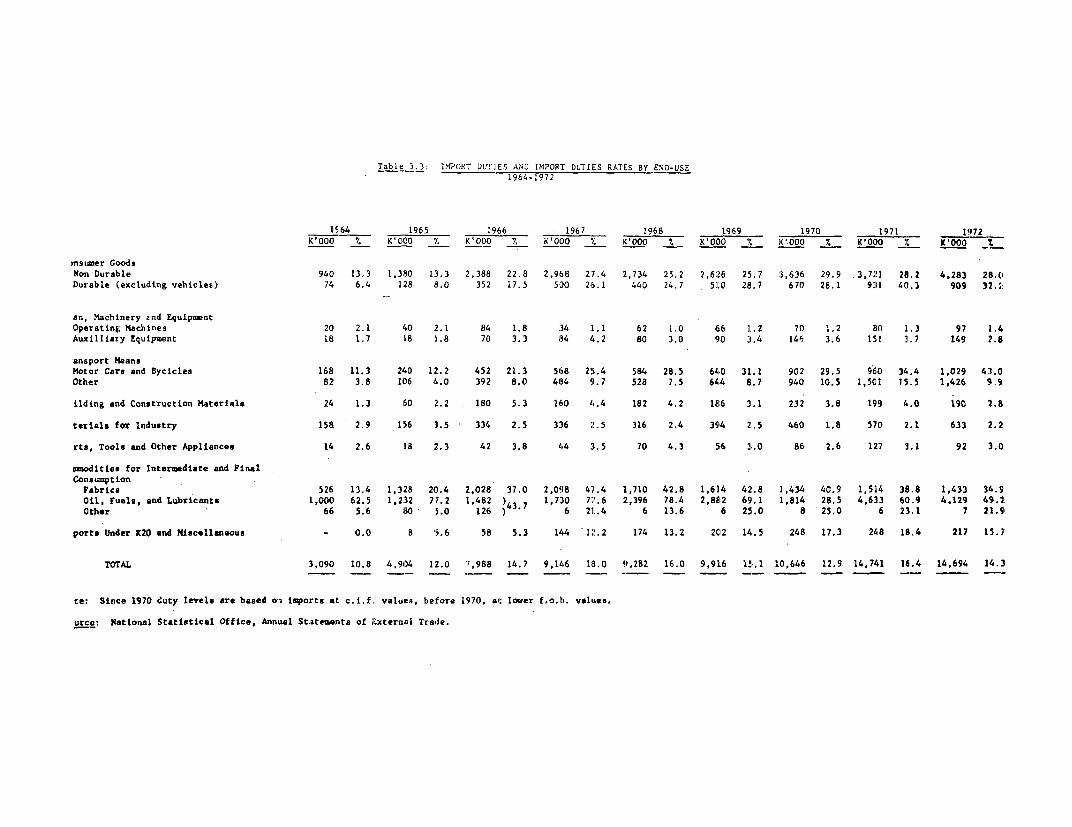
Table 3.3: IMPOI`- DULT.ES AsND IMPO8T DUTIES RATES BY END-USE
19164 1965 1966 - 1967 196g8 1969 1970 1971 1972K'000 7. KICO % KOO0 7 KIOO - I(000 */ 1'000 % K 1 000 K 7. 3(,o ,_ K'ooo
,nsumer GoodsNon Durable 940 13.3 1,380 13.3 2,388 22.8 2,968 27.4 2,734 25. 2 2,626 25.7 :3,636 29.9 3,721 28.2 4,283 28.0Durable (excluding vehicles) 74 6.4 128 8.0 352 17.5 5S0 26.1 440 24.7 510 28.7 670 28.1 931 4tl.3 909 32. 2
an, Machinery and EquipmentOperating Machines 20 2.1 40 2.1 84 1.8 34 1.1 62 1. 0 66 1.2 70 1.2 80 1. 3 97 1.4Auailliary Equtpment 18 1.7 18 1.8 70 3.3 184 4.2 80 3.0 90 3. 4 146 3,6 151 3.7 149 2.8
ansport MleansMotor Care and Bycicles 168 11.3 240 12.2 452 21.3 568 25.4 5S4 28.5 640 31.1 902 29.5 960 34.4 1,029 43.0Other 82 3.8 126 4.0 392 8.0 484 9.7 52a 7.5 644 8.7 940 10.5 1,501 15.5 1,426 9.9
ilding and Construction Materials 24 1.3 60 2.2 180 5.3 160 4.4 182 4.2 186 3.1 232 3.8 199 4.0 i90 2.8
terials faT Industry 158 2.9 156 3.5 334 2.5 336 2.5 316 2.4 394 2.5 460 1.8 570 2.1 633 2.2rts, Tools and Other Appliances 14 2.6 18 2.3 42 3.8 44 3.5 70 4.3 56 31.0 86 2.6 127 3.1 92 3.0
modities for Intermediate and FinalConsumption
Fabrics 526 13.4 1,328 20.4 2,028 37.0 2,098 47.4 1,710 42.8 1,614 42.8 1,434 40.9 1,514 38.8 1,433 34.9Oil, Fuels, and Lubricants 1,000 62.5 1,232 77.2 1,482 )43 7 1,730 77.6 :1,396 78.4 2,882 69.1 1,814 28,5 4,633 60.9 4,129 49.2Other 66 5.6 S0 5.0 126 ) 6 21.4 6 13.6 6 25.0 8 25,0 6 23.1 7 21.9
ports tinder I20 and Miscellaneous - 0.0 a 5.'6 58 5.3 144 12.2 174 13.2 202 14.5 248 17.3 248 18.4 217 15.7'
TOTAL 3,090 10.8 4,904 12.0 7,988 14.7 9,146 t8.0 9,282 16.0 9,916 15i,1 10,646 12,9 14,741 16.4 14,694 14.31
te: Since 1970 duty levels are based on imports at c.i.f, valuies, before 1970, at: lower f,o.b. valuies.
urce: National Statistical Office, Annu al Statements of External Trade.
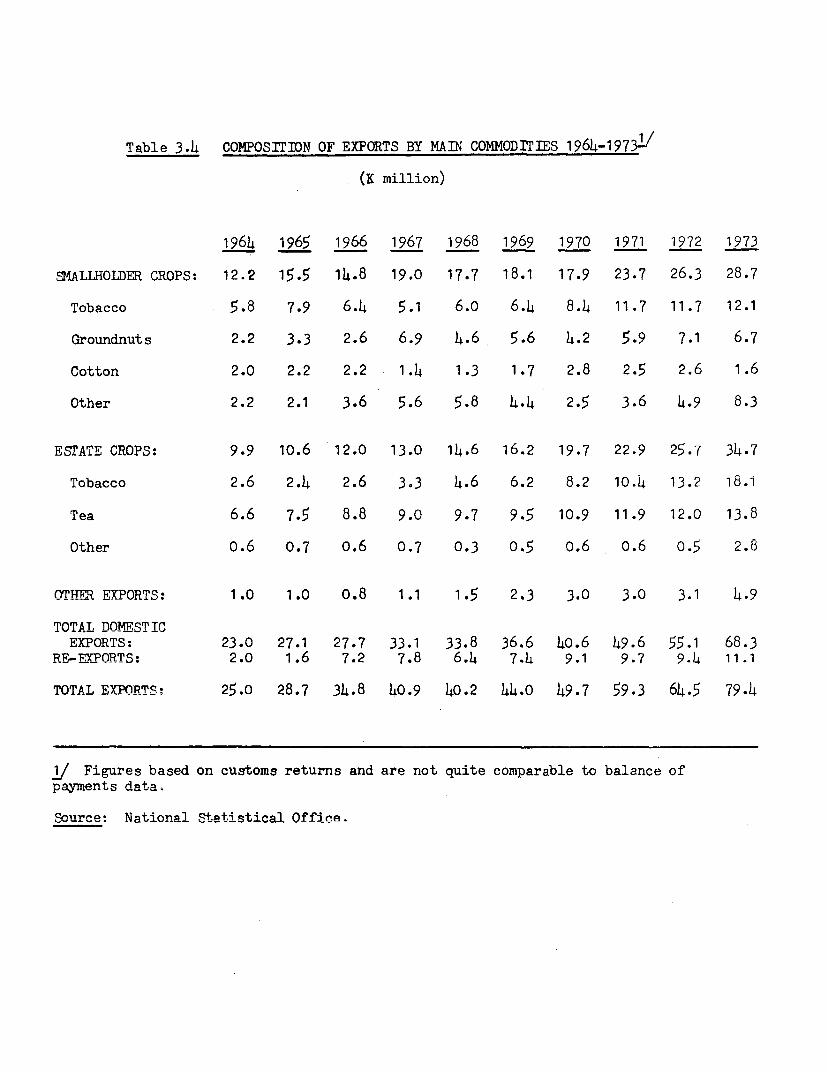
Table 3.4 COMPOSITION OF EXPORTS BY MAIN COMMODITIES 1964-1973 '
(K million)
1964 1965 1966 1967 1968 1969 1970 1971 1972 1973
SMALLHOLDER CROPS: 12.2 15.5 14.8 19.0 17.7 18.1 17.9 23.7 26.3 28.7
Tobacco 5.8 7.9 6.4 5.1 6.0 6.4 8.4 11.7 11.7 12.1
Groundnuts 2.2 3.3 2.6 6.9 4.6 5.6 4.2 5.9 7.1 6.7
Cotton 2.0 2.2 2.2 1.4 1.3 1.7 2.8 2.5 2.6 1.6
Other 2.2 2.1 3.6 5.6 5.8 4.4 2.5 3.6 4.9 8.3
ESTATE CROPS: 9.9 10.6 12.0 13.0 14.6 16.2 19.7 22.9 25.7 34.7
Tobacco 2.6 2.4 2.6 3.3 4.6 6.2 8.2 10.4 13.2 18.1
Tea 6.6 7.5 8.8 9.0 9.7 9.5 10.9 11.9 12.0 13.8
Other 0.6 0.7 o.6 0.7 0.3 0.5 0.6 0.6 0.5 2.8
OTHER EXPORTS: 1.0 1.0 0.8 1.1 1.5 2.3 3.0 3.0 3.1 4.9
TOTAL DOMESTTCEXPORTS: 23.0 27.1 27.7 33.1 33.8 36.6 40.6 49.6 55.1 68.3
RF^E-PORTS: 2.0 1.6 7.2 7.8 6.4 7.4 9.1 9.7 9.4 11.1
TOTATL EXPORTS: 25.0 28.7 3h.8 40.9 40.2 44.0 49.7 59.3 64.5 79.4
j Figures based on customs returns and are not quite comparable to balance of
payments data.
S1oure Nati;naol SEo;tat;s^n1 Office.
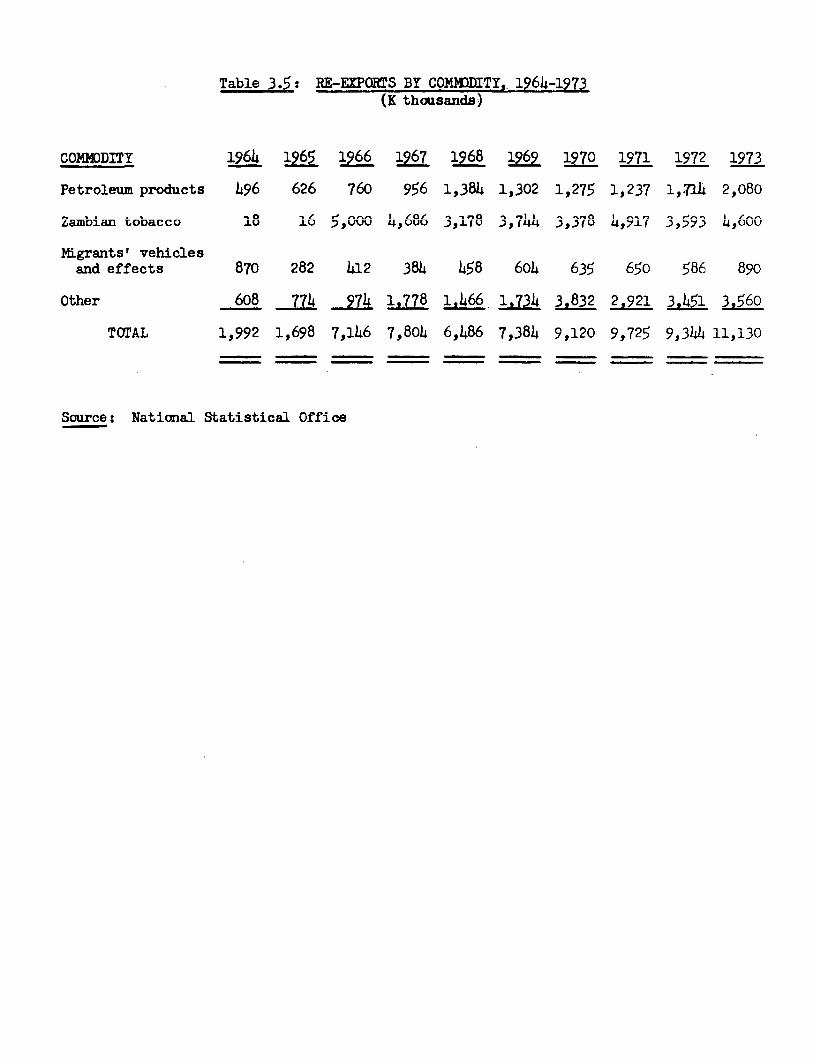
Table 3.5s RE-EXPORTS BY COMmpDiTY,. 1964-1973(K thousands)
COnrDl- 17u 1Z6 19u.17 -7u et6 190 -19n ' r1^ ^71 e 197 1973IAJIWJJU±J1 .~~~~L,7v4 J L7U .L7U I L7v _LV L7 ~fU %j L1 !L JLj ±ff)_
Petroleum proucets 496 626 760 956 -iOI -1,8 413 1,275 _,37 l 4 2,080
- - - - - ~~~ ~~~~0 -_ Z n U tOt , ,no ~1 .OIn,r '- aZamDian toDacco i0 i0 5VVU 4,6U8 3,i78 3,744 3,38 4,9i7 3,9)Y) 4,0UU
rngrants venle8Lesand effects 870 282 412 384 458 604 635 650 586 890
Other 608 774 974 1,778 1,466 1,734 3,832 2,921 3,451 3.560
TOTAL 1,992 1,698 7,1146 7,804 6,1486 7,384 9,120 9,725 9,344 11,130
Source: National Statistical Office
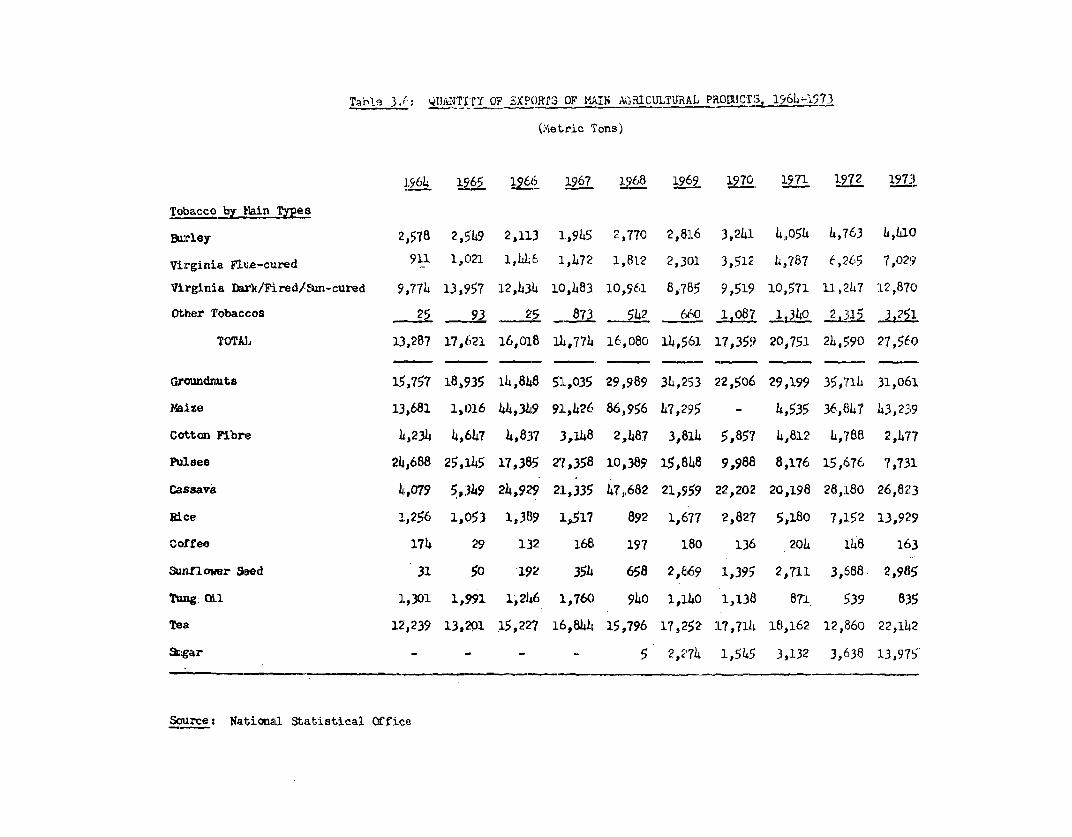
Tabls 3.rJ: QusTWTTY OF ExPORr3 OF MA-N AGRICULTURAL PROIXICT- 19641573
(Aetric Tons)
1964 1965 1966 1967 1968 1969 1970, 1971 13972 1i7
Tobacco by_ lSin 1>pe
Bwrley 2,578 2,hq9 2,113 1,945 2,770 2,81.6 3,241 4,054 4,763 h,4L10
Virginia FluLe-cured 911 1,021 1, U46k 1,072 1,812 2,301 3,512 L,787 6,265 7,029
Virginia Dar/Fired/DEn-cured 9,774 13,5'57 12,.3.4 10,483 10,961 8,785 9;5159 10,571 11,2h47 L2,870
Other Tobaccos -25 93 25_ 873 542 660 _10 8 1,340 2 1115 3,251
TOTAL 13,287 17,621 16,018 11,774 16,080 14,561 17,35'9 20,751 2L,590 27,560
Greundmuts 15,757 18,935 14,848 51,035 29,989 34,253 22,506 29,199 35,71h 31,061
8ize 13,681 1,016 44,349 91,426 86,956 47,295 - 4,535 36,847 43,2339
Cottcn Fibre 4,234 4,1547 4,837 3,148 2,487 3,814 5,857 4,812 4,788 2,A77
Pulses 24,688 25,:L145 17,385 27,358 10,389 15,848 9,988 8,176 15,676 7,731
CaSSaval 4,079 5,349 24,929 21,335 47,682 21,959 22,202 2G,198 28,:L80 26,823
Rice 1,256 1,053 1,389 1,517 892 1,677 2,827 5,180 7,152 13,929
Coffee 174 29 1:32 168 197 1.80 136 204 148 163
Sunflower S,ed 31 50 1i92 354 658 2,869 1,395 2,711 3,6688 2,985
Tung ULl 1L,301 1,991 1,2146 1,76( 940 1i,14o 1,138 871 539 8:35
Teia 112,239 13,201 15,227 16,844i 15,796 17,252 L7,71i 18,162 12,860 22,1142
91gar - - - -5 2,274 1,545 3,132 3,638 13,975
Source: Nationa1 Statistical Office
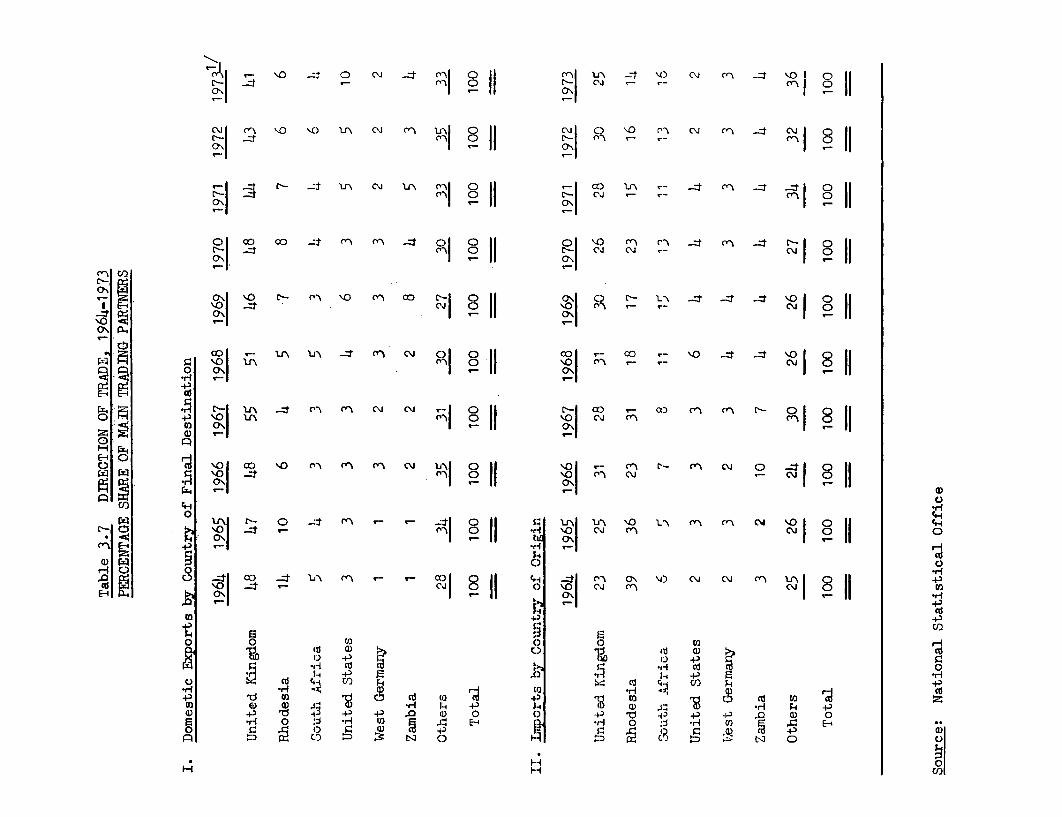
Is -xCa _! ~~~~C) oi _:t 'N )1 Yz o _ t cd .¢> \0 CQ m Zir.0 -4 C) C") c"1 ° 11 r'-l C\J *-- *C- - |\ C) ||r ' 0 4 '0 c'J u loll
c\1 a> ar_ v o" ,-% ()l C)1 z ) f"' \ C'> -: . -Z_t (N c to~~~~~ ~ ~~~ ~ -- Il O. I> . ,
-- In
r | ~ ~ ~ C\ C'\ ' '.0~ '.0 U\ C') (a\ tr- C) IIt| e2 - vo _t _ 4 s
lj-\ oi U.\ ("I o ~C) 0 r' c.i '- .
>3~~~- -4 ,-.J ,; II II_ ' ) 3| 3 *a D- J°|8|
ffi ~ ~ ~ - . 1 iias , N
4 C " ' t \ ( §C" , _ C , _
;D~ ~ ~ c cC) .'4 (') C"' "'" 4 C)E C) fl O31 '. "o r-~ . cxJ -4 I.- o 0
lEi ~ ~ . V.) r--- °\ ,_--I 1
r- c o usl r- o- : t > v *- t| c3 || g a| 5 <9 18°J 1 || tONC /) I. F C $) .- n l
Cy'C . 1 -t ,, 1 A '.0 C-- -~ ~ a ) C 3-- ON tQt C'4 tC to .C'4 C'4 .4 '0 a 8 cl
'.0t ). '-. F- ON . -E.l qM SC,'.4 s3 s W:cL.th3 < n r
o 0'. ~~~~~~~~~~~~~~~~~~~~~~~~~~~~~~~~ON O II
op'- 1\o .4 n \o (. C4- 4-
'. . .-- CO Fl- Uc\ cT -z C-. g
Ca 0' ^<!ds4t- n^-gr8.s, On4
.; ti; 0 Rj o
r0 \ (- 0 \ F E\
E-' 0 rI I~~C- f\ -j, C-\ f ci CQDr ~ c a:) CD~C) CIT w . O . \ 4
)C' V\ 0 %.4 '.
:2-. ~ ~ o' I di N0
E Cl) 4.4Al 4-in i u\ r CjC-- C) -~~~~ ~~' '-- '-- 41 C) fl ~~~~~~ 'ir'~~3 '0 tr r\ c ( .1 114.
pq rii 9. NO 4 ' 0~i * . '. ~C'
H o o C)~~~~~~~~~~~~~~~~~~~~~~~~~~~4\ -ON C'JI CI ' Ci NCD~~~~~~~C
5-4~~~~~~~~~~~~~~~~~~~~~~~~~~~~~~$4c(1C)0 "l C0 C.)a
r-i C) C) 1) '
-P~~~~~~~~~~~~~~~~~~)-
13) 13) *0 0 0r ~ . - rI i -I~ 2 S .
~~2 ~ fl, U)- 4- 4. J3 C C C)- 4U) .1: .- N1 0) C
H H~~~~~~~~~~~~~~~~~~~~~~~~~~~~~~~~~~~~~~~~ C/) ) E-
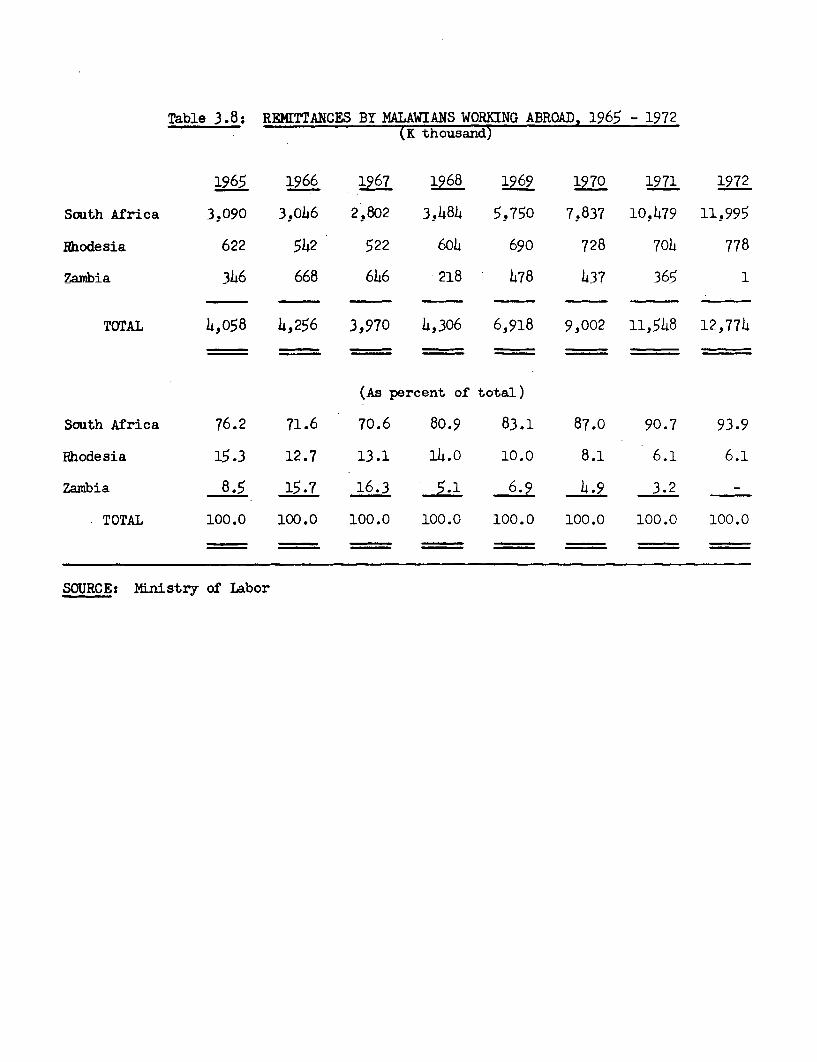
Table 3.8: REMITTANCES BY MALAWIANS WORKING ABROAD, 1965 - 1972(K thousand)
1965 1966 1967 1968 1969 1970 1971 1972
South Africa 3.090 3,.o46 2,802 3,484 5,750 7,837 10,479 11,995
Rhodesia 622 542 522 604 690 728 704 778
Zambia 346 668 646 -218 478 437 365 1
TOTAL 4,058 4,256 3,970 4,306 6,918 9,002 11,548 12,774
(As percent of total)
South Africa 76.2 71.6 70.6 80.9 83.1 87.0 90.7 93.9
Rhodesia 15.3 12.7 13.1 14.0 10.0 8.1 6.1 6.1
Zambia 8.5 15.7 16.3 5.1 6.9 4.9 3.2 _
TOTAL 100.0 100.0 100.0 100.0 100.0 100.0 100.0 100.0
SOURCE: Ministry of Labor
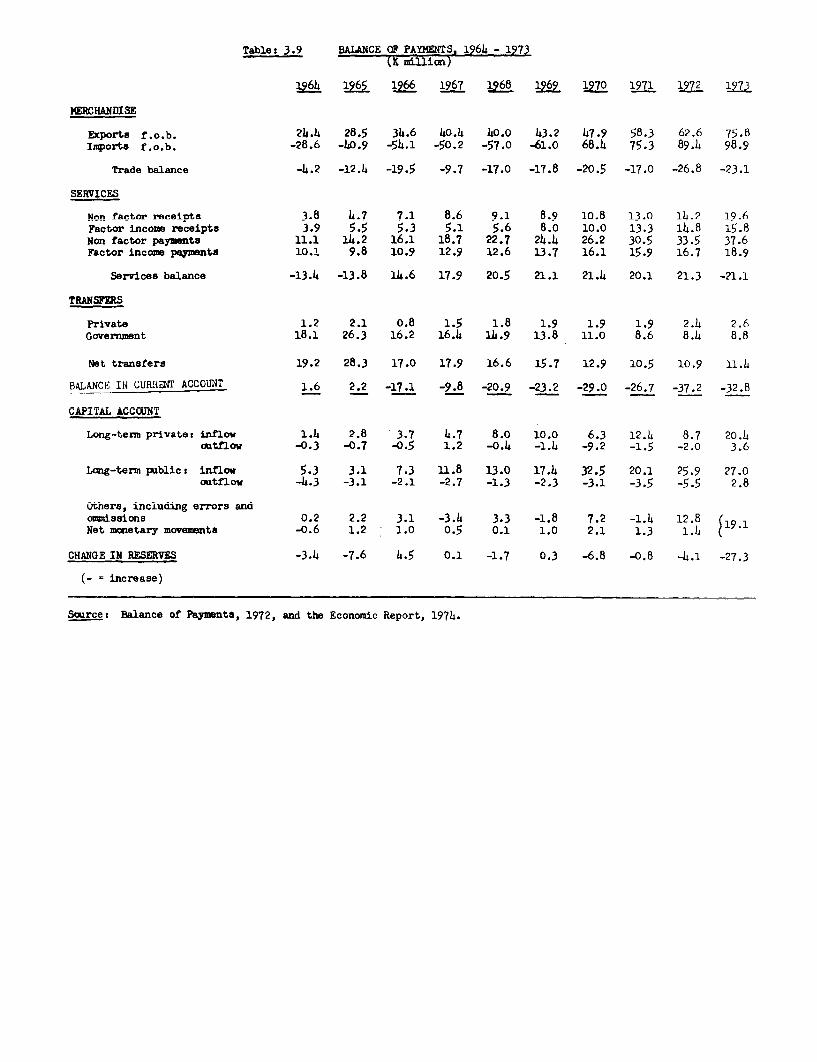
Table: 3.9 BALANCE oF PAYMENTS. 1964 - 1973I ,
1964 1965 1966 1967 1968 1969 1970 1971 1972 1973
MERCHANDISE
Exports r.o.b. 24.4 28.5 34.6 40.4 40.0 43.2 47.9 58.3 62.6 75.8Imports f.o.b. -28.6 -40.9 -54.1 -50.2 -57.0 -61.0 68.4 75.3 89.4 98.9
Trade balance -4.2 -12.4 -19.5 -9.7 -17.0 -17.8 -20.5 -17.0 -26.8 -23.1
SERVICES
Non faG,tor reoipts 3.8 4.7 7.1 8.6 9.1 8.9 10.8 13.0 lh.2 19.6Factor income receipts 3.9 5.5 5.3 5.1 5.6 8.o 10.0 13.3 14.8 15.8
Non factor payments 11.1 14.2 16.1 18.7 22.7 24.4 26.2 30.5 33.5 37.6Factor income payments 10.L 9. 10.9 12.9 12.6 'v .7 16.1 5.9 i6.7 i8.
Services balance -13.4 -13.8 14.6 17.9 20.5 21.1 21.4 20.1 21.3 -21.1
TRANSPERS
Private 1.2 2.1 0.8 1.5 1.8 1.9 1.9 1.9 2.4 2.6Government 18.1 26.3 16.2 16.4 14.9 13.8 11.0 8.6 8.4 8.8
Net transfers 19.2 28.3 17.0 17.9 16.6 15.7 12.9 10.5 10.9 11.4
BALANCE IN CUQRENT ACCOUNT 1.6 2.2 -17.1 -9.8 -20.9 -23.2 -29.0 -26.7 -37.2 -32.8
CrAPIAL ACCCUJIT
Long-term private: inflow 1.4 2.8 3.7 4.7 8.0 10.0 6.3 12.4 8.7 20.4ontflow -0.3 -0.7 -0.5 1.2 -0.4 -1.4 -9.2 -1.5 -2.0 3.6
Tr,--tevm w|blic2 4 n v 5.3 3.1 7.3 'L.A 13.0 17.4 325 2. I 0 27 .0
outflow -4.3 -3.1 -2.1 -2.7 -1.3 -2.3 -3.1 -3.5 -5.5 2.8
others, including errors andommissions 0.2 2.2 3.1 -3.4 3.3 -1.8 7.2 -1.4 12.8 (19.1Net monetary movements -o.6 1.2 1.0 0.5 0.1 1.0 2.1 1.3 1.1 !
CHANGE IN RESERVES -3.4 -7.6 4.5 0.1 -1.7 0.3 -6.8 -o.8 -4.1 -27.3
= increase)
Sourcet Balance of Payments, 1972, and the Economic Report, 1974.
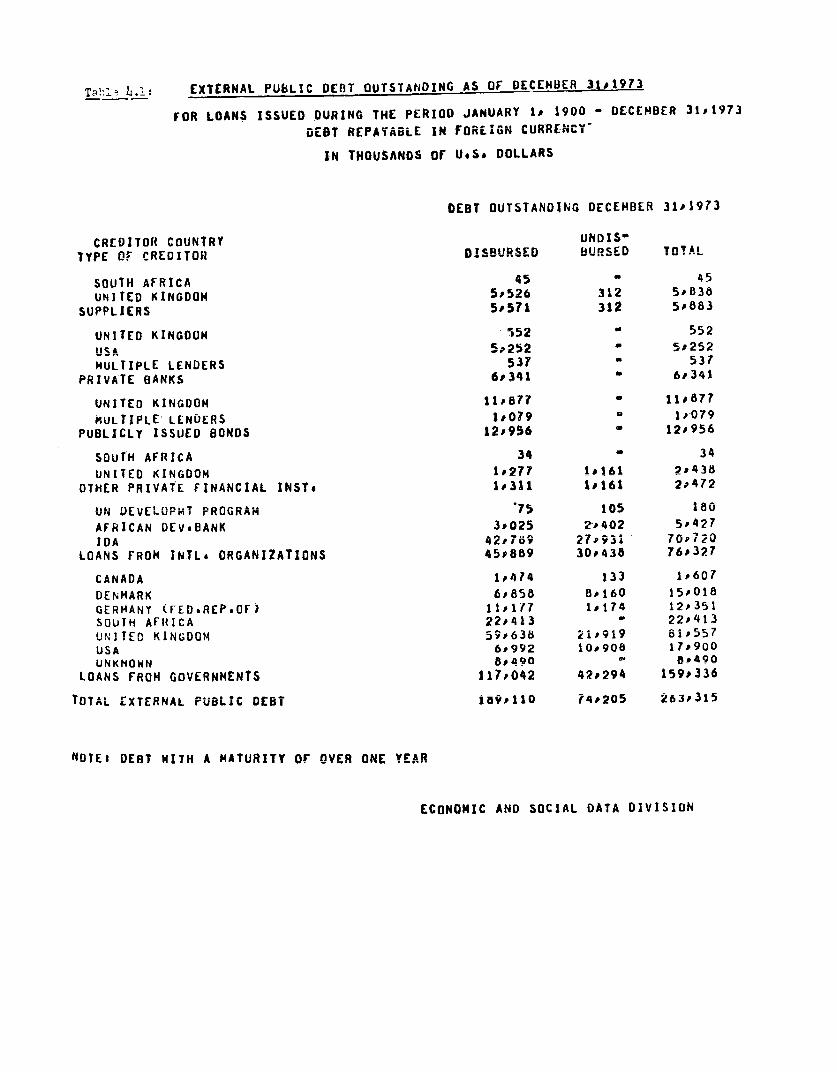
Ta':' L.I: EXTERNAL PUbLIC DEBT OUTSTANIDING AS Of DECEHUER 31,1973
FOR LOANS ISSUED DURING THE PERIOD JANUARY 1* 1900 - DECEMBER 31,I973DEBT REIAABLE iN FOREIGN CURRENCY
IN THOUSANDS Of U.S. DOLLARS
DEBT OUTSTANDING DECEMBER 31,1973
CREDITOR COUNTRY UNDiS"TYPE OF CREDITOR DISBURSED BURSED TOTAL
SOUTH AFRICA 45 - 45UNITED KINGDOM 5#526 312 5,838
SUPPLIERS 5P571 312 5o883
UNITED KINGDOM 552 552USA 51MULTIPLE LENDERS 537 537
PRIVATE BANKS 6,341 6,341
UNITED KINGDOM il877 - 1l877MULTIPLE LENDERS 100?9 1079
PUBLICLY ISSUEO BONDS 12P956 a 12,956
SOUTH AFRICA 34 34UNITED KINGDOM 1,277 11al 29438
OTHER PRIVATE FINANCIAL INST. 1,311 1,161 2,472
UNDEVELUPMT PROGRAM '75 i05 i80AFRICAN DEVeBANK 3,025 2,402 5,427IDA 42P769 27,931 70,720
LOANS FROM INTL. ORGANIZATIONS 45o889 300438 76,327
CANADA 1,474 133 1,607DENMARK 6,658 8J160 15,018GERMANY (FED*REPsOF) IZ117 1J174 12,351SOUTH AFRICA 22,413 * 22,413UNITEO KINGDOH 59,63n 2i'9 9 81557USA 6j 992 10, 908 17,900UNKNOWN 8,490 8,490
LOANS FROM GOVERNMENTS 117,042 42,294 159,336
TnflL IXTERNAL PUBLIC DEBT i89,1iO 740205 263,315
NOTEI DEBT WITH A MATURITY OV OVER ONE YEAR
ECONOMIC AND SOCIAL DATA DIVISION
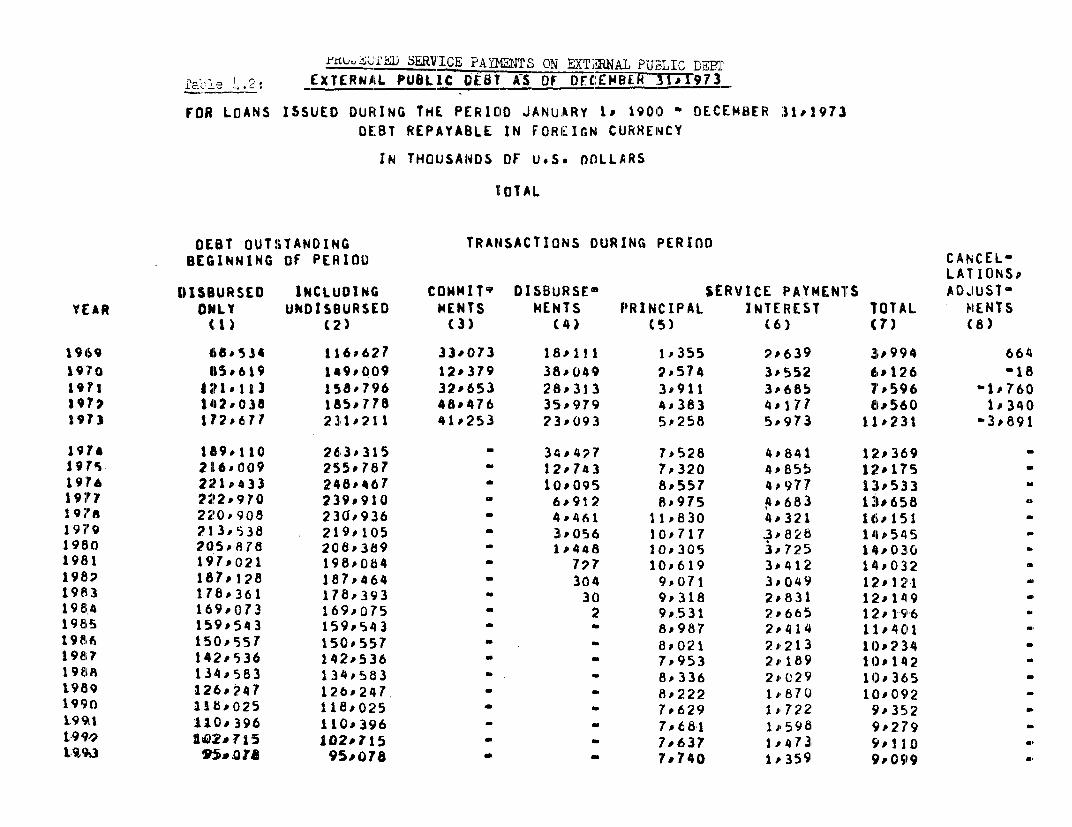
S RVYICE PA)3ENT'S ON EXTJINAL PUBLIC DEE'
£e.ble !..2: _(XTIERNAL PUBLIC 0E81 AS OF DECEMTBEk-1T 973
FOR LOANS ISSUED DURING THE PERICID JANUARY 1. 1900 DECEMBER 31.1973
DEBT REPAYABLE IN FOREIGN CURRENCY
IN THOUSANDS OF Us DOLLARS
T OTAL
DEBT OUTISTANDING TRANSACTIONS DURING PERInC EBEGINNING OF PERIOU CA,NCELS
DIISOURSED INCLUDING COMMIT? DISBURSE' SERVICE PAYM4ENTIS ADJUST7YEAR ONILY UNDISBURSED MENTS HENTS fPRINCIPAL INTEREST TOTAL MENTS
(1) (2) (3) (4) (5) (6) (7) (8)
91969 680534 116P627 33*073 18*111 1J355 2P639 3. 994 664
1970 115#619 149009 12.379 38B*49 2.574 3.*552 6.126 a18
19?J 1421 113 1518.796 32P653 28#313 3.911 3.685 7# 596 bIP76019T2 1412,038 18is5.778 48.476 35.979 4.383 4.177 fI8560 1.34019f3 1 72.6 71 231211 41#253 23P093 5.258 5.973 11.231 -3#891
197*4 1489110 263.315 - 34#427 7.528 4.841 1'2.369 -191Ts 216a009 25,5.787 _ 12.743 7.320 4855 1;2.175 -
1976 2 21.433 24,84 67 , 10.095 8.557 4.977 13.533 -19?IF? 2 22.970 239.910 6.912 8.975 6 683 13#658I97a 220.908 23a.936 - 4.461 11,830 4.321 16.151 -
1979 213P538 219,105 a 3.056 10P717 3.828 14.545 -
1980 2015.f878 206.389 a 1.448 10,305 3.725 14.030
1981 197#021 198.084 727 10.619 3.412 14.032
19812 187.128 187.464 ' 304 9.i071 3,i049 1;2I121
1983 178.361 178P393 - 30 9,318 2.831 12.149
198 4 169.073 169.075 2 9.531 2. 665 I2 125196
198 5 159.543 159.543 a a 8,987 2J414 11P401 a
19ef 150.557 150.557 - . 8.021 2.J213 10)t23 4
198?l 142P536 142*536 ' a 7.953 2.189 10. 142 198A 134,583 134P583 - _ 8.336 2J.029 10,365 *
1989 126.247 126.247. ' 8J222 1, 870 10.092
1990 118.025 118*025 a a 7,629 1J.722 9J352 '
19%1 110.396 110.396 7 a 7.681 1*59a 9.27'9 -
1'9 9' aI2'?7 15 102.115 ' ' 7.637 1 ,4731 9.I120
L9%3 95.aIA 95,078 a a 7.740 1,359 9J,099 9
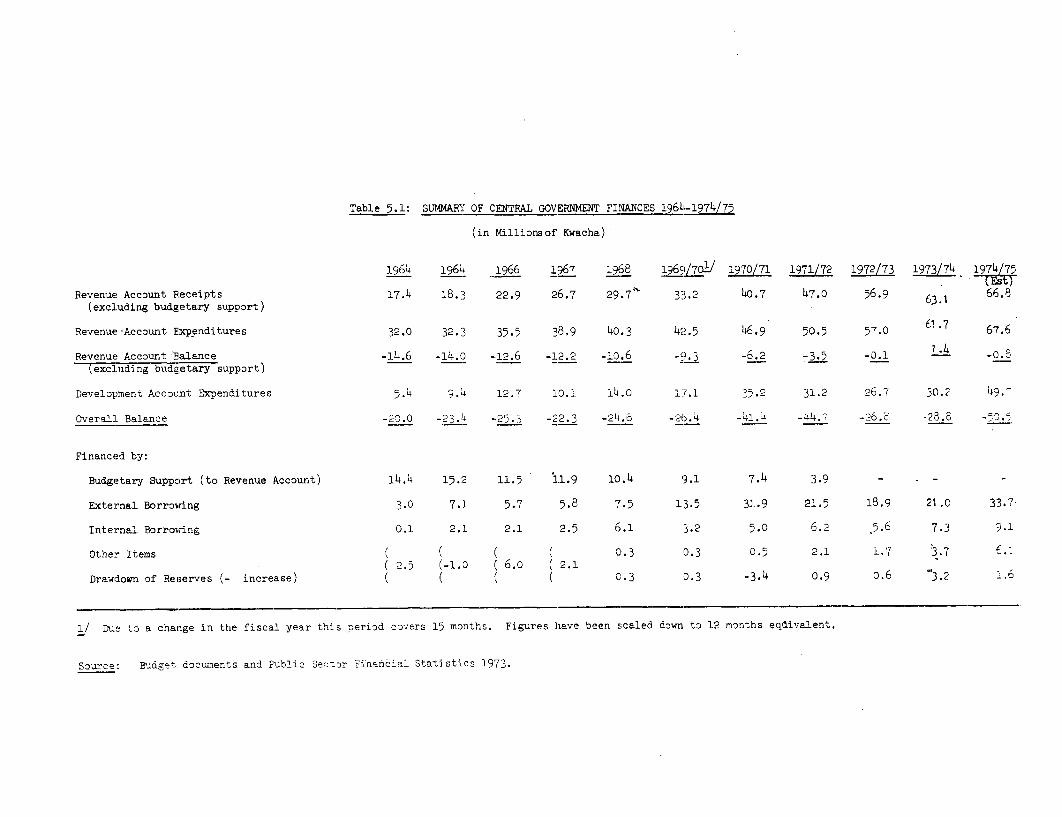
Table 5.1: SUMMARY OF CENTRAL GOVERNMENT FINANCES) 1964-1974175
(in Millionsof Kwac]na)
19i64 1964 1966 1967 1968 1969/70' 1970/71 197:L/72 1972'/73 1973/74 194
Revenue Account Receipts 17.4 18.3 22.9 26.7 29.7' 33.2 40.7 47.0 56.9 66.8(excluding budgetary support)
Revenue -Account Expenditures 32.0 32.3 35.5 38,9 40.3 42.5 46.9 50.5 5'7.0 t 67.6
Revenue Account 'Balance -14.6 -14.o -12.6 -12.2 -10.6 -9.3 -6.2 -3-5 -0.1 1 *- 0G(excElEdint; budgetary support)
Development Account Expenditures 5.4 9.4 12.7 10.1 i4.o 17.1 35.2 31.2 26.7 30.2 49.7
Ovreravll Bale.nce -2.0 -23.4 -.25.3 -22.3 -24. -246 -26.4 - . --44.7 -26.6 -28.8 -5O
Financed by:
Budgetary Support (to Revenue Account) 14.4 15.2 11.5 11.9 10.4 9.1 7.4 3.9 - , _
External Borrowing 3.0 7.1 5.7 5.8 7.5 13.5 31.9 21.5 13.9 21 .0 33.7
Internal Borrowing 0).1 2.1 2.1 2.5 6.1 3.2 5.0 6.2 5.6 7.3 '.1
Other Items 0 ( ( 0.3 o.3 0.5 2.1 1.7 3.7 672.5 (-1.0 ( 6.o ( 2.1
Drawdoan of Reserves (- increase) ( ( ( ( C.3 0.3 *.3.4 0.9 o.6 03.2 :.6
1/ Due to a change in the fiscal year this period covers 15 months. Figures have been scaled down to 12 monThs eqlivalent.
Source: Budget dociuaents and Prublic SeeWor Finianial Statistics 1973.
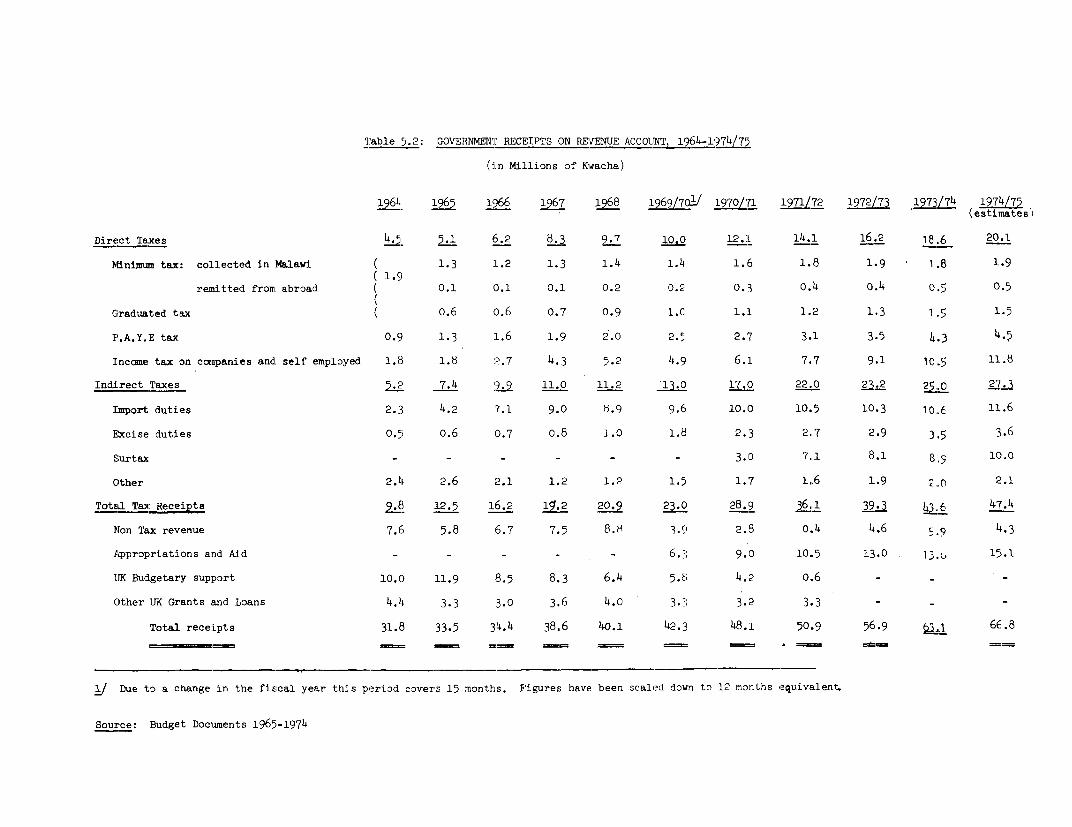
Table 5.2: GOVERNMENT RECEIPTS ON REVENUE ACCOLNT, 1964-1974/75
(in Millions of Kiwacha)
1964 1965 1966 1967 1968 1969/7C1/ 1970/71 L971/72 1972/73 1973/74 19L775
____ -- ~~~~~~~~~~~~~~~(estimates)
Direct Taxes 4.6.2 58.3j 9.7 10.0 12.:L 14.1 16.2 18.6 20.1
Mlinimum tax: collected in Malawi ( 1.3 1L.2 1.3 1.4 1.4 1.6 1.8 1.9 1.8 1.9
remitted from abroad ( 0.1 0.1 0.1 0.2 0.2 0.3 0.4 0.4 0-5 0.5
Graduated tax ( o.6 o.6 0.7 0.9 1.0 1.1 1.2 1.3 1.5 1.5
P.A.Y.E tax 0.9i 1.3 1L.6 1.9 2.0 2.5 2.7 3.1 3.5 4.3 4-5
Incme tax on conpanies and self employed 1.8 1.8 2.7 4.3 5.2 4.9S 6.1 7.7 9.1 10.5 11.8
Indirect Taxes 2 7.4 2 11.0 11.2 137. 22 .0 22.0 27.3
Import duties 2.3 4.2 7.1 9.0 8.9 9.6 10.0 10.5 10.3 10o. 11.6
E'xcise duties O,5 0.6 0.7 o.8 1.0 1.8 2.3 2.,7 2.9 3--5 3.6
Surtax - - - - - - 7.1 8.1 8.5 10.0
Other 2.4 2.6 ,2.1 1.2 1.2 1.5 1.7 1.6 1.9 20n 2.1
Total Tay Receipts 9.8 12.5 115.2 sr.2 20.9 23.C0 28.9 36.,1 39.3 46 7.4
Non Tax revenue 7.6 5.8 6).7 7.5 8.8 3.9 2.8 0,,4 4.6 5,9 4.3
Appropriations and Aid - - _ - 6.3 9.0 10.,5 13.0 13w 15.1
UtK Budgetary support 10.( 11.9 ,3.5 8.3 6.4 5.d 4.2 0,6 - _
Other UK Grants ind Loans 4.4 3.3 3.0 3.6 4.0 3.3 3.2 3,,3 -
Total receipts 31.8 33.5 34.4 38.6 40.1 42. 48.1 50,°9 56.9 66.8_ . _ _~~~~ == == _I == . == ===
1/ Due to a change in the fiscal year this period covers 15 months. Figures have been scaled down to 1c months equivEalent.
Source: Budget Documents 1965-1974
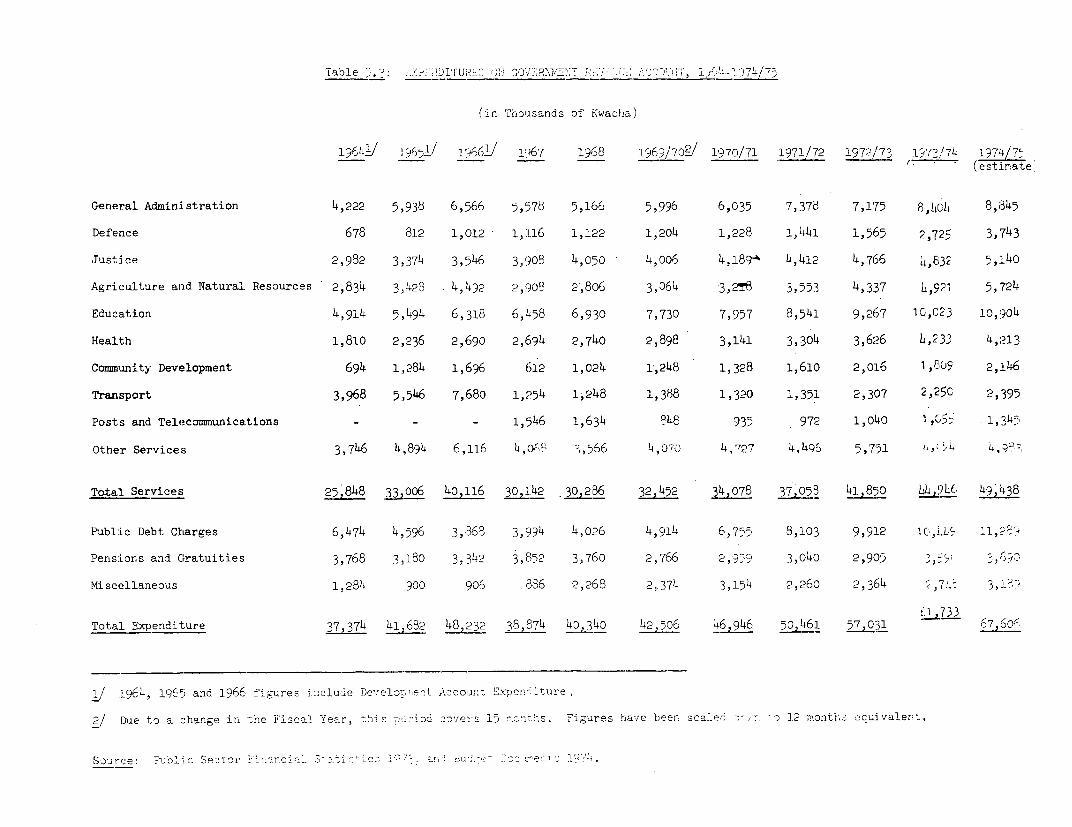
Table _..: :.7it;DITU1E2 l 0V7Ri4Sr:T 1 . lIP 1.r(4- 97L/7S__ _ _ _ _
(in Thouisands of Kwacha)
196421 Q6,651/ 166/ 1 67 1968 1 9 6)/ 7 0J 1970/71 1971/72 1972/73 1.97%/7L 1971-- _____ -e (est.iate
General Administration 4,222 5,935 6,566 5,'575 5,166 5,996 6,035 7,37' 7,175 8,,lCII 8,1845
Defence 678 812 1,012 1,L16 1,122 1,204 1,228 1,441 1,565 2,725 3,'743
Justice 2,982 3,374 3,546 3,908 4,050 4,oo6 4,18(9 4,412 4,766 L4,832 5,:140
Agriculture and Natural, Resources 2,834 3,428 4,492 2,9083 2,806 3,064 3,2T3 3,553 4,337 5,'724
Education 4,914 5,494 6,318 6,458 6,930 7,730 7,957 8,541 9,267 10,C23 10,904
Health 1,810 2,236 2,690 2,694 2,740 2,898 3,141. 3,304 3,626 L,233 4,213
Community Development 694 1,284 1,696 612 1,024 1,248 1, 328 1,610 2,0:16 1 ,'RoS 2,:L46
Transport, 3,968 5,546 7,680 1,254 1,248 1,388 1,320 1,351 2,307 2,25C 2,395
Posts andL Telecommunications - - - 1,'546 1,634 348 935 972 1,040 1 G,,5 1, 345
Other Services 3,746 4,894 6,116 Y' ?566 4,070 4,727 4,4CS 5,751 ,>L 4,
Total Services 25 ,848 33,006 40,116 30,142 30,286 32,452 34,078 ;72053 U,946 49,438
Public Debt Charges 6,474 4,596 3,86'3 3,S994 4, 06 4,914 6,755 8,103 9,91.2 1C,LLe 11,239
Pensions and Gratuities 3,768 3,180 3,342 3, 852 3,760 21,766 2,,9°9 3,040 2,905 3,5.
Miscoellaneous 1,284 900 906 .886 2,268 2,374 3,154 2,263 2,364 , 3,;-'
C-1733o aL Expenditure 37__ _ _ 32_ 39__8__ 4__46 ___46 ___ o__46___5 67 6,60Tota:L EEDendit.ure 37-,374 41k682 48,232 38 474 4 0 42,506 46,946 50,461 57,0'1 ___
i/ 1964, 196'5 and 1966 figures -nclude Developi.ent Accoin t Expen- 7turre
/Due to a change it- .he lFisca. Year, t:hi 4 oc3 c,e,sC 15 -.4nths. Figures havre been scale -r. o .12 -ont2 quivalent.
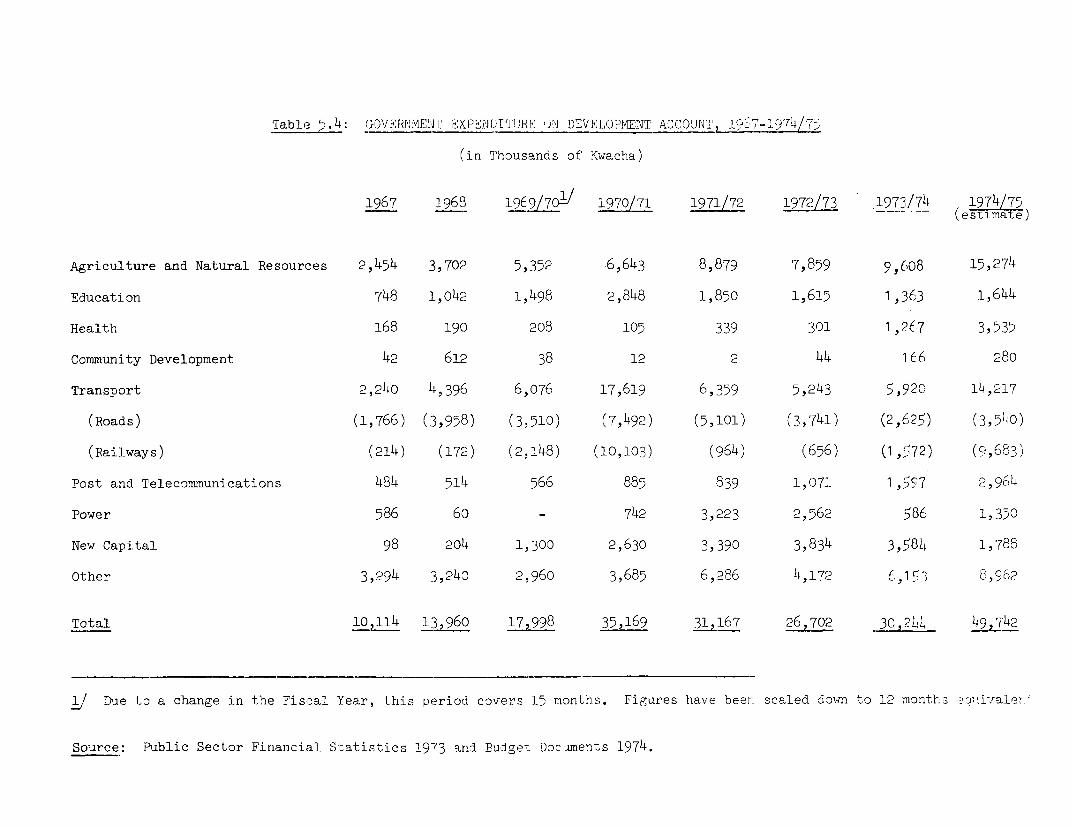
Table 5.4: GOVER['D'EIII EXPEI)ITTJRE D"1 DEVELOPKENT ACCOUNT, 19 7-197/
(in Thousands of Kwacha)
1967 1968 1969/7C/ 19707L1 197:L/72 197c2/3 1973/74 1974/75
Agriculture and Natural Resources 2,454 3,702 5,352 6,643 8,879 7,859 9,608 15,274
Education 748 1,042 1,498 2,848 1,8350 1,615 1,36 3 1,644
Health 168 19( 208 105 339 301 1 ,267 3,535
Community Development 42 612 38 12 2 44 1 66 280
Transport 2,240 4,396 6,076 17,619 6,359 5,2 43 5,920 14,217
(Roads) (1,766) (3,958) (3,510) (7,492) (5,101) (3,'741) (2,65) (3,540)
(Railways) (214) (172) (2,148) (10,103) (964) (656) (1, 72) (9,683)
Post and Telecommunications 484 514 566 885 839 1,071 1 , 57 2,964
Power 586 60 - 742 3,223 2,'562 ',86 1,350
New Capital 98 204 1,300 2,630 3,390 3,834 3,5,81i 1,788
Other 3,294 :3,240 2,960 3,685 6,286 4,:172 t,I'53 8+W o2
Total 10,114 13,6 1l7998 35,169 31,167 26,702 3c 1 4 r ,42
LI Due to a change in the Fiscal Year, this period. covers 15 months. Figures have been scaled downi to 12 months emLraler
Source: Public Sector Financial Statistics 19'73 and Budge. Docixnents 1974.
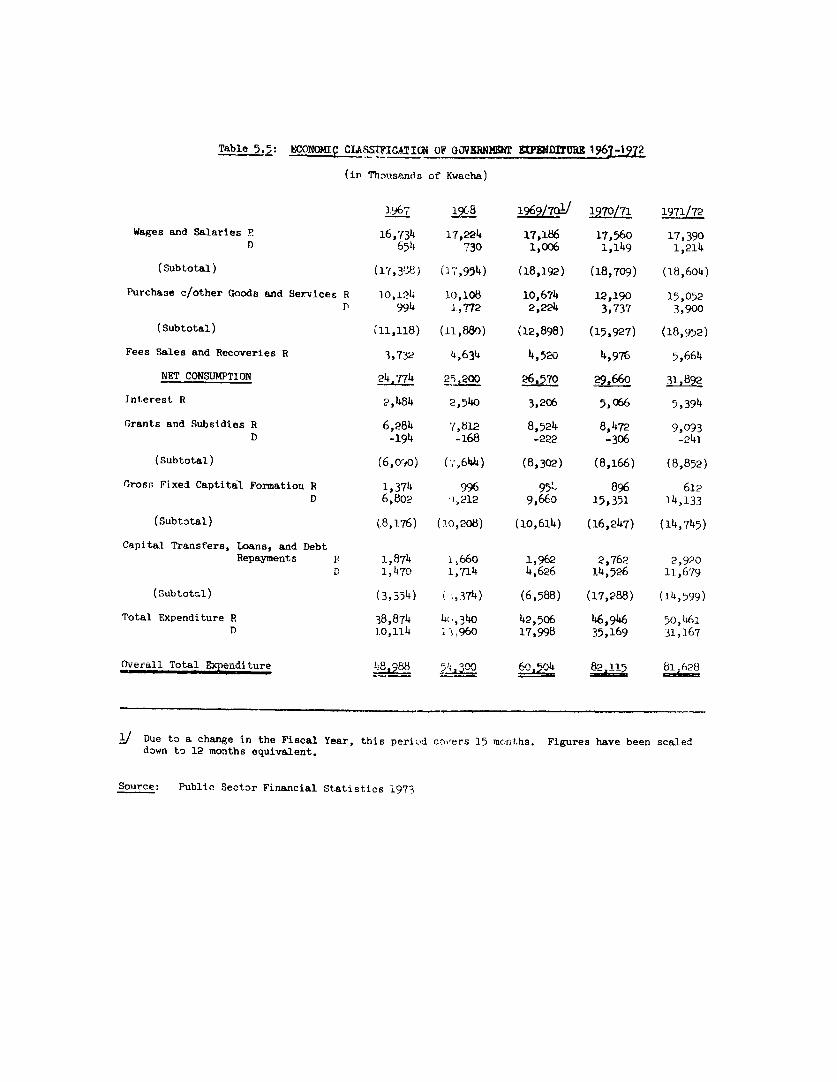
Table 5.5: ECONOMIC CL&.SSTFICATILW OF GOVBRNMr E[PmDTUR 1967-1972
(in Thouise.nds of Kwacha)
1.967 ~1Z8 1969/70 ! 1970/71 1971/72
Wages and Salaries P 16,734 17,224 17,186 17,560 17,390D 654 730 1,006 1,149 1,214
(Subtotal) (l7,3P) (17,954) (18,192) (18,709) (18,604)
Purchase c/other Goods and Ser-'dces H 10,124 10,108 10,674 12,190 15,052D 994 1,772 2,224 3,737 3,900
(Subtotal) ;11,118) (11,880) (12,898) (15,927) (18,952)
Fees Sales and Recoveries R 3,732 4,634 4,520 4,976 5,664
NET CONSUMPTION 24,774 2S,200 26k570 29,660 31,892
Interest R 2,484 2,540 3,206 5,066 5,394
Grants and Subsidies R 6,284 7,812 8,524 8,472 9,093D -194 -168 -222 -306 -241
(Subtotal) (6,o0o) (,,644) (8,302) (8,166) (8,852)
Gross Fixed Captital Formation R 1,374 996 95- 896 612D 6,802 ),212 9,660 15,351 14,133
(Subtotal) (.8,1.76) (10,208) (10,614) (16,247) (14,745)
Capital Transfers, Loans, and DebtRepayments 1-. 1,874 ),660 1,962 2,762 2,920
D 1,4,70 1,714 4,626 14;526 11,679
(Subtotal) (3,354) i ,37 4) (6,588) (17,288) (14,599)
Total Expenditure R 38,874 4(,34o 42,506 46,946 50,461D 10.114 ]i1,960 17,998 35,169 31,167
Overall Total Expenditure -'9 ,3 0 82 i 112
j Due to a change in the Fiscal Year, this periud co-ers 15 months. Figures have been scaleddown to 12 months equivalent.
Source: Public Sector Financial St.atistics 1973
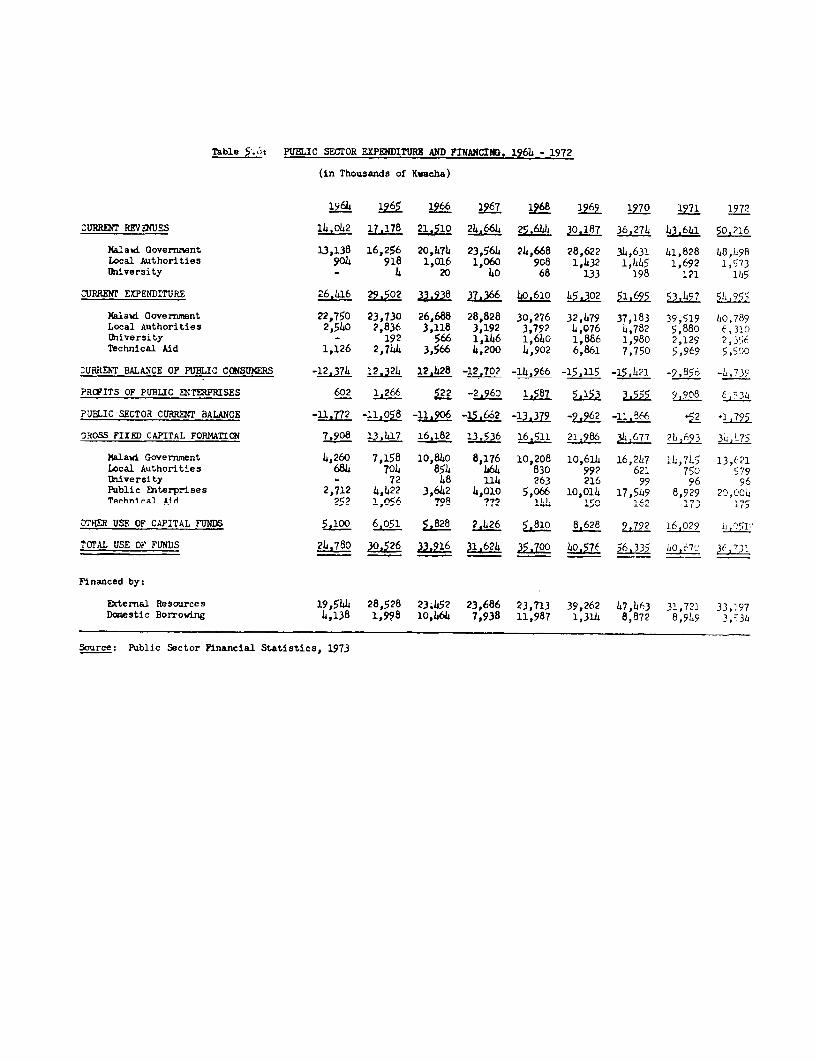
Table 5-.6: PUBLIC SECTOR EXPENDITURE AfD FINANCING. 196b - 1972
(in Thousands of Kwacha)
1964 1965 1966 1967 16-8 1969 1970 1971 1972
CURRENT R V USS 14.0142 17,178 21.510 24.664 25,644 30,187 36.274 43,641 50,216
Ma 1 ° A Gove rnment U 13' j A6 ,If 256 L0,71. 2 ,1 564l ,24 s8 2862 4- 6I uI,8 - Iu9-
Local Authorities 90 l 918 1,016 1,060 9C8 1,432 1,l4L4 1,692 1,573University - 4 20 40 68 133 198 121 1)
15
CURRENT EXrEnnTURE 26.1416 29,5 3. 37,366 4 2 16 045,302 51,9 53 7 J
Nalawi Government 22,75023,730[J- - ' 6,688B 280,828ie0 -3 0, 2 7 6 3-2,479 37,183 39,519 140,789Local Authorities 2,540 2,836 3,118 3,192 3 792 4 076 4,782 5,880 6,310University - 192 566 1,Ah46 1,6440 1,886 1,980 2,125 2,,5rTechnical Aid 1,126 2,744 3,566 4,200 4,902 6,861 7,750 5,969 5,500
ZURRENT BALANCE OF PUBLIC CONSUMERS -12.374 12.324 12.428 -12.,702 -114.966 -15_15 -15,1421 -9,856 -L,73S
PRCFITS OF PUBLIC ENTERPFRISES 602 1 266 5 -2.96U 1,587 5 3,555 9,908 ,3
?UBLIC SECTOR CURRENT BALANCE -11.772 -11.058 -11.906 -1.662 379 -9.962 -11,866 +52 +1 ,795
SROSS FIXED CAPITAL FORMATION 7,908 13.417 16.182 13.536 16.511 21.986 3L.677 21-.693 3i -75
Malawi Government 14,260 7,158 10,840 8,176 10,208 10,61h 16,287 14,7L5 13,621Local Authorities 681 701 85L4 hWL 830 992 621 750 7University - 72 148 1114 263 216 99 96 96Public Enterprises 2,712 4,422 3,642 4,010 5,066 10,014 17,549 8,929 20,0C1Te.chn_ial Aid 2521,056 798 772 1141 150 162 173 175
OTHER. USE OF CAPITAL FUNDS 5.100 6.051 5.828 2.426 5.810 8.628 9 792 16,029 8,55TOTAL USE OF FUNDS 24,780 30.526 JI 16 31,624 00 40 576 56.335 1,0, 71 3(,73
Financed by:
External Resources 19,544 28,528 23,452 23,686 23,713 39,262 47,143 3',721 33,297Domestic Borrowing 4,138 1,998 10,464 7,938 11,987 1,314 8,872 8,949 3,z3h
Source: Public Sector Financial Statistics, 1973
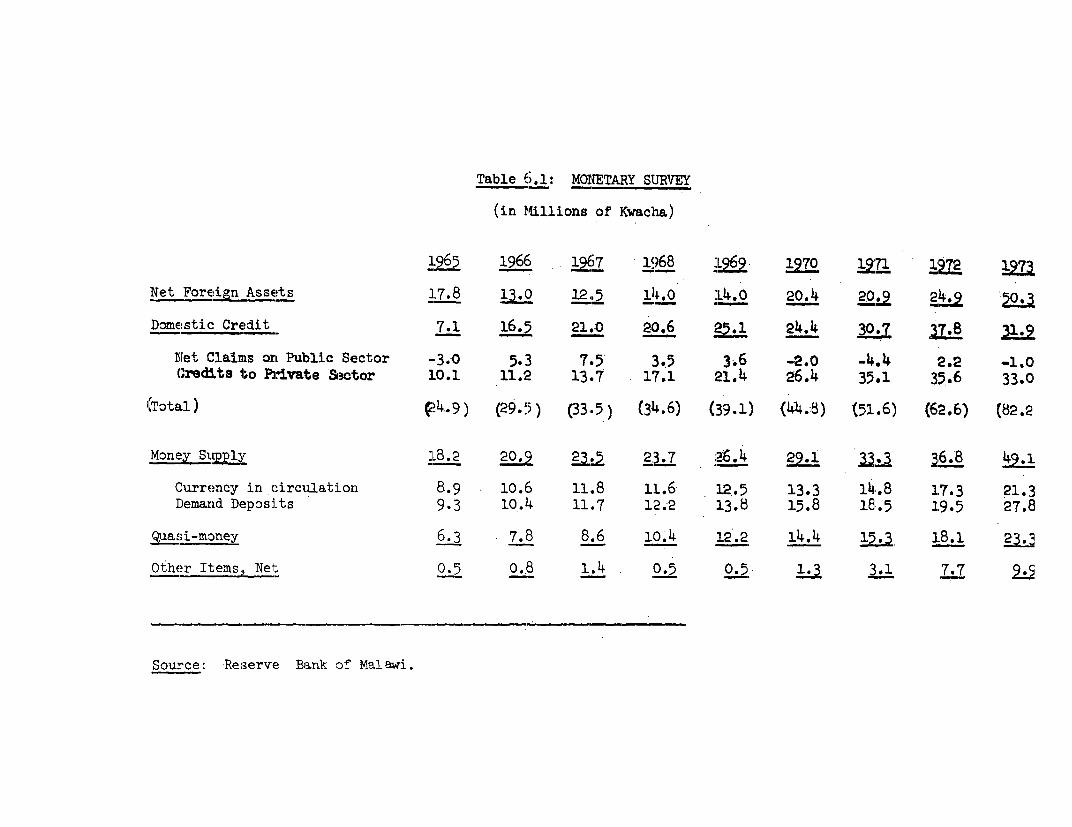
Table 6'.1: MONETARY SUJRVEY
(in M illions of lKwacha)
1.965 196( 1967 1968 1969 1970 1971 1972 197
Net Foreign Assets 17.8 13.() 12,. 14l.0 14.0 20.4 20.9 24.9
Domestic Credit 7.1 16.)5 21.0 243.6 24.4 30.7 ;7.8 31.
BNet Clamims OIL PubliC Sector .3.0 5.3 7T5 3.5 3.6 -2.0 -4.4 2.2 -1.0CdLredhts ;o TMvajte SeCtor 30.1 11.2' 13,7 17.1 21.-4 26.4 35.1 35.6 33.0
(Tota1) '4-.9) (29.5 ) (33,.5) (314.6) (39.1) (414.-B) (51.6) (62.6) (82.2,
Money Supply 18.2 23 23.5 23.7 :26.4 29.1 X.3 ]6.8 4;
Currency in circulation 8.9 10.6 11.8 11.6 12.5 13.3 14.8 17.3 21.3Demand Deposits 9.3 10.4 11.7 12.2 13.8 15.8 18.5 19.5 27.8
QuaSi-mOney 6.3 7.8 8.6 10.4 12.2 14.4 1 . 38.1Other Items., Net 0.5 0.,3 1.4 0.5 1.1 77
Source: Reserve Bank oDf Malwi.
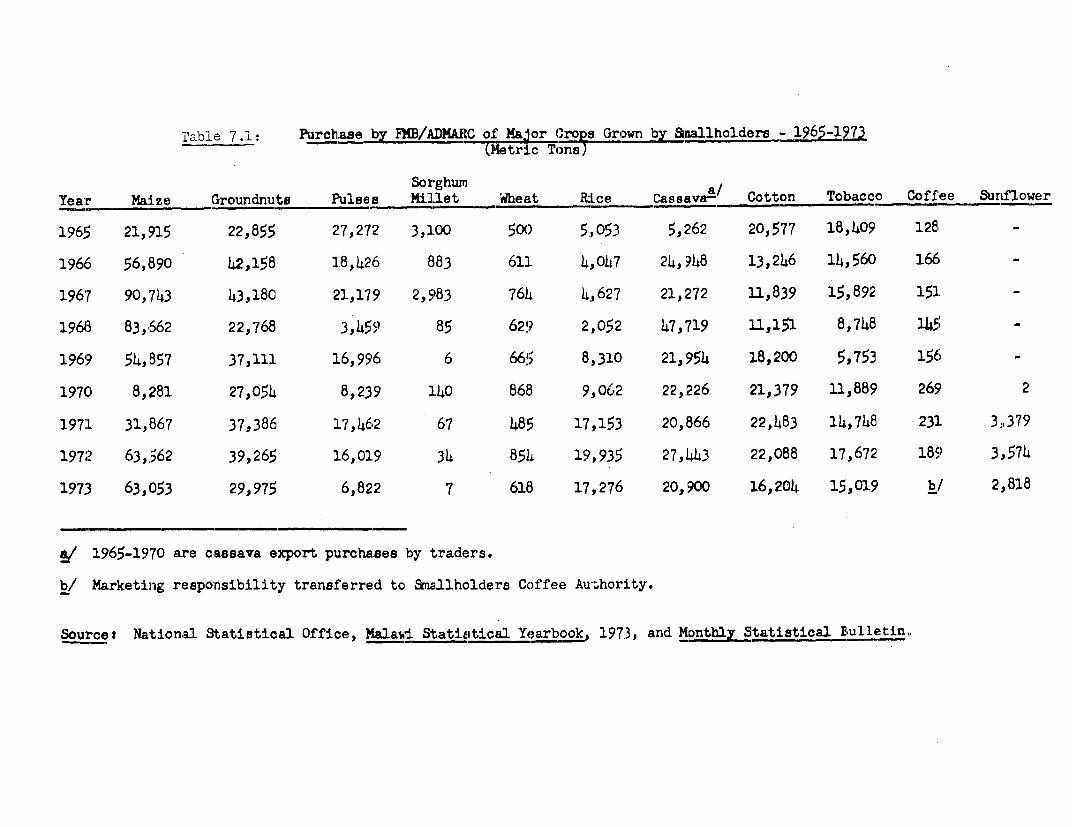
Table 7 .1 Purchase by F/ADMAC of Mar C Grown nalllholdiers - 196521973- - ~~~~~THtric To-ns)-
SorghumYear Maize Groundnut Pulses MiUlet Wheat R:Lce Cassava- Cotton Tobacco Coff'ee SurLfloower
196!5 21,915 22,855 27,27'2 3,100 50() 5,053 5,262 20,577 18,409 1286
1966$ 56,B90 42,158 1.8,426 E883 61:L 4,047 24,948 13,246 14,560 166 -
1967 90,743 43,180 2'1,179 2,5983 7614 4,627 21,:272 11,839 15,892 151. -
1963 83, 662 22,768 3,h45') 85 629 2,052 47,'719 11,151 8,748 15' -
1969 54,857 37,111 1.6,996 6 665 8,310 21,954 18,200 5,753 156 -
197( 8,281 27,054 8,239 i40 868 9,06'2 22,226 21,379 11.,889' 269 2
197:L 31,8B67 37,386 1.7,462 67 48!5 17,153 20,i866 22,483 14,748 231 3,379
1972 63,o562 39,265 16,019 34 85h4 19,935 27,,43 22,088 17,672' 189) 3 ,574
1973 63,053 29,975 6,822 7 618 17,276 20,900 16,204 15.,019 b 2,,818
a/ 1965>-19'70 are cassava export purchases by traders.
b/ Marketing responsibility transferred to &rwllholders Coffee Authority.
Sourcet National Statistical Office, Malawri St.atifsticaLl Yearboo, 1973, and Monthly Statistical T,ulletin
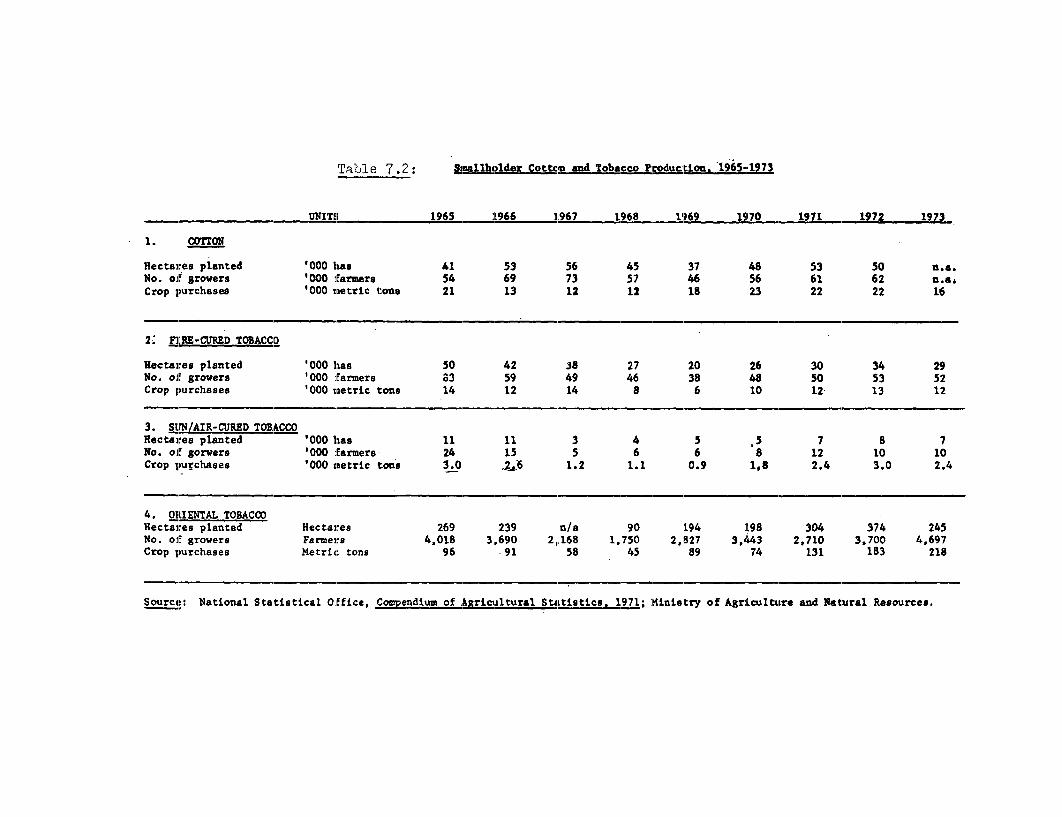
Table 7 .2: flallbolder Cotton and Tobacco Production. 1965-1973
UNITS 1965 1966 1967 1968 1969 15170 1971 197Z 1973
1. c0T]ON
lIectares planted '000 has 41 53 56 45 37 48 53 50 nIL.a.lNo. oIE grow;ers '000 fEarmers 54 69 73 57 46 56 61 62 n.4eCrop PUrchgises '000 rmetric: tons 21 13 12 12 is 23 22 22 16
2: F3M:ZD TOISACCO
Hectares planted '000 hIas 50 42 38 27 20 26 30 34 29No. of grovers '000 Farmers S3 59 49 46 38 48 50 53 52Crop purchases '000 metric tons 14 12 14 8 6 10 12 13 12
3 SUN/AIR-CURED TOBACCOHectares planted '000 )las 11 11 3 4 5 .5 7 8 7to. oIf gornerS '000 farmers 24 15 5 6 6 8 12 10 10Crop purchases '000 moetric tons 3.0 _2-.6 1.2 1.1 0.9 1,8 2.4 3.0 2.4
4. OIUENTAL TOBACCOHectares planted llectares 269 239 n/a 90 194 198 304 374 245No. ofL grovers Farmers 4,018 3,690 2,168 1.750 2,827 3,443 2,710 3,700 4,697Crop PurchaLses Metric tons 96 -91 58 45 89 74 131 183 218
iource National Statistical Office, Cenditm of Agriciltural StULtistics. 1971; Ministry of Agriculttire and Natural Resources.
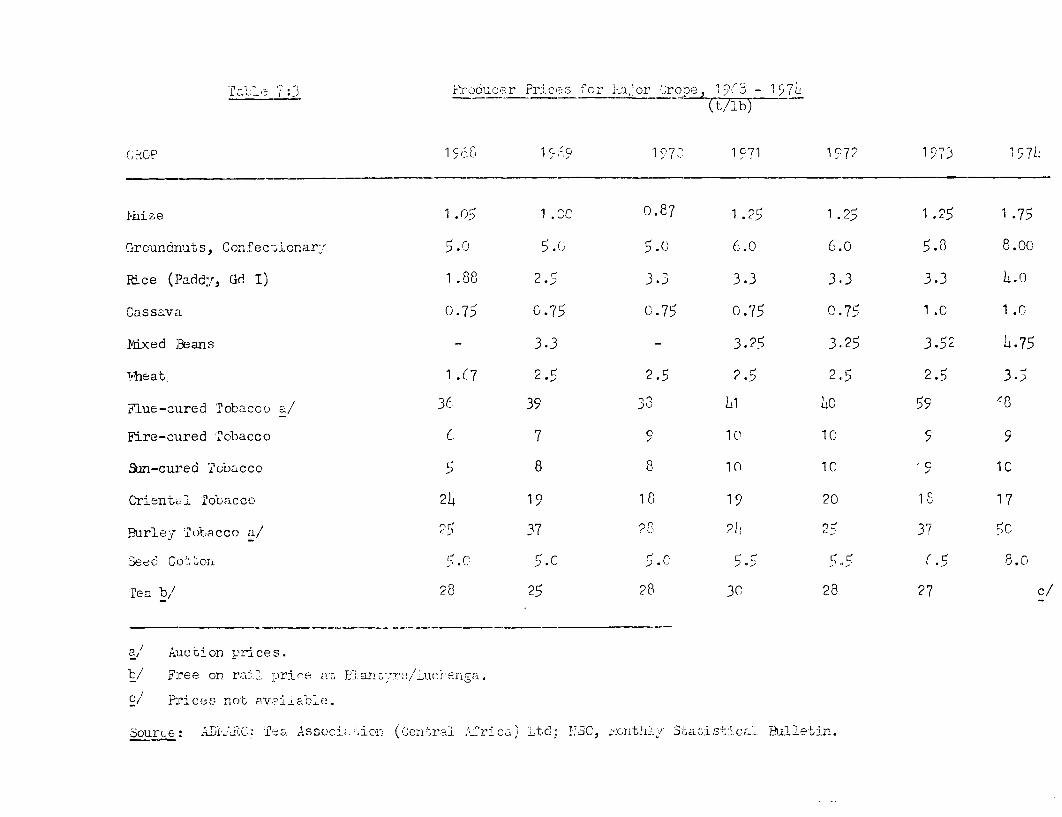
cAi. 7 r-oc-u,r Pr:c(es 'or l ajor ',rope1 >*3 -
,<(,P 1c,(8 1l, c 1Ci7I 1c71 172 1573
lUi ize 1 .05 1.00 0 .87 1.25 1.25 1.25 1.73
Groundrluts, Confectionar- 3. 5. 3.0 6.0 6.0 5.,8 8.0c
Idce (Padd-,, Gd I) 1.88 2.3 3.3 3.3 3.3 3,3 4.0
Cassava 0.75 0.75 0 .75 0.75 0.75 1 C 1.0
1inxed Be ans - 3.3 - 3.25 3. 25 3,52 L .73
!i-Ehat 1.(7 2.5 2.5 2.5 2.5 2. 5 3.
Flue-cured Tobacco a/ 36 39 33 Li L 59 -8
Fire-cured TLobacco 6 7 S 10 1 9 9
9Ur-CUred tobacco 5 8 8 1I 1
Or±-ent6;l Tobacco 2L 19 18 1 9 20 1 c 17
Burlej- Tocaccc a/ 23 37 28 ?) 2- 37
Seec. Cot,O .0 5 .c 5.c 5., 5 f .5 8.c,
Tea b,/ 28 25 28 30 28 27 c/
a,, Auction prices.
b/ Free on rail once a- F-,ary jLuKe-a
C/ Prices not aw-l 1able.
Sourc,e: Tei a1: i.o Assccu<;,cr (0cen ral 2rica) Ltdch 1UC, jxonthli SvaLi stical BUlatitC.
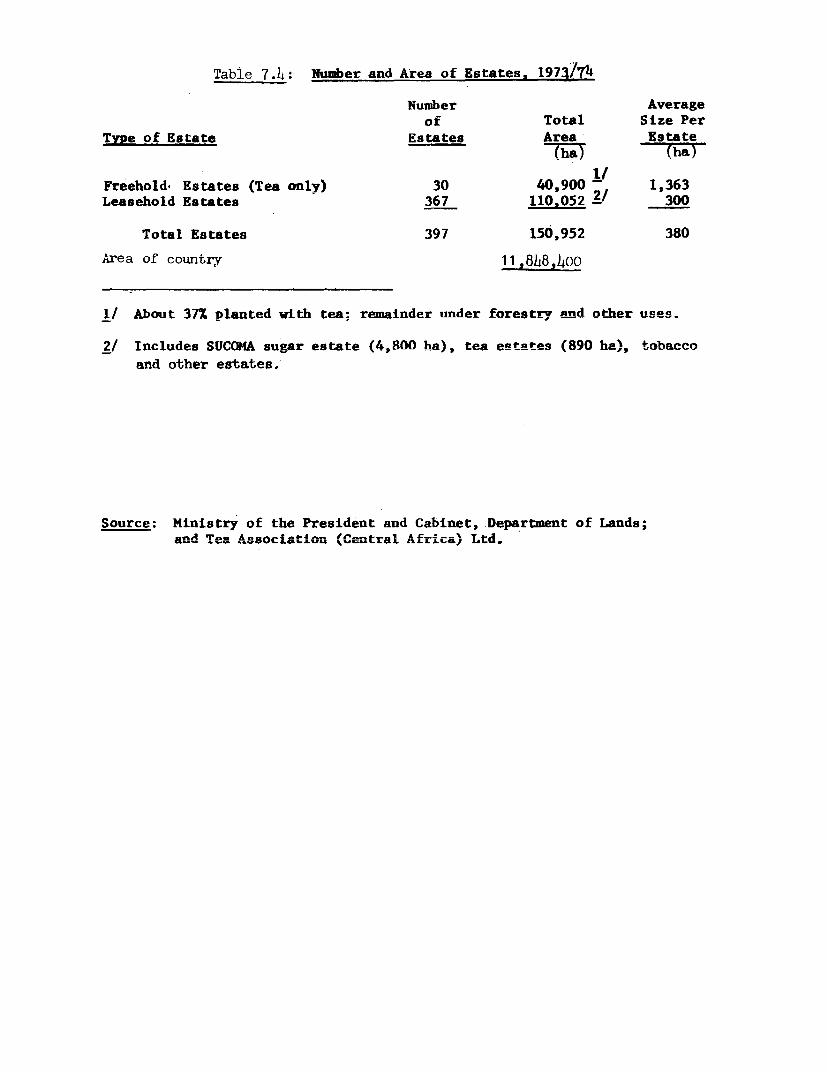
Table 7.h: Number and Area of Estates, 1973/t
Number Averageof Total Size Per
Tvpe of Estate Estates Area Estate(ha) (ha)
Freehold' Estates (Tea only) 30 40,900 - 1.363Leasehold Estates 367 110.052 2 _ 300
Total Estates 397 156,952 380
Area of country 11,848,4oo
1/ About 37Z planted with tea; remainder under forestry and other uses.
2/ Includes SUCOMA sugar estate (4,800 ha), tea estates (890 ha), tobaccoand other estates.
Source: Ministry of the President and Cabinet,.Department of Lands;and Tea Asoc_iatilon (Central A1LfricaL ) UL;U.
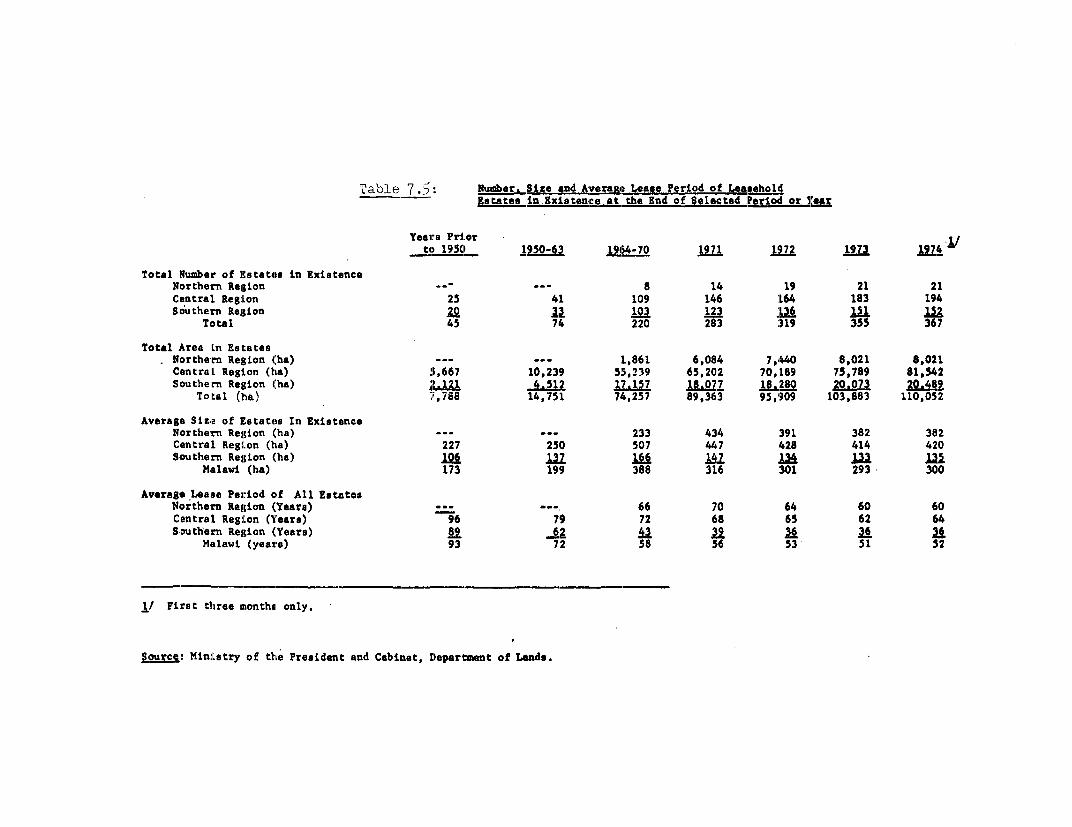
Table 7.5: R-iber. SLze and Average Lealie Period of LeashjjdEstates in Existe -ae at the End of Selected Period or l'r
Years Prieorto 1950 1950-63 19164-70 1971 j1972 1973 MZ24
Total 'Number of Estates in ExistenceNorthern Relion -- --- 8 14 19 21 21Central Region 25 41 109 146 164 183 194Southern Region 20 I 103 123 21. 12a
Total 45 74 220 283 319 355 367
Total Area Ln EsitatesNorthern Region (ha) --- --- 1,861 6,084 7,440 8,021 8,021Centra'l RegiLon (ha) 51,667 10,239 53,239 65,202 70,189 75,789 81,542Southern Region ('ha) ;L,2 AL 1M8.7077 A.280 Z1.073 2R.481
Total (ha) 7,7S8 14,751 74,257 89,363 95,909 103,883 110,052
Average Site of Estates In ExistenceNorthern Region (ha) --- - 233 434 391 382 382Central Region (ha) 227 250 507 447 428 414 420Southe:rn Region (:ha) la2 U2 1g W. E L
Malawi (ha) 173 199 388 316 301 293- 300
Average Leaie Period of All EstatesNorthern Relgion (Years) --- '-- 66 70 64 60 60Central Region (Years) 96 79 72 68 65 62 64Southern RegiLon (Years) 89 2 43 29 36 36 2k
Malavi (years) 93 72 58 56 53 51 52
1/ First three months only.
Sjource: MiniLstry of thie President and Cabinet, Department of Lands.
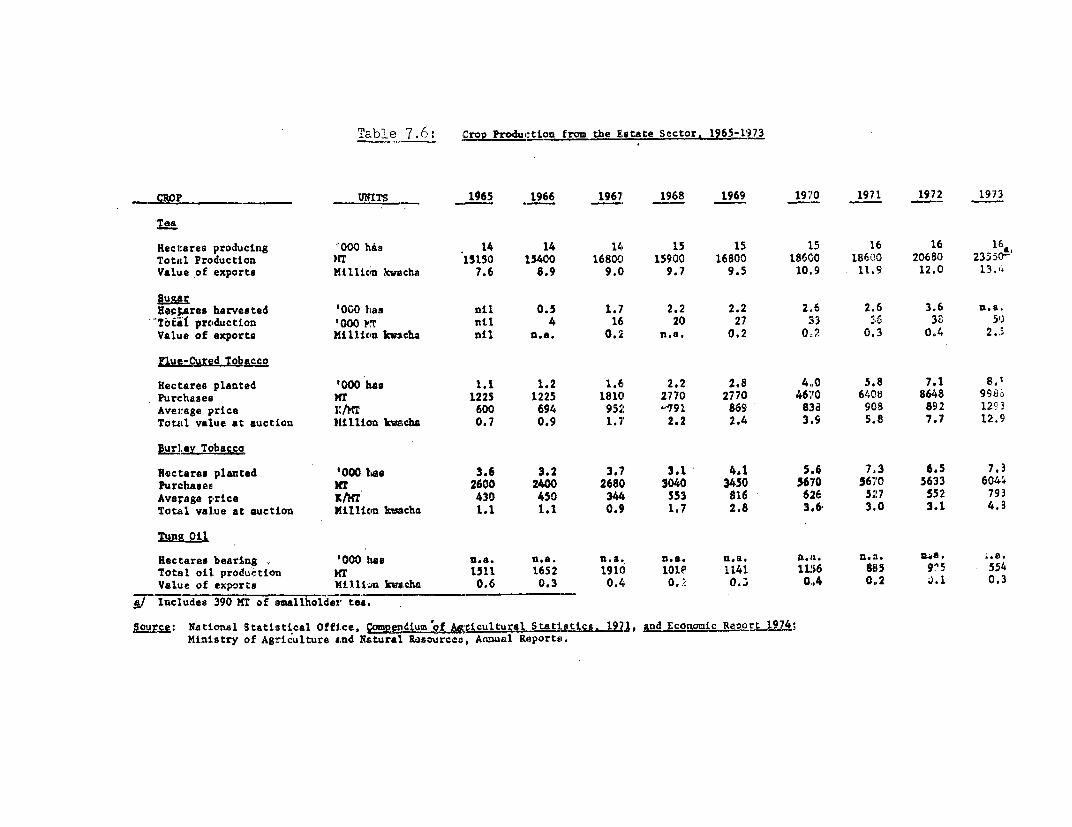
Table 7.6: iCrop Iftoduction from the Estate Sector. 1965-1973
_ CROI _ UNrITS 1965 1966 1967 1968 1969 19 A0 1971 1972 1973
'Tea
Hectares producing 000I his 14 14 14 15 15 15 16 16 l6^Total Production HT 13150 15400 16800 15900 16800 18600 186c0 20680 23550-Value of exports Million lcwgcha 7.6 8.9 9.0 9.7 9.5 10,9 11.9 12.0 13.4
SusuLHe;jwares harvested O"0 has nil 0.5 1.7 2.2 2.2 2.6 2.6 3.6 n.a.
-Tboil production '000 Y, nil 4 16 20 27 33 35 38 5)Value of exporte Million k.ceba nil n.e. 0.2 n.a. 0,2 0Q2 0.3 04 2.5
W-Cured Tobacco
Hectares planted "000 Las 1.1 1.2 1.6 2.2 2.8 4C0 5.8 7.1 8.'Purchases MT 1225 1225 181C 2770 2770 4670 6408 8648 998Average price I/MT 600 694 952 -191 869 83a 90s8 892 120 3Totil value at auction Million kwsgcha 0.7 0.9 1.7 2.2 2.4 3.9 5.8 7.7 12.9
Rectares planted 000 hLas 3.6 3.2 3. 3.1 4.1 5.6 7.3 6.5 7.3Purchases HT 2600 2400 2680 3040 3450 5670 561 0 5633 6044Avelage price I/MT 430 450 344 553 816 62Z6 5.27 552 793Total value at auction Millicn kmlcha 1.1 1.1 0.59 1.7 2.8 3.8. 3.0 3.1 4.
lnsut Oil
Hectares bearing "000 has n.a. n.a. n.a, n.&. n.a. A.n . n.a. n4. .eTotal oil production 1511 1652 1910 10le 1141 1156 885 9g'5 554Value of exports Wil1in kVwLcha 0.6 0.3 0.4 0.Z 0.5 04 0.2 3.1 0.3
3I Includes 390 Kr of smallholder tee.
iouLrc: Neational Statistical Office, I ,0MAgeculeural S!atl.stics. 197 nMinistry of Agriculture aLnd Natural Rosources, Annual Reports.

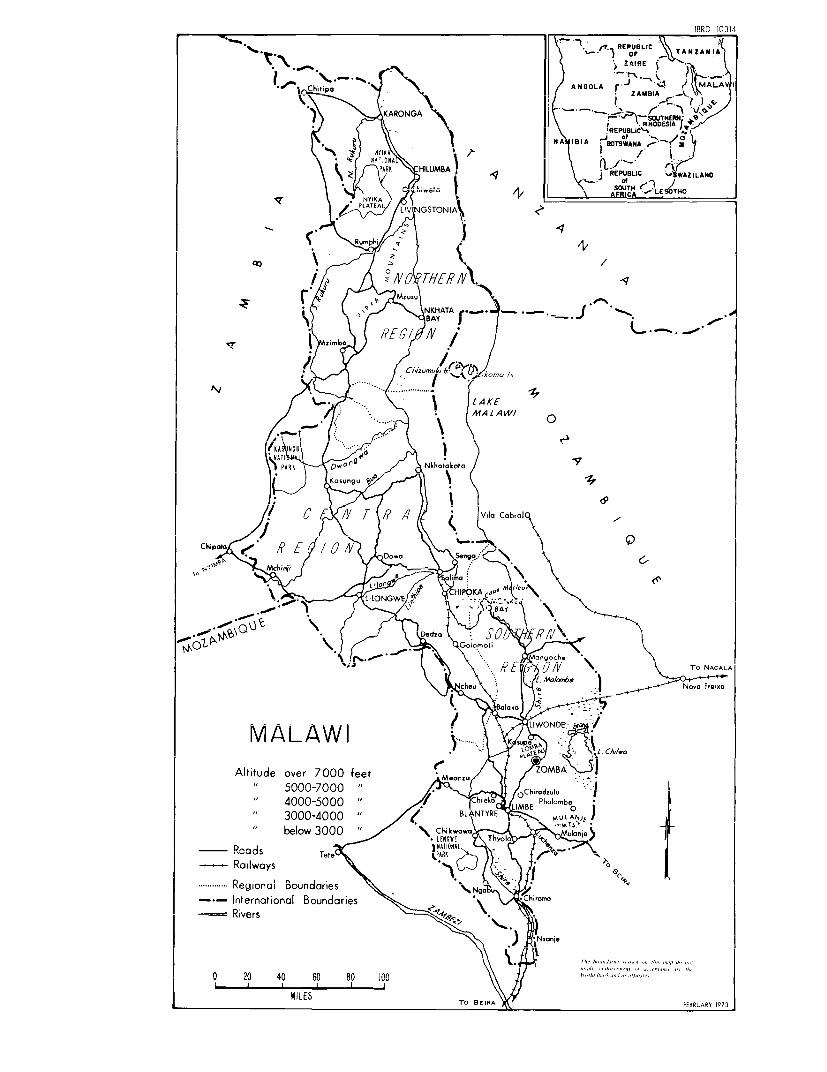
IBRD- 10314
g S \^ \ \ '~~~~~~~l.REPL.BLCE A~
TOTH_. M'
S \ 5 NYIKA % /t t {L" | l _ _ \ AF~~~~~~~~.R HODSI
I~~~~~~~~~~~~~~~~~~~~~~~~~~~~1 1. I A7e2
I~ ~ ~ ~ ~~~~~~~IUB REUBI WA4 A wILANDRt
| *t<. A & RSG//S j | t----~L.~W A
| N g \ ljA1 t; \ 0Z AKHATA | / _- 1" '''" 'm ' ( M'BAY A W
I /, \ J < t \ o zim
I W A ANkhottsota) '9~~~~~~~~~~~~~~~~.......i asungu < }--)1 l V 9 I~~~~~~~~~~~~~~~~~~~71
I 1: \ i i 1 o I~~~AK
I Jl S s (: . t X, ^ IIAW
| Chip < ONA
I~~~~~~~~~~~~~~~~~~oab To\) NACA XrXAj
Al~~~~\titud\e ! over70 freet
5000-7000 /" ( #JChruiu I4000 5000 "8 / Thlkf/I halornbe *
3000-4000 /" MUNTR buLNt ) N1p
| ~~~~below 300 LClhika,a> Roads Teto NT°NL ~ I{ O\
Railways I\o) & i .......... Regional Boundaries N\\...........*M .
-International Boundaries ><'Ahromn_ Rivers mnis
0 20 40 60 80 !0 iool ull;dllll . tII;..lrl# rl eE
_~~~~~~IE TO BEIRA FEPBRUARY 1973