Embed Size (px)
Citation preview

Recent Development in Income Inequality in Thailand
V.Vanitcharearnthum
Chulalongkorn Business School
September 21, 2015
V.Vanitcharearnthum (CBS) Income Inequality Sep. 21, 2015 1 / 40

Introduction Agenda
Income inequality: measurement
Literature Review
Pareto Distribution
Top income share
Evidences from SESEvidences from tax return
V.Vanitcharearnthum (CBS) Income Inequality Sep. 21, 2015 2 / 40

Introduction Agenda
Declining Poverty
(millions) 22.5
12.0
3.0
1988 1999 2010
Figure : Number of poor at $2/day (PPP)
V.Vanitcharearnthum (CBS) Income Inequality Sep. 21, 2015 3 / 40

Introduction Agenda
Improving Equality
96 98 00 02 04 06 07 09 11
.4
.45
.5
.55
.596
Figure : Gini Coefficient: Whole Kingdom
V.Vanitcharearnthum (CBS) Income Inequality Sep. 21, 2015 4 / 40

Introduction Agenda
96 98 00 02 04 06 07 09 11
.4
.45
.5
.54 Bangkok
Central
North
Northeast
Figure : Gini Coefficients: By Regions
V.Vanitcharearnthum (CBS) Income Inequality Sep. 21, 2015 5 / 40

Literature Review Thailand
Recent Studies
Kobsak (2013)
Kilenthong (2014)
V.Vanitcharearnthum (CBS) Income Inequality Sep. 21, 2015 6 / 40
Literature Review International Evidences
Review Literature
Feenberg and Poterba (NBER 19)
Piketty(JPE 2003)
Atkinson (2005)
Piketty and Saez (QJE 2003)
Atkinson, Piketty and Saez (JEL 2011)
V.Vanitcharearnthum (CBS) Income Inequality Sep. 21, 2015 7 / 40
Methodology Pareto Distribution
Methodology
Pareto distribution
SES: HH member data
Estimating Pareto parameters
Tax units amd national income
Preliminary result
V.Vanitcharearnthum (CBS) Income Inequality Sep. 21, 2015 8 / 40

Methodology Pareto Distribution
Pareto(1896, 1897)
Vilfrado Pareto considered data for England, a number of Italiancities, several German states, Paris and Peru.
Plotting the cumulative distributions of income for these countries ondouble logarithmic paper,
Pareto claimed that in each case the result was a straight line withabout the same slope.
V.Vanitcharearnthum (CBS) Income Inequality Sep. 21, 2015 9 / 40

Methodology Pareto Distribution
logN = A− α log y
logNy≥k
log y
England 1879-80
Italian Towns
k
Figure : Pareto’s Law
V.Vanitcharearnthum (CBS) Income Inequality Sep. 21, 2015 10 / 40

Methodology Pareto Distribution
logN = A− αH log y
logNy≥k
log yk
Figure : Pareto’s Law
V.Vanitcharearnthum (CBS) Income Inequality Sep. 21, 2015 11 / 40

Methodology Pareto Distribution
logN = A− αL log y
logNy≥k
log yk
Figure : Pareto’s Law
V.Vanitcharearnthum (CBS) Income Inequality April 9, 2015 12 / 40

Methodology Pareto Distribution
The Pareto law for top incomes is given by the following cumulativedistribution function, F (y), that specifies the probability that a randomlychosen taxpayer’s income y is greater than x is
Pr(y > x) = 1 − F (x) =
(k
x
)αwhere k is the minimum income that the Pareto distribution applies to,and α is the exponent that determines the shape of the distribution.
V.Vanitcharearnthum (CBS) Income Inequality Sep. 21, 2015 13 / 40

Methodology Pareto Distribution
β
Let y∗(y) be an average income of individuals with income above y .Under the Pareto distribution,
y∗(y) = β · y
where β = αα−1
V.Vanitcharearnthum (CBS) Income Inequality Sep. 21, 2015 14 / 40

Methodology Pareto Distribution
If β = 2, the average income of individuals with income above1,000,000 bahts is 2,000,000 bahts.
A higher β means a fatter upper tail of the distribution
V.Vanitcharearnthum (CBS) Income Inequality Sep. 21, 2015 15 / 40

Part I
HH Survey
V.Vanitcharearnthum (CBS) Income Inequality Sep. 21, 2015 16 / 40

SES Results
SES 2004
Use HH member data: in rec 2 (including info about education, workstatus , etc.)
Also rec 13-15 (income from various occupations)
In 2004 survey, there are
Wage incomeNon-farm incomeFarm incomeProperty incomeTransfersOther income
V.Vanitcharearnthum (CBS) Income Inequality Sep. 21, 2015 17 / 40

SES Results
SES 2009 & 2013
Total income of HH member includes
Wage incomeRevenue and operating cost of businessMoney received from agriculture and cost
V.Vanitcharearnthum (CBS) Income Inequality Sep. 21, 2015 18 / 40
SES Results
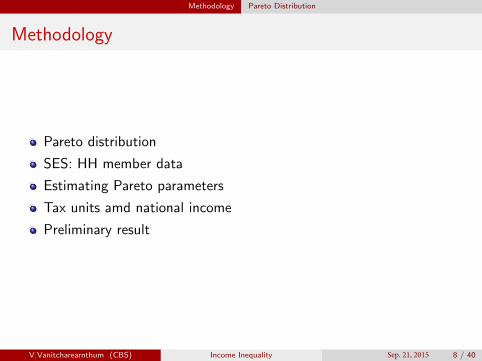
2004 2009 2013
k .2,530.83 30,728.7 41,984α 1.647 1.548 1.693β 2.55 2.825 2.45y∗(yp90) 313,435.8 384,200 401,681yp99 493,820.52 602,523.53 640,977.1yp99.9 2,011,255.68 2,679,049.69 2,502,026.2
V.Vanitcharearnthum (CBS) Income Inequality Sep. 21, 2015 19 / 40

SES Results
Top income share
0.11
0.123
Top 1%
0.055
Top .1%0.045
2004 2009 2013
V.Vanitcharearnthum (CBS) Income Inequality Sep. 21, 2015 20 / 40

SES Results
Fraction of BA or Above in Top income
0.55
0.63
Top 1 %
0.32
Top .1 %
0.4
2004 2009 2013
V.Vanitcharearnthum (CBS) Income Inequality Sep. 21, 2015 21 / 40

SES Results
2004:Top 1 % Decomposition
36.7 %
Wage
41.8 %
Nonfarm 9.1 %
Farm
2.6 %
Property
7.9 %
Transfer
1.8 %Other
V.Vanitcharearnthum (CBS) Income Inequality Sep. 21, 2015 22 / 40

SES Results
2009:Top 1 % Decomposition
36.5 %
Wage
52.3 %
Business profit
1.12 %
Agriculture profit
10.08 %
Other
V.Vanitcharearnthum (CBS) Income Inequality Sep. 21, 2015 23 / 40

SES Results
2013:Top 1 % Decomposition
68.8 %
Wage
0.55 %
Business profit
30.65 %
Agriculture profit
V.Vanitcharearnthum (CBS) Income Inequality Sep. 21, 2015 24 / 40

SES Results
Sectors in Top 1%
2004 2009 2013
2
3
4
5
6
7
2.7
2.1
4.7
6.8 6.8
5.2
V.Vanitcharearnthum (CBS) Income Inequality Sep. 21, 2015 25 / 40

SES Results
Sectors in Top .1%
2004 2009 2013
2
4
6
2.7
2.1
4.7
7.2 7.4
3.45
V.Vanitcharearnthum (CBS) Income Inequality Sep. 21, 2015 26 / 40
SES Results
2009 2013
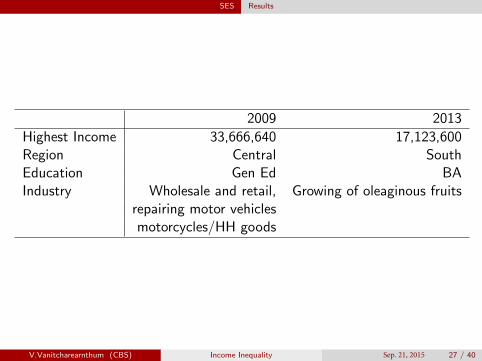
Highest Income 33,666,640 17,123,600Region Central SouthEducation Gen Ed BAIndustry Wholesale and retail, Growing of oleaginous fruits
repairing motor vehiclesmotorcycles/HH goods
V.Vanitcharearnthum (CBS) Income Inequality Sep. 21, 2015 27 / 40

Part II
Tax Returns Data
V.Vanitcharearnthum (CBS) Income Inequality Sep. 21, 2015 28 / 40

Estimation Results
α
α
2004 2005 2006 2007 2008 2009
1.19
1.33
V.Vanitcharearnthum (CBS) Income Inequality Sep. 21, 2015 29 / 40
Estimation Results
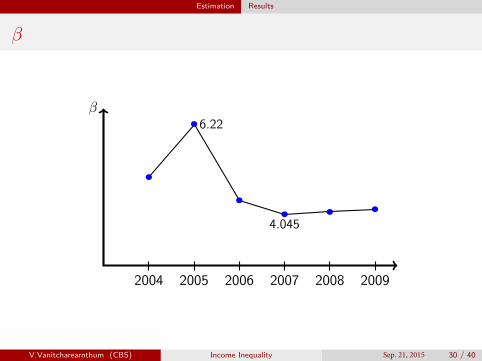
β
β6.22
4.045
2004 2005 2006 2007 2008 2009
V.Vanitcharearnthum (CBS) Income Inequality Sep. 21, 2015 30 / 40

Estimation Results
Threshold Income
Top 1% Top 0.1%
2004 1,152,089.4 7,228,185.02005 1,115,732.9 7,706,655.52006 1,314,671.8 7,772,404.12007 1,301,830.4 7,367,842.52008 1,340,195.0 7,644,198.02009 1,341,256.2 7,717,556.8
V.Vanitcharearnthum (CBS) Income Inequality Sep. 21, 2015 31 / 40

Top Income Shares
Let yx% be the threshold income at the xth percentile.
Under Pareto distribution, we know that the average income aboveyx% is
y∗(yx%) = β · yx%We computed y∗(y1%) and y∗(y.1%)
V.Vanitcharearnthum (CBS) Income Inequality Sep. 21, 2015 32 / 40
Top Income Shares
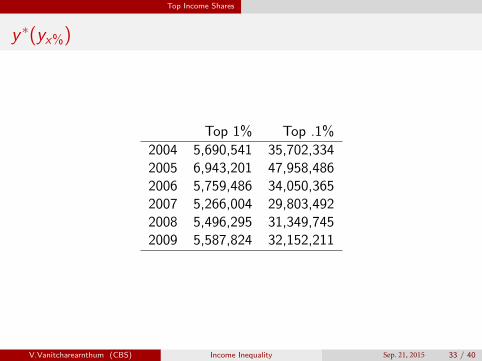
y ∗(yx%)
Top 1% Top .1%
2004 5,690,541 35,702,3342005 6,943,201 47,958,4862006 5,759,486 34,050,3652007 5,266,004 29,803,4922008 5,496,295 31,349,7452009 5,587,824 32,152,211
V.Vanitcharearnthum (CBS) Income Inequality Sep. 21, 2015 33 / 40
Top Income Shares 2 Methods
Tax Base (I)
Use 1% and 0.1% of tax filers to multiply with y∗(yx%)
in order to get the total income in the top 1% and .1% bracket
Then divide those numbers by the net national income in thecorresponding year
V.Vanitcharearnthum (CBS) Income Inequality Sep. 21, 2015 34 / 40

Top Income Shares 2 Methods
Top 1 %
Top .1%
2004 2005 2006 2007 2008 2009
0.0606
0.0343
0.076
0.0527
V.Vanitcharearnthum (CBS) Income Inequality Sep. 21, 2015 35 / 40

Top Income Shares 2 Methods
Tax base (II)
We followed Piketty and Saez (2003) by using tax units instead of taxfilers
V.Vanitcharearnthum (CBS) Income Inequality Sep. 21, 2015 36 / 40

Top Income Shares 2 Methods
Top 1 %
Top .1%
2004 2005 2006 2007 2008 2009
0.4118
0.289
V.Vanitcharearnthum (CBS) Income Inequality Sep. 21, 2015 37 / 40