Embed Size (px)
Citation preview
Policy briefOctober 2013
Recent and future changes in the global and UK climateBob Ward and Naomi Hicks
The ESRC Centre for Climate Change Economics and Policy (CCCEP) was established in 2008 to advance public and private action on climate change through rigorous, innovative research. The Centre is hosted jointly by the University of Leeds and the London School of Economics and Political Science. It is funded by the UK Economic and Social Research Council. More information about the Centre for Climate Change Economics and Policy can be found at: http://www.cccep.ac.uk
The Grantham Research Institute on Climate Change and the Environment was established in 2008 at the London School of Economics and Political Science. The Institute brings together international expertise on economics, as well as finance, geography, the environment, international development and political economy to establish a world-leading centre for policy-relevant research, teaching and training in climate change and the environment. It is funded by the Grantham Foundation for the Protection of the Environment, which also funds the Grantham Institute for Climate Change at Imperial College London. More information about the Grantham Research Institute can be found at: http://www.lse.ac.uk/grantham/
| 1 Recent and future changes in the global and UK climate
Contents
Contents
Summary 3
1. Introduction 4
2. Recent changes in the global climate 5
3. Has global warming stopped? 7
4. Causes of the recent changes in the global climate 8
5. Recent changes in the UK climate 9
6. Future changes in the global climate 12
7. Future changes in the UK climate 14
8. Policy implications 15
Further reading 16
2 | Recent and future changes in the global and UK climate
Acknowledgements and the authors
AcknowledgementsWe are grateful to Sam Fankhauser for his comments and feedback.
This policy brief is intended to inform decision-makers in the public, private and third sectors. It has been reviewed by at least one internal referee before publication. The views expressed in this brief represent those of the authors and do not necessarily represent those of the host institutions or funders.
The authorsBob Ward is Policy and Communications Director at the Grantham Research Institute on Climate Change and the Environment at the London School of Economics and Political Science. He is also a member of the Executive Committee of the Association of British Science Writers, and a member of the Board of the UK’s Science Media Centre. Previously, he has worked at Risk Management Solutions, where he was Director of Public Policy. He also worked at the Royal Society, the UK National Academy of Science, for eight years, until October 2006. He has also worked as a freelance science writer and journalist. Bob has a first degree in geology and is a Fellow of the Geological Society.
Naomi Hicks is Public Communications Manager at the Grantham Research Institute on Climate Change and the Environment at the London School of Economics and Political Science. Prior to joining the Institute, Naomi was a Project Director at communications consultancy Forster, leading a range of communications and research projects across social and environmental issues. Naomi is a Fellow of the Royal Geographical Society.
| 3 Recent and future changes in the global and UK climate
Summary
Summary
This policy brief presents a summary of the scientific evidence about how climate change is affecting the world, and particularly the United Kingdom, and its policy implications, based on the contribution of working group I to the Fifth Assessment Report of the Intergovernmental Panel on Climate Change (IPCC), which was published in September 2013.
The Earth is warming. Almost the entire globe has warmed, including the land surface, oceans and atmosphere, while the extent of snow and ice cover has also decreased and sea level has risen. Global average surface temperature has increased by 0.85°C since 1880, and by about 0.6°C to 0.7°C since 1950.
The IPCC report notes that the rate of increase in global average surface temperature has fluctuated over the past century and, for instance, was about 0.05°C per decade between 1998 and 2012, compared with an underlying rate of about 0.12°C per decade between 1951 and 2012.
The authors of the IPCC report have concluded that it is extremely likely, or 95 per cent probable, that most of the warming of about 0.6°C to 0.7°C since 1950 is due to human activities, such as burning fossil fuels and deforestation. This is an expert judgement based on all of the available evidence and research.
The global trends in climate are reflected in the UK Met Office’s rainfall and temperature records, which begin in 1910. The average annual UK temperature increased by about 0.589°C between 1910-1939 and 1983-2012, and the seven warmest years on record have all occurred since 2000. Total annual rainfall has also been increasing since about 1970, and six of the ten wettest years on record have all occurred within the last 15 years.
The IPCC report considers four different scenarios for how greenhouse gas levels might change over this century. In the three highest concentration scenarios, carbon dioxide levels continue to increase beyond the end of the century, whereas in the lowest scenario, concentrations peak and then start to decline before the end of the century.
In the lowest scenario (RCP2.6), there is a 33 per cent or lower probability of global average surface temperature increasing to more than 2°C above its late 19th century level by 2100. In the two highest concentration scenarios (RCP8.5 and RCP6.0), global average temperature has a 66 per cent or higher chance of exceeding global warming of 2°C by 2100, and in the other scenario (RCP4.5), global average temperature has a 50 per cent or higher probability of exceeding global warming of 2°C by 2100.
This IPCC report indicates, for the first time in the IPCC’s history, that to have at least a 50 per cent chance of avoiding warming of more than 2°C above late 19th century levels, the total cumulative budget of carbon dioxide and other greenhouse gases that can be emitted from human activities will have to be limited to no more than between about 820 and 1445 billion tonnes. At current rates of annual emissions, this budget would be exhausted within about 30 years, and even sooner if emissions continue to increase.
4 | Recent and future changes in the global and UK climate
1. Introduction
1. Introduction
This policy brief presents a summary of the scientific evidence about how climate change is affecting the world, and particularly the United Kingdom, and its policy implications, based on the draft contribution of working group I to the Fifth Assessment Report of the Intergovernmental Panel on Climate Change (IPCC), which was published in September 2013.
The report of IPCC working group I is the most comprehensive assessment of the physical science basis of climate change that has ever been written, and it is one of the most important scientific documents ever produced. It has been prepared by 259 scientific experts from universities and research institutes in 39 countries, who have reviewed all of the available evidence and research, including thousands of scientific papers. More than 9000 individual scientific papers are cited within the report.
It is also one of the most rigorously reviewed scientific documents in history, with more than 50,000 comments made during a review process for earlier drafts that was made open to all experts around the world.
The report has been written for the 195 member governments of the IPCC, and represents the most authoritative assessment of the state of knowledge about the physical science basis of climate change. It should also inform decision-making at local, regional, national and international level.
Box 1. The Intergovernmental Panel on Climate ChangeThe Intergovernmental Panel on Climate Change (IPCC) was established in 1988. Its members are the 195 governments that are also members of the World Meteorological Organisation and the United Nations Environment Programme, and its role is “to assess on a comprehensive, objective, open and transparent basis the scientific, technical and socio-economic information relevant to understanding the scientific basis of risk of human-induced climate change, its potential impacts and options for adaptation and mitigation”.
The IPCC produces assessment reports every five or six years. The First Assessment Report was published in 1990, with the Second in 1995, the Third in 2001 and the Fourth in 2007. To produce each report, the member governments nominate researchers who have relevant expertise in their countries to become authors and editors. The authors and editors are organised into three working groups on: the physical science basis; impacts, adaptation and vulnerability; and mitigation. Member governments formally accept the contents of each working group’s contribution and approve a ‘Summary for Policymakers’ for each.
The Fifth Assessment Report is due to be published in 2013 and 2014 in four parts. Working group I published its summary in September 2013. Working group II will publish its summary in March 2014, followed by working group III in April 2014. A synthesis report will be published in October 2014.
| 5 Recent and future changes in the global and UK climate
2. Recent changes in the global climate
2. Recent changes in the global climate
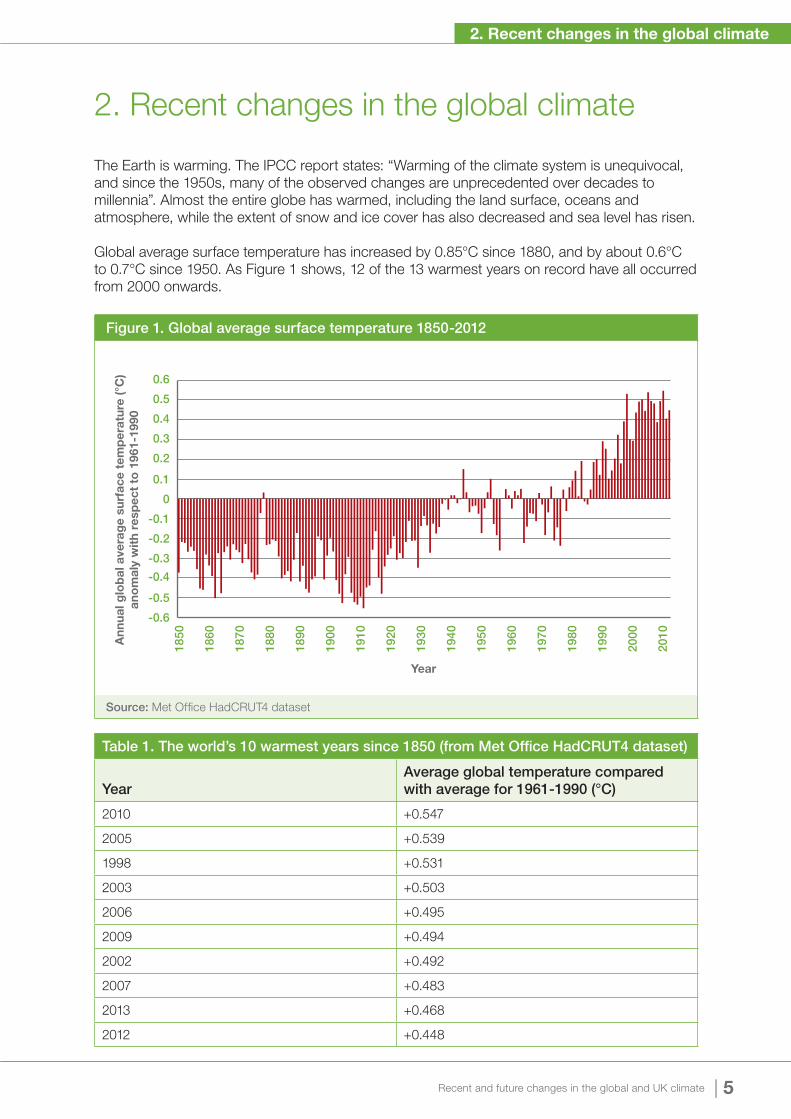
The Earth is warming. The IPCC report states: “Warming of the climate system is unequivocal, and since the 1950s, many of the observed changes are unprecedented over decades to millennia”. Almost the entire globe has warmed, including the land surface, oceans and atmosphere, while the extent of snow and ice cover has also decreased and sea level has risen.
Global average surface temperature has increased by 0.85°C since 1880, and by about 0.6°C to 0.7°C since 1950. As Figure 1 shows, 12 of the 13 warmest years on record have all occurred from 2000 onwards.
Table 1. The world’s 10 warmest years since 1850 (from Met Office HadCRUT4 dataset)
YearAverage global temperature compared with average for 1961-1990 (°C)
2010 +0.547
2005 +0.539
1998 +0.531
2003 +0.503
2006 +0.495
2009 +0.494
2002 +0.492
2007 +0.483
2013 +0.468
2012 +0.448
Figure 1. Global average surface temperature 1850-2012
Ann
ual g
lob
al a
vera
ge
surf
ace
tem
per
atur
e (°
C)
ano
mal
y w
ith
resp
ect
to 1
961-
1990
-0.6
-0.5
-0.4
-0.3
-0.2
-0.1
0
0.1
0.2
0.3
0.4
0.5
0.6
2000
1990
1980
1970
1960
1950
1940
1930
1920
1910
1900
1890
1880
1870
1860
1850
2010
Year
Source: Met Office HadCRUT4 dataset
6 | Recent and future changes in the global and UK climate
2. Recent changes in the global climate
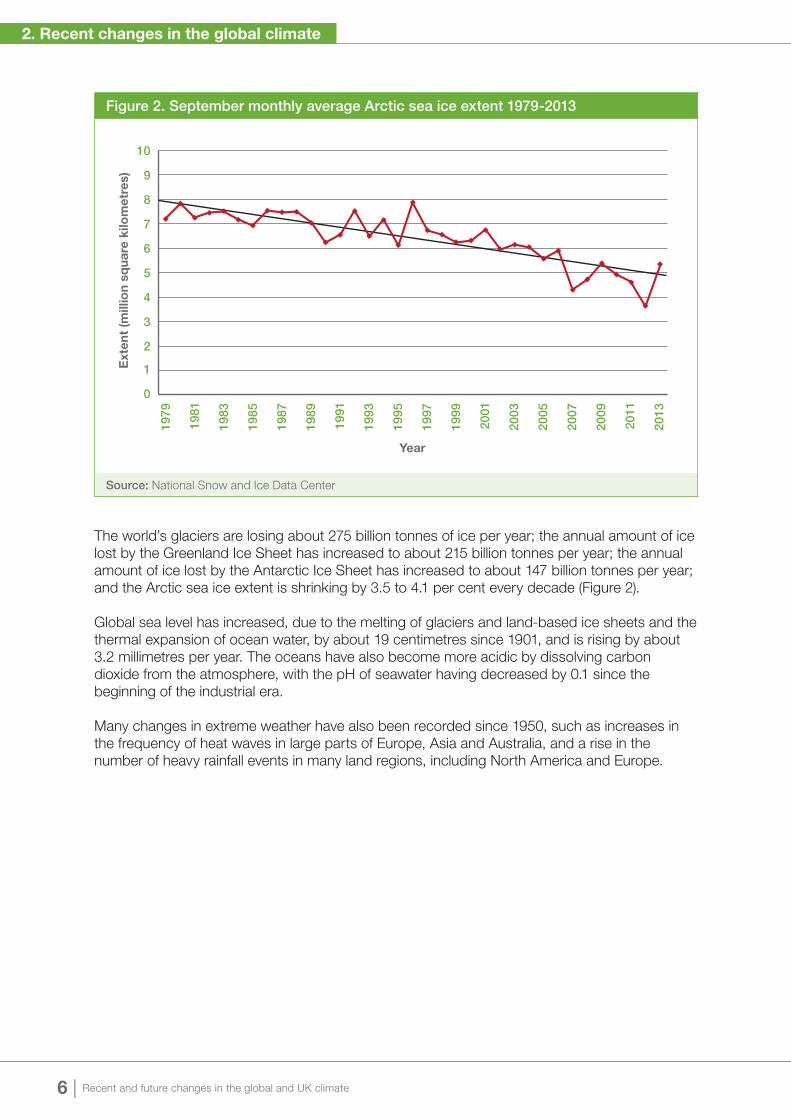
The world’s glaciers are losing about 275 billion tonnes of ice per year; the annual amount of ice lost by the Greenland Ice Sheet has increased to about 215 billion tonnes per year; the annual amount of ice lost by the Antarctic Ice Sheet has increased to about 147 billion tonnes per year; and the Arctic sea ice extent is shrinking by 3.5 to 4.1 per cent every decade (Figure 2).
Global sea level has increased, due to the melting of glaciers and land-based ice sheets and the thermal expansion of ocean water, by about 19 centimetres since 1901, and is rising by about 3.2 millimetres per year. The oceans have also become more acidic by dissolving carbon dioxide from the atmosphere, with the pH of seawater having decreased by 0.1 since the beginning of the industrial era.
Many changes in extreme weather have also been recorded since 1950, such as increases in the frequency of heat waves in large parts of Europe, Asia and Australia, and a rise in the number of heavy rainfall events in many land regions, including North America and Europe.
Figure 2. September monthly average Arctic sea ice extent 1979-2013
0
1
2
3
4
5
6
7
8
9
10
Ext
ent
(mill
ion
squa
re k
ilom
etre
s)
2011
2009
2007
2005
2003
2001
1999
1997
1995
1993
1991
1989
1987
1985
1983
1981
1979
2013
Year
Source: National Snow and Ice Data Center
| 7 Recent and future changes in the global and UK climate
3. Has global warming stopped?
3. Has global warming stopped?
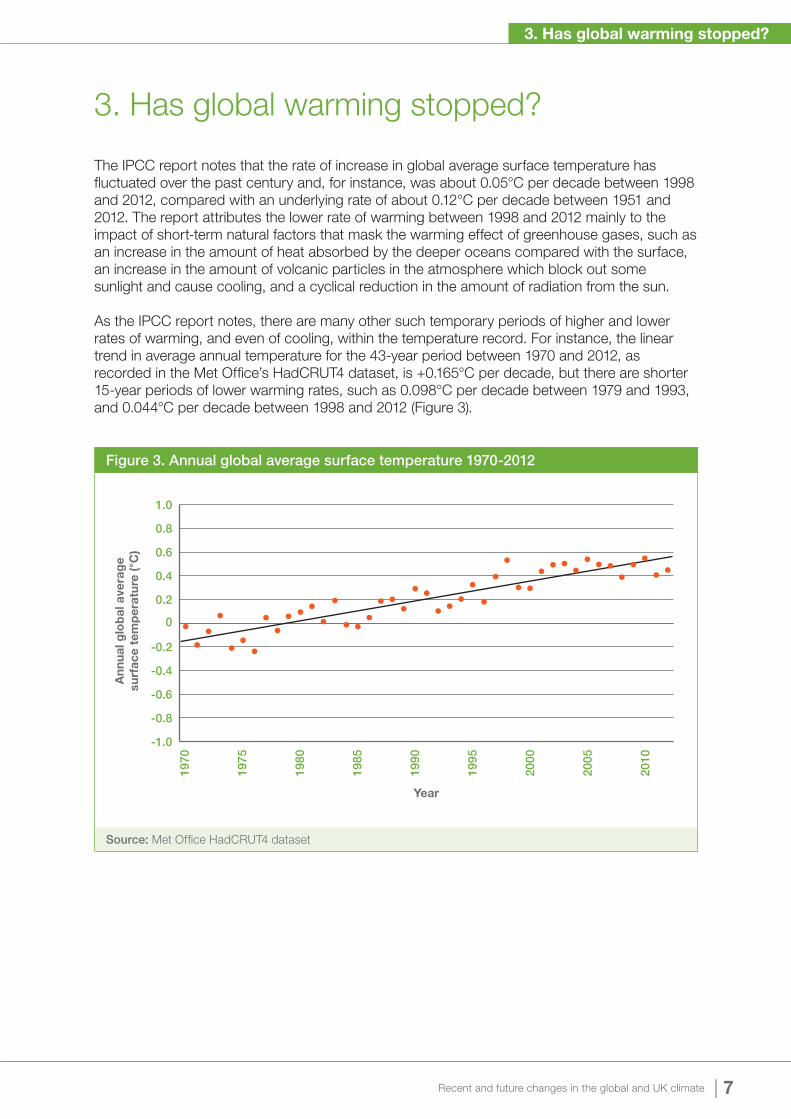
The IPCC report notes that the rate of increase in global average surface temperature has fluctuated over the past century and, for instance, was about 0.05°C per decade between 1998 and 2012, compared with an underlying rate of about 0.12°C per decade between 1951 and 2012. The report attributes the lower rate of warming between 1998 and 2012 mainly to the impact of short-term natural factors that mask the warming effect of greenhouse gases, such as an increase in the amount of heat absorbed by the deeper oceans compared with the surface, an increase in the amount of volcanic particles in the atmosphere which block out some sunlight and cause cooling, and a cyclical reduction in the amount of radiation from the sun.
As the IPCC report notes, there are many other such temporary periods of higher and lower rates of warming, and even of cooling, within the temperature record. For instance, the linear trend in average annual temperature for the 43-year period between 1970 and 2012, as recorded in the Met Office’s HadCRUT4 dataset, is +0.165°C per decade, but there are shorter 15-year periods of lower warming rates, such as 0.098°C per decade between 1979 and 1993, and 0.044°C per decade between 1998 and 2012 (Figure 3).
Figure 3. Annual global average surface temperature 1970-2012
Ann
ual g
lob
al a
vera
ge
surf
ace
tem
per
atur
e (°
C)
-1.0
-0.8
-0.6
-0.4
-0.2
0
0.2
0.4
0.6
0.8
1.0
2005
2000
1995
1990
1985
1980
1975
1970
2010
Year
Source: Met Office HadCRUT4 dataset
8 | Recent and future changes in the global and UK climate
4. Causes of the recent changes in the global climate
4. Causes of the recent changes in the global climate
The authors of the IPCC report have concluded that it is extremely likely, or 95 per cent probable, that most of the warming of about 0.6°C to 0.7°C since 1950 is due to human activities, such as burning fossil fuels and deforestation. This is an expert judgement based on all of the available evidence and research. The IPCC Fourth Assessment Report in 2007 concluded that it was 90 per cent probable that human activities were responsible for most of the warming since 1950.
The authors of the contribution of working group I to the Fifth Assessment Report concluded that they have high confidence that changes in the sun’s energy have not contributed to global warming since satellite measurements began in 1986. Furthermore they found that there is no robust link between cosmic rays and cloud cover which could have affected global temperature.
Meanwhile, carbon dioxide levels in the atmosphere are now about 390 parts per million, about 40 per cent higher than they were in 1750, before industrialisation (when they were about 280 parts per million), due to the burning of fossil fuels and deforestation. Concentrations of other greenhouse gases, such as methane, have also risen during this period due to human activities. Aerosols of particles such as carbon and sulphur dioxide that are emitted by volcanoes and industrial processes have offset a lot of the warming effect that is caused by the rising greenhouse gas concentrations in the atmosphere.
Box 2. The scientific consensus on climate changeThere is a clear scientific consensus that the Earth is warming due to human activities, such as burning fossil fuels and deforestation. There are four main ways in which this consensus manifests itself.
1. The 259 authors of IPCC working group I have assessed all of the available research and evidence and concluded that it is 95 per cent probable that most of the warming since 1950 is due to human activities.
2. Analyses of peer-reviewed journal papers (e.g. Oreskes, 2004; Powell, 2012; Cook et al., 2013) show that less than 1 per cent disagree that human activities are the major contributor to climate change.
3. Surveys (e.g. Doran & Zimmerman, 2009) show that more than 97 per cent of climate researchers who are publishing scientific papers agree that human activity is a significant contributor to rising global average temperature.
4. All of the world’s major scientific organisations, including national academies of science such as the Royal Society, agree that human activities are the major contributor to recent climate change.
| 9 Recent and future changes in the global and UK climate
5. Recent changes in the UK climate
5. Recent changes in the UK climate
The contribution of IPCC working group I to the Fifth Assessment Report addresses recent changes in regional as well as global climate. However, the report does not specifically address the UK, which covers less than 0.05 per cent of the Earth’s surface, but it does include a number of observations about Europe.
In addition to the global trend of decreasing cold days and nights, increasing warm days and nights, and an increase in heavy rainfall in many land regions, the report concludes that there is a 66 per cent or higher chance that since 1950 the frequency of heat waves, as well as the frequency or intensity of heavy rainfall, have increased in large parts of Europe.
These trends are reflected in the UK Met Office’s rainfall and temperature records, which begin in 1910.
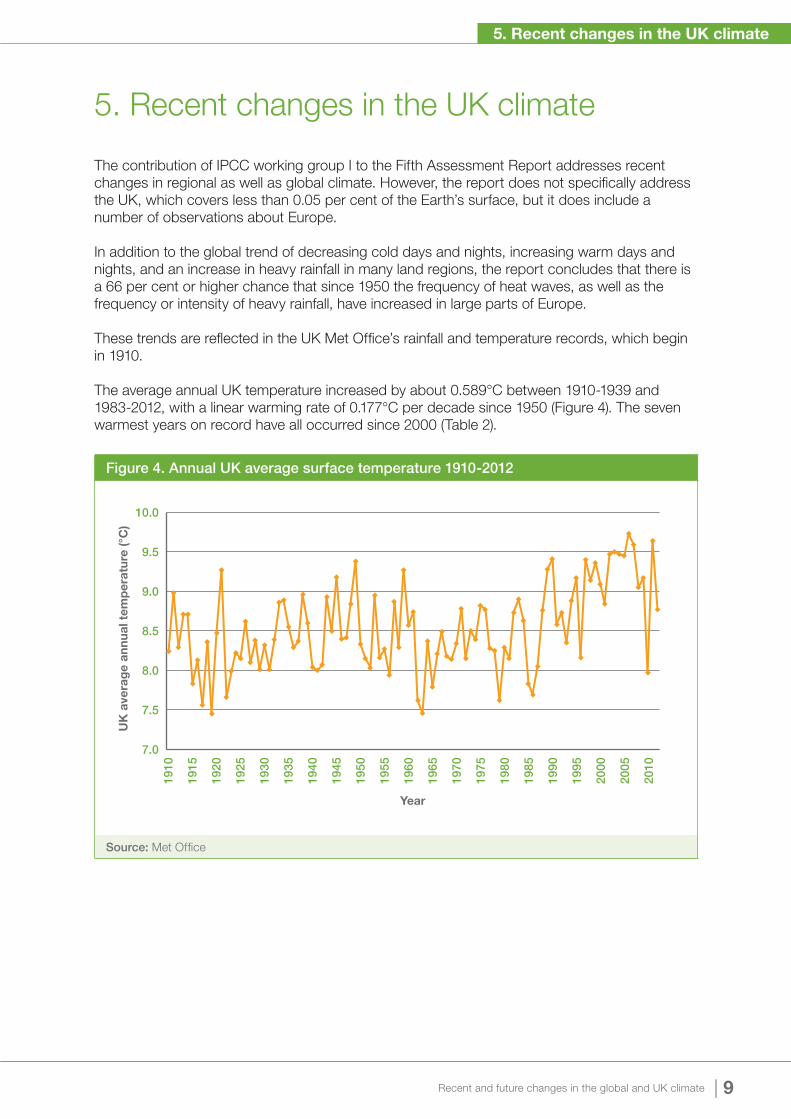
The average annual UK temperature increased by about 0.589°C between 1910-1939 and 1983-2012, with a linear warming rate of 0.177°C per decade since 1950 (Figure 4). The seven warmest years on record have all occurred since 2000 (Table 2).
Figure 4. Annual UK average surface temperature 1910-2012
UK
ave
rag
e an
nual
tem
per
atur
e (°
C)
7.0
7.5
8.0
8.5
9.0
9.5
10.0
2005
2000
1995
1990
1985
1980
1975
1970
1965
1960
1955
1950
1945
1940
1935
1930
1925
1920
1915
1910
2010
Year
Source: Met Office
10 | Recent and future changes in the global and UK climate
5. Recent changes in the UK climate
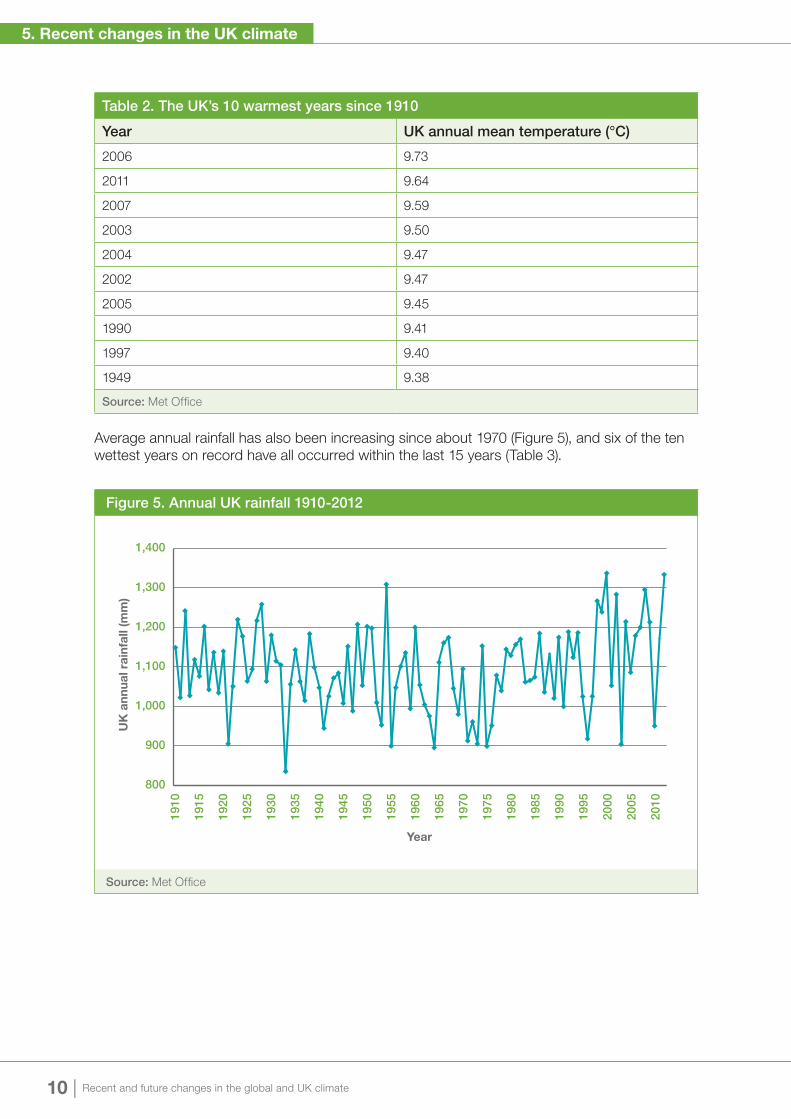
Table 2. The UK’s 10 warmest years since 1910
Year UK annual mean temperature (°C)
2006 9.73
2011 9.64
2007 9.59
2003 9.50
2004 9.47
2002 9.47
2005 9.45
1990 9.41
1997 9.40
1949 9.38
Source: Met Office
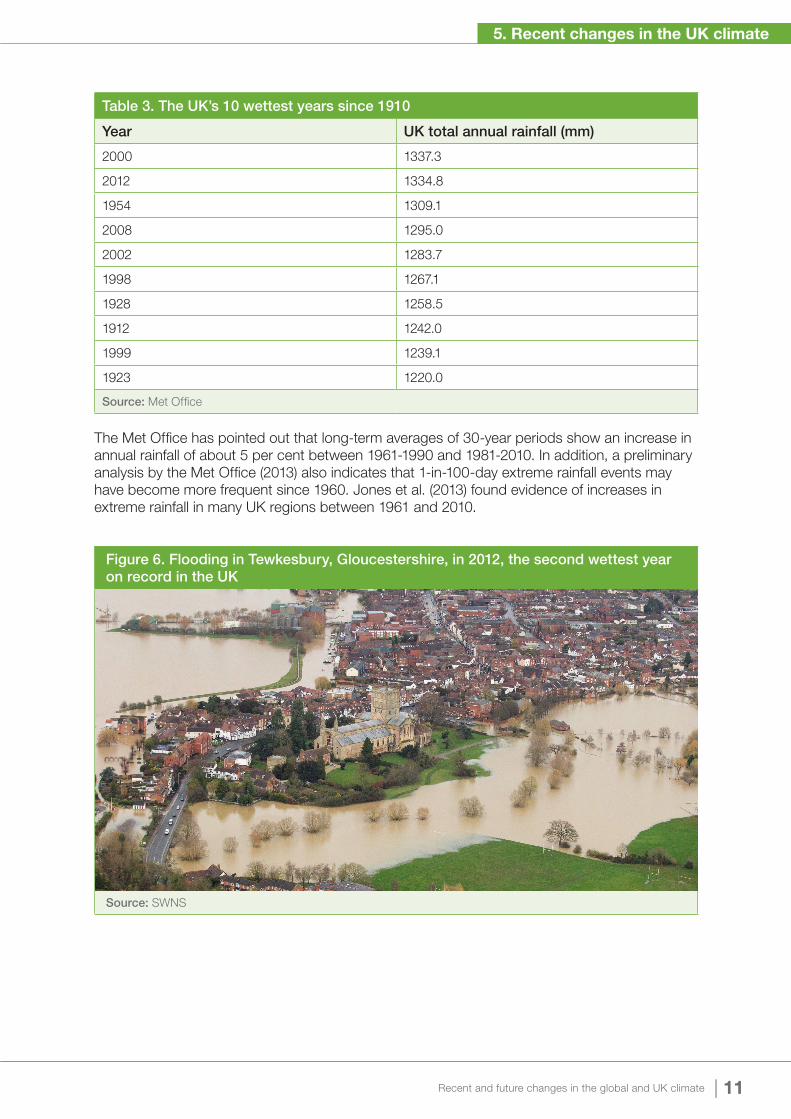
Average annual rainfall has also been increasing since about 1970 (Figure 5), and six of the ten wettest years on record have all occurred within the last 15 years (Table 3).
Figure 5. Annual UK rainfall 1910-2012
UK
ann
ual r
ainf
all (
mm
)
800
900
1,000
1,100
1,200
1,300
1,400
2005
2000
1995
1990
1985
1980
1975
1970
1965
1960
1955
1950
1945
1940
1935
1930
1925
1920
1915
1910
2010
Year
Source: Met Office
| 11 Recent and future changes in the global and UK climate
5. Recent changes in the UK climate
Table 3. The UK’s 10 wettest years since 1910
Year UK total annual rainfall (mm)
2000 1337.3
2012 1334.8
1954 1309.1
2008 1295.0
2002 1283.7
1998 1267.1
1928 1258.5
1912 1242.0
1999 1239.1
1923 1220.0
Source: Met Office
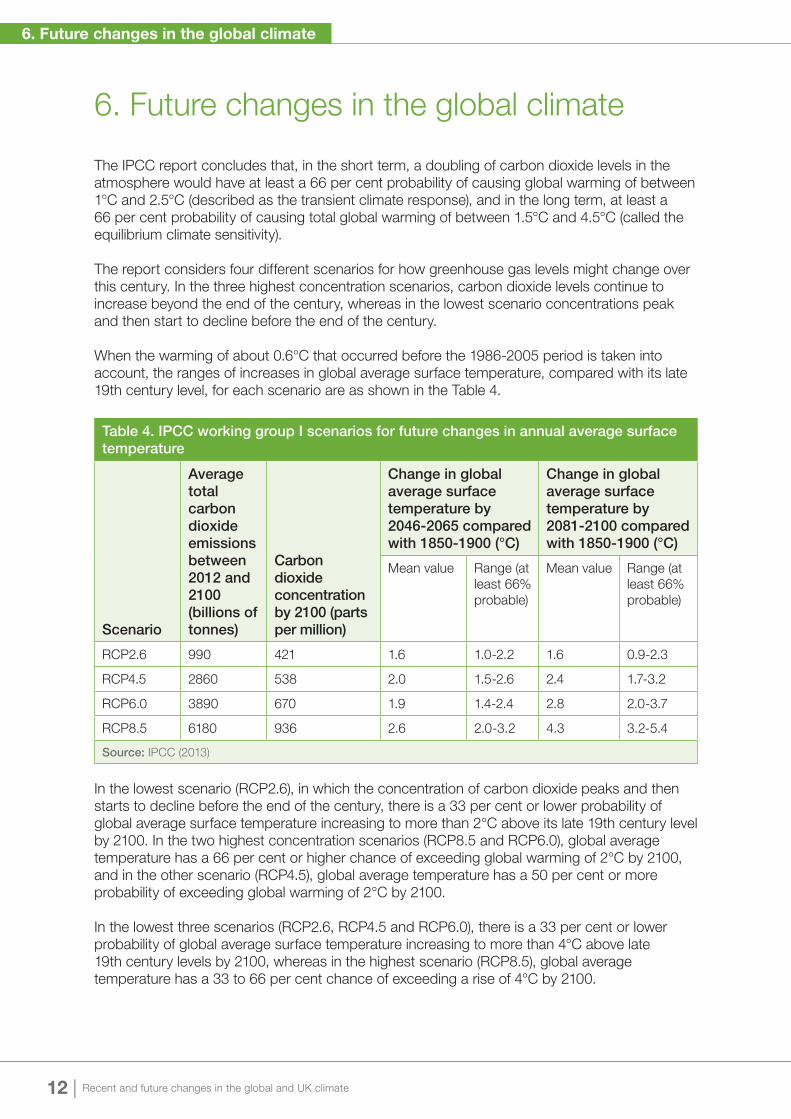
The Met Office has pointed out that long-term averages of 30-year periods show an increase in annual rainfall of about 5 per cent between 1961-1990 and 1981-2010. In addition, a preliminary analysis by the Met Office (2013) also indicates that 1-in-100-day extreme rainfall events may have become more frequent since 1960. Jones et al. (2013) found evidence of increases in extreme rainfall in many UK regions between 1961 and 2010.
Figure 6. Flooding in Tewkesbury, Gloucestershire, in 2012, the second wettest year on record in the UK
Source: SWNS
12 | Recent and future changes in the global and UK climate
6. Future changes in the global climate
6. Future changes in the global climate
The IPCC report concludes that, in the short term, a doubling of carbon dioxide levels in the atmosphere would have at least a 66 per cent probability of causing global warming of between 1°C and 2.5°C (described as the transient climate response), and in the long term, at least a 66 per cent probability of causing total global warming of between 1.5°C and 4.5°C (called the equilibrium climate sensitivity).
The report considers four different scenarios for how greenhouse gas levels might change over this century. In the three highest concentration scenarios, carbon dioxide levels continue to increase beyond the end of the century, whereas in the lowest scenario concentrations peak and then start to decline before the end of the century.
When the warming of about 0.6°C that occurred before the 1986-2005 period is taken into account, the ranges of increases in global average surface temperature, compared with its late 19th century level, for each scenario are as shown in the Table 4.
Table 4. IPCC working group I scenarios for future changes in annual average surface temperature
Scenario
Average total carbon dioxide emissions between 2012 and 2100 (billions of tonnes)
Carbon dioxide concentration by 2100 (parts per million)
Change in global average surface temperature by 2046-2065 compared with 1850-1900 (°C)
Change in global average surface temperature by 2081-2100 compared with 1850-1900 (°C)
Mean value Range (at least 66% probable)
Mean value Range (at least 66% probable)
RCP2.6 990 421 1.6 1.0-2.2 1.6 0.9-2.3
RCP4.5 2860 538 2.0 1.5-2.6 2.4 1.7-3.2
RCP6.0 3890 670 1.9 1.4-2.4 2.8 2.0-3.7
RCP8.5 6180 936 2.6 2.0-3.2 4.3 3.2-5.4
Source: IPCC (2013)
In the lowest scenario (RCP2.6), in which the concentration of carbon dioxide peaks and then starts to decline before the end of the century, there is a 33 per cent or lower probability of global average surface temperature increasing to more than 2°C above its late 19th century level by 2100. In the two highest concentration scenarios (RCP8.5 and RCP6.0), global average temperature has a 66 per cent or higher chance of exceeding global warming of 2°C by 2100, and in the other scenario (RCP4.5), global average temperature has a 50 per cent or more probability of exceeding global warming of 2°C by 2100.
In the lowest three scenarios (RCP2.6, RCP4.5 and RCP6.0), there is a 33 per cent or lower probability of global average surface temperature increasing to more than 4°C above late 19th century levels by 2100, whereas in the highest scenario (RCP8.5), global average temperature has a 33 to 66 per cent chance of exceeding a rise of 4°C by 2100.
| 13 Recent and future changes in the global and UK climate
6. Future changes in the global climate
As global average temperature increases, there is a 90 per cent or higher chance that heat waves will increase in frequency and duration, dry regions will become drier and wet regions will become wetter. It is at least 90 per cent probable that extreme rainfall events will become more intense and more frequent in some regions, and there is a 66 per cent or higher chance that the area covered by monsoons will grow, while also becoming longer and producing stronger rainfall.
In the lowest concentration scenario (RCP2.6), there is 66 per cent or higher probability that sea level in 2081-2100 will be 26 to 55 centimetres higher than in 1986-2005, while in the highest scenario, sea levels will be 45 to 82 centimetres higher, although the rise could be tens of centimetres larger if parts of the Antarctic Ice Sheet above the ocean collapse. Beyond 2100, a few models project that sea level could rise by 1 to 3 metres, or more, if carbon dioxide concentrations are higher than 700 parts per million. The available evidence also suggests that global warming of between 1 and 4°C, above late 19th century levels, over 1000 years or more could cause almost the entire loss of the Greenland Ice Sheet, raising global sea level by up to 7 metres.
In the highest concentration scenario (RCP8.5), there is 66 per cent or higher chance that the Arctic Ocean will be nearly ice-free in summers by 2050, and glacier volumes could reduce by between 35 and 85 per cent.
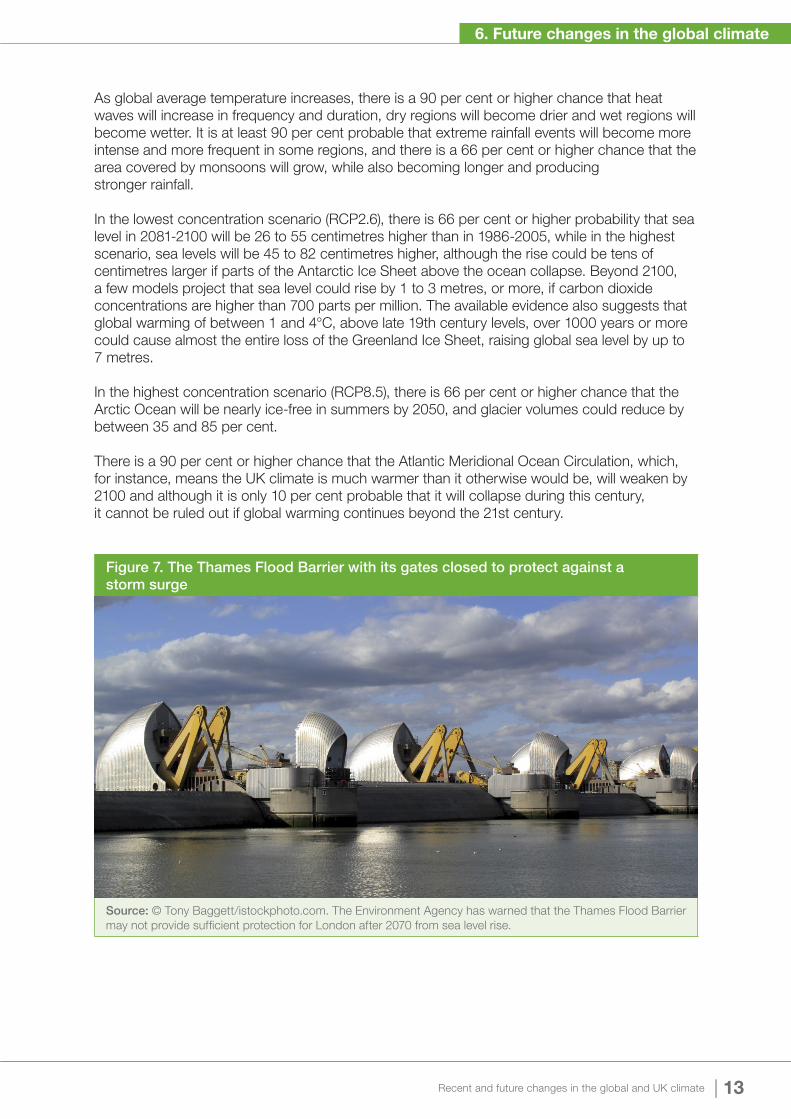
There is a 90 per cent or higher chance that the Atlantic Meridional Ocean Circulation, which, for instance, means the UK climate is much warmer than it otherwise would be, will weaken by 2100 and although it is only 10 per cent probable that it will collapse during this century, it cannot be ruled out if global warming continues beyond the 21st century.
Figure 7. The Thames Flood Barrier with its gates closed to protect against a storm surge
Source: © Tony Baggett/istockphoto.com. The Environment Agency has warned that the Thames Flood Barrier may not provide sufficient protection for London after 2070 from sea level rise.
14 | Recent and future changes in the global and UK climate
7. Future changes in the UK climate
7. Future changes in the UK climate
The contribution of IPCC working group I to the Fifth Assessment Report addresses future changes in regional as well as global climate. However, the report does not specifically address the UK, which covers less than 0.05 per cent of the Earth’s surface, but it does include a number of observations about Europe.
In addition to the projected changes in global annual average surface temperature, the IPCC report draws attention to several studies which suggest that the hottest European summer temperatures are projected to warm faster than average temperatures. It also indicates that rare cold weather events will become even less frequent as average winter temperature increases, but warns “cold winters in Europe will continue to occur in coming decades, despite an overall warming”.
The IPCC report also indicates that there is a 90 per cent probability that increases in Northern European winter rainfall by the end of this century will result from more precipitation from storms. The tracks of storms in the North Atlantic could also shift, and some models indicate that storm activity over Western Europe could increase by 50 per cent. Intense cyclones could also become more frequent.
The UKCP09 climate projections for the UK, which were published in 2009, were based on an earlier generation of climate models than have been used for the IPCC Fifth Assessment Report. The projections indicated, for instance, that under a ‘medium emissions scenario’, all areas of the UK would be warmer by the 2080s, and that temperatures would rise faster in summer than in winter. In southern England, there would be a 50 per cent probability that average summer temperature would be 4.2°C warmer than the baseline average for the period 1961-1990, with smaller increases elsewhere in the UK. The models indicate no clear changes in annual rainfall, although winter precipitation would increase by about 33 per cent along the western side of the UK.
The rise in global sea level will have varying effects on local sea level around the coast of the UK. For instance, local sea level rise will be larger in south-east England, which is currently sinking at a rate of about 1.5 millimetres per year due to on-going adjustments of the land following the retreat of the ice sheets at the end of the last Ice Age.
| 15 Recent and future changes in the global and UK climate
8. Policy implications
8. Policy implications
Since the publication of the last IPCC report in 2007, governments have agreed that global emissions of greenhouse gases should be reduced urgently in order to hold the increase in global average temperature below 2°C and so limit the risks of dangerous climate change.
In addition, Parliament passed the Climate Change Act in 2008, requiring the UK to reduce its greenhouse gas emissions by at least 80 per cent by 2050, compared with 1990. The UK 2050 emissions target was set on the basis of interim advice from members of the Committee on Climate Change (Turner, 2008), who indicated that it would be consistent with the task of reducing global annual emissions of greenhouse gases covered by the Kyoto Protocol, to about 20 billion tonnes of carbon-dioxide-equivalent by 2050, in line with the goal of limiting global warming to no more than 2°C by 2100, and creating a low probability of warming of 4°C.
The contribution of IPCC working group I to the Fifth Assessment Report points out that during the last Ice Age interglacial period, which ended about 116,000 years ago, global mean surface temperature was at least 2°C warmer than its late 19th century level, global sea levels were about 5 to 10 metres higher than today, and the Greenland and Antarctic Ice Sheets were much smaller.
This report indicates, for the first time in the IPCC’s history, that to have at least a 50 per cent chance of avoiding warming of more than 2°C above pre-industrial level, the total cumulative amount of carbon dioxide that is emitted into the atmosphere by human activities must be less than about 4440 billion tonnes (equivalent to about 1210 billion tonnes of carbon), or about 3080 billion tonnes when other greenhouse gases and aerosol particles from human activities are taken into account.
The amount of carbon dioxide that was emitted from the late 19th century up to 2011 was between 1635 and 2260 billion tonnes (equivalent to 446 to 616 billion tonnes of carbon), leaving a remaining budget of between about 820 and 1445 billion tonnes (equivalent to 224 to 394 billion tonnes of carbon) for carbon dioxide and all other emissions from human activities.
At present, global annual emissions of the greenhouse gases covered by the Kyoto Protocol are about 50 billion tonnes of carbon-dioxide-equivalent, which means, if emissions remain at today’s level, the budget would be exhausted in less than about 30 years, and even sooner if annual emissions continue to rise. Of the IPCC scenarios, only RCP2.6 would remain within the budget up to 2100.
The report also considers some alternative methods of avoiding global warming other than by reducing emissions of greenhouse gases. Geoengineering methods to remove carbon dioxide from the atmosphere have limited potential on a global scale. Another geoengineering method, called solar radiation management because it blocks out some of the Sun’s energy, could potentially offset a substantial amount of global warming, but would also affect patterns of rainfall and would not stop further ocean acidification.
16 | Recent and future changes in the global and UK climate
Further reading
Further reading
Cook, J., Nuccitelli, D., Green, S.A., Richardson, M., Winkler, B., Painting, R., Way, R., Jacobs, P., & Skuce, A., 2013. Quantifying the consensus on anthropogenic global warming in the scientific literature. Environmental Research Letters, 8 (2), DOI:10.1088/1748-9326/8/2/024024
Doran, P.T., & Zimmerman, M.K., 2009. Examining the scientific consensus on climate change. Eos, 90 (3), pp.22.
Intergovernmental Panel on Climate Change, 2013. Climate Change 2013: The Physical Science Basis. Contribution of Working Group I to the Fifth Assessment Report of the Intergovernmental Panel on Climate Change. [pdf] Geneva: Intergovernmental Panel on Climate Change. Available at: http://www.climatechange2013.org/images/uploads/WGIAR5-SPM_Approved27Sep2013.pdf [Accessed 10 October 2013].
Jenkins, G. J., Murphy, J. M., Sexton, D. M. H., Lowe, J. A., Jones, P. & Kilsby, C. G., 2009. UK Climate Projections: Briefing report. [pdf] Exeter: Met Office Hadley Centre. Available at: http://ukclimateprojections.defra.gov.uk/media.jsp?mediaid=87868&filetype=pdf [Accessed 10 October 2013].
Jones, M.R., Blenkinsop, S., Fowler, H.J., & Kilsby, C.G., 2013. Objective classification of extreme rainfall regions for the UK and updated estimates of trends in regional extreme rainfall. International Journal of Climatology, DOI: 10.1002/joc.3720.
Met Office, 2013. Statistics for December and 2012 – is the UK getting wetter? News release, 3 January 2013. [online] Available at: http://www.metoffice.gov.uk/news/releases/archive/2013/2012-weather-statistics [Accessed 10 October 2013].
Oreskes, N., 2004. The scientific consensus on climate change. Science, 306 (5072), pp.1686.
Powell, J.L., 2012. Science and global warming. Available at: http://www.jamespowell.org/index.html
The Royal Society, 2010. Climate change: a summary of the science. [pdf] Available at: http://royalsociety.org/uploadedFiles/Royal_Society_Content/policy/publications/2010/4294972962.pdf
Turner, A., 2008. Interim advice by the Committee on Climate Change. [pdf] Letter from Lord Turner of Ecchinswell to the Secretary of State for Energy and Climate Change. 7 October. London: CCC. Available at: http://www.theccc.org.uk/wp-content/uploads/2013/03/Interim-report-letter-to-DECC-SofS-071008.pdf

Typeset by The Digital Parent Company Ltd, www.digitalparentcompany.com
Printed on 100% recycled paper.