Embed Size (px)
Citation preview

RECENT ADVANCES on ENERGY, ENVIRONMENT, ECOSYSTEMS, and
DEVELOPMENT
Proceedings of the International Conference on Energy, Environment, Ecosystems, and Development (EEED 2015)
Barcelona, Spain April 7‐9, 2015
RECENT ADVANCES on ENERGY, ENVIRONMENT, ECOSYSTEMS, and DEVELOPMENT
Proceedings of the International Conference on Energy, Environment, Ecosystems, and Development (EEED 2015)
Barcelona, Spain April 7‐9, 2015
Copyright © 2015, by the editors
All the copyright of the present book belongs to the editors. All rights reserved. No part of this publication may be reproduced, stored in a retrieval system, or transmitted in any form or by any means, electronic, mechanical, photocopying, recording, or otherwise, without the prior written permission of the editors.
All papers of the present volume were peer reviewed by no less than two independent reviewers. Acceptance was granted when both reviewers' recommendations were positive.
Series: Energy, Environmental and Structural Engineering Series | 34 ISSN: 2227‐4359 ISBN: 978‐1‐61804‐291‐0

RECENT ADVANCES on ENERGY, ENVIRONMENT, ECOSYSTEMS, and
DEVELOPMENT
Proceedings of the International Conference on Energy, Environment, Ecosystems, and Development (EEED 2015)
Barcelona, Spain April 7‐9, 2015


Organizing Committee Editors: Professor Nikos E. Mastorakis, Technical University of Sofia, Bulgaria Professor Imre Rudas, Obuda University, Budapest, Hungary Professor Marina V. Shitikova, Voronezh State University of Architecture and Civil Engineering, Russia Professor Yuriy S. Shmaliy, Universidad de Guanajuato, Salamanca, Mexico Program Committee: Prof. Bharat Doshi, John Hopkins University, Mayrland, USA Prof. Gang Yao, University of Illinois at Urbana ‐Champaign, USA Prof. Lu Peng, Luisian State University, Baton Rouge, LA, USA Prof. Y. Baudoin, Royal Military Academy, Brussels, Belgium Prof. Fotios Rigas, School of Chemical Engineering, National Technical University of Athens, Greece. Prof. S. Sohrab, Northwestern University, IL, USA Prof. A. Stamou, National Technical University of Athens, Greece Prof. A. I. Zouboulis, Dept. of Chemistry, Aristotle University of Thessaloniki, Greece. Prof. Z. A. Vale, ISEP ‐ Instituto Superior de Engenharia do Porto Rua Antonio Bernardino de Almeida, Portugal Prof. M. Heiermann, Department of Technology Assessment and Substance Flow, Potsdam, Germany Prof. I. Kazachkov, National Technical University of Ukraine (NTUU KPI ), Kyiv, Ukraine Prof. A. M.A. Kazim, UAE University, United Arab Emirates Prof. A. Kurbatskiy, Novosibirsk State University, Department of Physics, Russia Prof. S. Linderoth, Head of Research on Fuel Cells and Materials Chemistry at Riso National Laboratory. Denmark Prof. P. Lunghi, Dipartimento di Ingegneria Industriale, University degli Studi di Perugia, Italy Prof. J. Van Mierlo, Department of Electrotechnical Engineering and Energy Technology (ETEC) Vrije Universiteit Brussel, Belgium Prof. Pavel Loskot, Swansea University, UK Prof. N. Afgan, UNESCO Chair Holder, Instituto Superior Tecnico, Lisbon, Portugal Prof. F. Akgun, Gebze Kocaeli, Turkey Prof. Fernando Alvarez, Prof. of Economics, University of Chicago, USA Prof. Mark J. Perry, Prof. of Finance and Business Economics, University of Michigan‐Flit, USA Prof. Biswa Nath Datta, IEEE Fellow, Distinguished Research Professor, Northern Illinois University, USA Prof. Panos Pardalos, Director, Center for Applied Optimization, University of Florida, USA Prof. Gamal Elnagar, University of South Carolina Upstate,Spartanburg, SC, USA Prof. Luis Tavares Rua, Cmte Guyubricht, 119. Conj. Jardim Costa do Sol. Atalaia, Brazil Prof. Igor Kuzle, Faculty of electrical engineering and computing, Zagreb, Croatia Prof. Maria do Rosario Alves Calado, University of Beira Interior, Portugal Prof. Gheorghe‐Daniel Andreescu, "Politehnica" University of Timisoara, Romania Prof. Jiri Strouhal, University of Economics Prague, Czech Republic Prof. Morris Adelman, Prof. of Economics, Emeritus, MIT, USA Prof. Germano Lambert‐Torres, Itajuba,MG, Brazil Prof. Jiri Klima, Technical faculty of CZU in Prague, Czech Republic Prof. Goricanec Darko, University of Maribor, Maribor, Slovenia Prof. Ze Santos, Rua A, 119. Conj. Jardim Costa do Sol, Brazil Prof. Ehab Bayoumi, Chalmers University of Technology,Goteborg, Sweden Prof. Robert L. Bishop, Prof. of Economics, Emeritus, MIT, USA Prof. Glenn Loury, Prof. of Economics, Brown University, USA Prof. Patricia Jota, Av. Amazonas 7675, BH, MG, Brazil Prof. S. Ozdogan, Marmara University, Goztepe Campus, Kuyubasi, Kadikoy, Istanbul, Turkey

Additional Reviewers Francesco Zirilli Sapienza Universita di Roma, Italy
Sorinel Oprisan College of Charleston, CA, USA
Xiang Bai Huazhong University of Science and Technology, China
Philippe Dondon Institut polytechnique de Bordeaux, France
Yamagishi Hiromitsu Ehime University, Japan
Frederic Kuznik National Institute of Applied Sciences, Lyon, France
George Barreto Pontificia Universidad Javeriana, Colombia
Takuya Yamano Kanagawa University, Japan
Imre Rudas Obuda University, Budapest, Hungary
Tetsuya Shimamura Saitama University, Japan
M. Javed Khan Tuskegee University, AL, USA
Eleazar Jimenez Serrano Kyushu University, Japan
Valeri Mladenov Technical University of Sofia, Bulgaria
Jon Burley Michigan State University, MI, USA
Andrey Dmitriev Russian Academy of Sciences, Russia
Moran Wang Tsinghua University, China
Jose Flores The University of South Dakota, SD, USA
Hessam Ghasemnejad Kingston University London, UK
Santoso Wibowo CQ University, Australia
Kazuhiko Natori Toho University, Japan
Konstantin Volkov Kingston University London, UK
Kei Eguchi Fukuoka Institute of Technology, Japan
Abelha Antonio Universidade do Minho, Portugal
Tetsuya Yoshida Hokkaido University, Japan
Matthias Buyle Artesis Hogeschool Antwerpen, Belgium
Deolinda Rasteiro Coimbra Institute of Engineering, Portugal
Masaji Tanaka Okayama University of Science, Japan
Bazil Taha Ahmed Universidad Autonoma de Madrid, Spain
Zhong‐Jie Han Tianjin University, China
James Vance The University of Virginia's College at Wise, VA, USA
Angel F. Tenorio Universidad Pablo de Olavide, Spain
Genqi Xu Tianjin University, China
João Bastos Instituto Superior de Engenharia do Porto, Portugal
Miguel Carriegos Universidad de Leon, Spain
Shinji Osada Gifu University School of Medicine, Japan
Ole Christian Boe Norwegian Military Academy, Norway
Lesley Farmer California State University Long Beach, CA, USA
Dmitrijs Serdjuks Riga Technical University, Latvia
Alejandro Fuentes‐Penna Universidad Autónoma del Estado de Hidalgo, Mexico
Francesco Rotondo Polytechnic of Bari University, Italy
Stavros Ponis National Technical University of Athens, Greece
José Carlos Metrôlho Instituto Politecnico de Castelo Branco, Portugal
Minhui Yan Shanghai Maritime University, China

Table of Contents
Fishing Effort Control for Mediterranean Trawlers Based on Quotas of Area and Volume of Filtered Water
9
Agustín Mayans Fernández, Ignacio J. Martínez Soler, A.V. Martínez Sanz, Vicente Colomer Romero
The Extraordinary Contribution in General Regulatory Plan of Rome 14
O. Campo
Characteristic Studies of Yttrium Extracted from Coal Ash, South Korea 20
Thenepalli Thriveni, Yujin Jegal, Ji Whan Ahn
Utilization of Renewable Energy Sources in Bioclimatic Architecture in Greece 26
Semiha Kartal, Ömer Chousein
A New Understanding of Wind Energy Production Maintenance Based on Analysis of Variance
31
Ángel Martin Costa, Feliciano Fraguela, José Antonio Orosa, José Antonio Pérez
Ecological Impact of Fires on Environment 36
Sergey A. Kolodyazhny
Distributed Experiment for the Calculus of Optimal Values for Energy Consumption in Buildings
41
Pau Fonseca i Casas, Antoni Fonseca i Casas, Nuria Garrido‐Soriano, Joana Aina Ortiz, Josep Casanovas, Jaume Salom
H NMR Study of Water Clusters In Supercooled LiCl/water Solution 46
Carmelo Corsaro, Domenico Mallamace, Nicola Cicero, Sebastiano Vasi, Giacomo Dugo, Francesco Mallamace
Implications of Greenhouse Gas Emission Reduction from Thailand Long‐Term Energy Efficiency Development Plan
50
Wongkot Wongsapai, Chaichan Ritkrerkkrai
Enhanced Extremum Seeking Maximum Power Point Tracking for PV System 55
A. Senthil Kumar, K. Kirubasankar, Thomas Cermak, Stanislav Misak
Evaluation of Travel Demand Management Using Multi‐Source and Multi‐Criteria Assessment : Chiang Mai University
59
Preda Pichayapan, Patcharapan Nanthavisit, Nopadon Kronprasert
Behaviors and Expectation of Chinese Tourists Towards Tourism Management in Bangkok 65
Sasitorn Chetanont
Recent Advances on Energy, Environment, Ecosystems, and Development
ISBN: 978-1-61804-291-0 7

The Tendency of Behaviors and Potential Factors in Return Migration Of Myanmar Migrant Workers: A Case Study in PrachuapKhiri Khan Province
70
Musthaya Patchanee
Low‐Temperature Catalytic Pyrolysis of Waste of Flax Processing Using Silica‐Alumina Catalytic Systems
75
E. M. Sulman, Yu. Yu. Kosivtsov, A. I. Sidorov, A. A. Stepacheva, Yu. V. Lugovoy
Fermentable Sugars from Dilute Acid and Enzymatic Hydrolysis of Bamboo Shoots 81
Nakorn Tippayawong, Nuttida Chanhom
Law Development on Accommodating the Rights of Same‐Sex Relationship 85
Kamonwan Yoowattana
Research on Monitoring of the Emitted Aldehydes from a Fixed Source in the Water Course
89
O. Pfann, C. Badaluta Minda, Gh. Cretu
The Affecting Factors of Decision Making of Study in Suan Sunandha Rajabhat University : A Case Study Bachelor of Arts Program in Tourism Industry and Hospitality Management
94
Poonsup Setsri, Chantouch Wannathanom, Sujittra Rimdusit
The Innovative Development of the English Materials to Communicate the Identity of Samut Songkram for Tourism
98
Kitda Praraththajariya
Factors Affecting Sustainable Community Development: A Case Study of Dusit District Community
106
Wasana Suridechakul
Efficiency on the Adsorption of Heavy Metals by Using Natural Materials in Community for the Development of Sustainable Quality of Life
111
Chinnawat Satsananan
Modeling and Simulation of Fuzzy Logic Based Hybrid Power for Irrigation System in Case of Wonji‐Shoa Villages
116
Adisu Teshale
Low‐Cost Removal of Polar Aromatics Pollutant by Using Nano Zeolite 124
Authors Index 131
Recent Advances on Energy, Environment, Ecosystems, and Development
ISBN: 978-1-61804-291-0 8
Pham Thi Huong, Jitae Kim, Byeong-Kyu Lee

Fishing effort control for Mediterranean trawlers based on quotas
of area and volume of filtered water Agustín Mayans Fernández1, Ignacio J. Martínez Soler1, A.V. Martínez Sanz2, Vicente Colomer
Romero2, 1 Simrad Spain S.L.U, Polígono Partida Torres, 38, 03570 Villajoyosa (Alicante), Spain
2 Institute of Design and Manufacturing (IDF) Polytechnic University of Valencia.
Ciudad Politécnica de la Innovación (CPI), Camino de Vera s/n, Building 8G, 46022 Valencia, Spain,
Abstrac.-: The objective of this work was to develop a possible
methodology of control of the real fishing effort in areas where
the catch is multi-species and there isn’t any possibility to
implement a TAC system based on catch.
The current fishing effort method doesn’t reflects the true effort
over the ecosystem as is contemplating the navigation time as
part of the effort. By other side, the proportion between official
engine power and gross tonnage doesn’t reflect the fishing effort
made by the fishing gear.
This system is based in the measurement of the area trawled and
the water filtered by the trawl. The assignment of a quota for
area and volume will allow an accurate control of the fishing
effort over the ecosystem.
In the project we analyze the results of this measurements over
one year on five representative vessels of the Mediterranean
bottom trawlers.
Keywords-component; Mediterranean trawlers, fishing gear,
fishing effort, electronics systems, fishing circle, area trawled,
volume of water filtered, wings spread, wireless trawl
instrumentation.
I. PRESENTATION
The naval technology company SIMRAD SPAIN SLU, in
collaboration with a group of researchers from the Institute of Design
and Manufacturing of the UPV have analyzed and helped to establish
a possible methodology of control of the real fishing effort in
Mediterranean trawlers. This may be necessary for the draft of the
new law on sustainable fisheries in the Spanish Mediterranean Sea.
II. INTRODUCTION
The way that Mediterranean fishing effort is calculated today by
E.U. is multiplying the time that the vessel is in operation (since
leaving the harbor until coming back) by the engine power or the
vessel displacement or the gross tonnage.
Thinking this way, the measures to reduce the fishing effort in the
fleet have been:
1. Reduce the number of vessels
2. Limit the operational fishing time
3. Limit the maximum engine power to 500hp.
After several years applying this concept of fishing effort, the fleet
has been reduced drastically, but the fishing effort doesn’t.
We only need to walk along the pier of any fishing harbor to see
trawl doors with more than 1.000kg each hanging on the vessels aft,
this indicates clearly that the measures haven’t been observed by the
ship owners as per the engine power limitations.
The limitation on operational time per day has been the reason
because the vessels started to increase the engine power.
As the fishing area is limited, arriving the first to the fishing
ground every day matters, so they have been increasing the power in
order to sail faster. Having the power installed, the temptation to use it
for trawl have been simply too high. The final result is that we have
now less vessels, but the fishing effort hasn’t been reduced at the same
level and there is no way to measure it accurately.
Figure 1. Time limitation generates a concentrated fishing effort
By other side, this regulation doesn’t contemplate the new
technologies applied to the fishery. Using them, a vessel can change
its fishing effort capacity in more than a 50% (depending of the
current use of technology).
This is an example of how the technology can affect to the fishing
effort just increasing the size of the net, but keeping the same toeing
resistance:
• The use of new materials on the net could provide up to
40% of its own drag reduction
Recent Advances on Energy, Environment, Ecosystems, and Development
ISBN: 978-1-61804-291-0 9

• The use of more efficient trawl doors could provide up to
78% of its own drag reduction
• Adding both drag reductions (up to 42% of the total fishing
gear drag) would allow the fisherman to increase the size of
the net keeping the same towing power.
If we consider that the engine power installed on the majority of
the Mediterranean fleet doesn’t correspond with the officially declared
and we assume how much the fishing effort can change by the use of
the technology, think about how the European Fishing Commission
should take decisions based on the current calculation method of
fishing effort, those will never be effective as the source of
information is not accurate and differs from the reality.
Conclusion
The control of the engine power doesn’t assure a control of the
fishing effort and the time limitation only concentrates the fishing
effort in a smaller area, then the overfishing will create a non-
sustainable operation of the fleet.
We need a new concept of fishing effort measurement which must
be accurate and easy to implement.
TABLE I.
Real
power
Fishing effort calculation sample
Sampled vessels-declared power F.E.
by Power
F.E.
by G.T.
550hp Vessel 1 – 270hp 2400 541
760hp Vessel 2 – 258hp 2293 881
660hp Vessel 3 – 250hp 2222 641
1000hp Vessel 4 – 440hp 3911 1072
1200hp Vessel 5 – 340hp 3022 1257
In the table I we can see the difference between installed and
declared power in five vessels sampled in Mediterranean. Also we
have calculated the fishing effort following the EU method with
engine power and gross tonnage. The gross tonnage calculation gives
a better approach to the reality, but still we must consider that a vessel
can use the excess of power for sailing, so the fishing effort will not be
proportional to the engine power at all.
III. METHODOLOGY
A. Fishing effort definition for multispecies areas
The fishing effort in the Mediterranean must be analyzed by a
different method as per their own characteristics. The proposed
method of this study is to have two measurements:
1) Fishing effort over benthic species
In this case, the aim of the fishery is to catch the species living just
over the bottom or even buried or semi-buried on it. For this kind of
fishery the fishing gear is designed to cover as much area as possible,
being the height of the net as less as possible (p.e. tangonero and
minifalda types).
For this kind of nets the main factor to calculate is the area trawled
by the net and the distance between wings will be the calculation base.
2) Fishing effort over demersal species
In this case, the target species are caught at a certain distance from
the bottom. The fishing gear then is designed to have at least the
necessary height to get the fish on the net. In this case the width of the
net is not the main factor (p.e. Cuadrado and butterfly types).
For this kind of nets the main factor to calculate is the volume of
water filtered by the net and the fishing circle of the net will be the
calculation base.
Figure 2. The two types of fishing effort
If we can measure exactly how much area and volume of water
has filtered the net in each trawl, we can just forget about the power,
gross tonnage or operational time limitation of the fleet. We will have
the right measurement affecting to the fish mortality.
B. Calculation of fishing effort from acoustic trawl sensors
Since Simrad installed 115 ITI (Integrated Trawl systems) with
data logger in the fleet affected by the installation of a pipeline in the
fishing ground between Spain and the Balearic Islands, we have been
developing a software tool that extracts the track of the fishing
operation automatically. The information collected by the system is:
Doors and wings spread
Headline height
Geographical position of the trawl and the vessel
Speed
Heading
Depth
Warp length (Stbd. and port)
Echo sounder depth
Trawl door depth
Area
VolumenFishing Circle(Cp)
Distance between wings (Dh)
Demersal species
Benthonic species
Recent Advances on Energy, Environment, Ecosystems, and Development
ISBN: 978-1-61804-291-0 10
All this data is stored every 20 seconds in a file per day. Then this
file is sent automatically to a server, who processes the data, extracting
the trawling part by the warp length detection.
The area covered by the trawl is calculated using the wings spread
multiplied by the distance trawled.
The volume of water filtered by the trawl is calculated using the
fishing circle area (calculated from the perimeter of the fishing circle,
measured directly on the net) multiplied by the distance trawled.
Distance trawled is calculated multiplying the speed by the time
trawled (in 20 seconds legs).
Both the volume and the area are calculated for each track,
regardless of the fishing gear used.
IV. STUDY CASES
The sampled vessels have been selected to be representative of the
fleet as per the criteria reflected in table II.
TABLE II.
Vessel
ref.
Sampled vessels
Criteria of the selection
Vessel 1 Shallow waters, low engine power, area driven
Vessel 2 Mid deep waters, high power engine, area driven
Vessel 3 Deep waters, low power engine, volume driven
Vessel 4 Deep waters, high power engine with small net, volume driven
Vessel 5 Deep waters, high power engine with big net, volume driven
It’s really important to highlight the case of the vessel 4. Having a
big engine, they have adjusted the size of the trawl to be more energy
efficient, so their fishing effort is lower than it could be, as per the
available towing force.
Figure 3. fishing grounds and engine power
V. RESULTS
The following data belongs to the information received in 2013
and shows the following evidences:
A. Efective fishing time
As the available time per day is 12 hours for the whole fleet,
regardless of their fishing grounds, those vessels operating closer to
the harbor have more time for trawling.
The vessels operating in deep waters have an average of six hours
of navigation, trawling only six hours per day. The vessels operating
in shallow waters have eight trawling hours per day.
TABLE III.
Vessel
ref.
Operating times and average speeds
Trawling/day Av. Speed sailing Av. Speed trawling
Vessel 1 8h 14m 8,00kt 3,46kt
Vessel 2 7h 57m 7,29kt 2,99kt
Vessel 3 6h 13m 8,79kt 2,68kt
Vessel 4 6h 22m 9,62kt 2,73kt
Vessel 5 6h 02m 9,87kt 3,03kt
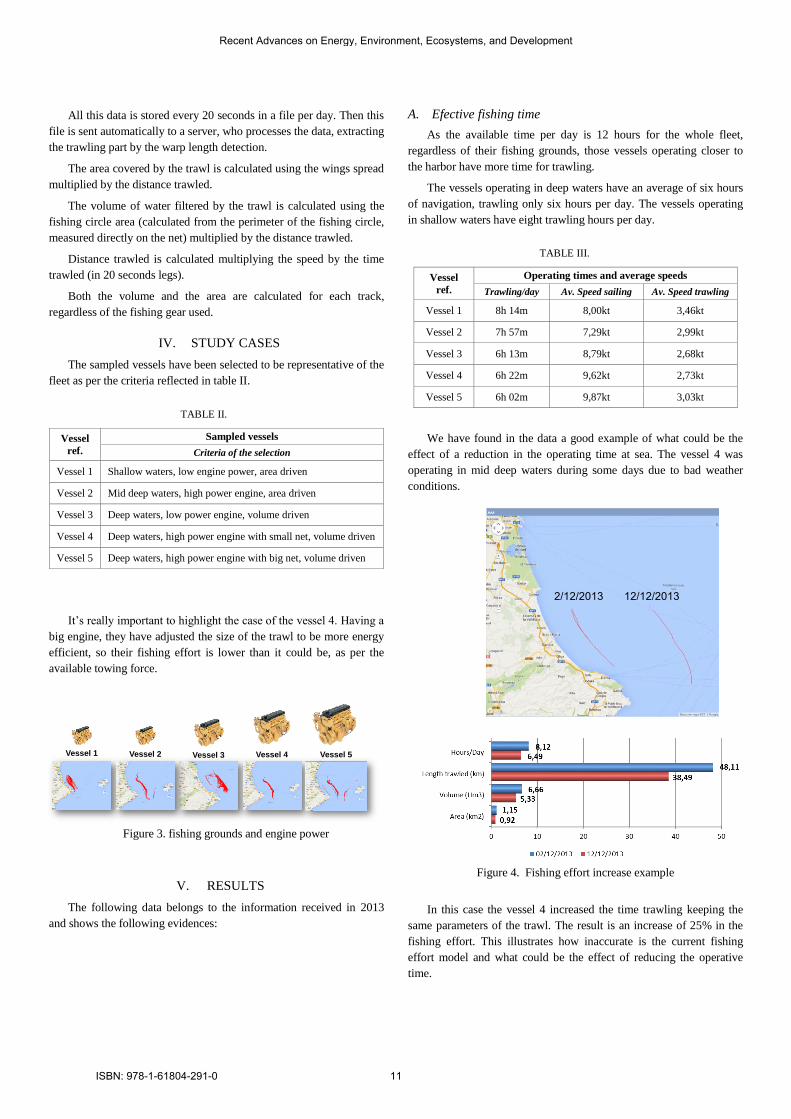
We have found in the data a good example of what could be the
effect of a reduction in the operating time at sea. The vessel 4 was
operating in mid deep waters during some days due to bad weather
conditions.
Figure 4. Fishing effort increase example
In this case the vessel 4 increased the time trawling keeping the
same parameters of the trawl. The result is an increase of 25% in the
fishing effort. This illustrates how inaccurate is the current fishing
effort model and what could be the effect of reducing the operative
time.
Vessel 1 Vessel 2 Vessel 3 Vessel 4 Vessel 5
2/12/2013 12/12/2013
Recent Advances on Energy, Environment, Ecosystems, and Development
ISBN: 978-1-61804-291-0 11

B. Area trawled and volume of water filtered by the net
In the table IV we can see how the distance trawled by the shallow
and mid deep water vessels is significantly bigger than the vessels
operating in deep waters. This is mainly due to the operative time per
day, but also because the trawl speed.
TABLE IV.
Vessel
ref.
Operating times and average speeds
Distance
trawled
Area trawled
by net
Water volume
filtered by net
Vessel 1 9924km 195,41 km2 442,82 Hm3
Vessel 2 8682km 197,35 km2 516,42 Hm3
Vessel 3 5691km 124,41 km2 607,03 Hm3
Vessel 4 5760km 137,38 km2 797,07 Hm3
Vessel 5 6374km 197,09 km2 1473,04 Hm3
Regarding area trawled and volume of water filtered, we can see
clearly how the vessels 1 and 2 have a focus on the area trawled and
the vessels 3, 4 and 5 are more focused in the volume.
The case of vessel 5 illustrates how the use of the full power
available in the engine can generate a tremendous fishing effort,
compared with the vessel 4, which has a similar engine but the effort
in volume of water filtered by the trawl is close to 50% less.
Figure 5. Area trawled and volume of water filtered by the net
VI. FISHING EFFORT MANAGEMENT SYSTEM
Based on the results obtained by measuring the two fishing efforts,
the question is how to implement a system in the Mediterranean to
control those parameters. Again, the Enagás project has been a good
test platform to develop a management system which doesn’t requires
any change in the fishing methods and uses the existing trawl
monitoring systems installed in a big percentage of the fleet to be
controlled.
A. Declaring the nets to be used
The software developed by Simrad has a module where the
skipper can introduce some basic data from its net or alternatively the
net diagram provided by the net maker.
Once the main measurements of the net are introduced in the
system, the software will categorize the fishing gear assigning an
effort pack with a defined fishing circle area and wings spread.
All the nets will be declared to the authorities by the software,
creating a database of nets per vessel with their correspondent size and
category.
From this point the skipper will select in the software the net
which he’s using and the system will calculate the area and volume of
water filtered by the trawl automatically.
B. Checking that the nets declared are correct
In order to check that the skipper is using the net declared in the
software, the system will measure the height and the wings spread
with wireless sensors installed in the net. If the measures doesn’t
correspond to the selected net, the system will warn the skipper to
select the right one before the end of the trawl. If the mismatch
between the data measured and the net declared persist at the end of
the trawling, the system will alert the inspection authorities in order to
have a visual inspection onboard when the vessel returns to shore.
C. Spatiotemporal fishing ground closures
The software will position the fishing effort in time and
geographically. This, merged with the electronic logbook data, can
provide the scientist a really valuable information about the
sustainability of the different areas.
At the same time, the system will be able to set spatiotemporal
areas (defined by one or various pre-programmed cells) which will
appear on the fleet system screen, warning to the skippers that this
areas can’t be exploited during the closure. In case one vessel
disregard this and trawl inside a closed cell, the system will send an
alarm to the inspection authorities in order to start the correspondent
process.
D. Quota of area and volume of water filtered by the net
Once the authorities will have the accurate measurement of the
fishing effort in area and volume of water filtered by the net, a quota
of both parameters may be established. Then the vessels will manage
this quota during the year.
The system onboard will acknowledge the quota assigned and will
show to the skipper how much is already consumed at any time. When
Recent Advances on Energy, Environment, Ecosystems, and Development
ISBN: 978-1-61804-291-0 12

one of the two quotas would be reached, the vessel must stop the
operation until the quota is reestablished by the fishing authorities.
Based on the information collected in the sampled vessels, we
have established a quota corresponding to the fishing effort that a
vessel with a fishing gear correspondent to a 500hp towing force can
do.
Having a towing capability of 6.000Kg, 70% of this affordable
resistance can be assigned to the net (4.200kg). scaling a model
“cuadrado” with this resistance for demersal species, we obtain the
fishing circle area. Using the same resistance to scale a “Minifalda”
model for benthic species we obtain the wings spread.
To calculate the reference quota we have used 10 hours of
trawling per day, multiplied by 190 days of operation. The trawl speed
for the benthic species taken is 3,2kt and 2,7kt for demersal species.
The result of the calculations is a quota for area equal to
216,24km2 and a quota for volume of water filtered equal to
1.127,05Hm3.
Figure 6. Quota calculation parameters
With the quota calculated we have seen that four from the five
vessels are inside the 500hp standard. Only vessel 5 exceeds the quota
of volume mid-September. In this case the vessel 5 would have several
options:
Reduce the size of the net
Reduce the trawl speed
Stop operation the days with bad weather or low market
demand
Figure 7. quota of area trawled, none of the vessels reaches it
Figure 8. Quota of volume, vessel 5 must stop mid-September
REFERENCES
Reglamento (UE) Nº 1224/2009 del Parlamento Europeo y del
Consejo de 20 de noviembre de 2009.
Reglamento (UE) Nº 1343/2011 del Parlamento Europeo y del
Consejo de 13 de diciembre de 2011.
Anteproyecto de ley de pesca sostenible 121/000095 de 8 de
septiembre de 2010.
International bottom trawl survey in the Mediterranean (Medits) –
Abril 2007
European Commission (DG Fish) and participant countries.
Investigation of the resistance of trawl gear (Oilfish) – 1984
(Wileman D.A., Hou E. and Robertson J.)
Estimation of Trawl Door Spread from Wing Spread - 1989
P. J. G. Carrothers
Department of Fisheries and Oceans, Marine Fish Division
Biological Station, St. Andrews, New Brunswick, Canada EOG 2XO
Proyecto MAREA, proyecto específico Nº 5 “MYGEARS” -
Technical specifications of Mediterranean trawl gears - 2013
Dr. Antonello Sala
Head of the Fishing Technology Unit
National Research Council (CNR) - Institute of Marine Sciences
(ISMAR) - Fisheries Section
Largo Fiera della Pesca, 1 60125 Ancona - Italy
Informe técnico de las condiciones estándar aplicables para la pesca
de arrastre en el Mediterráneo - 2011
Ignacio J. Soler Martínez, Santiago Salom Llorach, Antonio V.
Martínez Sanz
Guía de bolsillo del pescador - 1988
P.Y. Dremière
IFREMER, Sète, Francia
Coordinado por J. Prado
División de Industrias Pesqueras, FAO
500hp
Fishing circle area (Cp) = 98,86m2
Vessels with fishing gear focussed on benthic speciesTrawling time per day : 10 horas
Trawl speed : 3,2 kts
Working days : 190
6.000Kg
4.200Kg
Wings spread (Dh) = 20,66m
70%
Vessels with fishing gear focussed on demersal species:Trawling time per day : 10 horas
Trawl speed : 2,7 kts
Working days : 190
Quota for area: 216,24 Km2
Cuota for volume: 1127,05 Hm3
550hp 760hp 660hp 1000hp 1200hp Cuota de Referencia550hp 760hp 660hp 1000hp 1200hpVessel 1 Vessel 2 Vessel 3 Vessel 4 Vessel 5 Reference quota
550hp 760hp 660hp 1000hp 1200hpVessel 1 Vessel 2 Vessel 3 Vessel 4 Vessel 5 Reference quota
Recent Advances on Energy, Environment, Ecosystems, and Development
ISBN: 978-1-61804-291-0 13
Abstract—Among the innovations introduced by the new
General Regulatory Plan for Rome, is the introduction of the so-called "Extraordinary Contribution" to urbanization, an amount in addition to the costs of primary urbanization and those related to building permits borne by the promoter of urban transformation or development projects.
However, at a distance of eleven years after the adoption of the new General Regulatory Plan for Rome and more than six after its final approval, the regulation for the calculation of the Extraordinary Contribution still has not been formally approved by the Rome City Council. One of the reasons for this delay is identified in the legal basis of the additional financial obligation of the project developer, and an appeal brought before the Regional Administrative Court of Law [T.A.R.] was put to rest with the Legislative Decree No. 78/2010 converted into Law No 122/2010 where Article 14(16) permits the introduction of Extraordinary Contribution with the exact wording of the technical conditions of the new GRP for Rome and with the decision of the Council of State, Section IV No 4545 of 13/07/2010.Several attempts have been made to regulate this additional cost, the last of which was the approval by the Board of Councilors in February 2014 of a regulation stating, in summary, that the real estate value to which the extraordinary contribution for urbanization must be applied, i.e. at the rate of 66.6% as described in Article 20(3) of the Rule for Implementation [implementing technical standards, NTA], is equal to the difference between two distinct transformation values (below VT) of the property transformed: VT1-VT, i.e. the difference between the Value of the Transformation of the property, calculated taking into account the additional construction foreseen by the proposed intervention (VT1), subtracted from the Value of Transformation of the same property under normal urban regulations without further negotiations, so setting the parameters and the method of calculation.
Keywords— extraordinary contribution, general regulatory plan, value of transformation
I. THE INTRODUCTION OF THE EXTRAORDINARY CONTRIBUTION AND TECHNICAL PROBLEMS INHERENT IN THE
CALCULATION The General Regulatory Plan (hereinafter “GRP”) for
Rome, adopted with City Council Deliberation (CCD) No 33/2003 and approved with CCD No 18/2008, in the part concerning the criteria for equalization, i.e. Article 17(2)(B) extraordinary contribution (hereinafter “CS”) states: "In the existing urban settlement system, the majority of the leading real estate valuations generated by new urban development
projects are subject to the payment of an extraordinary financial contribution that the City Council shall use to finance public works and services in distressed urban areas, with the aim of urban regeneration";
The successive Article 20(3) specifies that the CS is an additional charge and is established in an amount equal to 2/3 of the real estate value achieved with the increase of gross usable surface (SUL)1 and/or changes in the intended use compared to planning regulations previously applicable. Paragraph 9 successively adds that the City Council defines criteria and procedures for the estimation in a separate regulation.
The Co-planning Conference2 report identifies, in the guiding factors and regulations, that the economic value gained by the new GRP (through additional building rights and changes of intended use) is for the most part "returned" to the City (the community) through the payment of extraordinary financial contributions.
This new and onerous obligation on the implementing body prompted an appeal to the TAR3 in which the applicant challenged the legitimacy of the CS in view of the lack of the necessary legal basis at both State and regional levels The judgment of 04/02/2010 accepted the applicant's argument on the issue. The first Judge, in fact, considered the introduction of CS to be without legal basis, believing that the methods adopted in this manner for the pursuit of the objectives of urban (and financial) equalization violated the principle of legality because the extraordinary contribution would constitute a property tax, albeit of non-tax nature, and it as such lacked an express basis for calculation and therefore was in breach of the legal reservation ex Article 23 of the Italian Constitution.
As a result of Article 14(16)(f), Decree Law 31 May 2010 No 78, converted into Law No 122/2010, the introduction of the CS was permitted when formulated exactly as in the 1 Article 4(1) of NTA Gross floor area (SUL): measured in square meters. The sum of the gross floor areas of the building unit, including within the outer perimeter of the walls, excluded from the calculation are stairwells, hallways, elevator shafts, technical volumes, not completely closed spaces, basements, parking space outside walls over 30 cm, glass- or greenhouse surfaces, fireplaces and ventilation surfaces. 2 According to Article 66-bis of Regional Law 38/99, the co-planning conference must be convened to reach an agreement on the approval of the GRP, and that the managers of the of the City Council, Regional and Provincial technical facilities must participate. 3 General Registry Appeal No 6274 of 2008.
The extraordinary contribution in General Regulatory Plan of Rome
O. Campo1,a 1Department of Architecture and Design (DIAP) - Sapienza, University of Rome
Recent Advances on Energy, Environment, Ecosystems, and Development
ISBN: 978-1-61804-291-0 14

technical regulations of the new Rome GRP. It seemed to have been issued by the municipality of Rome with the express purpose of legitimizing ex post the estimations of the CS.
The judgment of the Council of State No 4545 of 13/07/10 recognizes conclusively the legitimacy of the estimates of the CS for urbanization, stating that it constitutes a levy applicable to the determined higher value of the building in the area upon completion of the construction negotiation process and the definition of indirect intervention programmes, or upon issue of the qualifying title; and also that the authoritative predetermination of the CS does not affect the "optional" nature of institution but rather respects the need to "ensure a level playing field between the owners of the soil in urban regulatory matters" by defining the terms and conditions which the parties to the agreement pursuant to Article 11 of Law 241/90 must guarantee to the city administration in exchange for the increased building volume that the GRP permits them [1, 2, 3, 4].
II. METHOD OF THE CALCULATION THE CS (DEPARTMENTAL CIRCULAR 13/04/2013)
With the legal issues now solved, the City Council Executive Committee passed the resolution with Decision No 20/2013 entitled: "Rules for the determination of the extraordinary contribution" and, pending approval by the City Council, a departmental circular was issued illustrating the method of calculation.
Summarised, the calculation method to be used was the Value Transformation, an analysis with the following requirements:
the market valuesof reference were based on the list of the Property Market Observatory of the Italian Internal Revenue Service (hereinafter “OMI”);
the commercial surface area is not less than 8% of the SUL; in determining the technical cost of construction, a
parametric assessment of the costs was deduced using the costing lists complied by the Engineers and Architects of Milan and available from DEI publishing house, and, in case of the renovation of a building, this total has been estimated through the bill of quantities and on the basis of regional price lists;
the costs of preparing the site (land reclamation, construction site, connections, archaeological surveys, geological, etc.) may affect the cost of the technical realization by 2-5%;
the costs of marketing may affect the estimated Market Value of the completed project by 2-3%;
the profit of the property developer of 15-25%; borrowing costs have been estimated through the analysis of
the cash flows. The percentage valuesreferring to the individual cost items
are properly reformulated within the percentage thresholds indicated above in accordance with the specificity of the individual urban measures.
The Value of Transformation is then calculated with the
formula: VT = Vmt - Σ iKi where: VT is the Value of Transformation of the property; Vmt is the Market Value of the object of the property
development project; Σ iki is the summation of all the processing costs incurred
during the property development. The value then subject to the CS for urbanization at a rate of
66.6% as defined in Article 20(3) of the NTA in force is equal to the difference between the Value of the Transformation of the same property calculated using the normal urban regulations in force and the Value of Transformation calculated using the proposed development of the building as basis.
The tax base for the application of the CS for urbanization at the percentage established by the rules is therefore equal to the difference between two distinct Valuesof Transformation of the property development project: VT1 – VT2.
The Value Transformation (VT1) is calculated in the manner described in this Circular, using the proposed development of the property affected by the order as the basis.
The Value Transformation (VT2) is calculated in the manner described in this Circular, theorizing the development of the same property on the basis of urban estimates previously in force, namely the realization of the intervention categories and building dimensions (SUL) for which, using the GRP in force, the extraordinary contribution for urbanization is not due.
In the event that the development relates to existing buildings, the value of Transformation (VT2) is calculated in the manner described in this Circular, theorizing a construction project involving the preservation of uses and forms of conduct and management of the property in force at the time of the presentation of the proposed intervention.
III. THE NEW METHOD OF CALCULATION OF CS (TO REPLACE DEPARTMENTAL CIRCULAR 13/04/2013)
The Rome City Council was not able to approve the method as intended before the end of their mandate of government, and the new administration therefore prepared a new draft resolution for presentation to the City Council, approved in Committee in February 2014, which follows the pattern established by previous resolutions. The part of the document related to the calculation of the CS is reproduced below.
In particular, the method of calculation, criteria and coefficients to be used for the calculations of the greater financial value of the development project are defined consistently and clearly for all the actuators.
The benchmark on which to base the improved real estate value achievable with the implementation of the planned development, and consequently to determine the amount of the
Recent Advances on Energy, Environment, Ecosystems, and Development
ISBN: 978-1-61804-291-0 15

extraordinary contribution due by the implementing body, is made up of the feasible real estate value of the property in question on the basis of normal urban estimates, i.e. based on the building not subject to an extraordinary contribution as established by the urban planning instruments in force.
To ensure full compliance with the principles of fairness, consistency, uniformity of treatment and impartiality, the estimated real estate value achievable is to be calculated with the analytical method for the value of transformation, as normally applied in cases of economic benefit [5, 6]. This method is commonly accepted and practised, and having specific scientific validity, it allows objectivity, consistency and reliability.
The method is the subject of much literature and its inequalities are the subject of mathematical formulation research.
The parameters which govern and collate the values for all the actuators are described and defined below, in order to ensure the correct application in compliance with Article 20 of the NTA of the GRP, in particular with the requirements of paragraph 9.
It must always be assumed in every case that the transformation plan is both consistent with the characteristics of real estate (buildings, areas) and is within the limits of what may be feasibility developed.
The analytical method of Value Transformation considers the property affected by the transformation as a product from which - through the expenditure of a certain amount of capital which constitutes the cost of development or transformation - a final product is attained, i.e. the developed or transformed building [7, 8].
The Value Transformation (Vt) of the property is given by the difference between the Market Value of the building product achieved by the transformation (Vmt), less the processing cost consisting of the sum of the costs (K) incurred in the related transformation, and the Market Value of the building product in the ordinary conditions (Vma), where Vt > Vma.
The Market Value of the finished building product (Vmt) is taken from the latest figures released by the OMI. If this published data is used, the OMI, an agency of the Italian Internal Revenue Service, must be quoted as the source.
The V(mt) for objects in a condition conservatively defined as "normal" corresponds to the "maximum" real estate Market Value per square meter of marketable surface of the building.
Where OMI quotations are related to a real estate conservative defined as "optimal", in the case of new constructions, the Market Value of the finished building product (Vmt) of reference is that described as "maximum". In cases of interventions on existing buildings, the Market Value of the finished building product (Vmt) where the conservative state may now be defined as "optimal" the value of reference is to be the average of the values "minimal" and "maximum".
It should be noted at this point that studies of a considerable number of cases have shown that the commercially marketable
surface (SCV) cannot be less than 8% of the gross usable surface in the case of properties destined for residential use. For details relating to destination definitions must see "Land Agency - glossary of technical definitions in use in the real estate sector." [Agenzia del Territorio – glossario delle definizioni tecniche in uso nel settore economico immobiliare]
Appurtenant car parks, pursuant to Article 41sexies of Law 1150/42, paragraph 2, are freely tradable, contributing therefore as real estate units to the calculation of the Market Value.
In the event that the interventions are undertaken on existing buildings, the value of the transformation is calculated on the basis of the proposed construction project involving the preservation of uses and forms of conduct and management of the property in force at the time of presentation of the proposed action;
In the event that the proposed interventions are undertaken on existing buildings, and/or foresee the construction of buildings destined for usage categories not included among those for which the OMI provides Market Value data, the market values required for the calculation of the transformation values should be determined with indirect or analytical estimation procedures (by applying the income generated by the operation and management of the property as a result of the transformation of the asset, and that generated by the operation and management of the property in the event of a preservation of the intended use and the forms of tenure and management in force at the time of submission of the proposal).
The cost of transformation (K) is the sum of the costs (Σ iKi) incurred in carrying out the development or transformation, which are the following:
the cost of the construction work itself; the cost of preparing the site and of utility connections; costs relating to the charges pursuant to Article 16 of
Presidential Decree No 380/2001; the cost of professional services - unforeseen technical and
related costs; marketing expenses; financial expenses; profit or gross margin of the developer. The cost of the building construction work is to be estimated
parametrically using the valuesper square meter of the building as in the price list for buildings published by the College of Engineers and Architects of Milan (referring to the latest edition available from DEI at the time of the estimate), with reference to the specific use destinations. In the case where relevant parameter valuesare not available, the calculations by analogue, referring to the category most similar; in the case of demolition and reconstruction the cost of the demolition of existing buildings should also be considered in addition to the parameter value derived by the price lists quoted; in the case of restructuring, the construction cost is derived from an itemised bill of quantities based on rates in force in the Lazio Region and duly sworn to by the person responsible for the
Recent Advances on Energy, Environment, Ecosystems, and Development
ISBN: 978-1-61804-291-0 16

design of the urban transformation/construction project. The cost of preparing the site and of utility connections may
constitute from 2% to 5% of the building construction work cost and offset all reclamation, site preparation and connections, and investigation archaeological, geological, etc. undertaken. The evaluation shall take into account the average of the values, the differences should be adequately justified, and it remains understood that the minimum and maximum amounts will not be exceeded.
Costs relating to the charges pursuant to Article 16 of Presidential Decree No 380/2001 include charges of primary and secondary urbanization and contributions to the construction cost, calculated according to the values established by the Rome City Council in the Council Deliberation in force when calculating the extraordinary contribution for urbanization.
Professional-technical costs and related-unforeseen costs include all costs of a technical-professional nature (urban, architectural, structural and plant engineering studies, safety services, works supervision, performance testing, cadastral requirements etc.). The value is estimated as a percentage of the cost of the works to be carried out when calculated as the sum of the technical cost of construction of the building, the cost of site preparation and of archaeological surveys. From trial calculations carried out using previously applicable professional fees (Ministerial Decree 04/04/2011) and the Ministry of Justice Decree No 140, 20.07.2012, taking into account the current low values present in the real estate market, it is seen that the percentage can vary between 8% and 12% of the cost of the building construction work, the cost of site preparation and of utility connections. The evaluation shall take into account the average of the values, the differences should be adequately justified, and it remains understood that the minimum and maximum amounts will not be exceeded.
Financial expenses are the costs of the capital employed in the investment. This cost is a function of the amount of capital required, the duration of exposure and the rate of interest payable.
The borrowing costs are calculated considering the cost of debt capital during a planning and construction time horizon when the interest on the debt is the sole responsibility of the project supervisor. The time horizon is fixed at five years unless otherwise justified by the size of the project.
The debt cost or the interest rate to be applied is equal to the Euro Interest Rate Swap EurIRS/Euribor spread for a final term loan of fifteen years.
EurIRS is the Euro Interest Rate Swap, the index of fixed rate mortgages; Euribor is the index of the variable-rate mortgages. The source for nominating the EurIRS and Euribor values shall be the Italian financial daily il sole 24 ore or the web site www.Euribor.it.
The spread (deviation or margin) is a percentage value that fluctuates on average between 2.50% and 3.50% and is dictated by the major European banks such Deutsch Bank, BNP Paribas, Credit Agricole. It represents the remuneration
for the credit institute granting the loan. Unless another value is justified, only the pre-amortization
period of five years as follows will be considered: first year 10% (construction permits issued); second year 30% (advance for early intervention
implementation); third year 40% (advance for early intervention
implementation); fourth year 20% (balance on project realization); fifth year 0% (marketing). The percentages reflect the gradual assumption of risk on
the part of the lender relative to the progressive completion of the works placed under warranty.
The interest on the debt accumulated as the five year period progresses constitutes the financial burden of the investment. In practice, the advance paid in the first year is equal to 10% of the total requested and the interest is for all five years of construction, in the second year the bank advances 30% and the interest accumulated is calculated for four years, and then progressively 40% for three years and 20% for two years.
The burden of the financial charges can thus be calculated for each of the phases of pre-amortization according to the table attached below, evaluating the interest rate to be applied at the moment of loan request.
From the sixth year, the interest on the debt becomes the burden of the purchasers.
The profit or gross margin of the developer is the total profit that the promoter of the project derives from the use of all funds in the real estate transaction. In appraisals using the Value Transformation method, and using the Operation Manual of the Italian Territorial Real Estate Agency estimates, the profit of the developer is expressed as a percentage of revenues in relation to a number of variable factors both for external conditions and for the intrinsic characteristics of the project: general economic conditions, industry intervention, market trends, financing methods, type of real estate transaction (location, size, intended use), cost forecasts and revenues and their reliability, commencement of the time of return, as well as additional variables specific to a real estate transaction.
The detailing of these values according to the specific characteristics of the project, provided with adequate justification, allows for an exact evaluation of each case. The default levels for the lower threshold are set in any case at 15%, and the upper threshold at 25% of the Market Value of the finished building product (Vmt).
The percentage values referring to the individual cost items shall be adequately modulated in order to respect the above percentage thresholds, with reference to the specificity of the individual urbanization projects.
The Value of Transformation is then calculated with the formula:
VT = Vmt - Σ iKi > Vma
Recent Advances on Energy, Environment, Ecosystems, and Development
ISBN: 978-1-61804-291-0 17

where: VT is the Value of Transformation of the property; Vmt is the Market Value of the object of the property
development project; Σ iKi is the summation of all the processing costs incurred
during the property development. Vm is the Market Value of the building product under
conditions in force In conclusion, the value subject to the CS for urbanization,
defined as 66.6% in Article 20(3) of the NTA, is equal to the difference between two distinct transformation values of the property in question: VT1-VT. That is to say, the difference between the Value of the Transformation of the property, calculated taking into account the additional construction foreseen by the proposed intervention, and the Value of Transformation of the same property under normal urban regulations without further negotiation processes.
The Value Transformation (VT1) is computed in the manner described above, on the basis of the proposed enhancement of the property in question, as a result of the negotiation process.
The Value Transformation (VT2) is calculated in the manner described in this Circular, theorizing the development of the same property on the basis of urban norm estimates, namely the realization of the intervention urban construction categories and building dimensions (SUL) for which, on the basis of the existing urban norms, the CS for urbanization is not due.
In the event that the proposed interventions are undertaken on existing buildings, and/or foresee the construction of buildings destined for usage categories not included among those for which the OMI provides Market Value data, the market values required for the calculation in the manner described in this report of the values of the transformation VT1 (related to the proposed enhancement of the property covered by the measure) and VT2 (the value relative to the same property assuming that the use destination and forms of tenure and management in force at the time of submission of the proposal) must be determined using indirect or analytical estimation procedures.
The scope of this methodology covers all direct or indirect development where the required urban planning permits have not yet been signed or where a required permit has not yet been issued.
IV. CONCLUSIONS The first consideration is that despite the new GRP adopted
by the City of Rome with CCD No 33 of 19/20 March 2003 and finally approved with CCD No 18 of 12 February 2008, the planned regulation for the calculation of the CS continues to lack the fundamental approval by the City Council necessary for it to be in force.
Continued uncertainty in this period has inevitably resulted in it not always being applied in a homogeneous manner. This includes by offices which deal with direct intervention projects
and by those which work with programme agreements. Another consideration is that inherent in the fact that the
new GRP provides for compensation planning4 (reduction and transfer of the volumes foreseen to another site) based on the equivalence of property values. These values could also be regulated using calculation methods analogue with the method designed for the calculation of the CS, as this compensation process also deals with the calculation of property values.
Last but not least is the fact that OMI calculations do not have probative value, and with Law 88/2009 the OMI values were demoted from legal presumption to mere indications of evasion. The values deduced from the OMI data base therefore constitute only a reference range, useful for the assessment of the value of the property. It would, however, be correct to refer to known prices of similar properties to that being valued. A market-oriented evaluation cannot make use of automatic and conventional calculations.
One is also left perplexed by the fact that the proposed calculations make no reference, considered within the rate of return of capital industrial (r1), to the risk factors, market uncertainties, unpredictability, inflation, devaluation, anxiety linked to the complexity of the transformation within time horizons rarely much longer than five years, and of the unknowns in the lease market.
Finally, operators increasingly demand a change of use from commercial and tertiary sectors to residential, transformations which would seem uneconomical because the OMI values often identify higher values for non-residential use, resulting theoretically in a negative extraordinary contribution.
The summation of all the critical points mentioned above, if not corrected before approval by the City Council, could result in creating in values whichpenalize operators, or worse, could be damaging to the municipal revenue to the detriment of the entire community.
REFERENCES [1] L. Fusco Girard, P. Nijkamp, “Le valutazioni per lo sviluppo sostenibile
della città e del territorio”, Franco Angeli, Milano, 1997. [2] M. R. Guarini, F. Battisti, “Benchmarking Multi-criteria Evaluation: A
Proposed Method for the Definition of Benchmarks in Negotiation Public-Private Partnerships”, in: B. Murgante, et al., Computational Science and Its Applications - ICCSA 2014, Part III.LECTURE NOTES IN COMPUTER SCIENCE, vol.8581, p.208-223, Springer International Publishing, Switzerland, 2014, ISSN: 10226680, ISBN 978-303785975-9, doi: 10.4028/www.scientific.net/AMR.869-870.154.
[3] M. R. Guarini, C. Buccarini, F. Battisti “Include Macbeth in the MCDA Models Suggested by Italian Legislation for the Selection of the Most Economically Advantageous Tender in Contracts for Public Works. Comparison and Application of MCDA Model to a Case Study”, MATHEMATICS and COMPUTERS in SCIENCE and INDUSTRY, Series | 31, ISBN: 978-1-61804-247-7 ISSN: 2227-4588
[4] S. Stanghellini: Il negoziato pubblico privato nei progetti urbani. Principi, metodi e tecniche di valutazione, Dei, Roma (Italy), 2012.
[5] P. Urbani: Territorio e poteri emergenti, le politiche di sviluppo tra urbanistica e mercato, Giappichelli, Torino (Italy), 2007.
4 Article 17(2)(c) and Article 19 of the NTA.
Recent Advances on Energy, Environment, Ecosystems, and Development
ISBN: 978-1-61804-291-0 18

[6] E. Salzano, M. Baioni, I. Boniburini: La città non è solo un‘affare, Aemilia University Press, Reggio nell’Emilia (Italy), 2012.
[7] AA.VV.: Proposed New International Valuation Standards, IVSC, London (England), 2010.
[8] M. Simonotti: Metodi di Stima immobiliare, Flaccovio, Palermo (Italy), 2009.
Recent Advances on Energy, Environment, Ecosystems, and Development
ISBN: 978-1-61804-291-0 19

Abstract— The occurrence of Yttrium in the coals with different
rankings from their origin was investigated. The concentrations of the rare-earth elements (REEs) in the coal lower than coal ash. Yttrium plays a key role in many industrial applications, defense (targeting and weapon systems, communication, defense electronic warfare) and military (RE permanent magnet (REPM) in flight control motors, Y based ceramics to protect jet engine applications. These rare earths are essential to the success of green technologies. Here we reported the basic characteristics of rare earth elements presented in colas and coal ash samples collected from various coal power plants, South Korea. According to the analysis of coal ash samples Yttrium has higher quantity compared to other rare earth elements presented in coal ash samples. We attempted the extraction of yttrium from coal ash samples by solvent extraction using PC 88 A extractant.
Keywords—Coal Ash, Rare Earth Elements, Yttrium, Coal Power Plants
I. INTRODUCTION HE rare earths or rare-earth elements (REEs) are a group
of 17 chemically similar metallic elements (15 lanthanides, including scandium and yttrium). Rare earth elements play an important role in many industrial, petroleum refining, clean energy, automobile, electronics etc. applications and in the military also, widely used for precision-guided munitions, communication systems, lasers, radar systems, avionics, night vision equipment and satellites. These rare earths are highly demanded and essential to the success of green technologies [1]. (Fig.1). Figure.2 shows global demand and consumption of yttrium in phosphors.
Yttrium demand is growing in phosphors used in fluorescent lamps and increasing use as LCD backlights. Beyond 2017/2018 rates of growth may depend on the extent to which
This research was supported by a grant (2013) from the Energy Technology
Development Program (2013T100100021) funded by the Ministry of Trade, Industrial and Energy of the Korean government.
F. A. Author is with the Mineral Resources Research Division, Korea Institute of Geoscience and Mineral Resources, Daejeon 305-350, Republic of Korea. (e-mail: [email protected])
S. B. Author, Jegal., was with University of Science & Technology, 217 Gajeong-ro Yuseong-gu, Dajeon, 305-350 Korea. She is now with the Department of Resources Recycling, University of Science & Technology, 217 Gajeong-ro Yuseong-gu, Dajeon, 305-350 Korea. (e-mail: [email protected])
T. C. Co Author is with the Mineral Resources Research Division, Daejeon 305-350, Republic of Korea, Korea Institute of Geoscience and Mineral Resources, Daejeon 305-350, Republic of Korea (Corresponding Author's phone: +82-10-8805-3384; fax: +10-42-861-3990; e-mail: [email protected])
LED lamps replace fluorescent lamps. In Europe a system for recycling fluorescent lamps has been in place for some time-but until 2012, rare earths were not recovered.
U.S. Department of Energy (DOE) 2010-2011 Critical Materials Strategy reports includes criticality assessments, and technology analyses to address critical materials challenges. Five rare earth elements (REEs)—dysprosium, terbium, europium, neodymium and yttrium—were found to be critical in the short term (present–2015)[2]. DOE’s strategy of critical materials research and development (R&D) plans three ways: 1.Diversifying supply 2.Developing substitutes and 3. Improving recycling.
Fig. 1 Rare Earths Applications in Green Technologies
Fig. 2 Yttrium estimated consumption in phosphors 2000-2017F, (t
REO)
Characteristic Studies of Yttrium Extracted from Coal Ash, South Korea
Thenepalli Thriveni, Yujin Jegal, and Ji Whan Ahn*
T
Recent Advances on Energy, Environment, Ecosystems, and Development
ISBN: 978-1-61804-291-0 20

II. RARE EARTH APPLICATIONS AND STATUS OF US, SOUTH KOREA
A. The applications of Rare Earth The applications of rare earths are prominent in green
technological areas. The use of REEs to combat global warming and improve energy efficiency has attracted significant attention. The use of several REEs in petroleum fluid cracking catalysts and automotive pollution control catalysts is well known. REE used in magnets reduces the weight of many pieces of equipment such as automobiles. Some REEs are used in in the reduction of carbon dioxide emissions, and have attracted noteworthy attention from public and governmental authorities.
B. Status of USA in Rare Earths Applications
According to the USGS survey, U.S. demand for rare earth elements are also projected to rise as per world demand continues to climb. Demand increases are also expected for rare earths in flat panel displays, hybrid vehicle engines, and defense from cruise missiles to missile guidance systems, smart bombs, night-vision technology and medical applications. The 2015 composition of U.S. and world demand is shown in Fig. 3[3].
Fig. 3 Rare earth metals demand by application U.S and World,
2015
C. South Korea South Korea has lack of rare earth deposits and imports from
China. Recent china rare earth export limitation looking for alternative sources of rare earth elements.
D. Alternative sources for rare earth elements
Yttrium was extracted from Korean coal ash by solvent extraction. This is the other alternative sources of rare earths. South Korea has found an undetermined amount of rare earth minerals in a deposit in the eastern Gangwon province, state-run Korea Resources Corp (KORES). The South Korean state-run mining firm discovered veins containing rare earths while re-developing an iron ore mine.
III. YTTRIUM GLOBAL DEMAND AND ITS APPLICATIONS Yttrium oxide (Y2O3) is the critical enabler of energy
efficient lamps, ubiquitous electronic devices, and other advanced materials used in defense, aerospace, energy
infrastructure, and medical applications. Critical as it may be, the market is being hampered by a fog of uncertainty because of China’s hegemony over global Y2O3 production [4].
Yttrium is quite used in ceramics, producing alloys, and optical glasses (See Figure 4). It is also used in special catalysts and in opto-electronic devices such as lasers, filters for microwaves and europium "phosphorus" for the red color in television sets. Some of its isotopes are radioactive, being used in cancer radiotherapy.
Fig. 4 Yttrium end use applications
IV. YTTRIUM EXTRACTION FROM COAL ASH Figure 5 showed the molecular structures of extractants.
Figure 6 showed the flow sheet of yttrium extraction by using several kinds of extractants such as PC 88A, Cyanex 272 and Cyanex 302. Among these extractants PC 88A is more suitable for the yttrium extraction.
Fig. 5 Molecular structures of extractants
Fig. 6 Flow sheet of yttrium extraction(based on Literature Survey)
Recent Advances on Energy, Environment, Ecosystems, and Development
ISBN: 978-1-61804-291-0 21

Yttrium compounds have the following uses: Yttrium oxide is used to produce yttrium iron garnets which
are useful microwave filters. Yttrium oxide is used in ceramic and glass formulations as it has a high melting point and imparts thermal shock resistance and low expansion characteristics to glass • Yttrium oxide is widely used for making compounds such as
YVO4europium and YVO4europium phosphors which are responsible for the red colour in television tubes. • Yttrium iron (Y3Fe5O12), yttrium aluminium (Y3Al5O12) and
yttrium gadolinium garnets possess interesting magnetic properties. Yttrium iron garnets are extremely efficient transmitters and transducers of acoustic energy. Yttrium aluminium garnet has a hardness of 8.5 and is finding application as a gemstone (synthetic diamond)
V. IMPORTANCE OF COAL ASH RECYCLING
A. Environmental problem of Coal ash dumping
The process of coal combustion results in the generation of coal combustion residues (CCRs). Coal combustion residues (CCRs) include materials that are left over after the burning of coal. They are fly ash, bottom ash, boiler slag and flue gas desulfurization (FGD) materials (wet or dry).
Coal-burning pollutes the environment by releasing a wide range of toxins-sulfur, carbon monoxide, nitrogen oxide, carbon dioxide, Heavy metals- Hg, As, Pb and radioactive materials. Coal-fired plants generate tons of toxic residue and most of them is buried in landfills or stored in open ponds. In 2008, TVA Kingston Fossil Plant in Tennessee is holding pond failed and released 1.1 billion gallons of residue into nearby rivers.
B. Characteristics of REEs in World-wide produced Coal Ash
From the surveys of coal resource, some deposits may contain economically viable concentrations of rare elements. The combustion process of coal results in the enrichment of metal concentrations in the coal ash waste which is several times the concentration found in raw coals. The range of strategic metal concentrations in coal ashes, similar to those from mineral ores. Coal ashes are possible resources for metal recovery.
Here we reported the mean concentrations of coal ash from power plants in the U.S, Europe, Mexico and Spain, Russia, China [5]. It is clear from Table 1 that natural rare earths concentrations varies greatly among different kinds of coal and depends generally to ash content. Table 1 data showed the rare earths concentration in coal is lower than that of coal ash and it is the major evidence of the alternative source for rare earths.
Table. 1Mean concentration of coal ash from power plants ( U.S, Europe, Mexico and Spain, Russia, China)
As an representative example, Seredin and Dai (2012)
researched that U.S., Chinese, and Russian coal source contain concentrations within the range of mineral ore deposits. So, Initial metal recovery from coal ash is more efficient than ore processing. Figure (7)[6]. shows the average concentration of Rare Earth Elements in World coal ash, representing high concentration of Y. Different regions have various sources of REE. For Coal Ash REEs Recycling, it is vital to study and classify the characteristics of REEs from coal ash comparing with the Origin of Coal regionally.
Fig.7 Unit: mg/kg; Mean of Concentration of coal ash from Power
plants in the U.S, Europe, Mexico and Spain, Russia, China
C. Recovery REEs from Coal Ash Raw unprocessed coal contains a variety of metals, and in
some cases, enriched concentrations of some strategic elements. Surveys of coal resources indicate that some deposits may contain economically viable concentrations of rare elements. High commodity prices are encouraging development of processes to extract minerals, metals and rare earths from coal ash deposits. In such cases, recovered ash can supply high-demand materials (i.e.: alumina, magnetite, and germanium). Such new and emerging technologies allow resource recovery at an economically competitive cost.
The U.S produces 70 million new tons/year of fly ash. In the
Recent Advances on Energy, Environment, Ecosystems, and Development
ISBN: 978-1-61804-291-0 22

Laboratory investigation, Neumann Systems Group(NSG) successfully extracted near 60% of 11 Rare Earth Elements from and 99% of select REEs and ~99% CaO extraction. Since 2013, NSG has planned to produce 14,000 tons/year from Single Process Train Plant. 14 Rare Earth Elements were recovered and simultaneous removal of hazardous materials such as mercury and arsenic. The Extracted metals ranges between $400 to $750 per ton of fly ash. Basic extraction process, and supercritical carbon dioxide (ScC02) and a co-solvent extraction process. Scandium and Yittrium were selectively removed together by the supercritical carbon dioxide (ScC02) extraction process.
VI. COAL POWER PLANTS AND COAL ASH PRODUCTION IN SOUTH KOREA
Fig. 8 shows the rate of coal fired power plant is increased by 6th Electric Supply Government Plan. 2.2% of annual electrical consumption will be increased as 6th Electric Supply Government Plan. So it will be hard to reduce the emission rate of Green-house gases with this value[7].
A. Coal Power Generation in South Korea
Fig. 8 Increased trends of construction of Coal-fired power plants in
South Korea
B. Coal Ash Production in South Korea
Fig.9 Production(Black) and Recycling(Blue) of Coal combustion product(Coal ash), South Korea.
Fig.9 shows production of coal ash from South-East Power Plant including Samcheonpo power plant, Yeongheung power plant, Yeongdong power plant and Yeosu power plant located in South-east part of South Korea (unit: ton)[8].
VII. THE STATUS AND SITUATION OF CRITICAL ELEMENTS IN SOUTH KOREA
REEs Market of Korean Industry is about 2,9658million $ scale. Korea imports REEs as half-finished or finished products.
Cerium is highly demanded critical element in Korea, especially for abrasives. Samsung Corning Co. and Hankuk Electric Glass Co. are occupying 74. 8% of Ce Industry in Korea. Korea imports 500 ton of Yttrium and Europium annually. Yttrium Oxide (Y2O3) and Europium (Eu2O3) are used for Red Color in the phosphor screen of the cathode ray tube in TV by Samsung SDI Co., LG Chem and Korea zinc. Wookyung Steel Co. contracts with CNC world, valued at $192million for supplying Yttrium Oxide in 2011. Samsung Electronics use Neodymium for Permanent Magnets. TMC Korea produces value-added nonferrous metals from scrap generate various sources including the secondary battery, super alloy, semiconductor, spent catalysts, samarium-cobalt magnet, titanium, zirconium, molybdenium, and other relevant materials. Also, Korea imports Ga from China, particularly Korea noble metals Co. imports, recycles and refines.
VIII. EXPERIMENTAL RESULTS & CHARACTERISTICS OF REES IN COAL ASH, SOUTH KOREA
A. XRF & XRD experimental results of the samples.
Bottom ash (Tean) is provided Tean thermal power plant in South Korea. Fly Ash (Samcheonpo) is Samcheonpo power plant, located in South-east part of South Korea. Fly Ash(Japan) is provided from Japan for comparison(Table 2).
Table. 2. XRF Results of Coal Ash from South Korea & Japan
Recent Advances on Energy, Environment, Ecosystems, and Development
ISBN: 978-1-61804-291-0 23

5 10 15 20 25 30 35 40 45 50 55 60 650
200
400
600
800
1000
1200
In
tens
ity
2 Th
م،
م،
ه،
ه،؛¢
ك،ك،ك، ك،
ك،ك،ك،ك، ك،ك،ك،ك،ك،
ك،ك،
؛¢
؛¢ك، Mullite (3Al2O3∗2SiO2)
Quartz low (SiO2)
Lime (CaO)
Tridymite (SiO2)
Fig. 10. XRD of Bottom ash (Tean)
10 20 30 40 50 600
200
400
600
800
1000
1200
؛¢؛¢؛¢؛¢
؛¢؛¢؛¢؛¢؛¢
؛¢؛¢
ك،ك،
ك،ك،
ك،
ك،
Inte
nsity
2 Th
؛¢
ك، Quartz low (SiO2)
Mullite (2Al2O3 SiO2)
Fig. 11. XRD of Fly Ash (Samcheonpo)
10 20 30 40 50 600
200
400
600
800
1000
1200
Inte
nsity
2 Th
؛¢؛¢؛¢
؛¢؛¢؛¢؛¢
؛¢؛¢
؛¢؛¢
ك، ك،ك،ك،
ك،
ك،
؛¢
ك،
Quartz low (SiO2)
Mullite (2Al2O3 SiO2)
Fig. 12. XRD of Fly Ash(Japan)
B. REEs Concentration of Coal Ash samples
Table. 3 The concentration of REEs in bottom ash, fly ash and fly
ash from Japan samples
Table. 3 The concentration of REEs in
Bottom Ash(Tean)
Fly Ash(Samcheonpo)
Fly Ash(Japan)
(㎍/g)
Y 40 21.3 15.3
La 38.8 24.1 18.8
Ce 83.5 52.6 40.8
Pr 9.62 6.04 4.74
Nd 36 22.9 18.5
Sm 7.62 5.02 3.9
Eu 1.68 1.02 0.9
Gd 8.16 5.48 4.4
Tb 1.4 0.96 0.76
Dy 7.62 5.12 4.02
Ho 1.62 1.08 0.9
Er 4.56 3.24 2.56
Tm 0.7 0.48 0.4
Yb 4.42 2.9 2.44
Lu 0.72 0.46 0.38
Th 14.6 9.6 6.78
U 4.46 2.82 1.96
IX. CONCLUSION China’s control over the rare earth market, coupled with the
growing world demand and the importance of Rare Earth Metals has caused many countries to develop concerns about the security of the Rare Earth Metals supply chain and DOE published Critical Materials Strategy. Significantly increasing of rare earth elements’ price, rare earth requires a ‘convergence technology’ for the waste utilization from coal power plants and other key applications such as military defenses. Due to increase of coal power plant after Fukushima impact and abundance of world-wide coal reserves, recovery of rare earth critical elements from power plants waste ash (bottom ash, fly ash) is an ideal approach; it has been proved to be an effective way for CO2 sequestration for CO2 reduction and stabilization of hazardous heavy metal by accelerated Carbonation.
ACKNOWLEDGMENT This research was supported by a grant (2013) from the
Energy Technology Development Program (2013T100100021) funded by the Ministry of Trade, Industrial and Energy of the Korean government
REFERENCES [1] M. Richard, "Rare Earth Struggle Intesifies(rare earth metals demand for
the cleantech industry, world markets:2011-2017)", Article, 2011 [2] Critical Materials Strategy, by U.S. Department of Energy(DOE), 2010,
2011.
Recent Advances on Energy, Environment, Ecosystems, and Development
ISBN: 978-1-61804-291-0 24

[3] M. Humphries, “ Rare Earth Elements: The Global Supply Chain” CRS Report for Congress, 2013.
[4] R. Castilloux., "Yttrium shortages are imminent: Illuminating opportunities for players to stay engaged, Adams Intelligence, Critical metals and minerals research", 2013
[5] V.V.Seredin, S. Dai, “Coal Deposits as Potential Alternative Sources for Lanthanides and Yttrium”, International Journal of Coal Geology, 94, 2012pp.67-93.
[6] B.David National Energy Technology Laboratory, 2013. [7] The 6th Basic Plan for Electricity Sand Demand, The Ministry of
Knowledge Economy(2013-2027),2013. [8] http://www.kosep.co.kr/
Recent Advances on Energy, Environment, Ecosystems, and Development
ISBN: 978-1-61804-291-0 25

Abstract— Bioclimatic buildings utilize natural sources to meet
their energy requirements for heating, cooling, and lighting purposes, whereas conventional buildings utilize fossil fuels. The objective of this study is to propose solutions to ensure comfort conditions for users by taking advantage of the bioclimatic architecture, which could serve as a solution to the energy shortage problem. In this context, 40 bioclimatic buildings located in Greece were analyzed. These bioclimatic buildings were classified according to their climatic zones, functions, parameters pertaining to the physical and built environment, and the passive methods used for heating, cooling, and lighting.
Keywords— Bioclimatic buildings, cooling & heating, lighting, renewable energy sources
I. INTRODUCTION N increase in energy demand has led to diminishing energy sources. A total of 40% of all energy consumed throughout the world is used for the heating, cooling, and
lighting of buildings. Therefore, it is important to design buildings in an energy-efficient manner. Methods that are geared toward the use of renewable energy sources (e.g., solar, wind, and geothermal power) to meet the heating, cooling, and lighting requirements of buildings constitute the backbone of bioclimatic architecture.
Bioclimatic architecture refers to designing buildings and spaces (interior–exterior) with low energy consumption, based on local climate conditions. The goal of bioclimatic architecture is to provide thermal and visual comfort, making use of solar energy and other natural sources [1], [2], [3]. It may also be defined as the process of designing environmentally friendly buildings that, for the purpose of ensuring the users' thermal and visual comfort, utilize renewable energy sources, take into account the region's climatic data and topographic location, and aim to reduce the consumption of conventional fuels [4], [5]. The process of bioclimatic design involves adapting the building and integrating it with its environment by taking into consideration the regional climatic conditions and the relevant environmental factors. The aim of this process is to reduce the amount of energy consumed for heating, cooling, and lighting purposes without affecting the users' comfort conditions [6], [7], [8]. Bioclimatic architecture creates a selective envelope of opaque
Asst. Prof. S. Kartal, Trakya University, Faculty of Architecture, Department of Architecture, Edirne, 22100 TURKEY (phone: 0090-532-176-90-22; fax: 0090-284-225-69-95; e-mail: [email protected])
M. Arch. Ö. Chousein, Νικ.Μυσιρλη, 24 69100 Κομοτηνή, GREECE (phone: 0030-699-700-28-35; e-mail: [email protected]).
and transparent components between the interior and the exterior environment, ensuring protection against undesirable external effects while benefiting from their useful aspects.
In her study, Kartal compared the rates of energy gained by a sample building through various elements of solar architecture, such as a greenhouse, a Trombe wall, and a transparently insulated wall in varying degree-day regions. She used the "Unutilizability Energy Method" in her study [9]. Mantziou examined the applications in bioclimatically designed residential and public buildings in Greece [10]. Tompazis studied the passive systems and the design criteria used in bioclimatic architecture in his own designs, as well as in other designs throughout the world [11]. Zafeiropoulos addressed the parameters that influence bioclimatic architecture [6]. He also explained the methods for utilization of renewable energy sources in bioclimatic architecture with several examples of bioclimatic buildings located in Greece and throughout the world. In his study, Axarli compared the amount of annual energy consumption of houses in Greece with that of EU countries and non-EU Eastern European countries [1]. He also defined the methods that are used in bioclimatic architecture for the purpose of solving the energy shortage problem, and the parameters that influence comfort conditions [1]. In his thesis, Tzika addressed the building energy-efficiency policies of Greece and European Countries while defining the active systems used for heating, cooling, and lighting within the scope of bioclimatic architecture and conducting an economic analysis of the same [12]. The author calculated the annual energy consumption and cost for a sample building in Greece according to four climate zones.
II. PARAMETERS THAT AFFECT BIOCLIMATIC ARCHITECTURE The physical and built environmental parameters of the
region where the building is located are as important as “the renewable energy gain systems” used in buildings. Physical environmental parameters refer to the climate, topographic structure, and vegetation of the region where the building is located. Built environmental parameters refer to factors that are generally determined during the design phase, “such as the location of the building on the land” its orientation with respect to the sun, interaction with other buildings, building envelope and insulation characteristics, building openings, and space organization. Bioclimatic architecture involves the utilization of renewable energy sources in an evaluation of these parameters [13].
Methods for the utilization of renewable energy sources in bioclimatic architecture can be classified as active, passive, and mixed (active + passive). Active (effective) utilization
Utilization of Renewable Energy Sources in Bioclimatic Architecture in Greece
Semiha Kartal, Ömer Chousein
A
Recent Advances on Energy, Environment, Ecosystems, and Development
ISBN: 978-1-61804-291-0 26

methods require additional energy to generate energy or to heat the relevant space. Supplementary fans, pumps, and liquids are used to generate such energy. Passive (inactive) utilization methods allow for energy generation by utilizing the source of energy, without requiring any auxiliary systems. Mixed (effective + inactive) utilization methods are systems in which a combination of active and passive methods is used. Such systems involve usage of passive systems combined with active equipment [13].
The majority of methods for the utilization of renewable energy sources in bioclimatic architecture are based on solar, wind, geothermal, and biomass energy sources, and they are used for heating, cooling, and lighting purposes. Heating energy gain leads to energy conservation through reducing energy consumption by appropriately positioning the designed space with respect to the sun, so as to allow for the utilization of solar heat. In the northern hemisphere, the southern direction is of particular importance for heating the designed space during the winter, and also for providing protection from the sun light during the summer. Taking this into account, methods such as south openings, roof openings, sun walls (Trombe wall + water wall + transparently insulated wall), greenhouse, roof pool, thermosiphon systems (continuous circulation loop), and double enveloping may be implemented for the building envelope [13].
To achieve comfort conditions, cooling of buildings is just as important as heating. The primary aim of cooling is to protect the building from exterior temperature while the polluted inside air is replaced with the clean outside air. Different methods, namely ventilation, radiation, evaporation, and soil cooling, can be used to achieve this goal [13].
As for lighting energy, the buildings generally utilize daylight by means of windows and other openings. However, these openings may not always be sufficient based on the size and depth of the relevant space. As one moves further away from the windows or openings, the influence of the daylight diminishes and becomes insufficient. In such cases, passive methods may also be utilized as an alternative to active methods in order to enhance the effect of daylight. Systems that passively utilize solar energy for the purpose of lighting spaces are also available. These methods, which are becoming more widely used every day, illuminate spaces that cannot benefit from natural lighting by directing, reflecting, or transferring daylight. Examples include light shelves, light shutters, light tubes, heliostat, prismatic systems, and special glasses (photochromic, thermochromic, electrochromic, gasochromic, liquid crystal glasses) [13].
III. METHODOLOGY OF THE STUDY First of all, a climate zone was selected in order to
determine its potential for bioclimatic architecture. The bioclimatic architectural buildings in this climate zone were examined in terms of physical and built environmental data. The distribution of these buildings according to their functions was studied. Renewable energy sources that were used within the bioclimatic architecture, as well as the utilization ratios of
passive methods for heating, cooling, and lighting through such sources, were determined.
IV. THE CLIMATE ZONE OF THE STUDY Greece is located at latitudes of 34–42o North. The country's
northern regions are influenced by the climate conditions of southeast Europe, while its southern regions are influenced by the Mediterranean climate [14]. Greece has a climate that is mild and humid during the winters, and hot and dry during the summers. The country enjoys sunny days most of the year, without any clouding for fairly long periods of time. Although Greece's climate remains within the boundaries of the Mediterranean climate, different areas of the country have different climates. The variation in Greece's climate is attributed to the topographic structure of the country, with varying altitudes (mountain ranges that stretch along the entire country) and land-sea variation. Different regions with different altitudes, different distances to the sea, and different insolation rates lead to varying climates within the country. Therefore, Greece's climate can be divided into four climatic regions: Highland Greece, Northern Greece, the Ionian, and the Aegean (Fig. 1) [15].
Fig. 1. Climatic regions of Greece [15].
V. RESULTS OF THE STUDY The distribution of bioclimatic buildings according to the
climatic regions in Greece was found to be as follows: 27 buildings in the Aegean Region, 7 buildings in Northern Greece, 5 buildings in Highland Greece, and 1 building in the Ionian Region (Fig. 2).
Recent Advances on Energy, Environment, Ecosystems, and Development
ISBN: 978-1-61804-291-0 27

Fig. 2. Distribution of bioclimatic applications in Greece, according to climatic regions (%) [15].
When the distribution of these bioclimatic buildings according to their functions was examined, it was found that 21 of these buildings were used as residential buildings, 5 were used as office buildings, 11 were used as public buildings, and 3 were used as commercial buildings (Fig. 3).
Fig. 3. Distribution of bioclimatic buildings according to their functions (%) [15].
An evaluation of these buildings in terms of physical and built environmental parameters revealed that topographic factors were considered in 9 of these buildings, climatic factors were considered in 40, vegetation was considered in 18, building location was considered in 11, building orientation was considered in 34, building form was considered in 20, building openings were considered in 2, envelope and insulation were considered in 40, space organization was considered in 28, material selection was considered in 19, and ventilation system was considered in 40 buildings (Fig. 4).
Fig. 4. Consideration of physical and built environmental parameters in the bioclimatic buildings (%) [15].
Bioclimatic architecture allows for the utilization of solar energy, wind energy, geothermal energy, and biomass energy through active methods. An examination of these buildings in terms of active utilization of renewable energy sources revealed that 12 of these buildings actively utilized solar energy, 3 of them actively utilized geothermal energy, and 14 actively utilized biomass energy. It was found that none of the buildings actively utilized wind energy (Fig. 5).
Fig. 5. Utilization ratios of renewable energy sources in bioclimatic buildings (%) [15].
The examined buildings were evaluated in terms of the utilization ratios of passive methods for heating, cooling, and lighting. It was found that 39 buildings had opening towards south, 27 had roof openings, 7 had sun walls, 11 had greenhouses, 4 had thermosiphon systems, 2 had transparent insulation, and 2 had double envelope system implemented as a passive method for heating (Fig. 6).
Recent Advances on Energy, Environment, Ecosystems, and Development
ISBN: 978-1-61804-291-0 28

Fig. 6. Utilization ratios of passive methods used for heating (%) [15].
It was found that 40 buildings were equipped to utilize ventilation as a passive method for cooling, while 5 were equipped to utilize radiation, 5 were equipped to utilize evaporation, and 2 were equipped to utilize soil as a passive method for cooling purposes (Fig. 7).
Fig. 7. Utilization ratios of passive methods used for cooling (%) [15].
While windows were preferred as a passive method for lighting purposes in 40 of the examined buildings, 27 buildings were equipped with roof openings, 2 were equipped with light shelves, and 1 was equipped with special glasses for the same purpose (Fig. 8).
Fig. 8. Utilization ratios of passive methods used for lighting (%) [15].
VI. EVALUATION In this study, 40 buildings were examined in order to
determine Greece's bioclimatic architecture profile. In this context, the following aspects were evaluated: the distribution of bioclimatic buildings according to Greece's climatic regions; consideration of physical and built environmental parameters in these buildings; utilization ratios of passive methods used for heating, cooling, and lighting; and renewable energy sources that were actively utilized in these buildings.
This study revealed the importance of bioclimatic applications in creating energy-efficient buildings. It is also important in terms of setting an example for creating bioclimatic architectural profiles of other countries.
The high share of residential buildings in the distribution of Greece's bioclimatic buildings according to climatic zones can be attributed to the higher number of users that residential buildings have when compared to other types of buildings. Among the physical environmental parameters, climatic parameters were found to be highly influential. Other parameters had less significant effects, depending on land conditions. Among the parameters pertaining to the built environment, parameters such as envelope-insulation, ventilation system, and orientation of the building were found to have a higher influence on account of their convenient application. Water walls and roof pools were not used in any of the buildings; this was possibly due to the difficulties imposed by their application and aesthetic concerns. Cooling by means of ventilation was found to be widely preferred over other methods due to its ease of application. Passive methods such as light shutters, light tubes, heliostats, and prismatic systems were not used in any of the buildings, as they have yet to become widespread in line with the advances in technology.
REFERENCES [1] K. Axarli, “Γενικές Αρχές του Βιοκλιματικού Σχεδιασμού”, Τ.Ε.Ε.
Τμήμα Κεντρικής Μακεδονίας, Selanik, 2009. [2] N. Chrisomallidou, “Βιοκλιματικός Σχεδιασμός Κτιρίων”, ΚΤΊΡΙΟ
journal, vol. 136, 2001, p. 31. [3] Ε. A. Lazari, “Βιοκλιματικός Σχεδιασμός Κτιρίων στην Ελλάδα”,
ΚΤΊΡΙΟ Journal, vol. 146, 2002, p. 45. [4] Μ. Αrgiraki, “Βιοκληματικός Σχεδιασμός, Ηλιακά Παθητικά
Συστήματα και Άλλες Τεχνικές Εξοικονόμησης Ενέργειας στον Κτηριακό Τομέα”, Ε.Μ.Π. Τμήμα Μηχανολόγων Μηχανικών, Τομέας Θερμότητας, M. Arch. thesis, Athens, 2008.
[5] C. Siampekou, “Λειτουργική και Αισθητική Ένταξη Συστημάτων Αξιοποίησης της Ηλιακής Ενέργειας στα Κτίρια”, M. S. thesis, University of Patras, Faculty of Positive Sciences, Department of Biology, Patras, 2005.
[6] A. Zafeiropoulos, “Ενεργειακή Μελέτη Κτιρίου με Βιοκλιματικά Κριτήρια”, M. S. thesis, University of Patras, Department of Electrical Engineering and Computer Technology, Patras, 2011.
[7] Β. Μαρουλάς, “Oδηγός Ενεργειακού Σχεδιασμου – Βιοκλιματική Αρχιτεκτονική & Εξοικονόμηση Ενέργειας”, Κτίριο Εκδόσεις Ε.Π.Ε., Thessaloniki, 2011.
[8] D. Aravantinos, “Κλίμα & Βιοκλιματική Αρχιτεκτονκή”, ΚΤΙΡΙΟ, Aρχιτεκτονική & Ενέργεια, Τεχνικές Σελίδες, 2009.
[9] S. Kartal,“Calculating thermal efficiency of solar elements with respect to structural constructions and climatic conditions in Turkey”, PhD Thesis, TU Institute of Science, Turkey, 2009.
[10] L. Mantziou, “Βιοκλιματική Αρχιτεκτονική στην Ελλάδα”, ΕΡΓΟΝ ΙV Εκδόσεις Αρχιτεκτονικών Βιβλίων, Athens, 2009.
[11] A. Τombazis, “Οικολογική Σκέψη & Αρχιτεκτονική”, Εκδοτικός Οίκος Μέλισσα, 2010.
Recent Advances on Energy, Environment, Ecosystems, and Development
ISBN: 978-1-61804-291-0 29

[12] B. Tzika, “Ηλεκτρομηχανολογικά Συστήματα Κατοικιών στην Αειφόρο Δόμης. Αξιολόγηση Συνεισφοράς Ηλιακών Συλλεκτών σε Συμβατικό Σύστημα Θέρμανσης σε Μικρή Ανεξάρτητη Κατοικία στην Ελλάδα”, Master’s Thesis, University of Macedonia, Department of Business Administration and Organization, 2008.
[13] Ö. Chousein, “Bioclimatic Architecture and its Assessment under the Climatic Conditions of Greece”, M. Arch thesis, TÜ Institute of Science, Edirne, 2013.
[14] www.greenbelt.gr [15] www.astakos-news.gr
Recent Advances on Energy, Environment, Ecosystems, and Development
ISBN: 978-1-61804-291-0 30

Abstract— The present research introduces a new methodology
for wind farms maintenance, based on Analysis of Variance, that can be easily implemented by the own operator. This methodology, based on the one-way analysis of variance (ANOVA) study indications, allows to obtain the exact operating range at which each of the most common different errors in wind farms, like freezing of anemometers, excessive orientation time errors, brake shoe excessive temperature, emergency stop, and asymmetric currents, among others, used to happen. Essentially, these errors usually appear under certain weather, temperature, and wind velocity conditions, in such a mode that they can be modeled as a function of wind velocity and wind direction. In a similar way, other analyzed errors, such as starting problem and the error in current phase sequence, showed a tendency to appear under determined wind orientation.
Keywords—Wind Turbine, Wind Farm Operation, Maintenance, Weather, ANOVA.
I. INTRODUCTION URING the last years, several methods for wind farm operation has been presented, covering some aspects of
the life cycle processes of wind power systems: design and development, production and construction, diagnostics, proactive and predictive and preventive maintenance, among others. [1]. In particular, a few condition monitoring systems (CMS) based on simple algorithms has been proposed to estimate the behavior of wind farms, trying to predict wind power production from an instantaneous sampling of wind speed [2-10]. Nevertheless, there are some other critical weather variables, which were hardly ever considered previously, such as moist air density and temperature and wind direction, that must be analyzed in-depth to be able to make a worthy prediction of wind energy production [8, 11]. In this way, if future investigations get to define which are the exact values of these variables at which an error is expected to
A. Costa, F. Fraguela and J. A. Orosa are with the Department of Energy and Marine Propulsion of the University of La Coruña (Spain). E.T.S. Náutica y Máquinas, Paseo de Ronda 51, 15011 La Coruña, Spain.
J. A. Pérez is with the Department of Industrial Engineering II of the University of La Coruña (Spain). Escuela Politécnica Superior, c.\ Mendizábal, s/n, 15403 Ferrol (La Coruña), Spain. Phone: 34981167000-3252; Fax: 34981337410; e-mail: [email protected].
happen, new telemaintenance systems could be developed, and define an “intelligent” maintenance methodology. An interesting example of real-time maintenance applications where these new algorithms could be implemented, is the intelligent system for predictive maintenance applications (SIMAP), a complex algorithm to optimize and dynamically adapt a maintenance calendar of a wind turbine in accordance with its real needs [12].
Previous research works about maintenance tasks in real wind farms showed that the statistical control process is a very interesting method for developing wind farm real-time maintenance procedures [13].
Furthermore, results showed that weather conditions are related with main maintenance errors, and that wind velocity is not the only variable that must be taken into consideration at the time when analyzing weather and maintenance errors [8].
Nevertheless, till now, it has not been possible to exactly define the conditions under which the most common errors in wind farm operation can be expected to happen, even when this would be very useful as a base for developing an appropriate algorithm for maintenance applications, in such a way that an in-depth analysis of each different maintenance error, and the weather conditions under which it happened, must be carried out [8].
In the present research work, a real case study of maintenance tasks in a wind farm during the course of a year has been developed with the aim to define new and more precise maintenance procedures, using as main tool, a statistical study, based on one-way analysis of variance (ANOVA), considering more than 51 errors.
II. A SHORT INTRODUCTION TO WIND FARMS
A. Key Components of a Wind Turbine Before analyze the most common errors that take place in
different wind farms, it results very interesting introduce a brief description of a wind farm’s main components, and the energy conversion process [4, 11].
Basically, it is wind energy what directly moves the blades of each wind turbine, which axle are connected to a gearbox that converts the movement derived from wind speed, usually a variable rotation in the range from 17 to 25 rpm, in a uniform rotation with the appropriate angular velocity for the
A New Understanding of Wind Energy Production Maintenance Based on Analysis of
Variance Ángel Martin Costa, Feliciano Fraguela, José Antonio Orosa, and José Antonio Pérez
D
Recent Advances on Energy, Environment, Ecosystems, and Development
ISBN: 978-1-61804-291-0 31

production of electrical energy in the generator, typically 1000 or 1500 rpm, as can be seen in Figure 1:
Fig. 1 Wind turbine electrical system
The electrical power thus obtained must be regulated and compensated in a capacitor bank, before passing through a transformer, and being ready to be plugged into the electrical network.
This process is controlled by different algorithms in order to optimize the electrical power generated, and to prevent any kind of damage to the wind farm’s components [11].
B. Wind Farms Main Errors and Faults With the help of a wind farm operator’s experience, it was
possible to detect a wide variety of errors from the sampled data of a functioning wind farm [8].
After a primary analysis, the main errors has been defined and described statistically in accordance with the economic costs involved, as a function of the stoppage time resulting from each error: 1) Brake shoe temperature error: this kind of failure is
derived from high temperature developing in the brake shoe. If the temperatures reached exceed the difference of 20 °C between nacelle and brake shoe temperatures, it implies, in many cases, an emergency stop.
2) Asymmetrical currents error: this failure is caused by a reduction in the electrical power generation, or electrical reactive power compensation, due to failures in the capacitors or thyristors of the electrical production control system of the wind turbine.
3) Low hydraulic oil level error: this failure is related with the nacelle rotation and the air brake systems. Frequently this errors are caused by oil leaks in the rotating cylinder, in the callipers, or at the top of the central hydraulics.
4) Excessive external vibrations error: this error occurs when the vibration level exceeds a preset level due to some component falling in a state of disrepair, being usually the solution for this error replacing the nacelle swing clamps.
5) Emergency stop error: this is a critical failure of the safety circuit of the wind turbine, typically produced by malfunction in the fans employed to cool the current compensation module.
6) Oil level failure in the gearbox error: basically, oil level failures are due to oil leaks in the lubricated elements.
Figure 2 shows the frequency of errors in each month during one year in the considered installation.
Fig. 2 Wind farm errors with time Figure 3 presents the yearly wind speed in the same period.
0
5
10
15
20
25
30
35
40
45
11/1 11/25 12/6 12/29 1/14 1/20 2/3 2/13 3/25 5/19 7/22 9/10Time (days)
Win
d sp
eed
(km
/h)
Fig. 3 Yearly wind speed From both figures, it can be inferred that during the windy
months, the maximum number of errors occurs, pointing to some kind of interrelation between both parameters, which will be completely analyzed in the following sections.
III. PREVIOUS CONSIDERATIONS
A. Weather Conditions Data As was commented earlier, a functioning wind farm has
been sampled, and the main errors were associated with weather conditions, temperature, relative humidity, air velocity and direction sampled in a nearby weather station.
Sampling frequency of weather conditions was 10 minutes during a period of one year, obtaining more than 60,000 samples.
B. ANOVA ANOVA is a powerful technique for analyzing the way in
which the mean of a variable is affected by different types and combinations of factors [14, 15].
ANOVA tests the null hypothesis that samples in two or more groups are drawn from the same population, or what is the same, if the groups have approximately equal variance on the dependent variable.
0
5
10
15
20
25
30
35
40
45
11/1 11/25 12/6 12/29 1/14 1/20 2/3 2/13 3/25 5/19 7/22 9/10Time (days)
Erro
r cod
e
Recent Advances on Energy, Environment, Ecosystems, and Development
ISBN: 978-1-61804-291-0 32

This variance is defined as the sum of the square deviations about the means (SS), divided by the degrees of freedom, as shown in Equation (1):
dfSSMSs ==2 (1)
Therefore, ANOVA gives a single overall test of whether there are differences between groups or treatments, defining a significance index.
When interpreting a significance value, it can be concluded that variances are significantly different between groups of data, if they are small enough, and less than 0.05 (5%), so they are out of a 95% confidence interval which is considered adequate in most statistical research works.
In this work, it has been employed ANOVA study and a post-analysis using Tukey’s HSD with the SPSS 19 software to perform the post-test of the pairwise comparisons after one-way ANOVA [14].
Finally, in this case study, it has been found the groups of errors that can be considered equal in behavior, with respect to the other errors under each weather variable.
Consequently, these groups of errors will be those that have higher significance values, and at less are over 0.05 during the ANOVA study.
C. Frequency of Errors In this study, the first developed step was to analyze the
frequency of each different error and to define its percentage in respect of the total number of errors, as shown in Table 1:
Table 1. Most frequent wind farm errors
Code Error Name %
1 Stop due to power control 33.0 3 Low voltage 15.9 8 Start problem 9.3 9 Emergency stop 5.2
12 Asymmetric currents 3.6 4 Brake shoe temperature 3.3 2 Freezing of anemometers 2.8
17 Excessive orienting time 2.0 16 Generator working position (LG or SG) 1.3 11 Error in current phase sequence 1.0
As can be seen in this table, the stoppages due to power
control and low voltage are the most frequent errors. Another interesting possible classification is in accordance
with the percentage of time lost due to errors (%), finding that high brake shoes temperatures results in a 13.65% of stoppage time, the asymmetrical currents in a 10.42% of stoppage time and that the central hydraulic low oil level is the third most important error, with a 10.11% of stoppage time.
IV. STATISTICAL ANALYSIS
A. ANOVA Analysis According to the previous sections, a statistical study of
ANOVA for a significance level of 0.05 was carried out with each of the main errors.
The results, once grouped, are shown in Table 2, where each column in grey shows the errors that appear under the same conditions of the weather variable in each column.
Table 2. ANOVA study between errors and weather variables
Error Code Outdoor Temp.
Wind Velocity
Wind Direction
Freezing of anemometers 2 X X X
Excessive orientation time 17 X X X
Brake shoe temperature 4 X X
Emergency stop 9 X X
Start problem 8 X X Low voltage 3 X X Asymmetric
currents 12 X X
Error in current phase sequence 11 X X
Significance level 3.930 0.144 0.074
Consequently, due to the significance level shown in the
last row of the table being higher than 0.05, these groups can be considered as one group.
Furthermore, as high as the significance level may be, the higher is the similarity between the errors, and the more possible it is to obtain a common model that predicts such errors. For example, freezing of anemometer and excessive orientation time experiences a similar behavior during the year in respect of the outdoor temperature conditions.
From these errors, it was possible to define which is the average value for each weather variable, when it is most likely to appear as an error, as can be seen in Table 3.
Table 3. Average weather conditions for each error
Error Code 2 17 4 9 12
Wind Velocity (km/h) 12.4 8.6 11.4 10.7 8.6
Wind Direction (º) 208.7 146.6 144.7 142.6 122.6
Outdoor Temp. (ºC) 8.2 4.9 14.4 18.8 11.6
Relative Humidity (%) 85.2 87.5 73.7 70.1 77.9
Recent Advances on Energy, Environment, Ecosystems, and Development
ISBN: 978-1-61804-291-0 33
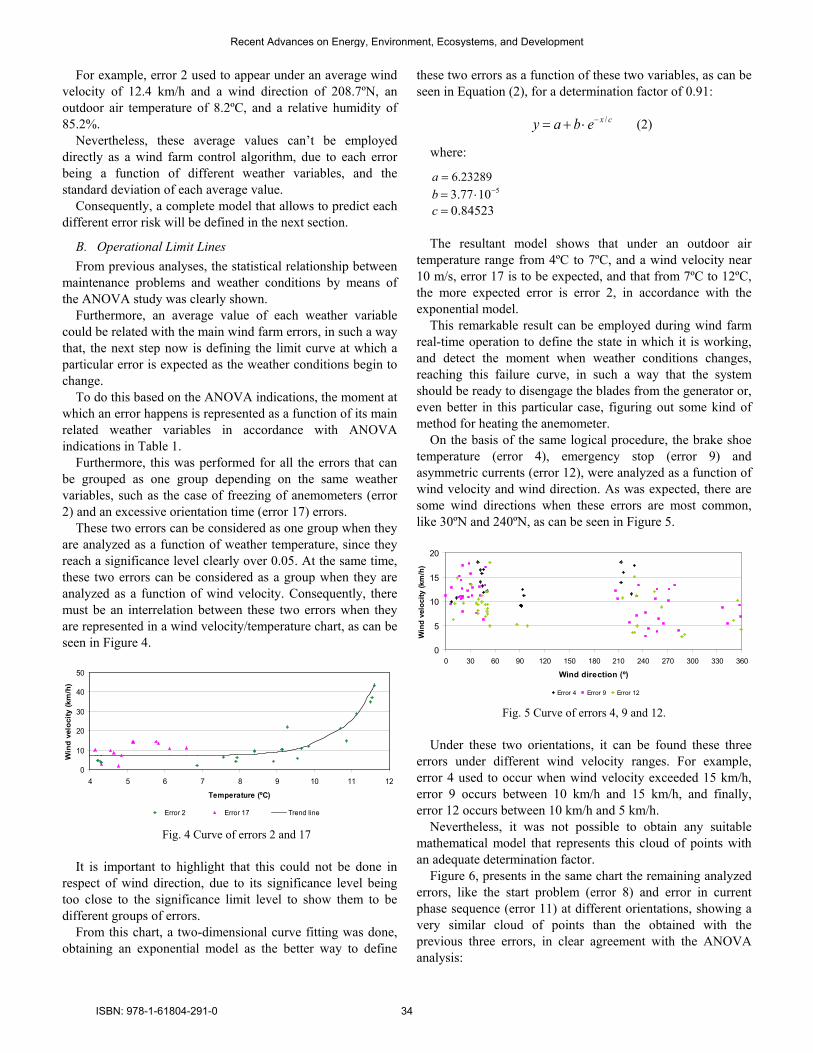
For example, error 2 used to appear under an average wind velocity of 12.4 km/h and a wind direction of 208.7ºN, an outdoor air temperature of 8.2ºC, and a relative humidity of 85.2%.
Nevertheless, these average values can’t be employed directly as a wind farm control algorithm, due to each error being a function of different weather variables, and the standard deviation of each average value.
Consequently, a complete model that allows to predict each different error risk will be defined in the next section.
B. Operational Limit Lines From previous analyses, the statistical relationship between
maintenance problems and weather conditions by means of the ANOVA study was clearly shown.
Furthermore, an average value of each weather variable could be related with the main wind farm errors, in such a way that, the next step now is defining the limit curve at which a particular error is expected as the weather conditions begin to change.
To do this based on the ANOVA indications, the moment at which an error happens is represented as a function of its main related weather variables in accordance with ANOVA indications in Table 1.
Furthermore, this was performed for all the errors that can be grouped as one group depending on the same weather variables, such as the case of freezing of anemometers (error 2) and an excessive orientation time (error 17) errors.
These two errors can be considered as one group when they are analyzed as a function of weather temperature, since they reach a significance level clearly over 0.05. At the same time, these two errors can be considered as a group when they are analyzed as a function of wind velocity. Consequently, there must be an interrelation between these two errors when they are represented in a wind velocity/temperature chart, as can be seen in Figure 4.
0
10
20
30
40
50
4 5 6 7 8 9 10 11 12
Temperature (ºC)
Win
d ve
loci
ty (k
m/h
)
Error 2 Error 17 Trend line Fig. 4 Curve of errors 2 and 17
It is important to highlight that this could not be done in
respect of wind direction, due to its significance level being too close to the significance limit level to show them to be different groups of errors.
From this chart, a two-dimensional curve fitting was done, obtaining an exponential model as the better way to define
these two errors as a function of these two variables, as can be seen in Equation (2), for a determination factor of 0.91:
cxebay /−⋅+= (2)
where:
6.23289=a 51077.3 −⋅=b
84523.0=c The resultant model shows that under an outdoor air
temperature range from 4ºC to 7ºC, and a wind velocity near 10 m/s, error 17 is to be expected, and that from 7ºC to 12ºC, the more expected error is error 2, in accordance with the exponential model.
This remarkable result can be employed during wind farm real-time operation to define the state in which it is working, and detect the moment when weather conditions changes, reaching this failure curve, in such a way that the system should be ready to disengage the blades from the generator or, even better in this particular case, figuring out some kind of method for heating the anemometer.
On the basis of the same logical procedure, the brake shoe temperature (error 4), emergency stop (error 9) and asymmetric currents (error 12), were analyzed as a function of wind velocity and wind direction. As was expected, there are some wind directions when these errors are most common, like 30ºN and 240ºN, as can be seen in Figure 5.
0
5
10
15
20
0 30 60 90 120 150 180 210 240 270 300 330 360
Wind direction (º)
Win
d ve
loci
ty (k
m/h
)
Error 4 Error 9 Error 12 Fig. 5 Curve of errors 4, 9 and 12.
Under these two orientations, it can be found these three
errors under different wind velocity ranges. For example, error 4 used to occur when wind velocity exceeded 15 km/h, error 9 occurs between 10 km/h and 15 km/h, and finally, error 12 occurs between 10 km/h and 5 km/h.
Nevertheless, it was not possible to obtain any suitable mathematical model that represents this cloud of points with an adequate determination factor.
Figure 6, presents in the same chart the remaining analyzed errors, like the start problem (error 8) and error in current phase sequence (error 11) at different orientations, showing a very similar cloud of points than the obtained with the previous three errors, in clear agreement with the ANOVA analysis:
Recent Advances on Energy, Environment, Ecosystems, and Development
ISBN: 978-1-61804-291-0 34

0
5
10
15
20
0 30 60 90 120 150 180 210 240 270 300 330 360
Wind direction (º)
Win
d ve
loci
ty (k
m/h
)
Error 4 Error 9 Error 12 Error 8 Error 11 Fig. 6 Curve of errors 4, 9, 12, 8 and 11.
Despite the fact that this errors appear under the same
orientations than the others, they can appear under a wide wind velocity range that goes from 0 km/h to 20 km/h, making its identification very difficult for wind farm operators.
V. CONCLUSIONS The present research shows an innovative way to analyze
wind farm operation and maintenance based on weather changes, in agreement with a complete Analysis of Variance study of the most representative failures in wind farm systems.
Furthermore, a new procedure to identify the more important wind farm errors before they occur, was developed and modelled, in such a way that, this procedure can be employed in real-time operation decisions, thus saving economic losses and working time.
As a final conclusion, this work corroborates the interest and relevance of statistical studies in wind farm operation, and demonstrates the importance of developing further research on statistical based decision techniques in wind farm operation and maintenance.
REFERENCES [1] I. Alsyouf, I. EI-Thalji, Maintenance practices in wind power systems: a
review and analysis. School of Technology and design Växjö University, Sweden, 2009.
[2] M. Entezami, S. Hillmansen, P. Weston, M. Ph. Papaelias, Fault detection and diagnosis within a wind turbine mechanical braking system using condition monitoring. Renewable Energy, 2012, 47, pp. 175-182.
[3] Z. Hameed, Y. S. Hong, Y. M. Cho, S. H. Ahn, C. K. Song, Condition monitoring and fault detection of wind turbines and related algorithms: a review. Renewable Sustainable Energy Review, 2009, 13, pp. 1-39.
[4] A. Kusiak, H. Zheng, Z. Song, Models for monitoring wind farm power. Renewable Energy, 2009, 34, pp. 583-590.
[5] Siam. Environmental Information System of Galicia. http://www.meteogalicia.es. Accessed on 16 February 2015.
[6] P. Caselitz, J. Giebhardt, M. Mevenkamp, On-line fault detection and prediction in wind energy converters. Proceedings of EWEC’94 Thessaloniki, 1994, pp. 623-627.
[7] Z. Sen, Statistical investigation of wind energy reliability and its application. Renewable. Energy, 1997, 10 (1), pp. 71-79.
[8] J. A. Orosa, E. J. García-Bustelo, J. A. Pérez, Galician climatic change effect on wind power production. Proceedings of the 2nd International Conference on Power Engineering, Energy and Electrical Drives, POWERENG 2009, Lisbon, 2009, pp. 180-184.
[9] J. Apt, The spectrum of power from wind turbines. Journal of power sources, 2007, 169, pp. 369-374.
[10] M. Concetti, R. Cuccioletta, L. Fedele, G. Mercuri, Tele-maintenance “intelligent” system for technical plants result management. Reliability Engineering & System Safety, 2009, 94, pp. 63-77.
[11] J. A. Orosa, E. J. García-Bustelo, J. A. Pérez, Wind turbine concentrator design based on moist air phase change. Proceedings of the 2nd International Conference on Power Engineering, Energy and Electrical Drives, POWERENG 2009, Lisbon, 2009, pp. 490-494.
[12] M. C. García, M. A. Sanz-Bobi, J. del Pico, SIMAP: Intelligent System for Predictive Maintenance Application to the health condition monitoring of a wind turbine gearbox. Computers in Industry, 2006, 57, pp. 552-568.
[13] J. A. Orosa, A. C. Oliveira, A. M. Costa, New procedure for wind farm maintenance. Industrial Management & Data Systems, 2010, 110 (6), pp. 861-882.
[14] J. P. Davim, Statistical and computational techniques in manufacturing, Springer, Heidelberg, 2012, pp.1-240.
[15] E. Byon, Y. Ding, Season-dependent condition-based maintenance for a wind turbine using a partially observed Markov decision process. IEEE Transactions on Power Systems, 2010, 25 (4), pp. 1823-1834.
Recent Advances on Energy, Environment, Ecosystems, and Development
ISBN: 978-1-61804-291-0 35

Ecological impact of fires on environment Sergey A. Kolodyazhny
Abstract—Factors impacting on the value of ecological
influence of fires are defined. It is established that the rate of service of burning objects, cities and settlements provided by fire divisions is of great value, and it depends on the quantity of fire teams and fire trucks, as well as on the time of arrival at an object according to a distance to be covered by a team.
Keywords—Arrival time, fire divisions, fire safety.
I. INTRODUCTION
IRES negatively affect the national economy and security of any country, since it is known that the total losses
from fires could be more than 3 % of the budget. The study of tolerance probability of impact of fire hazards, including environmental, is essential to the theory and practice of protecting people from a future accidents. Usually when considering fires, a great deal of attention is paid to study the risks of loss of life and property, and less to the solution of environmental problems.
Therefore, the problem of the impact of fires on the environment is on the stage of definition.
Analysis of the known mathematical models [1] of determination of the tolerance probability of impact of fire hazards on humans has shown that as a rule the environmental factors are not involved. In the known target functions, the components of ecological damage from fires are not available. Therefore, the analysis and simulation of the impact of fires on the environment is an actual problem, and its solution will allow the creation of predictive estimates of environmental pollution of the biosphere from the effects of fires and, thus, assessing the whole damage.
II. PROBLEM FORMULATION AND MODELING In general, the damage from one mean-square fire could
be in the form of 1 1 1M ECY Y Y= + , (1)
where
1MY and 1ECY are the damage to property from one mean-square fire and from the impact on the environment, respectively.
Using the correction coefficients, the damage from the environmental impact is calculated by the following formula:
1
1
m
EC j CO COj
Y K C V T=
= ⋅ ⋅ ⋅∑ , (2)
where V is the amount of combustion products escaped at mean-square fire, m3, COC is the concentration of carbon
S. A. Kolodyazhny is with Voronezh State University of Architecture
and Civil Engineering, Department of Fire and Industrial Safety, Voronezh 394006, Russian Federation (phone/fax: +7-4732-715905; e-mail: [email protected]).
monoxide determined by an analytical dependence on the basis of mathematical modeling; COT is the damage from one ton of emissions of carbon monoxide, and the factor
jK , in its turn, is defined by the components j i j i i iK α α δ λ β= ⋅ ⋅ ⋅ ⋅ , (3)
where iα is the rate of the relative danger of the pollutant in
the air, 1 5jα = ÷ is an amendment that takes into account
the likelihood of the accumulation of harmful substances or secondary pollutants in the atmosphere and the inflow in the human body, 1 1.2iδ = ÷ is the coefficient considering the impact of harmful substances on different recipients except for humans, 1 1.2iλ = ÷ is the probability of a secondary drop of impurity in the atmosphere after the subsidence of the surface, and 1 5iβ = ÷ is the probability of formation the secondary pollutants with the participation of harmful substances released into the atmosphere.
To determine the fire impact on the environment, a mathematical model has been developed which is based on the mechanism of convection-diffusion dispersion of pollutants described by a set of partial differential equations in energy and diffusion
2
2
10
t tAC
x a τ∂ ∂
− ⋅ + =∂ ∂
, (4)
2
2
10
C C kC
x D Dτ∂ ∂
− ⋅ − ⋅ =∂ ∂
, (5)
where t is the temperature of the surface of solid combustible material, C is the concentration of diffusing combustible substances, τ is the time, a and D are the coefficients of the diffusion, and k and A are constants.
It is assumed that the rate of the reaction at this stage is independent on the temperature conductivity. Equations (4) and (5) are subjected to the following initial and boundary conditions:
0, 0 at 0t C
xx x∂ ∂
= = =∂ ∂
,
(6) 0 , 0 at 1C C t x= = = .
The solution of (4)-(6) is obtained via the Laplace transform technique and has the form
20 0
ch( /( / ) 1 (16 / )
ch( / )x k D
t AC D AC Dll k D
λ π= − +
( )
2 2
22 2 20
( 1) cos(2 1) / 2 (2 1)exp4(2 1) 2 1 ( ) 4
n
n
n x l a nln n a D kl
π π τ
π
∞
=
− + +× − + + − − ∑
F
Recent Advances on Energy, Environment, Ecosystems, and Development
ISBN: 978-1-61804-291-0 36

20 2 2 2 2 2 2
1
( 1) (2 1)cos(2 1) / 216(2 1) 4 (2 1) ( ) 4
n
n
n n x lAC al DD n kl n a D kl
πππ π
∞
=
− + +−
+ + + − − ∑
2 2
2
(2 1)exp4
D nkl
π ττ +
× − −
. (7)
The concentration of combustible substances is determined by the Arrhenius equation, while the empirical constants k and A involved in (4)-(7) are defined empirically for a particular solid combustible substance.
Substituting (7) in the temperature of self-ignition selft t= ,
a time of warming up of the solid surface during the fire could be obtained numerically, including the phase of yield of volatile matter, i.e. the time of generation of pollutants at the stage of burning (Fig. 1).
Fig. 1 The fire time dependence of the temperature of combustion: 1 — polystyrene, 2 — plexiglas, 3 — wood; 4— average fire
At the first stage of fires, a temperature in the hotbed of
fire increases during first10-15 min, in the next 20 minutes the temperature decreases. The total time of an average fire (and it coincides with the data of literature sources) is about 90 minutes before its complete extinction. The average fire temperature, for which massive emissions of pollutants should be calculated, for different burning materials is equal to: for wood 900-1300 ºC, plexiglas 1100 ºC, textolite 700 ºC, oil and oil products 1200 ºC, and for peat 790 ºC. The average fire load is 25-50 kg/m2. The emission of pollutants depends on the yield of volatile components, which, in its turn, influence the velocity of flame propagation in space.
Reference to Fig. 2 shows that the maximum velocity of the flame is around 5 cm/s with heat removal 4.65Q∆ =kW/m2 from a combustion zone due to adding the water during fire extinguishing. Without fire extinguishing the burning rate reaches about 40 cm/s, and with this movement velocity (Fig. 2) the flame will remove to a distance of more than 2.16 km for 90 min. Such velocities of the flame were observed during burning of peats.
Fig. 2 The dependence of normal velocity of flame spread
and the concentration limits of combustion on the amount of heat: 1 - without the withdrawal of heat, 2 – with heat removal ΔQ=2.33 kWF/m3; 3 - ΔQ=4.65 kW/m2.
The flame-propagation rate actually characterizes the
displacement velocity of a point source of environment pollution, which is considered to be the initial hotbed of the fire.
The development of this model allows one to identify the changes in temperature in the layers of preparation of material to the combustion and directly within the combustion zone depending on the time of the fire. Further research results in the development of the mathematical models involving the diffusion dispersion of fire pollutants in the environment at the wind and windless weather.
The process of migration of one pollutant in the air occurs at the expense of a diffusion mechanism and convection flows. Convection flows over an area of combustion are the main mechanism of migration of combustion products including contaminant. Convection mechanism is also responsible for the influx of fresh air supporting the combustion.
The following diffusion equation is considered as a mathematical model:
2
2
1 0С U C Cx D x D t
∂ ∂ ∂− − =
∂ ∂ ∂, (8)
where C is the current concentration of a certain pollutant, t is the time of fire propagation, counted from the initiation of the combustion to its complete liquidation, D is the diffusion coefficient of the pollutant under consideration, and HU is the flame-propagation rate.
Coordinate x is measured from the origin of the fire source in the direction of its propagation. The mathematical model (8) is subjected to the following initial and boundary conditions:
01, ;
0,
t C CCx D
β= =
∂
− = ∂
, (9)
Recent Advances on Energy, Environment, Ecosystems, and Development
ISBN: 978-1-61804-291-0 37

where β is the coefficient of mass transfer, m/s. Equation (8) and boundary conditions (9) take the flame-
propagation rate and the processes of mass transfer on the interphase of the flame and the environment. Solution of (8) with the initial and boundary conditions (9) has the form
0
0
1 (2 )1 erfc exp erfc
2 2( )2
(2 ) (2 )exp ( ) erfc ,
2( ) 2
H H H
H H
HH
H
C x U t U x UC U D UDt
C U x D tx t U
U D D Dt
β ββ β
β β β ββ
β
− −= − +
− −
− + −+ − −
−
(10)
where ( ) ( )erfc ( ) 1 erf ( ) ,f x f x= − and ( )erf ( )f x is the
integral of errors (tabulated function). The diffusion coefficient in gas media depends on the temperature of combustion reaction and pressure:
00
0
nP TD DP T
=
, (11)
where D0 is the diffusion coefficient at normal atmospheric conditions, 0 101.3P = kPa, T0-273K, and 1 2.0n = ÷ m/s.
Heat transfer coefficients are calculated on the basis of the known criterion equations of heat and mass transfer. A mathematical model is considered to be a real one under the condition of the identity of concentration and temperature fields. The density of mass flow of a certain pollutant J, kg/m2s, that is mass flux of pollutants related to one square meter of the fire surface, is determined by the equation of mass transfer:
0( )J C Cβ= − , (12) (12)
where concentration C is calculated according (10). The adequacy of the proposed mathematical model to real
conditions has been proved experimentally. Observations of fires took place when the flame spread on the strip of rectangular shape what corresponds to the boundary conditions of mathematical model.
The study of the fields of carbon monoxide concentrations in the air around the fire site showed that its time-dependence at a fixed distance from the line of fire is a wave-like (Fig. 3). The amplitude of variations in the concentrations on the windward side is much lower than on the leeward side.
Fig. 3 The time-dependence of the carbon monoxide concentration at the distance of 40 m from the line of fire
Analysis of concentrations of nitrogen dioxide NO2 (Fig. 4) showed that the concentrations measured on a distance of 40 m as of (2.2÷2.5) lim
NOxC .At the distance of 100 m (X/L>0.6) from the fire point at the windward side, the concentration of NOx reduces up to 1.5 portion of the limiting value.
The adequacy of relationship (10) was verified experimentally. Figure 5 shows the dimensionless distance X/L dependence (wind direction along the axis OX, L = 200 m) of the dimensionless concentration of carbon monoxide C =С/MPC (in parts of MPC) at the fixed criterion of Fourier diffusion 2/ODF D Lτ= , the maximal
concentration in the midst of the fire 0 7.2,C = volumetric parts per million, the diffusion coefficient 42 10D −= ⋅ ,
m2/s, wind speed 2HU = , m/s, and its direction at different distances from the fire hotbed.
Fig. 4 Changes in the concentration of nitrogen oxides in the direction of the wind depending on the distance from the
burning object (real and averaged)
Fig. 5 Changes in the concentration of carbon monoxide
from a distance X/L at ODF = 0.0154 (τ = 3600 s) The experimental data are processed in coordinate
dependencies (10). Data on the concentration of nitrogen dioxide as function of the distance from the axis of the site, where fire spilled, from both windward and leeward sides are also given neglecting fluctuations at the wind speed equal to 1.2 m / s.
Concentrations were obtained considering background concentrations. It can be seen that the experimental data are
Recent Advances on Energy, Environment, Ecosystems, and Development
ISBN: 978-1-61804-291-0 38

in satisfactory accordance with the theoretical values, what proves the correctness of the basic concepts at mathematical modeling.
Analysis of water samples taken from puddles on the fire sites showed that during fire extinguishing at water temperature of 18 ºC only 33 % of nitrogen oxides, 22.4 % carbon monoxide and 45 % of sulfur oxides (by mass) formed at fire break down in water. Through the water directly on fire site about 30 % of polluting substances go in the hydrosphere, and the rest 70 % of pollutants via dispersing also get in the hydrosphere but with a lower concentration due to dissipation.
Investigation of a real object in extreme conditions requires a laborious experiment, which may not be enough accurate, its repetition for certain reasons is not always desirable, and the evaluation of the accuracy of the results is difficult. During experiment planning and further data processing, the application of dispersion analysis is one of the methods that allow one with sufficient accuracy to describe the process with minimally necessary number of experiments.
The advantage of factorial experiment is in its greater effectiveness, and also in the fact that all the data obtained are used in calculation of the impact of each factor, and there is the opportunity to gather information about possible interactions of factors.
In the study of fields of concentration of gases and temperature in premises subjected to fire, a two-factor experiment will be utilized, when one of the factors has a quantitative level (depth, height Di), while another has a qualitative level (position of measurement point Pi in the horizontal plane).
In the first phase it is appropriate to carry out a preliminary study directly at the target, and then the simulation on the physical model. The second phase of research will provide an opportunity to solve the problem of optimal synthesis of physical fields.
To study the physical fields in fires, each parameter is measured at five different points (1, 2, 3, 4, 5) at three levels (h1, h2, h3) (Fig. 6), in so doing 2 measurements are made in each position. Thus, the factorial experiment of the 5x3 type with two repetitions of observations at each point (cell) takes place. The plan is fully randomized, and its model is the following:
Xijk = µ + Di + Pj + (DP)ij + εk(ij), (13)
where j = 1, 2, 3, 4, 5, i = 1, 2, 3 and k = 1, 2, μ is the mean totality from which the sample is obtained (the total effect in all observations), Xijk is the measured value, Di is the depth (height) of measurement points, Pj is the position of the measuring points, εk(ij) is the random measurement error in the experiment, and (DP)ij is the interaction of main factors Di and Pj.
On the base of the coded data, the total sum of squares Stotal is determined, as well as the sum of squares for each factor, as well as their interactions and errors: SD, SP, SPxD, and Ser. The results of dispersion analysis are summarized in a table.
Then the dispersion relation with an appropriate degree of freedom, the depth (height) and errors is determined εk(ij)
( )1 2,
if f
k ij
DFε
= , (14)
and compared with the critical value Fcr at significance level q, %.
Fig. 6 Location of points of measurement in the gaging plane
Similarly dispersion relations for the effect of interaction between the depth (height) and position are determined.
To study the influence of depth (height) on the concentration of the parameters the linear and quadratic effect of measurement is chosen, and the coefficients of orthogonal polynomial are used for this purpose. After defining the linear and quadratic effect of the depth (height) and calculating the sum of squares, the interaction between the linear and quadratic effects with positions in five points is checked.
Then based on the results of the full dispersion analysis and graphs constructed for each physical parameter, the interpretation of the results is given by the average values for the cells at different depths (altitudes) and positions.
Consider a procedure for studying the field of pollution by substances in the fire-prone premises, by the simulation results on the physical model shown in Table 1.
Table 1
Number of a point
Height, m 0 1.50 3.00
1 3.05 4.75 2.71 2.71 3.72 2.71
2 2.88 4.05 2.71 3.39 2.71 3.05
3 3.05 3.72 2.88 2.88 2.71 2.54
4 3.72 3.05 2.71 3.39 3.05 2.71
5 3.05 3.39 2.54 3.39 3.72 2.71
According to the data given in Table 1, the results of
dispersion analysis for the problem of the distribution of contaminants are given in Table 2, from which it is evident that height has a significant impact on the content of pollutants, since the dispersion relation is
Recent Advances on Energy, Environment, Ecosystems, and Development
ISBN: 978-1-61804-291-0 39

2;151.45 9.070.16
F = = ,
what is in accordance with the 1 %-level, while at the same time position of the cells has no effect on the level of pollution.
Table 2
Source of
changeability
Number of
degrees of
freedom
Sum of
squares
Mean square
Expectation value
of mean Squares
Depth Di 2 2.91 1.45 2 210e Dσ σ+
Position Pi 4 0.29 0.072 2 26e Pσ σ+ Interaction
(DP)ij 8 2.37 0.26 2 22e DPσ σ+
Error εk (ij) 15 2.11 0.16 2eσ
Sum 29 7.68 The results of the full dispersion analysis (Table 3) also
indicate that there is a strong effect of the altitude variation, at which the quadratic effect is significant with the 1 %-level of significance.
The effect of the interaction of the position and height is minimal, since the corresponding graphs (Fig. 7) in a statistical sense are parallel, and the difference between the lines constructed for five positions is low.
Since the effect of the interaction of position and height is negligible, the measurements of pollution can be produced only in one position.
The presented mathematical model of the diffusion scattering of pollutants, involving the solutions of systems of equations of energy and diffusion and the analytical dependencies obtained on their basis, allows one to calculate the environmental parameters of fires considering the temperature, velocity and time of the fire-front movement, the maximum mass emissions and fields of concentrations of pollutant at their diffusion scattering, and as a
Table 3
Source of changeability
Number of degrees
of freedom
Sum of squares
Mean square
Depth Di 2 2.91 Linear
dependence 1 0.905 0.905
Quadratic dependence 1 2.05 2.05
Position Pi 4 0.29 0.072 Interaction
(DP)ij 8 2.07
DлР 4 0.327 0.082 DквР 4 1.68 0.42
Error εk (ij) 15 2.41 0.16 Sum 29 7.68
consequence, to carry out the predictive assessment of environmental impact of fires on the environment.
Fig. 7 Graphs based on the averages for the cells and at different altitudes
III. THE INFLUENCE OF FIRE DEPARTMENTS
Among the factors affecting the value of the environmental impact of fires, the level of service of fires by fire departments is of great importance. The level of service of burning facilities, cities and settlements by fire departments depends on the number of fire crews, fire-fighting vehicles, as well as on a distance, which a crew must pass, and hence on the time of arrival at the facility.
To determine the optimal number of the crews at a fire station it is convenient, based on queuing theory, to introduce a target function, which includes damage from environmental pollution, the costs for placement of the fire station, and the number of fire crews.
Designate by П (n) the sum of costs Zi the maintenance of n fire departments, the cost of run-outs of the additional fire departments from neighboring fire stations S(n)C and additional damage ΔY(n) due to delay of the arrival of additional fire departments from the neighboring stations for fire fighting and environment deteriorating, we get the target function:
П (n)=n· Zi + S (n) ·C + ΔY (n). (15) The problem of optimization is formulated as follows: to
determine such a number of fire departments n at the given station, for which the target function (15) takes on the minimum value. Additional damage ΔY(n) of the fire because of the delay of arrival at the place of fire by additional fire departments from other fire stations is calculated by the formula
( ) ( ) ( )1
add
aver
r n mY n Y
ττ⋅
∆ = , (16)
where τaver is the average time of typical fire extinguishing, and Y1 is the damage from one typical fire.
REFERENCE [1] G.I. Marchuk, Mathematical modeling in environment problem (in Russian). Moscow: Nauka, 1992.
Recent Advances on Energy, Environment, Ecosystems, and Development
ISBN: 978-1-61804-291-0 40

Distributed experiment for the calculus of optimal values for energy consumption in buildings
Pau Fonseca i Casas, Antoni Fonseca i Casas, Nuria Garrido-Soriano, Joana Aina Ortiz, Josep Casanovas, Jaume Salom
Abstract—In this paper we address the problem of define and execute an environmental model, that describes the behavior of a building from the point of view of sustainability, in a distributed scenario. The inherent complexity of the experiment and the demanding amount of resources needed to perform the calculus, justify the need of distribute the execution of the experiment. This distribution is done through the use of a formal language that not only defines the model behavior, but also the experiment distribution. This methodology can be applied to other modelling environmental problems that usually requires a huge amount of resources to obtain the results, reducing the amount of time needed to perform the Modelling, Implementation, Verification and Experimentation.
Keywords—SDL, building, simulation, optimization, NZEB.
I. INTRODUCTION NVIRONEMNTAL simulation is a demanding area for several aspects. First because the models depends on several
variables and factors, in a number that usually is higher than in other disciplines. Secondly because the teams that are involved in the definition and in the implementation of the models, belongs to several different areas, implying that is needed to stablish a common language to start working. Third because, and due the huge amount of parameters and factors that exist in the models, the experimentation tends to become time and resource consuming.
In this paper we try to address the second and the third problem, presenting a methodology that simplifies the communication between the different actors that are involved in the project and allowing to define a distributed execution scenario of such models. This distributed scenario execution
allows to reduce the time needed to obtain the results and possibilities the exploration of more alternatives as we will discuss later.
II. THE SYSTEM The "Energy Performance of Buildings Directive (EPBD)"
approved by the 2010/31 / EU European directive, aims to speed up energy saving policies in the building sector in order to achieve a 20% reduction of energy consumption in the European Union . Among many other measures, the Article 9 of the directive stipulates that from December 31, 2020 the new buildings must be nearly zero in energy consumption, and on December 31, 2018 for occupied buildings and/or public property buildings. In relation to this measure, the board recommends to the Member States establish intermediate objectives in 2015 and gradually adopt the goals until 2020 to ensure the compliance the objectives set.
In relation to the rehabilitation of buildings, where the present study is focused, a series of measures must be taken to ensure that a minimum requirements are compiled when renewing at least 25% of the building or its surroundings. The same policy explains that to adjust and set the minimum requirements for energy efficiency, all methods must be based on a cost benefit analysis, in order to achieve optimal levels of profitability methods.
The MARIE project, that is framed in the Catalan context and led by the Department of Territory and Sustainability of Catalonia, has the overall aim to define a strategy for improving energy rehabilitation of the Mediterranean buildings. In this context, the study aims to provide the necessary management to
E
This work was supported in part by the UE. 2020 program under Grant MARIE (Mediterranean Building Rethinking for Energy Efficienty Improvement) http://www.marie-medstrategic.eu/en.html.
Pau Fonseca i Casas, Universitat Politècnica de Catalunya-BarcelonaTech, Barcelona, CA 80034 ESP (corresponding author, phone: (+34) 93 401 7732; fax: (+34) 93 401 5855; e-mail: [email protected]).
Antoni Fonseca i Casas, Universitat Politècnica de Catalunya-BarcelonaTech, Barcelona, CA 08034 SP (e-mail: [email protected]).
Nuria Garrido-Soriano, Universitat Politècnica de Catalunya-BarcelonaTech, Barcelona, CA 08034 SP (e-mail: [email protected]).
Joana Aina Ortiz, Institut de Recerca en Energia de Catalunya (IREC), CA, 08930 (e-mail: [email protected]).
Josep Casanovas, Universitat Politècnica de Catalunya-BarcelonaTech, Barcelona, CA 80034 ESP (e-mail: [email protected]).
Jaume Salom, Institut de Recerca en Energia de Catalunya (IREC), CA, 08930 (e-mail: [email protected]).
Recent Advances on Energy, Environment, Ecosystems, and Development
ISBN: 978-1-61804-291-0 41

be able to set the minimum criteria for energy rehabilitation, ensuring optimal levels from an energy and economic point of view, and propose solutions adapted to the particular building characteristics of Catalonia (climate and construction).
Thereby, the overall objective of the project is to conduct a technical study in order to find optimal values regarding energy consumption. With the knowledge obtained from the simulations is it possible to propose modifications on the buildings to gradually achieve near-zero energy buildings (NZEB). The optimization criteria on this project follows a multi-objective schema.
The study is focused on 4 representative typologies and 4 climates from Catalonia (see Fig. 1). A dynamic simulation of every building typology was carried out in TRNSYS 17 [1]. One of the main challenging problems of this kind of simulations is the huge amount of factors we must consider. The building models (BIM) includes a detailed characterization of the building, their systems and the behavior of the occupants. The results obtained for each simulation are: (i) energy consumption, (ii) comfort evaluation and (iii) global costs calculation.
Fig. 1 One of the typologies to be simulated on the MARIE project.
The multicriteria optimization was done with SDLPS (http://sdlps.upc.edu), simulation software infrastructure that makes possible to find optimal values for several model parameters. In the core of the distributed and discrete simulator SDLPS, a model rules the main simulation process in a Co-simulation scenario [2] optimizing the building parameters and their associated impacts; TRNSYS is used as a calculus engine for energy simulation in this Co-simulation scenario.
Around 10,000 simulations been done for each typology and climate, needing about 15 minutes to complete each simulation, making this a demanding simulation scenario.
III. MODEL FORMALIZATION The need to share at least the model structure and behavior in a transdisciplinary environment justify the need to use a formal language to define the model.
In our approach we propose the use of a widely used formal
language to represent the models, to structure the co-simulation mechanism, and to define the experimental design to be conducted.
A. Specification and Description Language Several languages exist to formalize a simulation model [3].
In our approach we use Specification and Description Language (SDL) [4], a formal, graphical, unambiguous and complete formalist that is widely used to represent simulation models.
The structure of the language allows to easily obtain the code needed to perform the simulations [5], aspect that simplifies the Verification of the models [6].
The language have a modular structure that simplifies the definition of the different model components.
Specifically, SDL is an object-oriented formal language defined by the International Telecommunications Union–Telecommunications Standardization Sector (ITU–T) (the Comité Consultatif International Telegraphique et Telephonique [CCITT]) on the Z. 100 recommendation [7]. The language was designed for the specification of event-oriented, real-time and interactive complex systems. These systems might involve different concurrent activities that use signals to perform communication. In our cur-rent scope SDL SIGNALS represents the events of the simulation model, hence in the paper SDL SIGNAL or event can be considered equivalent, since the SIGNAL is the representation of the event in the language. SDL is based on the definition of four levels to describe the structure and the behavior of the models: system, blocks, processes and procedures. In SDL BLOCKS and PROCESSES are named AGENTS. The outermost block, the system BLOCK, is an agent itself. Figure 1 shows this hierarchy of levels.
Fig. 2 A structural vision of an SDL model with its 4 main levels.
The different concepts that the SDL language covers are:
1. System structure: from the blocks to the processes and their related hierarchy.
2. Communication: signals, communication paths or channels, parameters that can be carried out by the signals, etc.
3. Behavior: defined by different processes. 4. Data: based in Abstract Data Types (ADT). 5. Inheritance: useful to describe relations between
objects and their properties. Although a textual SDL representation is possible
(SDL/PR), this paper uses the graphical representation of the language (named SDL/GR).
Thanks to the use of this approach the schema that depicts a
Recent Advances on Energy, Environment, Ecosystems, and Development
ISBN: 978-1-61804-291-0 42
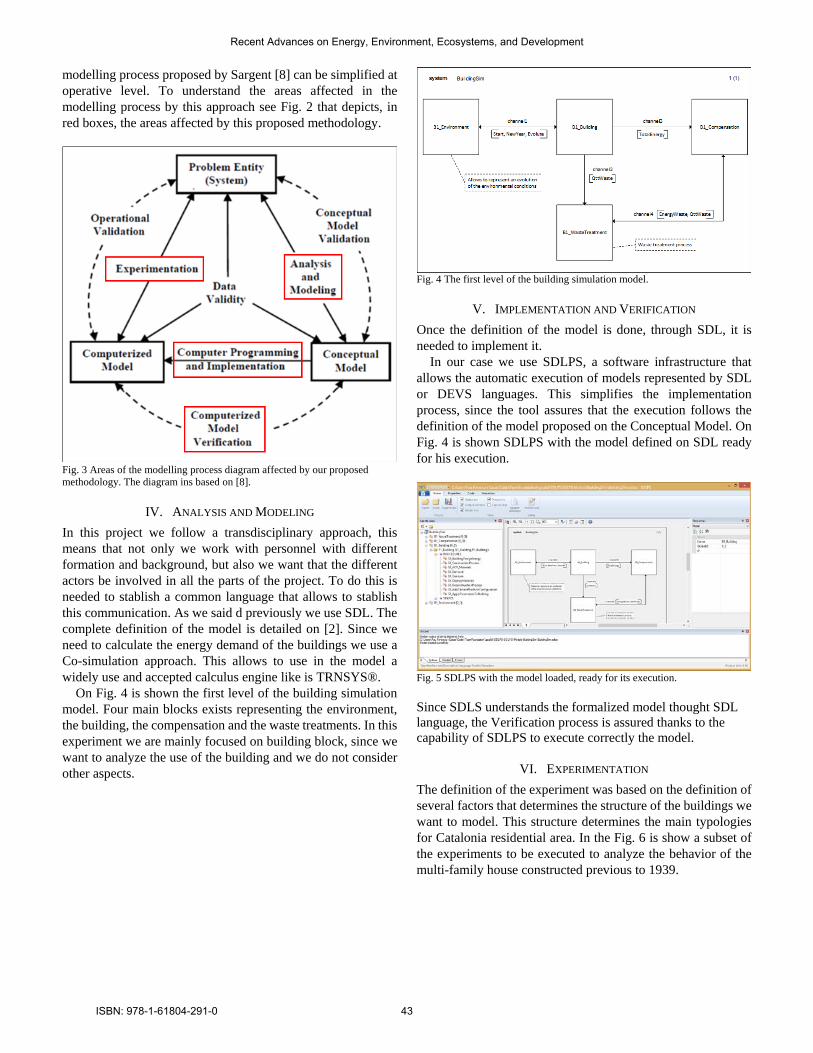
modelling process proposed by Sargent [8] can be simplified at operative level. To understand the areas affected in the modelling process by this approach see Fig. 2 that depicts, in red boxes, the areas affected by this proposed methodology.
Fig. 3 Areas of the modelling process diagram affected by our proposed methodology. The diagram ins based on [8].
IV. ANALYSIS AND MODELING In this project we follow a transdisciplinary approach, this means that not only we work with personnel with different formation and background, but also we want that the different actors be involved in all the parts of the project. To do this is needed to stablish a common language that allows to stablish this communication. As we said d previously we use SDL. The complete definition of the model is detailed on [2]. Since we need to calculate the energy demand of the buildings we use a Co-simulation approach. This allows to use in the model a widely use and accepted calculus engine like is TRNSYS®.
On Fig. 4 is shown the first level of the building simulation model. Four main blocks exists representing the environment, the building, the compensation and the waste treatments. In this experiment we are mainly focused on building block, since we want to analyze the use of the building and we do not consider other aspects.
Fig. 4 The first level of the building simulation model.
V. IMPLEMENTATION AND VERIFICATION Once the definition of the model is done, through SDL, it is needed to implement it.
In our case we use SDLPS, a software infrastructure that allows the automatic execution of models represented by SDL or DEVS languages. This simplifies the implementation process, since the tool assures that the execution follows the definition of the model proposed on the Conceptual Model. On Fig. 4 is shown SDLPS with the model defined on SDL ready for his execution.
Fig. 5 SDLPS with the model loaded, ready for its execution. Since SDLS understands the formalized model thought SDL language, the Verification process is assured thanks to the capability of SDLPS to execute correctly the model.
VI. EXPERIMENTATION The definition of the experiment was based on the definition of several factors that determines the structure of the buildings we want to model. This structure determines the main typologies for Catalonia residential area. In the Fig. 6 is show a subset of the experiments to be executed to analyze the behavior of the multi-family house constructed previous to 1939.
Recent Advances on Energy, Environment, Ecosystems, and Development
ISBN: 978-1-61804-291-0 43

Fig. 6 Experiment definition for the multi-familiar houses constructed prior to 1939.
On the overall project it is needed to conduct more than 60.000 simulations, implying moths of calculus using a single computer. The method used to conduct the simulations is described on [9]. The first time that we confront a simulation model where the required a time to perform the calculations was too large with respect to the time we had to be able to offer the answer to the client, was in the project of the Barcelona Airport [10]. In this project we use a set of machines to run different replications of the same model with the aim of reduce the time needed to obtain the answers.
In this case, the problem is not the number of replications of model that are needed to be performed, but the large number of different scenarios that we want to evaluate. This is due to the huge amount of variables that we can consider in a building. Specifically, in a first approach for one of the typologies we wanted to evaluate, the time was about 20 days. This time was excessive due to the temporal constrains of the project.
In order to accelerate this process we define a method to automatically generate the different experiments to be executed as we discuss in the next section.
A. Distributing the experimentation In order to solve the problem, we divide the experimental design in independent pieces that may run on different machines, and then we join again all the answers on a single computer following a server farm approach.
We use one of the teaching rooms, installing on each computer the simulation systems that we must use, SDLPS, with the model of energy efficiency for buildings, which acts as a co-manager simulation yelling at other simulation systems, TRNSYS ®, as a calculus engine and, finally, it was necessary to install a manager to stablish a synchronization between all the computers. We chose BitTorrentSync®, a peer-to-peer synchronization system that would allow us to centralize the results and the definition of the scenarios on a single central server. It takes more time to prepare the experiments that run the 6000 different simulations. Given that in the classroom had 25 computers, in this particular scenario we are presenting here, each one of these computers would run 240 simulations. The
time it took each PC to complete their task was less than 8 hours, but to prepare the configurations of each PC and install the programs we take more than 10 hours.
In Fig. 4 you can see the computer room with the PC's configured and with the results obtained in the screens.
Fig. 7 Computer lab used to execute the simulations. Note that all the computers compose a farm that shares the model and executes a part of the experiment, uploading the results to a central server.
To prepare the distribution of the experimentation along all
the computers, we implement a feature on SDLSP to detect the IP’s of the local network and automatically assign an IP to each one of the parts in which we divide the complete experiment. We can also select IP’s over Internet. In the Fig. 8 is shown the assignation of the IP’s (intranet) for the 25 computers we have in the room to be used for the experimentation.
Fig. 8 Assigning the IP's of the local network to distribute the experimentation over the farm.
Once we detect the computers are going to be involved in the farm execution the parametrization file that describes what is going to be executed in each computer is prepared. Each computer (through SDLPS) detects his own IP and, according to that executes the part of the job that has assigned. SDLPS assures that the distributed experimental definition, following a factorial design is correctly divided, and that the results can be obtained again correctly.
VII. CONCLUDING REMARKS When we talk about distribute simulation the first approach that we think is to try to segment the simulation model in several pieces that can share information is an optimistic or in a
n Clima NVENT FAC COB WIN TOL
19 E1 YES 10 13 10 10691 E1 YES 26 13 10 10187 E1 YES 14 13 10 10247 E1 YES 15 16 10 10677 E1 YES 26 10 12 1047 E1 YES 11 10 12 10
107 E1 YES 12 13 12 1019 C2 YES 10 13 10 10
691 C2 YES 26 13 10 10187 C2 YES 14 13 10 10247 C2 YES 15 16 10 10677 C2 YES 26 10 12 1047 C2 YES 11 10 12 10
107 C2 YES 12 13 12 10
Recent Advances on Energy, Environment, Ecosystems, and Development
ISBN: 978-1-61804-291-0 44

conservative approach [11], [12]. However a simple approach exist; the distribution of the experimentation through several computers allows to dramatically reduce the time needed to perform the simulation. In order to do so it is needed to assure that each one of the experiments are independent, and to stablish a method to simplify the results recollection.
The proposed methodology reduces the time needed to perform the verification of the model and the Analysis and Modelling. This give more time to our team to complete the experimentation, allowing to execute the overall scenarios in some cases without the need to use any optimization algorithm, using just force brute. This was very convenient for us, since we can use the complete dataset obtained to conduct a further research.
The proposed methodology works well in a transdisciplinary scenario, allowing to accelerate the process to understand the different details of the model definition, the implementation and the model execution by all the team members.
Regarding the specific results of the project, the information obtained was very useful to define the priority actions and the most effective solutions for the energy renovation of existing buildings, guaranteeing comfortable conditions for the users and energy and economic savings
ACKNOWLEDGMENT Many thanks to the InLab FIB of Universitat Politècnica de
Catalunya – BarcelonaTech for his generous helping in this project, providing us with the machines and with the help needed to configure them.
REFERENCES [1] Thermal Energy System Specialists, “TRNSYS Transient System
Simulation Tool,” 2015. [Online]. Available: http://www.trnsys.com/. [Accessed: 21-Mar-2015].
[2] P. Fonseca i Casas, A. Fonseca i Casas, N. Garrido-Soriano, and J. Casanovas, “Formal simulation model to optimize building sustainability,” Adv. Eng. Softw., vol. 69, pp. 62–74, Mar. 2014.
[3] P. Fonseca i Casas, Formal Languages for Computer Simulation: Transdisciplinary Models and Applications. Hershey, PA: IGI Global. doi:10.4018/978-1-4666-4369-7, 2014, pp. 1–458.
[4] ITU-T, “Specification and Description Language – Overview of SDL-2010,” 2011.
[5] R. Sanders, “Implementing from SDL,” Telektronikk, pp. 120–129, 2000.
[6] O. Balci, “Golden rules of verification, validation, testing, and certification of modeling and simulation applications,” SCS M&S Mag., vol. 4, pp. 1–7, 2010.
[7] L. Doldi, SDL Illustrated - visually design executable models. 2001, p. 268.
[8] R. Sargent, “Verification and validation of simulation models,” in Proceedings of the 2009 Winter Simulation Conference (WSC), 2009, vol. 37, no. 2, pp. 66–66.
[9] V. R. J. Salom, J. Ortiz, “Method to develop cost-effective studies of energy efficiency measures for Mediterranean residential existing buildings with multi-criteria optimization,” in World Sustainable Building, 2014.
[10] P. Fonseca i Casas, J. Casanovas, and X. Ferran, “Passenger flow simulation in a hub airport: An application to the Barcelona International Airport,” Simul. Model. Pract. Theory, vol. 44, pp. 78–94, May 2014.
[11] Richard M. Fujimoto, “PARALLEL AND DISTRIBUTED SIMULATION SYSTEMS,” in Proceedings of the 2001 Winter Simulation Conference, 2001, pp. 1605–1612.
[12] Richard M. Fujimoto, Parallel and distributed simulation systems, vol. 1. John Wiley & Sons, Ltd, 2001, p. 162.
Pau Fonseca i Casas is an associate professor of the Department of Statistics and Operational research of the Technical University of Catalonia, teaching in Statistics and Simulation areas. He obtained his Ph.D. in Computer Science on 2007 from Technical University of Catalonia. He also works in the InLab FIB (http://inlab.fib.upc.edu/) as a head of the Environmental Simulation area, developing Simulation projects since 1998. His research interests are discrete simulation applied to industrial, environmental and social models, and the formal representation of such models. His website is http://www-eio.upc.es/~pau/. Antoni Fonseca i Casas is an associate professor of the Department of technology of the esdap school (higher school of design and arts of Catalonia), at the DEIA-barcelona (headquarters of the consortium of the edutation departament). Participating as a partner with inLab FIB. Researcher of the Technical University of Catalonia on the area of efficiency and optimization of systems, is developing, in conjunction with the research group SUMMLAB and the inLab FIB, is doctoral thesis about optimization of building energy and environmental efficiency. Nuria Garrido - Soriano is an associate professor of the Department of Heat Engines in the Terrassa School of Engineering (Technical University of Catalonia). She obtains her PhD in Industrial Engineering on 2010 from the UPC. Her area of expertise includes thermal engineering, heat transfer, energy certification in buildings, simulation tools and the Life Cycle Analysis (LCA). She is also member of the research group at UPC, SUMMLab (https://summlab.upc.edu/). She is responsible for research and technology transfer related to energy efficiency in buildings and certification since 2011. Joana Aina Ortiz is a researcher of Building Performance and Thermal Energy Group of Catalonia Institute for Energy Research (IREC). Her research is focused on energy efficiency in buildings of Mediterranean climates, user behavior, environmental comfort and sustainable urban planning. She uses the building simulation and the monitoring campaigns as tools to develop his research. She is carrying out the Ph.D in energy refurbishment of residential buildings in Mediterranean climates in the Sustainable Institute of UPC. Josep Casanovas is a full professor in Operations Research, specializing in Simulation Systems. He is one of the founders of the Barcelona School of Informatics (FIB), of which he was Dean from 1998 to 2004. He is also the director of inLab FIB, a research lab that has been particularly active in technology transfer to business. Among his recent projects is the cooperation in the creation of simulation environments for people and vehicle flow in the new Barcelona airport terminal. He has led several EU-funded projects in the area of simulation and operations research and is a strong advocate of the knowledge and technology transfer function between university and society. Jaume Salom is the head of the ECOS – Energy Efficiency in Systems, Buildings and Communities - Research Group, in Catalonia Institute for Energy Research (IREC). He holds a Ph.D in Thermal Engineering (Polytechnic University of Catalonia, Spain, 1996) and his research and professional experience is in the fields of heat and mass transfer, fluid mechanics, numerical and dynamic simulation, energy efficiency, building physics, thermal comfort, software development and daylighting.
Recent Advances on Energy, Environment, Ecosystems, and Development
ISBN: 978-1-61804-291-0 45

1H NMR study of water clusters in supercooledLiCl/water solution
Carmelo Corsaro1,2,∗, Domenico Mallamace3, Nicola Cicero3,4, Sebastiano Vasi2,Giacomo Dugo3,4 and Francesco Mallamace1,5
1CNR-IPCF, Viale F. Stagno D’Alcontres 37, 98158 Messina, Italy2Dipartimento di Fisica e Scienze della Terra, Universita di Messina, 98166 Messina, Italy
3Dipartimento S.A.S.T.A.S., Universita di Messina, 98166 Messina, Italy4Science4Life, spin-off University of Messina, Viale F. Stagno DAlcontres 31, Messina, Italy
5NSE Department, Massachusetts Institute of Technology, Cambridge MA 02139, USA(Invited Paper)
Abstract—We have performed a proton Nuclear Magnetic Res-onance (NMR) study on a water solution of lithium chloride ateutectic concentration (6.76 M) as a function of the temperature.We have acquired the NMR spectra from 320K to 205K each5K and executed the line-shape analysis by means of a Gaussiandeconvolution. Our data reveal the existence of different local waterstructures within the solution and suggest the occurrence of a liquid-liquid transition at about 225K below which water is able to developits characteristic tetrahedral network.
Keywords—lithium chloride, dynamical crossover, water solution,NMR.
I. INTRODUCTION
WATER is probably the simplest liquid as well asthe most complex. In fact, although water molecules
consist of only three atoms, their high tendency of formingan extended network of hydrogen bonds characterize wateranomalous properties that indeed are responsible of life. Abovethe temperature of about 325K, water can be considered asimple liquid because the strength and lifetime of hydrogenbonds are not enough to form the characteristic tetrahedralstructure [1]. Indeed, in the high temperature regime watermolecules display a local high density structure. Below 325K,when the high directionality of the hydrogen bond beginsto dominate over the thermal disorder, the thermodynamicproperties of water display counterintuitive behavior that ismore pronounced in the supercooled regime. In fact, manythermodynamic response functions of water show a critical-like behavior with an apparent divergence at about 228Kwhich is above the temperature of homogeneous nucleation(Tx = 231K) [2], [3]. The crystallization kinetics preventsto study liquid water below Tx and alternative strategiesare needed to perform experiments within the so-called NoMan’s Land. In particular, proper confining geometries orwater solutions can be used to avoid water crystallization andtherefore to study the liquid phase of water below Tx [4],[5], [7]. Understanding the anomalous behavior of water hasbeen the subject of many experimental and theoretical worksthat are still under consideration (see e.g. [2], [8]). Startingfrom the stability limit hypothesis of Speedy [9], the scenario
* e-mail: [email protected]
that is receiving many independent confirmation is that of theliquid-liquid transition associated with a second critical pointfor water [10], [11]. This liquid-liquid transition, occurringfrom an high density liquid at higher temperatures to a lowdensity liquid at lower temperatures, seems to be connectedwith the so-called Widom line where thermodynamic responsefunctions take on extrema values [2], [3].
It is well known that an eutectic solution of LiCl in watercan be cooled to 200K with no crystallization phenomena[12]. Many experimental and simulation studies have beenperformed on this system confirming that it can be considereda model system for studying deeply supercooled water inits bulk phase [13]–[18]. However, some discrepancies thatdepend on the used technique emerge. The coexistence of dif-ferent local structures and of the associated relaxations do notallow a simple data interpretation. The open debate concernsin particular the occurrence of the dynamical crossover forwater in the temperature interval 210−230K [14]–[17], [19]–[21]. The dynamic crossover has been observed for water indifferent environment [5], [22] and it has been suggested thatcan be generalized for every liquids approaching the dynamicalarrest before intervening the glass transition [23], [24].
In this work, in order to shed some light on the formationof different local structures and on the occurrence of a liquid-liquid transition for water, we investigate the thermal behaviorof an eutectic solution of LiCl in water by means of protonNMR spectroscopy. In particular, we have acquired the NMRspectra by cooling from 320K to 205K each 5K and analyzedthe line-shape of the water peak.
II. MATERIALS AND METHODS
The water/LiCl solution at the eutectic concentration of 6.76M was prepared starting by anhydrous LiCl and deionisedwater (Sigma-Aldrich) by using Mohr’s method. NMR exper-iments were performed at atmospheric pressure with a BrukerAvance spectrometer operating at 700 MHz (proton Larmorfrequency) equipped by a probehead with inner coil optimizedfor proton observation. The investigated temperature range was205K < T < 320K with an accuracy of ±0.1K and thetemperature was calibrated by means of the Bruker standard
Recent Advances on Energy, Environment, Ecosystems, and Development
ISBN: 978-1-61804-291-0 46
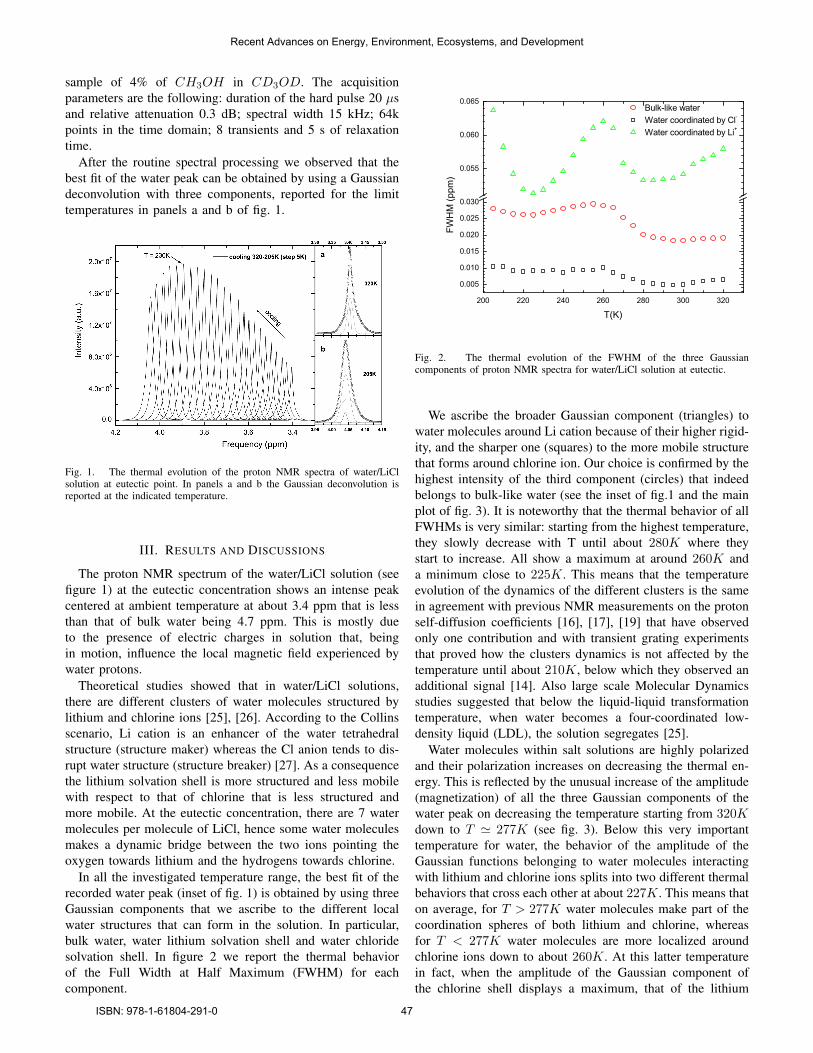
sample of 4% of CH3OH in CD3OD. The acquisitionparameters are the following: duration of the hard pulse 20 µsand relative attenuation 0.3 dB; spectral width 15 kHz; 64kpoints in the time domain; 8 transients and 5 s of relaxationtime.
After the routine spectral processing we observed that thebest fit of the water peak can be obtained by using a Gaussiandeconvolution with three components, reported for the limittemperatures in panels a and b of fig. 1.
Fig. 1. The thermal evolution of the proton NMR spectra of water/LiClsolution at eutectic point. In panels a and b the Gaussian deconvolution isreported at the indicated temperature.
III. RESULTS AND DISCUSSIONS
The proton NMR spectrum of the water/LiCl solution (seefigure 1) at the eutectic concentration shows an intense peakcentered at ambient temperature at about 3.4 ppm that is lessthan that of bulk water being 4.7 ppm. This is mostly dueto the presence of electric charges in solution that, beingin motion, influence the local magnetic field experienced bywater protons.
Theoretical studies showed that in water/LiCl solutions,there are different clusters of water molecules structured bylithium and chlorine ions [25], [26]. According to the Collinsscenario, Li cation is an enhancer of the water tetrahedralstructure (structure maker) whereas the Cl anion tends to dis-rupt water structure (structure breaker) [27]. As a consequencethe lithium solvation shell is more structured and less mobilewith respect to that of chlorine that is less structured andmore mobile. At the eutectic concentration, there are 7 watermolecules per molecule of LiCl, hence some water moleculesmakes a dynamic bridge between the two ions pointing theoxygen towards lithium and the hydrogens towards chlorine.
In all the investigated temperature range, the best fit of therecorded water peak (inset of fig. 1) is obtained by using threeGaussian components that we ascribe to the different localwater structures that can form in the solution. In particular,bulk water, water lithium solvation shell and water chloridesolvation shell. In figure 2 we report the thermal behaviorof the Full Width at Half Maximum (FWHM) for eachcomponent.
200 220 240 260 280 300 320
0.005
0.010
0.015
0.020
0.025
0.030
0.055
0.060
0.065 Bulk-like water Water coordinated by Cl- Water coordinated by Li+
FWH
M (p
pm)
T(K)
Fig. 2. The thermal evolution of the FWHM of the three Gaussiancomponents of proton NMR spectra for water/LiCl solution at eutectic.
We ascribe the broader Gaussian component (triangles) towater molecules around Li cation because of their higher rigid-ity, and the sharper one (squares) to the more mobile structurethat forms around chlorine ion. Our choice is confirmed by thehighest intensity of the third component (circles) that indeedbelongs to bulk-like water (see the inset of fig.1 and the mainplot of fig. 3). It is noteworthy that the thermal behavior of allFWHMs is very similar: starting from the highest temperature,they slowly decrease with T until about 280K where theystart to increase. All show a maximum at around 260K anda minimum close to 225K. This means that the temperatureevolution of the dynamics of the different clusters is the samein agreement with previous NMR measurements on the protonself-diffusion coefficients [16], [17], [19] that have observedonly one contribution and with transient grating experimentsthat proved how the clusters dynamics is not affected by thetemperature until about 210K, below which they observed anadditional signal [14]. Also large scale Molecular Dynamicsstudies suggested that below the liquid-liquid transformationtemperature, when water becomes a four-coordinated low-density liquid (LDL), the solution segregates [25].
Water molecules within salt solutions are highly polarizedand their polarization increases on decreasing the thermal en-ergy. This is reflected by the unusual increase of the amplitude(magnetization) of all the three Gaussian components of thewater peak on decreasing the temperature starting from 320Kdown to T ≃ 277K (see fig. 3). Below this very importanttemperature for water, the behavior of the amplitude of theGaussian functions belonging to water molecules interactingwith lithium and chlorine ions splits into two different thermalbehaviors that cross each other at about 227K. This means thaton average, for T > 277K water molecules make part of thecoordination spheres of both lithium and chlorine, whereasfor T < 277K water molecules are more localized aroundchlorine ions down to about 260K. At this latter temperaturein fact, when the amplitude of the Gaussian component ofthe chlorine shell displays a maximum, that of the lithium
Recent Advances on Energy, Environment, Ecosystems, and Development
ISBN: 978-1-61804-291-0 47

200 220 240 260 280 300 320
5.0x10⁸
1.0x10⁹
1.5x10⁹
2.0x10⁹
2.5x10⁹
227K 277K
Bulk-like water Water coordinated by Cl- Water coordinated by Li+
Am
plitu
de (a
.u.)
T (K)
Fig. 3. The evolution of the amplitude of the three Gaussian componentsof proton NMR spectra for water/LiCl solution at eutectic point is reportedas a function of the temperature. The value is corrected by the Curie law.Vertical lines refer to the characteristic temperature of 277K (solid) and227K (dotted).
shell shows a minimum suggesting an inversion of the trend.The magnetization of the bulk-like water component increaseson decreasing the temperature until about 225K when thecorrelation length of water molecules is maximum [2] andwater develops its hydrogen bonded network within which ionsconstitute only local defects because they ”prefer” (or have)to segregate from water, as happens in ice formation [28],forming a solute-rich water nanophase [25]. This behaviouris reflected in the decreasing (by decreasing the temperature)of the amplitude of all Gaussian components for T < 225K(figure 3).
IV. CONCLUSIONS
In this paper we have analyzed the line-shape of the protonNMR water peak in a solution with LiCl at the eutecticconcentration (6.76 M) as a function of the temperature inthe range 205K < T < 320K. The best fit of the peakwas obtained by using three Gaussian components reflectingthe different local structures of water molecules within thesolution. The most intense Gaussian component belongs tobulk water, whereas the other two belong to water moleculesin the coordination spheres of the lithium and chlorine ionsin solution. The broader Gaussian component is ascribed tothe lithium water shell reflecting the properties of lithiumion to be a structure maker, because the local water structuresolvating this positive ion is more rigid than that of bulk water.The contrary holds for water molecules within the chlorinecoordination sphere.
The main result of our work concerns the observation oftwo characteristic temperatures at which the clustering orga-nization of water molecules within the solution shows peculiarbehavior. For T < 277K, the two water shells surrounding thetwo different ions show opposite thermal behavior up to 225K,the temperature of the liquid-liquid dynamic crossover, whenwater fully develops its tetrahedral hydrogen bonded network.
REFERENCES
[1] F. Mallamace, C. Corsaro, H. E. Stanley, A singular thermodynamicallyconsistent temperature at the origin of the anomalous behavior of liquidwater. Sci. Rep. 2, 993, 2012.
[2] F. Mallamace, C. Corsaro, H. E. Stanley, Possible relation of waterstructural relaxation to water anomalies. Proc. Natl. Acad. Sci. U.S.A.110, 4899, 2013.
[3] F. Mallamace, C. Corsaro, D. Mallamace, C. Vasi, H. E. Stanley, Thethermodynamical response functions and the origin of the anomalousbehavior of liquid water. Faraday Discuss. 167, 95, 2013.
[4] F. Mallamace, C. Corsaro, D. Mallamace, S. Vasi, C. Vasi, H. E. Stanley,Thermodynamic properties of bulk and confined water. J. Chem. Phys.141, 18C504, 2014.
[5] F. Mallamace, C. Branca, C. Corsaro, N. Leone, J. Spooren, H. E.Stanley, S.-H. Chen, Dynamical Crossover and Breakdown of theStokesEinstein Relation in Confined Water and in Methanol-Diluted BulkWater. J. Phys. Chem. B 114(5), 1870-1878, 2010.
[6] F. Mallamace, C. Corsaro, P. Baglioni, E. Fratini, S.-H. Chen, Thedynamical crossover phenomenon in bulk water, confined water andprotein hydration water. J. Phys.: Condens. Matter 24, 064103, 2012.
[7] F. Mallamace, M. Broccio, C. Corsaro, A. Faraone, L. Liu, C.-Y. Mou,S.-H. Chen, Dynamical properties of confined supercooled water: anNMR study. J. Phys.: Condens. Matter 18, S2285S2297, 2006.
[8] J. Russo and H. Tanaka, Understanding waters anomalies with locallyfavoured structures. Nature Comm. 5, 3556, 2014.
[9] R. J. Speedy, Stability-limit conjecture. An interpretation of the proper-ties of water. J. Phys. Chem. 86, 982, 1982.
[10] P. H. Poole, F. Sciortino, U. Essmann, H. E. Stanley, Phase behaviourof metastable water. Nature 360, 324, 1992.
[11] J. C.Palmer, F. Martelli, Y. Liu, R. Car, A. Z. Panagiotopoulos, P. G.Debenedetti, Metastable liquid-liquid transition in a molecular modelof water. Nature 510, 385, 2014.
[12] A. Elarby-Aouizerat, J.-F. Jal, P. Chieux, J. M. Letoffe, P. Claudy,J. Dupuy, Metastable crystallization products and metastable phasediagram of the glassy and supercooled aqueous ionic solutions of LiCl.J. Non-Cryst. Solids 104, 203, 1988.
[13] M. E. Gallina, L. Bove, C. Dreyfus, A. Polian, B. Bonello, R. Cucini,A. Taschin, R. Torre, R. M. Pick, The low frequency phonons dynamicsin supercooled LiCl, 6H2O. J. Chem. Phys. 131, 124504, 2009.
[14] L. Bove, C. Dreyfus, R. Torre, R. M. Pick, Observation of nanophasesegregation in LiCl aqueous solutions from transient grating experi-ments. J. Chem. Phys. 139, 044501, 2013.
[15] S. C. Santucci, L. Comez, F. Scarponi, G. Monaco, R. Verbeni, J.-F.Legrand, C. Masciovecchio, A. Gessini, D. Fioretto, Onset of the α-relaxation in the glass-forming solution LiCl6H2O revealed by Brillouinscattering techniques. J. Chem. Phys. 131, 154507, 2009.
[16] D. A, Turton, C. Corsaro, D. F. Martin, F. Mallamace, K. Wynne, Thedynamic crossover in water does not require bulk water. Phys. Chem.Chem. Phys. 14, 8067, 2012.
[17] E. Mamontov, A. Faraone, E. W. Hagaman, K. S. Han, E. Fratini, A low-temperature crossover in water dynamics in an aqueous LiCl solution:diffusion probed by neutron spin-echo and nuclear magnetic resonance.J. Phys. Chem. B 114, 16737, 2010.
[18] P. O. Maurin, J. Dupuy-Phillon, J.-F. Jal, N. Asahi, T. Kamiyama,J. Kawamura, Y. Nakamura, Dynamics and Structure in Good GlassFormers LiCl-RH2O: A NMR and Quasielastic Neutron Scattering StudyProg. Theor. Phys. Suppl. 126, 141, 1997.
[19] D. A. Turton, C. Corsaro, M. Candelaresi, A. Brownlie, K. R. Seddon,F. Mallamace, K. Wynne, The structure and terahertz dynamics of waterconfined in nanoscale pools in salt solutions. Faraday Discuss. 150, 493,2011.
[20] L. Bove, C. Dreyfus, A. Polian, B. Bonello, I. Malfanti, A. Taschin, R.Torre, R. M. Pick, The low frequency dynamics of supercooled LiBr,6H2O. J. Chem. Phys. 134, 034514, 2011.
[21] M. Nakanishi, P. Griffin, E. Mamontov, A. P. Sokolov, No fragile-to-strong crossover in LiCl-H2O solution. J. Chem. Phys. 136, 124512,2012.
[22] F. Mallamace, C. Corsaro, P. Baglioni, E. Fratini, S.-H. Chen, Thedynamical crossover phenomenon in bulk water, confined water andprotein hydration water. J. Phys.: Condens. Matter 24, 064103, 2012.
[23] F. Mallamace, C. Branca, C. Corsaro, N. Leone, J. Spooren, S.-H. Chen,H. E. Stanley, Transport properties of glass-forming liquids suggest thatdynamic crossover temperature is as important as the glass transitiontemperature. Proc. Natl. Acad. Sci. U.S.A. 107, 22457, 2010.
Recent Advances on Energy, Environment, Ecosystems, and Development
ISBN: 978-1-61804-291-0 48

[24] F. Mallamace, C. Corsaro, H. E. Stanley, S.-H. Chen, The role of thedynamic crossover temperature and the arrest in glass-forming fluids.Eur. Phys. J. E 34, 94, 2011.
[25] L. Le and V. Molinero, Nanophase Segregation in Supercooled AqueousSolutions and Their Glasses Driven by the Polyamorphism of Water. J.Phys. Chem. A 115, 5900, 2011.
[26] L. Petit, R. Vuilleumier, P. Maldivi, C. Adamo, Ab Initio MolecularDynamics Study of a Highly Concentrated LiCl Aqueous Solution. J.Chem. Theory Comput. 4, 1040, 2008.
[27] K. D. Collins, Charge density-dependent strength of hydration andbiological structure. Biophys. J. 72, 65, 1997.
[28] S. Klotz, L. Bove, T. Straessle, T. C. Hansen, A. M. Saitta, The prepa-ration and structure of salty ice VII under pressure Nature Materials 8,405, 2009.
Carmelo Corsaro was born on 22/09/1977. Hegraduated summa cum laude in Physics in 2003 andreceived his PhD in Physics at the University ofMessina (Italy) in 2007. Actually, he is a researcherin Physics carrying on studies on complex systems,such as water and water solutions, especially bymeans of the Nuclear Magnetic Resonance tech-nique.
Recent Advances on Energy, Environment, Ecosystems, and Development
ISBN: 978-1-61804-291-0 49

Abstract— From the rising of energy prices since 2004, Thailand
as very high oil import dependency began to develop her own long- term energy efficiency plan. This paper builds the energy demand and supply model from the LEAP software and focus the long-term energy and greenhouse gas impact for the national energy efficiency plan covering the base year 2010 to 2030. From the results, we found that the energy demand would decrease from 141.93 Mtoe to 115.64 Mtoe, or 18.52%, in 2030, for the co-benefit result from greenhouse gas emission mitigation, which was calculated using IPCC’s emission factor, the greenhouse gas would decrease by 150 MtCO2-eq (or 30.4%) from the energy efficiency plan by applying high efficiency policies with full successive ratio. We also found that this mitigation also impacts to the decrease of grid emission factor from 542 in the BAU to 527 kgCO2-eq per MWh in that year.
Keywords—Energy efficiency plan, Energy model, Greenhouse gas emission
I. INTRODUCTION S one of ongoing developing countries of Asia which planned to increase her gross domestic products (GDP)
from industry and commercial sector from the investment of foreign countries during the past 30 years, Thailand then experienced one of the region’s highest energy and greenhouse gas growth rate. At present, as the region’s second largest economy and energy consumer, Thailand alone contributes 20.82% of ASEAN primary energy consumption in 2011 and around 0.9% of the world (ERIA, 2014).
Considering the 1990 to 2010 period, we found that the energy consumption in Thailand continuously increased at an annual average rate of 4.4%. At present, energy consumption is 2.3 times the amount it was in 1990; the growth rate has been in line with the economic growth rate, of which the annual average rate is 4.5%. In particular, energy consumption
This work was supported by the Department of Alternative Energy development and Efficiency (DEDE), Ministry of Energy, Thailand as part of Thailands’s Nationally Appropriate Mitigation Actions (NAMAs) preparation.
Wongkot Wongsapai is assistant professor and head of the Climate Change Engineering and Management in Energy Sector Laboratory, Faculty of Engineering of Chiang Mai University, Thailand (corresponding author: +66-81-681-2002; e-mail: [email protected]).
Chaichan Ritkrerkkrai is master degree student in energy engineering, Chiang Mai University and also deputy-head of the Climate Change Engineering and Management in Energy Sector Laboratory, Faculty of Engineering of Chiang Mai University, Thailand (e-mail: [email protected]).
growth rates in the industry and commercial building sectors are much higher than the GDP growth rate, i.e. 3.0 and 3.7 times respectively, compared with consumption in 1990 (EPPO, 2011). This means that the energy efficiency level of the country was far behind the suitable level. Another reason that impact Thailand to developing the long term plan is the rapidly increase of the world crude oil price since 2004 which also impacted Thailand in many dimensions, e.g. rising in oil import,dependency, rising of energy import to GDP proportion and oil subsidization.
From the above reasons, Thailand made response by developing her first long-term national energy efficiency development plan (hereafter, EEDP) covering the 2011 to 2030.
II. THE ENERGY EFFICIENCY DEVELOPMENT PLAN This Energy Efficiency Development Plan is formulated
with a target to reduce energy intensity by 25% in 2030, compared with that in 2005, or equivalent to reduction of final energy consumption by 20% in 2030, or about 38,200 thousand tons of crude oil equivalent (ktoe). It should be noted here that Thailand adjusted the estimated energy reduction in the year 2030 from 30,000 ktoe in the first EEDP edition to 38,200 ktoe in 2013. From this plan, the energy intensity, which means the final energy consumption per GDP, would reduce by 25% from 15.6 to 11.7 ktoe per billion Thai Baht in the year 2030, as shown in figure 1.
Fig.1 Thailand’s EEDP Target
Implications of Greenhouse Gas Emission Reduction from Thailand Long-Term Energy Efficiency Development Plan
Wongkot Wongsapai and Chaichan Ritkrerkkrai
A
Recent Advances on Energy, Environment, Ecosystems, and Development
ISBN: 978-1-61804-291-0 50

III. ABOUT THE MODEL AND SCENARIOS In this paper, the Long Range Energy Alternatives Planning
(LEAP) software was applied to forecast the energy demand and supply for Thailand. The Business as usual (BAU) was first estimated based on the data from the GDP, population, past energy and electricity consumption, current energy situation (year 2012), and energy intensity of the country, then the energy efficiency scenarios, with successive level, from EEDP have been internalized, as shown in figure 2. Greenhouse gas emission data also forecasted from the model. All details of the BAU and scenarios are as follows;
Energy
Macroeconomic dataset: GDP, POP
Technology data
Energy & Emission data
EEDP
PDP
Nat
iona
l Ene
rgy
plan
s
With success level
Marginal Abatement Cost (MAC) Data
Energy & GHG Macroeconomic
Model
Data Input Model Process & Analysis Output
BAUScenario
Energyoptions ranking
Mitigation scenarios
• GHG level• Environmental
plan; i.e.NAMAs
• Demand side• Supply side• Reductions
• Base year • GDP Growth
GHG• Mitigation• Grid emission
factor
Fig.2 Model approach in this study
A. Business as usual (BAU) To develop the BAU of this study, we applied the PDP
(2007 version) along with the GDP growth rate from national data. The average annual growth rate (AAGR) of GDP, calculated from the constant 1988 price, would be 4.39% during 2011-2030 while the AAGR for the population growth in the same period would be 0.26%.
The demand-side comprises five main sectors, as follows; • Industry sector, • Large commercial building sector, • Household and small building sector, • Transport sector, • Other sectors (agricultural, construction and mining
sector) Under the BAU, the reference energy system (RES) have
been developed and forecast by sector with different data input. Figure 3 presents the data input and flow for future energy forecast in BAU scenario, by sector.
Then, the regression processes by using the econometric model have been developed in each sector. We then get the main equations in each economic sector, as follows;
Industry sector; (1) When ED = Energy demand in sector, by type (ktoe) GDP = GDP per capita (Thai Baht per person) α and β = Co-efficient in industry sector (regression from past energy data in the sector) i = Sub-sector type
Energy forecast (Industry and large commercial building
sector)
Final energy consumption data input Final energy consumption
data by sector
GDP forecast
GDP and population data input
Econometric models
• Share of fuels• Share of electricity
Final energy consumption data by sector and fuel types
(a) Industry and large commercial building sector
Number of household
Number of household by incomes
Number of household equipments by incomes
Electricity consumption of household by incomes and
household equipments
• Household equipments usage hour
• Household equipments power
• Household equipments efficiency
Population and size of household
Share of household by incomes
Share of household equipments by incomes
(b) Household and small building sector
Energy forecast
Number of vehicle data by vehicle type
Total Vehicle Kilometer of Travel, VKT (km/year)
by vehicle type
GDP forecast
GDP and population data Econometric models of
vehicle’s number by vehicle type
Average annual Vehicle Kilometer of Travel, VKT
(km/year) by vehicle type
Energy consumption of land transport by fuel type
Shares of vehicle’s fuel consumption by fuel type
(c) Transport sector (land transport)
Energy forecast
Final energy consumption data
by transport sector Final energy consumption data by transport sector
and fuels typeGDP forecast
GDP and population data input
Econometric models
(d) Transport sector (rail, air, marine transport) Fig.3 Flow of energy for BAU forecast, by sector
Large commercial building sector;
(2)
When ED = Energy demand in sector (ktoe)
Recent Advances on Energy, Environment, Ecosystems, and Development
ISBN: 978-1-61804-291-0 51

GDP = GDP per capita (Thai Baht per person) α and β = Co-efficient in large commercial building sector (regression from past energy data in the sector) i = Sub-sector type j = Energy type Household and small building sector;
In this sector, we applied the proportion of each electricity appliances in household sector which taken from the national survey along with the forecast of average disposable income of each household and number of household from national data to forecast the energy demand in household sector.
Transport sector: rail, air, marine transport;
(3) When ED = Energy demand in sector, by type (ktoe) GDP = GDP per capita (Thai Baht per person) α and β = Co-efficient in each transport sector type (regression from past energy data in the sector) i = Sub-sector type (rail, marine-domestic and international, air-domestic and international) Transport sector: land transport;
(4)
(5)
(6)
(7) When NV = Number of vehicle VKT = Average vehicle distance (km per year) S = Minimum traveling distance (km per year) FE = Consumption rate , by type (km per litre) ED = Energy demand in sector, by type (ktoe) GDP = GDP per capita (Thai Baht T = Time series (T =1 in year 2000) α and β = Co-efficient in land transport sector (regression from past energy data in the sector) i = Vehicle type (car, van, small truck, truck, etc.) j = Energy type (type of fuel in land transport) Power sector;
In this sector, we disaggregate into (i) power generation and (ii) transmission and distribution system.
For power generation, we applied all 16 types of power plant in the model, including all renewable energy generation type and nuclear power. Then, we applied the power development plan (PDP2007) for forecast the future growth of each power generation type, transmission and distribution system.
B. Energy Efficiency Scenario In this EEDP scenario, we prepared the data in each sector
as follows;
Industry sector; Disaggregate into five energy intensive sectors; i.e. cement,
food, basic metal, chemical and pulp and paper industry. Those five sectors had proportion around 84% of total energy consumption in the year 2009 (DEDE, 2009a)
For energy efficiency improvement estimation, we used the potential energy reduction in each sector form the difference between Thailand and best practice benchmarking specific energy consumption (SEC) data from industrialized countries. The wider gap of SEC between Thai and best practice countries means the higher potential of energy conservation and efficiency improvement. Large commercial building sector;
In this sector, the future potential of energy reduction are taken from the difference between the existing energy consumption in building per area (in the unit of energy consumption per square meter) and the building energy code (BEC) of Thailand (DEDE, 2009b). Household and small building sector;
The future potential of energy reduction are taken from the difference between the existing energy consumption in each main electricity appliances and the high energy performance standard (HEPs) of Thailand. Here, we focused in lighting, air conditioner, electric water heater for electric energy potential. For cooking device, we assume the higher efficiency in LPG and charcoal cooking stove. Transport sector;
For transport sector, the future potential of energy reduction are taken from the difference between the existing consumption rate and the new fuel economy from Japan standard with 20% energy efficiency improvement. We also consider the substitute o road transport from conventional fuel to electricity by using the 70% of new motorcycle sale in 2030 would be electricity motorcycle (IEA, 2009 and Ogden et. Al, 2008, Pongthanaisawan and Sorapipatana, 2012).
IV. RESULTS Even Thailand face slow economic growth in the past ten
years, however, continued economic growth implies growth in energy use. How that energy use and energy efficiency plan would result in the coming years, we adopted the LEAP (Long-range Alternatives Planning software) model to forecast Thailand’s future energy consumption by sector, as well as to describe potential future energy supply arrangements under EEDP.
A. The Business as usual (BAU) From the results, we found that the final energy demand
from all sectors in Thailand in the year 2030 would double increase from 71.70 Mtoe in the base year 2010 to 141.93 Mtoe. As presented in figure 4, the highest proportion would be industry sector at 41.41%, followed by transport sector at 34.5%. Diesel and electricity would have the highest share in final energy demand in 2030 at 21.93% and 2159%, respectively, as shown in figure 5.
Recent Advances on Energy, Environment, Ecosystems, and Development
ISBN: 978-1-61804-291-0 52

0.0
2.0
4.0
6.0
8.0
10.0
12.0
14.0
16.0
18.0
20.0
22.0
24.0
0
20,000
40,000
60,000
80,000
100,000
120,000
140,000
160,000
2005
2006
2007
2008
2009
2010
2011
2012
2013
2014
2015
2016
2017
2018
2019
2020
2021
2022
2023
2024
2025
2026
2027
2028
2029
2030
Ener
gy In
tens
ity (k
toe/
Billi
on b
aht)
Fina
l Ene
rgy
Dem
and
(kto
e)Final Energy Demand by Sector
Household Commercial Building Transport
Industry Others Energy Intensity Fig.4 Final energy demand, BAU, by sector 2005-2030
0
20,000
40,000
60,000
80,000
100,000
120,000
140,000
160,000
Fina
l Ene
rgy
Dem
and
(kto
e)
Final Energy Demand by Fuel Type
All Others Biomass CNG Coal Bituminous Diesel Electricity
Gasoline Jet Kerosene LPG Natural Gas Residual Fuel Oil
Fig.5 Final energy demand, BAU, by fuel type 2005-2030
Considering to the greenhouse gas results, we found that
the greenhouse gas from all energy sectors in Thailand in the year 2030 would be 494 million ton of CO2 equivalent (MtCO2-eq) while it was just 244 MtCO2-eq in the base year 2010.Electricity generation would be the highest proportion with 41.7% of total emission in the year 2030. The greenhouse gas emission per capita would also rose in double from 3.64 to 6.96 tCO2-eq per capita per year, from 2010 to 2030. Figure 6 presents the greenhouse gas emission from BAU by economics sector.
0.0
2.0
4.0
6.0
8.0
10.0
0
50
100
150
200
250
300
350
400
450
500
GH
G p
er c
apita
(Mt o
f CO
2eq/
pers
on)
GH
G E
mis
sion
(Mt o
f CO
2 eq
)
Total GHG Emission by Sector
Household Commercial Building TransportIndustry Others Electricity GenerationGHG per capita
Fig.6 GHG emission in BAU, by sector, 2005-2030
B. The Energy efficiency scenario The energy saving, from fully success scenario of EEDP,
presents in table 1 and figure 7. From the energy efficiency
results, we found that the final energy demand would decrease from 141.9 Mtoe in BAU to 115.64 Mtoe from all sector energy efficiency scenarios in 2030. The highest share in energy saving would be industry sector with 42.8% of total energy saving in 2030. Table 1 Energy saving results from EEDP, by sector Scenario Details 2010 2015 2020 2025 2030
1 BAU 71,702 84,771 101,195 119,733 141,934 2 BAU - EEDP COM 71,702 84,516 100,478 118,343 139,705 3 BAU - (EEDP COM+HH) 71,702 84,052 99,369 116,397 136,658 4 BAU - (EEDP COM+HH+IND) 71,702 82,556 95,628 109,494 125,397 5 BAU - (EEDP COM+HH +IND+TRP) 71,702 81,421 92,301 103,077 115,642 6 Maximum energy reduction= (1)-(5) 3,350 8,894 16,656 26,292
Note: COM = Commercial building, HH = household, IND = industry and TRP = transport sector.
50,000
60,000
70,000
80,000
90,000
100,000
110,000
120,000
130,000
140,000
150,000
Fina
l Ene
rgy
Dem
and
(kto
e)
Energy Saving under Energy Efficiency Development Plan
BAU BAU - EEDP COMBAU - EEDP COM+HH BAU - EEDP COM+HH+INDBAU - EEDP COM+HH +IND+TRP
Fig.7 Energy saving from EEDP, by sector 2005-2030
Under the EEDP full 100% success approach (as planned) compared to BAU, the results from LEAP show that the greenhouse gas emission would decrease by 150 MtCO2-eq (or 30.4 %) in the year 2030. Transport sector would be the highest reduction proportion at 61 MtCO2-eq, followed by industry sector at 52 MtCO2-eq, respectively. Figure 8 presents the greenhouse gas emission mitigation from energy efficiency plan, by sector.
-160
-140
-120
-100
-80
-60
-40
-20
0
GHG
Em
issi
on (M
t of C
O2e
q)
GHG Emission Reduction by EEDP compared to BAU
Large Building Household and Small Building Industry Transport
Fig 8 GHG emission reduction results from EEDP compared with BAU
Recent Advances on Energy, Environment, Ecosystems, and Development
ISBN: 978-1-61804-291-0 53
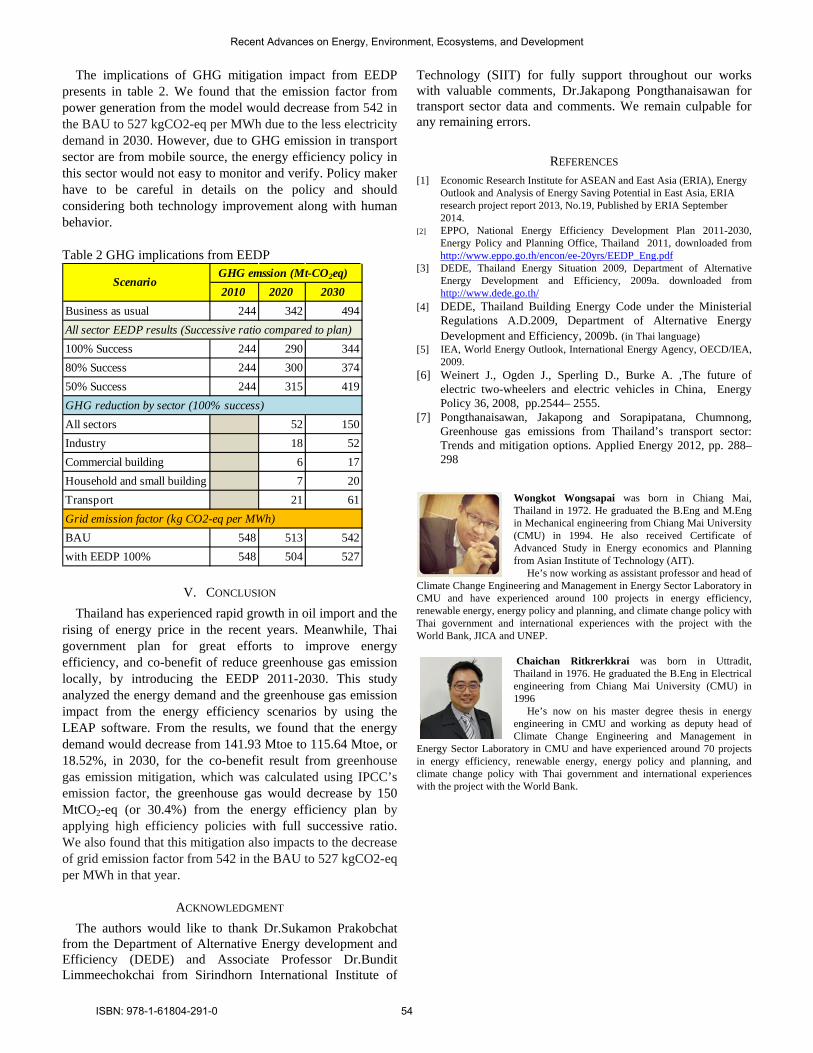
The implications of GHG mitigation impact from EEDP presents in table 2. We found that the emission factor from power generation from the model would decrease from 542 in the BAU to 527 kgCO2-eq per MWh due to the less electricity demand in 2030. However, due to GHG emission in transport sector are from mobile source, the energy efficiency policy in this sector would not easy to monitor and verify. Policy maker have to be careful in details on the policy and should considering both technology improvement along with human behavior. Table 2 GHG implications from EEDP
2010 2020 2030Business as usual 244 342 494
100% Success 244 290 34480% Success 244 300 37450% Success 244 315 419
All sectors 52 150Industry 18 52Commercial building 6 17Household and small building 7 20Transport 21 61
BAU 548 513 542with EEDP 100% 548 504 527
ScenarioGHG emssion (Mt-CO2eq)
All sector EEDP results (Successive ratio compared to plan)
GHG reduction by sector (100% success)
Grid emission factor (kg CO2-eq per MWh)
V. CONCLUSION Thailand has experienced rapid growth in oil import and the
rising of energy price in the recent years. Meanwhile, Thai government plan for great efforts to improve energy efficiency, and co-benefit of reduce greenhouse gas emission locally, by introducing the EEDP 2011-2030. This study analyzed the energy demand and the greenhouse gas emission impact from the energy efficiency scenarios by using the LEAP software. From the results, we found that the energy demand would decrease from 141.93 Mtoe to 115.64 Mtoe, or 18.52%, in 2030, for the co-benefit result from greenhouse gas emission mitigation, which was calculated using IPCC’s emission factor, the greenhouse gas would decrease by 150 MtCO2-eq (or 30.4%) from the energy efficiency plan by applying high efficiency policies with full successive ratio. We also found that this mitigation also impacts to the decrease of grid emission factor from 542 in the BAU to 527 kgCO2-eq per MWh in that year.
ACKNOWLEDGMENT The authors would like to thank Dr.Sukamon Prakobchat
from the Department of Alternative Energy development and Efficiency (DEDE) and Associate Professor Dr.Bundit Limmeechokchai from Sirindhorn International Institute of
Technology (SIIT) for fully support throughout our works with valuable comments, Dr.Jakapong Pongthanaisawan for transport sector data and comments. We remain culpable for any remaining errors.
REFERENCES [1] Economic Research Institute for ASEAN and East Asia (ERIA), Energy
Outlook and Analysis of Energy Saving Potential in East Asia, ERIA research project report 2013, No.19, Published by ERIA September 2014.
[2] EPPO, National Energy Efficiency Development Plan 2011-2030, Energy Policy and Planning Office, Thailand 2011, downloaded from http://www.eppo.go.th/encon/ee-20yrs/EEDP_Eng.pdf
[3] DEDE, Thailand Energy Situation 2009, Department of Alternative Energy Development and Efficiency, 2009a. downloaded from http://www.dede.go.th/
[4] DEDE, Thailand Building Energy Code under the Ministerial Regulations A.D.2009, Department of Alternative Energy Development and Efficiency, 2009b. (in Thai language)
[5] IEA, World Energy Outlook, International Energy Agency, OECD/IEA, 2009.
[6] Weinert J., Ogden J., Sperling D., Burke A. ,The future of electric two-wheelers and electric vehicles in China, Energy Policy 36, 2008, pp.2544– 2555.
[7] Pongthanaisawan, Jakapong and Sorapipatana, Chumnong, Greenhouse gas emissions from Thailand’s transport sector: Trends and mitigation options. Applied Energy 2012, pp. 288–298
Wongkot Wongsapai was born in Chiang Mai, Thailand in 1972. He graduated the B.Eng and M.Eng in Mechanical engineering from Chiang Mai University (CMU) in 1994. He also received Certificate of Advanced Study in Energy economics and Planning from Asian Institute of Technology (AIT). He’s now working as assistant professor and head of
Climate Change Engineering and Management in Energy Sector Laboratory in CMU and have experienced around 100 projects in energy efficiency, renewable energy, energy policy and planning, and climate change policy with Thai government and international experiences with the project with the World Bank, JICA and UNEP.
Chaichan Ritkrerkkrai was born in Uttradit, Thailand in 1976. He graduated the B.Eng in Electrical engineering from Chiang Mai University (CMU) in 1996 He’s now on his master degree thesis in energy engineering in CMU and working as deputy head of Climate Change Engineering and Management in
Energy Sector Laboratory in CMU and have experienced around 70 projects in energy efficiency, renewable energy, energy policy and planning, and climate change policy with Thai government and international experiences with the project with the World Bank.
Recent Advances on Energy, Environment, Ecosystems, and Development
ISBN: 978-1-61804-291-0 54

Enhanced Extremum Seeking Maximum Power Point Tracking for PV System
A.Senthil Kumar1 , K. Kirubasankar2, Thomas Cermak3 and Stanislav Misak4 1,3,4 Energy for Utilization of Non-Traditional Energy, VSB-Technical University of Ostrava, Ostrava- Poruba, Czech Republic. [email protected] 2Associate professor, Chennai Institute of Technology, Chennai, Tamil Nadu, India. [email protected]
Abstract—Photovoltaic cells offer a clean, inexhaustible and pollution free source of electricity which turned attention of many researchers. The PV output is not constant in terms of voltage, so its output can’t be directly fed to electricity bank or to the main gird. This makes a need for design controller, which can extract and calculate the maximum power point from PV array at any instant. The PV array normally drives under the vague environmental disturbances and parameters, this shows that MPPT experience an indefinite stochastic fluctuation. In this paper enhanced extremum seeking MPPT controller is proposed, which has an excellent tolerance of stochastic fluctuations in nature. In the proposed MPPT algorithm, the convergence rate is not determined by unknown power map like conventional extremum seeking algorithm. The convergence and the stability prove the effectiveness of the proposed MPPT algorithm.
Keywords—extremum seeking; MPPT; stochastic fluctuation.
I. INTRODUCTION Among the various renewable energy source, solar energy has turned the attention of many researchers because of its advantages like less pollution, safety and its frequent market potential. The photovoltaic (PV) array have been used widely in spacecraft, satellites and solar vehicles and for domestic applications [1-3]. Maximum Power Point Tracking (MPPT) is a method of directing PV array to its maximum power point. The PV cells inherent nature makes power voltage curves to depend nonlinearly on irradiation intensity and temperature [4, 5]. This is because that the operating voltage or current which maximizes the power will change with changing environmental conditions. Despite of environmental changes, MPPT system is introduced to regulate the operating voltage or current to maintain the output power at maximum level. The rapid growth of embedded technology makes microcontroller based MPPT system a dominated approach in PV systems. Various MPPT algorithm were proposed, in which perturb and observe (PO) and incremental conductance (IncCond) algorithms were more common [6,7] . In perturb and observe algorithm, to monitor the power direction a step perturbation is used in control signal. This PO algorithm is easy to implement, but it has a drawbacks of oscillating at maximum power point and fails to track in a
condition where irradiance changes rapidly [8]. In IncCond algorithm, rapidly changing irradiance can be tracked, since the maximum power point is tracked by comparing the instant and incremental conductance. But due to the use of low precision sensor, error occurs at the maximum power point [9]. To overcome these issues extremum seeking based MPPT algorithm were used. This method is well suited for unknown or partially known dynamics in photovoltaic systems. Perturbation signals were used as a probing signal in ES algorithm, to estimate the power map gradient, and according to the estimation, control signals were updated [10-13]. Simple hardware implementation and verifiable convergence are the main advantages of ES algorithm [14,15]. In existing ES based MPPT controller, the perturbation signals are assumed as periodic, assumption may be slightly superlative because external disturbance are typically stochastic and unknown. But the orthogonality requirement makes periodic extremum seeking complicated to multivariable cases. Another major drawback of existing ES method is convergence speed, which is generally defined by power map gradient of PV system and its system control is influenced highly by unknown and varying environmental condition. Hence to construct a MPPT control system, which is independent of environmental condition is our ultimate objective. In this paper, enhanced extremum seeking MPPT controller is proposed to overcome the drawbacks of the existing ES algorithm. The result will prove the effectiveness of the proposed MPPT controller.
II. MODELING OF PHOTOVOLTAIC AND MPPT SYSTEM The PV array normally consists of numerous photovoltaic modules connected to attain the desired output power. The intensity of light varies all over the day, which moves the maximum power point to different current and voltages. Therefore, a MPPT control system is normally adopted between the load and PV module to adjust the current and voltage, and to maintain the maximum output
Recent Advances on Energy, Environment, Ecosystems, and Development
ISBN: 978-1-61804-291-0 55

power. The proposed MPPT based PV control system schematic is shown in Fig 1. In PV panels the solar energy is converted into electrical energy through the photovoltaic effect. The conversion efficiency can be optimized by designing the MPPT control system between the load and PV panel. The MPPT control system consists of DC-DC converter, DC-DC to driver and a MPPT controller. The proposed Maximum Power Point Tracking system can be either current control or voltage control. In this paper, the MPPT control system is designed with voltage control, which also suits the current control. As the converter and DC-DC driver are relatively grown up in electrical industry, the design of control algorithm in MPPT system is a main work. Several researches were done in this area to make the improvement. Optimizing the output power with unknown power map against the external disturbance and assigning the convergence speed are the major drawbacks even after the considerable progress in this field.
Fig. 1 System Configuration of PV System
III. PROPOSED MPPT CONTROLLER In this paper, we proposed an enhanced extremum seeking MPPT controller to overcome the drawbacks of the existing ES algorithm. This controller not only has the advantages over the conventional extremum seeking method, it also deals with assigning rate of convergence. A MPPT system repeatedly requires convergence of the controller to be assigned by designer. This can be achieved by using the proposed extremum seeking algorithm. Once the power map is known, to find the maximum MPP, the following proposed algorithm can be used
(1)
If the power is unknown, at that time estimator is required to approximate the df(x)/dx and df 2 (x)/dx2. The purpose of the proposed design controller is to estimate the first and second order power map derivatives to achieve the MPPT. Let the estimation of first order and the second derivative is denoted as Γ. The first and second order
derivative of f is estimated by and respectively. When is close to 0,
deriving Γ = 1/H is normally difficult. In which the signal generator output are and . In this method, output power is computed after measuring the output voltage and output current. Based on the product of stochastic signals and output power, the power map first order derivative and second order derivatives are estimated. It will go the next level, if the criteria are satisfied. Else update the output power by regulating the output voltage and duty cycle, and go to the next iteration as shown in Fig 2. Tracking efficiency, effect of PV module ageing and effects of partial shading are the major issues to be considered in MPPT controller.
Fig 2 Flow chart of enhanced extremum seeking MPPT method
A. Tracking Efficiency In many commercial applications, tracking efficiency of
Recent Advances on Energy, Environment, Ecosystems, and Development
ISBN: 978-1-61804-291-0 56

the MPPT method has been the most important consideration. With the help of the following equation (2), the tracking efficiency of MPPT controller can be calculated. In which, is the calculated power produced by the photovoltaic array under MPPT algorithm and is the maximum power that the PV array can produce.
(2)
The tracking efficiency discrete definition can be as denoted as in equation (3), in which n represent the number of channels.
(3)
The MPPT overall performance is evaluated by the tracking efficiency.
B. Partial Shading Effect The rapid development of photovoltaic integrated in buildings, the partial shading effect has turned much attention in the MPPT controller. As the photovoltaic array is installed on rooftop, due to clouds and space limitation it suffers from partial shading. When subjected to partial shading, the photovoltaic system often exhibit severe local and global extremums. So in spite of tracking power map global MPP, the MPPT algorithm is supposed to have a global convergence. The controller which is locally stable at MPP implies that it will get trapped in local extremums and for photovoltaic systems under partial shading it might not be a good choice.
C. PV Module Ageing Effect Lifetime and reliability of photovoltaic modules are the main factors in PV system performance and are dominated mainly by the effect of PV module ageing. To separate the effect of ageing from the temperature and irradiance, it is essential to evaluate the performance at the beginning. The deviation between these explains the PV system ageing. The proposed MPPT algorithm won’t call for model information and with real time measurements it optimizes the power map. Thus the proposed PV module can deal the effect of ageing well.
IV. RESULT AND PERFORMANCE EVALUATION The effectiveness of the proposed algorithm is proved by its results obtained. The light source driven photovoltaic maximum power point tracking system is adopted, to evaluate the performance of the proposed tracking MPPT algorithm under undesired irradiance. The PV panel converts solar energy into electrical energy through photovoltaic effect. The DC-DC converter and its output voltage regulation are driven by MPPT controller. The result and
performance of the proposed algorithm is evaluated under uniform and non-uniform irradiance respectively.
A. Tracking performance under uniform Irradiance The tracking performance of the proposed controller under uniform irradiance is considered in this section. The simulations of the enhanced extremum seeking control algorithm were carried out in MATLAB/ Simulink. The proposed algorithm parameters are a=0.1, k=1, h=0.08, q=40 (write in eq). Fig 3 shows the results of the proposed MPPT controller under uniform irradiance. In the direction of maximum power point the output power is oscillated, which is perceived by the product of perturbation and power. It is to be noticed that within 5 sec, the output converges to the maximum power point. In the steady state, the output power is 46.1 W, while 47.7W is the maximum power of photovoltaic module. The tracking efficiency of the simulated enhanced extremum seeking algorithm is about 96.6%.
Fig 3. Proposed MPPT controller under uniform irradiance The tracking performance of the proposed and the existing MPPT methods were compared in terms of convergence time and tracking performance. In the existing ES MPPT method, only 92% of efficiency is achieved and its convergence is more than 6s. But in the enhanced extremum seeking MPPT method 96% of efficiency can be achieved and its convergence is less than 4s.
B. Tracking performance under Non-uniform Irradiance In this section, under non-uniform irradiance the tracking performance of the proposed algorithm with abrupt changes is considered. In order to demonstrate the effectiveness of the proposed MPPT system more instinctively, the statistical comparison between the existing extremum seeking and the proposed extremum seeking algorithm is shown in Fig 4
Recent Advances on Energy, Environment, Ecosystems, and Development
ISBN: 978-1-61804-291-0 57

and Fig 5. From the result obtained, it is clear that both the convergence rate and tracking efficiency is more effective in the proposed MPPT algorithm.
Fig.4. Tracking Efficiency
Fig.5. Convergence Time
V. CONCLUSION Extremum seeking is a promising technique in extracting maximum power point from photovoltaic module. In this paper, we proposed an enhanced extremum seeking MPPT for PV system. The proposed algorithm won’t call for power map knowledge, and it has an advantage of good tolerance of convergence rate and stochastic fluctuations. The convergence and stability of the enhanced extremum seeking MPPT algorithm is proved rigorously. The application related topics like PV module ageing and effect of partial shading are also discussed. The result provided for tracking efficiency and convergence time of the proposed MPPT algorithm proves its effectiveness.
ACKNOWLEDGMENT This paper has been elaborated in the framework of the
project New creative teams in priorities of scientific research, reg. no. CZ.1.07/2.3.00/30.0055 supported by Operational Programme Education for Competitiveness and co-financed by the European Social Fund and the state budget of the Czech Republic.
REFERENCES
[1] S. Mekhilef, R. Saidur, A. Safari, “A review on solar energy use in industries”, Renewable and Sustainable Energy Reviews”, Volume 15, Issue 4, 2011, pp- 1777-1790.
[2] E. F. Camacho, M. Berenguel, F. R. Rubio, and D. Martinez, “Control of Solar Energy Systems”, Springer, 2012.
[3] A.Senthil Kumar, Josiah L Munda, Optimization of Voltage and Frequency Regulation in an Isolated Wind-Driven Six-Phase Self-Excited Induction Generator, Journal of the Energy Institute, Volume 87, issue 3,pp. 235–245, 2014
[4] V. Salas, E. Olías, A. Barrado, A. Lázaro, “Review of the maximum power point tracking algorithms for stand-alone photovoltaic systems”, Solar Energy Materials and Solar Cells, Volume 90, Issue 11, 2006, pp-1555-1578.
[5] Esram, T.; Chapman, P.L., "Comparison of Photovoltaic Array Maximum Power Point Tracking Techniques,"Energy Conversion, IEEE Transactions on , vol.22, no.2, pp.439,449, June 2007
[6] Hussein, K.H.; Muta, I.; Hoshino, T.; Osakada, M., "Maximum photovoltaic power tracking: an algorithm for rapidly changing atmospheric conditions," Generation, Transmission and Distribution, IEE Proceedings- , vol.142, no.1, pp.59,64, 1995.
[7] Liu, Y., Li, M., Ji, X., Luo, X., Wang, M., & Zhang, Y. (2014). “A comparative study of the maximum power point tracking methods for PV systems”. Energy Conversion and Management..
[8] T. Kawamura, K. Harada, Y. Ishihara, T. Todaka, T. Oshiro, H. Nakamura, M. Imataki, “Analysis of MPPT characteristics in photovoltaic power system”, Solar Energy Materials and Solar Cells, Volume 47, Issues 1–4, 1997, pp.155-165.
[9] Chihchiang Hua; Jongrong Lin; Chihming Shen, "Implementation of a DSP-controlled photovoltaic system with peak power tracking," Industrial Electronics, IEEE Transactions on , vol.45, no.1, pp.99,107, 1998.
[10] R. Leyva, C. Alonso, I. Queinnec, A. Cid-Pastor, D. Lagrange, and L. Mart´ınez-Salamero, “MPPT of photovoltaic systems using extremum—seeking control,” IEEE Transactions on Aerospace and Electronic Systems, vol. 42, no. 1, pp. 249–258, 2006.
[11] Brunton, S.L.; Rowley, C.W.; Kulkarni, S.R.; Clarkson, C., "Maximum Power Point Tracking for Photovoltaic Optimization Using Ripple-Based Extremum Seeking Control," Power Electronics, IEEE Transactions on , vol.25, no.10, pp.2531,2540, 2010.
[12] Her-Terng Yau and Chen-Han Wu, “Comparison of extremum-seeking control techniques for maximum power point tracking in photovoltaic systems”, Energies, vol. 4, , pp. 2180– 2195, 2011.
[13] A. Ghaffari,M. Krsti´c, and S. Seshagiri, “Extremum seeking for wind and solar energy applications,” ASME Dynamic Systems & Control Magazine, pp. 13–21, 2014.
[14] Denis Dochain, Michel Perrier, Martin Guay, “Extremum seeking control and its application to process and reaction systems: A survey”, Mathematics and Computers in Simulation, Volume 82, Issue 3, 2011, pp- 369-380.
[15] Shu-Jun Liu, Miroslav Krstic, “Stochastic averaging in continuous time and its applications to extremumseeking”, IEEE Transactions on Automatic Control, vol. 55, no. 10, pp. 2235– 2250, 2010.
Recent Advances on Energy, Environment, Ecosystems, and Development
ISBN: 978-1-61804-291-0 58

Abstract— Many Universities in Thailand have traffic problems
such as Chiang Mai University (CMU) is currently facing many transportation-related problems. Due to its limited resources, the most cost-effective and potential solution to such problems is to apply the Travel Demand Management (TDM) concept. The goal of TDM is to manage travel demand over space and time. Both incentive (pull) and preventive (push) strategies are proposed. This research applies the Multi-Source and Multi-Criteria Assessment approach in selecting TDM measures. This approach ensures that the opinions and feedback from members of the CMU community are included in planning. The results found that the provision of communication technology is the most favorable measure, followed by the land-use measures and the restriction measures. They also showed that the ranking of TDM measures is affected by the identification of TDM’s effectiveness. TDM with pull measures are preferred when no information is provided. However, TDM with push measures are accepted after identifying their effectiveness. The study also showed that the suitable TDM measures for CMU are pull measures together with push measures.
Keywords—travel demand management; Chiang Mai University; multi-source assessment
I. INTRODUCTION any Universities in Thailand have traffic problems as Chiang Mai University (CMU), a main university in
Northern region of Thailand, is currently facing a myriad of transportation-related problems; these include traffic congestion, inefficient public transport services, and inadequate parking spaces(Fig.1). One promising solution to such problems is to apply the concept of Travel Demand Management (TDM). TDM has been proved as one of the most successful solutions for such problems in university campuses [1][2].
Pichayapan P. is Lecturer at Department of Civil Engineering, Chiang Mai
University, Thailand and Head of Excellence Center in Infrastructure Technology and Transportation Engineering, Chiang Mai University, Thailand (phone: +66 -5394-4156, e-mail: [email protected]).
Nanthavisit P. is researcher at Excellence Center in Infrastructure Technology and Transportation Engineering, Chiang Mai University, Thailand (e-mail: [email protected]).
Kronprasert N. is Lecturer at Department of Civil Engineering, Chiang Mai University, Thailand and Excellence Center in Infrastructure Technology and Transportation Engineering, Chiang Mai University, Thailand (e-mail: [email protected]).
Fig.1 Large parking demand due to inadequate parking spaces in
Chiang Mai University
Lessons learned from other countries showed the success of TDM measures in university campuses. For instance, the University of Cape Town in South Africa provides bus services, operated by a private company, for students and university staff. The purpose of the service is to reduce the automobile uses. [1] Colleges and universities in British Columbia, Canada implements a wide variety of TDM measures, such as carpooling, parking charges (hourly, daily, monthly, and annually) [2]. The University of British Columbia itself introduces many TDM measures: providing public transport services, carpooling, promoting walking and cycling, integrating public transit systems by introducing U-Pass for transferring to city’s transit services. These countermeasures help decrease the use of automobile. [3]
Furthermore, many universities in Thailand have proposed TDM measures to address traffic problems and introduced different modes of travel. For example, Mahidol University in Nakhorn Pathom has converted the existing roadways to walkways and bikeways and promoted the bicycle uses. [4] Kasetsart University (Bangkaen campus) has specified several TDM solutions, such as parking restriction and promoting public transit services, cycling and walking. [5] King Mongkut’s University of Technology Thonburi has conducted the sustainable KMUTT project, which limits the automobile use, promotes carpooling, cycling, and walking. [6]
Chiang Mai University has recently designated several
Evaluation of Travel Demand Management Using Multi-Source and Multi-Criteria Assessment : Chiang Mai University
Preda Pichayapan, Patcharapan Nanthavisit, and Nopadon Kronprasert
M
Recent Advances on Energy, Environment, Ecosystems, and Development
ISBN: 978-1-61804-291-0 59

actions to control travel demand. The TDM measures include alternate public transit services, restricted vehicles entering the university, providing bikeways and walkways throughout the campus. However, they were ineffective to alleviate traffic problems within the university. [7] In each day, more than 50,000 private vehicles are entering the university.
According to the literature reviews about travel demand management in domestic and international universities, it is found that TDM measures used in Thailand are mostly related to the provision of infrastructures for alternative travel mode such as bicycling and walking facilities. On the contrary, TDM measures in international universities are varied based on their resources and policies of the university. Specifically, the foreign universities mainly pinpoint both the provision of infrastructures (such as public transit systems, walking and bicycling system) and vehicle restriction (such as parking charge, no vehicle park, etc.)
This study is motivated by the need of the suitable Travel Demand Management (TDM) measures for Chiang Mai University. The study applies the multi-source and multi-criteria assessment approach, which considers the evaluation process from both bottom-up and top-down perspectives. The purpose of the study is to find the TDM measures that accepted by all concerned stakeholders.
II. TRAVEL DEMAND MANAGEMENT There are numerous approaches to solve traffic problems,
such as Travel Supply Management, Travel Demand Management, and Traffic Control Management, etc. This study uses the concept of travel demand management measures, which are the strategies to reduce the demand of private vehicles by changing their mode of travel to others, such as bicycles, pedestrians, and public transit.
The TDM strategies can be categorized into two groups, which are coercive and non-coercive measures. Coercive measures or called “Push measures” are the measures that restrict the benefits and priority of automobile; for example, charging entry fee, downtown pricing, congestion pricing, or parking fee, to limit the private vehicles. Non-coercive measures or called “Pull measures” are the measures that attract the alternate environment-friendly travel modes, such as improving the quality of public transit service, developing walking and bicycling facilities, subsidizing the public transit service, etc.
The TDM measures can be classified based on TDM Guide for Planners proposed by Washington State Department of Transport [8] [9], into six groups.
• M1: Alternative Mode Support Strategies. These
measures support the public transit services, bicycling, and walking; and thus, reducing private vehicles.
• M2: Worksite-based Strategies. These measures are mostly applied to private sectors. They encourage commuters to change their mode and time of travel.
These TDM measures, usually supported by government policies, include changing the transit schedules in order for support commuters; and as a result, reduce the number of automobile trips.
• M3: Land Use Strategies. These measures are very potential and effective for long-term plans. They are related to the changes of land-use, which would affect travel demand and travel patterns in a long-term period; for example, providing campus dormitories and apartments, the change of road geometry to promote non-motorized transport, traffic calming, etc.
• M4: Programmatic and Policy Support Strategies. These measures create restrictions and specifications for automobile uses, such as prohibition of entering private vehicles, no provision of parking space.
• M5: Telecommunications Strategies. These measures manage travel demand by applying advanced telecommunicating technologies. They would minimize the commuting trips, such as teleworking (working from home), using webinars and video conferences.
• M6: Pricing Strategies. These measures include collecting additional taxes or fees related to transportation. They would discourage the travel demand in some modes of travel (e.g. private cars) while encourage in some other modes of travel (e.g. carpool, public transit).
E.D. Arnold, Jr. (1996) and DKS Associates (2005) studied about TDM’s effectiveness for each of the TDM group. Each TDM category has its own characteristics and is effective to reduce or alter travel demand in general and during peak hours. The effectiveness of TDM in each group is shown in Table 1. [10] [11]
Table 1: TDM’s Effectiveness TDM Measures % Trips
Reduced Trips
Reduced (Peak hour)
M1: Alternative Mode Support Strategies
1-11% low–medium
M2: Worksite-Based Strategies 0-36% high M3: Land Use Strategies 0-20% low M4: Programmatic and Policy Support Strategies
80-100% high
M5: Telecommunications Strategies 14-91% high M6: Pricing Strategies 10-40% low–medium
M1, M2, M3, and M5 are all non-coercive measures, while M5 is more effective than the others. On the other hand, M4 and M6 are coercive measures. These can reduce travel demand in a higher level or more effective than non-coercive measures.
III. PROPOSED CONCEPT AND METHODOLOGY The concept of multi-source and multi-criteria assessment is
used in this study. The multi-source and multi-criteria assessment is defined as the assessment that comes from all members in the organization including direct evaluation from
Recent Advances on Energy, Environment, Ecosystems, and Development
ISBN: 978-1-61804-291-0 60

employees, colleagues, subordinates, and supervisors. The multi-source and multi-criteria assessment is subject to all interested stakeholders. It strengthens the limitations of both bottom-up (upward) and top-down (downward) assessment approaches. It is also widely believed that the use of Multi-Source assessment would provide more credible evidence and information. It is used for evaluating groups of strategies or policies.
In general, the Multi-Source and Multi-Criteria assessment method is used to appraise personnel by the evaluators from different levels; for example, the evaluation of warehouse staff to encourage the warehouse services [12] and the evaluation of the innovation in school to compare their pros and cons. [13] The Multi-Source assessment approach therefore expands the perception of evaluators for evaluating TDM measures in all perspectives.
Each sector of the interested groups in the Multi-Source assessment has different levels of significance in planning process, although all stakeholders are involved. This study uses weights as a representation of significance level. They are determined by Analytical Hierarchy Process (AHP) method, a multi-criteria assessment.
The AHP method is a systematic procedure for presenting the elements in the system hierarchically. It breaks down the system into its smaller categories and asks for the relative strength of impact (or importance) of the elements in the hierarchy through a series of pairwise comparison (of which element has higher importance). It is successful in handling the system that has both quantifiable and non-quantifiable attributes. AHP is commonly used in multi-criteria decision-making method to prioritize the alternatives or scenarios in decision or selection problems.
This study was done by interviewing all related stakeholders: students, staff, visitors, and Chiang Mai University boards. Two questionnaire surveys were conducted for evaluating the acceptance of TDM measures and their effectiveness. To select the TDM measures, the study applied the Multi-Source assessment approach and used the AHP method to determine the importance of factors that affect the travel demand and the importance associated with stakeholders.
This study applied the Multi-Source assessment procedure to examine the suitable Travel Demand Management (TDM) measures for Chiang Mai University among the six proposed TDM alternatives (M1-M6) based on three factors affecting travel demand and TDM measures: travel cost, travel time, and travel convenience. Fig.2 shows the structure of the evaluation process. Using the AHP method, the overall performance of each TDM can be calculated as:
( )∑∑ ××=i j jiji wwPTDM ,360 (1)
where TDM360 = the overall performance of TDM based on Multi-Source assessment;
Pi,j = the performance score of each factor i assigned by sample group j;
wi = the relative weight of each factor i;
wj = the relative weight for each sample group j; In this study, the questionnaire surveys were conducted for
584 samples from four stakeholders including 380 students (from 20 departments, 1 college, and 1 graduate school), 100 staff, 4 CMU boards, and 100 visitors. The sample size of each group is about 5.0% of the CMU population.
IV. RESULTS AND DISCUSSIONS The study analyzed the results in three parts: the priority of
TDM measures, the effect of Multi-Source assessment, and the effect of information given to interviewers on assessment results.
Fig.2 Structure of the Assessment Process using AHP method
A. Priority of TDM Measures Using the AHP method, the analytical results are the weight
values associated with the factors affecting the travel demand (wi) and those associated with the target groups (wj) assigned by each sample group (stakeholder). The weight values are summarized in Table 2.
Table 2: Weight values associated with factors and sample groups
assigned by different stakeholders
Group Weights assigned by different
stakeholders Average weight
Students Staff Visitor Board Factors affecting travel demand (wi) Travel Time 0.424 0.408 0.478 0.681 0.498 Travel Cost 0.273 0.395 0.313 0.123 0.276 Travel Convenience 0.303 0.197 0.210 0.197 0.227
Total 1.000 1.000 1.000 1.000 1.000 Sample groups (wj) Student 0.403 0.308 0.336 0.404 0.363 CMU Board 0.231 0.232 0.258 0.267 0.247 Staff 0.225 0.247 0.216 0.269 0.239 Visitors 0.141 0.213 0.191 0.060 0.151
Total 1.000 1.000 1.000 1.000 1.000 The weight values in Table 2 show that among factors
affecting the travel demand, the travel time is the most important factor, followed by travel cost and travel convenience, respectively. Among four target groups, the student is the most significant group, followed by the CMU board, staff, and visitors. (Table 2)
Based on these weight values, the overall performance of each TDM measure can be determined using Eq. (1). The
Recent Advances on Energy, Environment, Ecosystems, and Development
ISBN: 978-1-61804-291-0 61

overall performances of M1-M6 TDM measures are 4.34, 3.79, 4.09, 3.22, 3.80, and 3.82, respectively. It implies that the most preferable TDM measures are the provision of alternate modes (M1) and the change of land use patterns to promote alternate travel modes (M3). However, the least preferable TDM measures are the restriction policy strategies (M4), such as the limitation of automobile use.
B. Sensitivity Analysis Although the analytical results show that the student group
is the most important group in planning process, in reality, the administrative board is the decision making group that specifies the strategies and policies. To examine the credibility of the assessment, the sensitivity analysis of the weight values associated with the target groups is conducted. This analysis ensures the fairness and reasonableness of the judgment. The study performs the sensitivity analysis in five case scenarios.
• Case 1: Specify equal weight for all stakeholders (25% each)
• Case 2: Increase the weight values for the administrative board group by 10% and relatively decrease the weight values for other groups
• Case 3: Increase the weight values for the administrative board group by 20% and relatively decrease the weight values for other groups
• Case 4: Increase the weight values for the student group by 10% and relatively decrease the weight values for other groups
• Case 5: Increase the weight values for the student group by 20% and relatively decrease the weight
values for other groups
Table 3: Comparison of overall performance for different of weights associated with target groups
TDM Measures
Overall performance score by Cases (TDM360) Case 0 Case 1 Case 2 Case 3 Case 4 Case 5
M1 4.34 4.36 4.34 4.32 4.36 4.36 M2 3.79 3.81 3.80 3.79 3.81 3.80 M3 4.09 4.11 4.10 4.09 4.11 4.10 M4 3.22 3.26 3.26 3.26 3.23 3.20 M5 3.80 3.80 3.77 3.74 3.83 3.87 M6 3.82 3.82 3.84 3.85 3.81 3.81 Table 3 compares the overall performances of TDM
measures with respect to five cases of sensitivity analysis. Case 0 is the base case; the weight values are determined by four stakeholders. The comparison shows that there is no significant difference in the variation of weights; M1 measures are the most preferable, followed by M3 measures.
C. Effect of Awareness of TDM Measures The study considered the information about TDM as a key
parameter that could affect the judgment of the target groups. The study conducted the evaluation process before and after the information is given to the interviewers. The study carried out the evaluation in two stages: (i) when the effectiveness information of TDM is not presented to the interviewers (Before); and (ii) when the TDM’s effectiveness is given (After). Then, the effect of TDM information on the overall performances of TDM measures are compare as shown in Fig.3
Fig.3 Structure of Before-and-After Assessment for TDM Measure
Table 4: Overall performance based on Multi-Source assessment
Stakeholder TDM Measures
M1 M2 M3 M4 M5 M6 Before (information about TDM effectiveness is not given)
Student 4.26 3.68 3.94 2.93 3.86 3.68 Staff 4.47 3.95 4.39 3.61 4.04 4.24
Recent Advances on Energy, Environment, Ecosystems, and Development
ISBN: 978-1-61804-291-0 62

Visitors 4.44 3.88 4.11 3.26 3.79 3.62 Board 4.25 3.75 4.00 3.25 3.50 3.75
Overall 4.34 3.79 4.09 3.22 3.80 3.82 After (information about TDM effectiveness is given)
Student 3.31* 3.39* 3.44* 3.17* 3.65* 2.94* Staff 3.32* 3.14* 3.41* 3.11* 3.80 2.86*
Visitors 3.59* 3.53* 3.52* 3.46 4.01 3.24* Board 3.52 3.53 3.83 4.04 4.29 3.17
Overall 3.41* 3.38* 3.53* 3.43* 3.90 3.02* * Difference in before-after test with 5% significance level.
Using the Multi-Source and Multi-Criteria assessment
concept, the overall performance of TDM measures assigned by each stakeholder were calculated. Table 4 presents the overall performance of TDM measures assigned by each stakeholder before and after the information about TDM’s effectiveness is given.
When the information about TDM effectiveness is not provided, there is general agreement among four stakeholders. All stakeholders agree that M1 measure (alternate mode strategy) is the most preferable TDM measure for CMU community, followed by M3 measure (land use strategy). Moreover, M4 measure (restriction strategy) is the least preferable among all stakeholders. In other words, all stakeholders prefer typical pull measures, such as alternate modes and land use changes, to push measures.
On the other hand, when the information about TDM effectiveness is provided and explained to each stakeholder, there is no consensus on recommended TDM measures. Student and staff groups have positive opinion on TDM measures that change travel behavior, such as alternative modes and change of land use patterns, while administrative board and visitor groups favor TDM measures that reduce number of trips, such as telecommunication strategies and restriction policies. However, it can be noticed that the most preferable TDM measures are worksite-based strategies (M5), land use strategies (M3), and programmatic and policy support strategies (M4), respectively; and the least preferable TDM measures are pricing strategies (M6).
Based on the Multi-Source assessment concept, a radar chart is used to plot and compare the overall performance of each TDM measure. Fig.3 shows the radar charts displaying the overall performance of M1 through M6 measures assigned by four stakeholders. Each chart presents the overall performance before (dotted line) and after (solid line) the information about TDM effectiveness is provided to the sample groups.
M1 and M6 measures tend to reduce trips in a low level. The information about their effectiveness cause the overall performances for “after” case less than those of “before” case as shown in Fig. 4(a) and Fig. 4(f). This is different form M4 and M5 measures, which tend to reduce trips in a high level. The information about the effectiveness of these TDM measures make the overall performances for “after” case greater than those of “before” case as shown in Fig. 4(d) and Fig. 4(e).
(a) M1 measure (b) M2 measure
(c) M3 measure (d) M4 measure
(e) M5 measure (f) M6 measure Fig.4 Comparison of TDM performance between before and after
cases
V. CONCLUSIONS Chiang Mai University (CMU) is currently facing many
transportation-related problems. Due to its limited resources, the most cost-effective and potential solution to such problems is to apply the Travel Demand Management (TDM) concept and Multi-source Assessment approach in selecting TDM measures.
The analytical results found a factor affecting the travel demand, the travel time is the most important factor. Among stakeholders groups, the student is the most significant group. Then, this research found the overall performances of TDM measures (before) shown the most preferable TDM measures
Recent Advances on Energy, Environment, Ecosystems, and Development
ISBN: 978-1-61804-291-0 63

are the provision of alternate modes (M1). However, the least preferable TDM measures are the restriction policy strategies (M4), such as the limitation of automobile use.
In addition, this research found the effect of information about TDM effectiveness given to the sample groups on the overall performance of TDM measures. The awareness of TDM measures tends to reduce the overall performance of all TDM measures. They also showed that the ranking of TDM measures is affected by the identification of TDM’s effectiveness. TDM with pull measures are generally preferred when no information is provided. However, TDM with push measures are accepted after identifying their effectiveness. The suitable TDM measures for CMU are pull measures together with push measures.
The results of this paper, the recommended TDM measures, are used as a catalyst of the future traffic demand management plan in CMU campus. Currently, CMU campus is moving forward for the Green and Clean University in Fig. 5. The campus is planned to have green zone and ring road. The goal is to promote for pedestrians, bicyclists, and public transport users, while restrict automobile uses by providing parking areas at the entrances of university.
Fig.5 Planned Traffic Management in Chiang Mai University
REFERENCES [1] Duff-Riddell, W.R., Robertson, E.J. and Dewet, G. (2006). The UCT
Student and Staff Transport System: A Case Study, Proceedings of the 25th Southern Africa Transportation Conference (SATC2006), pp.109-120.
[2] Craig, S. (2009). A Survey of Transportation Demand Management at Colleges and Universities in British Columbia. Available on: http://camosun.ca/documents/about/ transportation/university-college-survey.pdf. Accessed on August 15, 2012.
[3] The University of British Columbia. (2012). Transportation Planning at UBC. Available on http://transportation.ubc.ca/ Accessed on September 15, 2012.
[4] Mahidol University (2012), Master Plan of Mahidol University [in Thai] Available on: http://www.op.mahidol.ac.th/oppe/ masterplan.html#sheet10 Accessed on December 10, 2012
[5] Kasetsart University (2012). KU Green Campus [in Thai] Available on: http://kulc.lib.ku.ac.th/KUgreenCampus/ index.php/th/ Accessed on December 10, 2012
[6] King Mongkut’s University of Technology Thonburi (2012). Sustainability at KMUTT [in Thai] Available on: http://sustainable.kmutt.ac.th, Accessed onDecember 10, 2012.
[7] Suda, O. (2003). Efficiency of Electric Public Transport System in Chiang Mai University for Alleviating Traffic and Pollution Problems, Independent Study [in Thai], Graduate School, Chiang Mai University.
[8] SiriSrisakulchai, J. (2008). Impacts on Travel Supply Management using Mixed-Logit: A Case Study of Charging and Access Control in Chiang Mai City, Master Thesis [in Thai], Chiang Mai University.
[9] McBryan, B., Shadoff, J., Pike, D., Loseff, D., (2000). TDM guide for planners: Including transportation demand management strategies in the planning process. Washington State Department of Transportation.
[10] DKS Associates Transportation Solutions. (2005). Citywide Transportation Plan prepare for City of Richland: Chapter10 Transportation Demand Management. Final report, Richland Transportation Plan.
[11] E.D. Arnold, Jr. (1996). Effectiveness of transportation Control measures: An overview of the state Of the practice. Technical Assistance report, Virginia Transportation Research Council.
[12] Maneesarn, J. (2009). Development of Service for Warehousing Staff Using 360 Degree Assessment: A Case Study of Thai Beverage [in Thai], King Mongkut’s University of Technology North Bangkok.
[13] Kumnuan, T. (2009). Evaluation of Innovation in School Promotion Project Using 360 Degree Assessment. Ubon Ratchathani Education Section 1, Master Thesis [in Thai], Mahasarakham University.
Recent Advances on Energy, Environment, Ecosystems, and Development
ISBN: 978-1-61804-291-0 64

Abstract— The objectives of this study are to study tourism
behaviors of Chinese tourists and expectation of Chinese tourists towards tourism management in Bangkok. The research methodology was a quantitative research The sample of this research was 400 Chinese tourists in Bangkok chosen by the accidental sampling and the purposive sampling. Inferential Statistics Analysis by using T-test statistics to analyze means differences between 2 groups of population and F-test statistics to analyze One-Way ANOVA. As for the results of this study the researcher found that Chinese tourists had expectation towards tourism management in Bangkok in term of tourism products in Bangkok at the high level with a mean of 4.00, price at the high level with a mean of 3.86, distribution channels/access to customers at the high level with a mean of 3.73 and term of promotion at the high level with a mean of 3.88
Keywords— tourists’ behavior, tourists’ expectation , Chinese tourists.
I. INTRODUCTION ANGKOK is a civilized capital where many tourists want to visit. Also, it is the most populous city of Thailand and
has the longest name in the world, with a total area of 1,568.737 square kilometres and a population of over 5 million. That makes Bangkok become the primate city because the population in this city is 40 times of the most second populous city. Besides, Bangkok is ranked the most twelfth skyscrapers of the world and has many tourist attractions, for example, Grand Palace, Vimanmek Palace, and temples. Apart from this, there are a lot of important shopping places to attract foreign tourists. In 2012, the United Nations World Tourism Organization (UNWTO) ranked Bangkok number 10 of the world and number 2 of Asia for the most arrival city with more than 26.5 million tourists[1].
According to the Tourist Statistics, the top 10 international tourist arrivals to Thailand (by nationality) in April 2014 were China, Malaysia, Russia, Laos, the United Kingdom, Australia, Korea, India and Germany, respectively[2]. and in July 2014, there were 342,547Chinese tourists arriving Thailand[3], which is always a largest number visiting Thailand. The reasons that Chinese tourists choose to visit Thailand because of tourist attractions differing from China, for example,
S.Chetanont is with Faculty of Humanities and Social Sciences, Suan
Sunandha Rajabhat University, 1 U-tong Nok Road, Dusit District, Bangkok, 10300, Thailand (phone: +6689200-6114; e-mail: [email protected], [email protected]).
historical attractions, cultural attractions, natural attractions, cozy atmosphere, breath of air, sunlight and watercourse, as well as nightlife entertainment that are rarely found in their country. These makes them feel worthy. Besides travelling, they can go shopping, buy sacred objects, eat seafood or rare health food, such as, bird’s nest and wild animals, all of which are inexpensive when comparing to in China.
Thai government tries to promote and build tourism image to every group of tourists. However, internal instability and various issues occurring with the tourists, i.e., tourist deception, zero dollar tour, culture shock of the local occasionally lead to a decreasing number of the tourists and result in some reactions among the local towards the tourists. As a result, the tourists probably feel dissatisfied and refuse to visit Thailand again. We cannot reject the tourists because they create a large amount of income and career opportunities [4]. Therefore, the researcher was interested in studying behaviors and expectation of Chinese tourists towards tourism management in Bangkok.
II. MATERIALS AND METHODS
A. Objective of Research The objective of this research is to study tourism behaviors
of Chinese tourists and expectation of Chinese tourists towards tourism management in Bangkok.
B. Research Methodology The study on behaviors and expectation of Chinese tourists towards tourism management in Bangkok was a quantitative research by studying and collecting data from document research and survey research. This research mainly aimed to find the solutions to the problem of tourism behaviors of Chinese tourists. In collecting data, the researcher divided the study into 2 parts: Part 1 was the document research or the secondary research concerning arrival of Chinese tourists, behaviors of Chinese tourists in Thailand, information on expectation’s concept and theories, research related with Chinese tourists, behaviors and expectation towards tourism management in Bangkok; Part 2 was the survey research in collecting data on tourism behaviors and expectation towards tourism management in Bangkok by distributing the questionnaires to Chinese tourists.
Behaviors and Expectation of Chinese Tourists towards Tourism Management in Bangkok
Sasitorn Chetanont
B
Recent Advances on Energy, Environment, Ecosystems, and Development
ISBN: 978-1-61804-291-0 65

The questionnaire was used as the research instrument, divided into 3 parts: Part 1: Personal, social, and cultural information, Part 2: Questions on behaviors of Chinese tourists in Bangkok, and Part 3: Expectation of Chinese tourists towards tourism management in Bangkok. The sample of this research was 400 Chinese tourists in Bangkok by using Taro Yamane’s formula[5] with the reliability of 95% and at the significant level of 0.05. The sample group was chosen by the accidental sampling and the purposive sampling. After verifying the data collected from the questionnaire and completion, the researcher analyzed the data by computerized data processing. The statistical package was used in calculating the statistical values and testing the established hypotheses with the reliability of 95% and at the significant level of 0.05. The statistics used in analyzing the data were as follows : I. Descriptive Statistics Analysis was used in describing the data by frequency, showing data in the form of table by percentage to explain personal, social and cultural information, i.e., gender, age, place of residence, educational level, occupation, income, family, and main objectives of tourism. Standard deviation and means were used to described interval scale data. II. Inferential Statistics Analysis was used in comparing differences between personal, social and cultural information, i.e., gender, age, place of residence, educational level, occupation, income, family, and main objectives of tourism with behaviors of Chinese tourists in Bangkok and expectation of Chinese tourists towards tourism management in Bangkok by using T-test statistics to analyze means differences between 2 groups of population and F-test statistics to analyze One-Way ANOVA. When detecting differences, Scheffe’s method was used to perform multiple comparisons for statistical analysis.
III. FINDINGS In presenting results of data analysis and interpretation, the researcher analyzed and presented data in descriptive tables divided into 2 parts, that is, Part 1: Descriptive analysis
I. Basic information of the respondents, i.e., gender, age, marital status, educational level, current position, and average monthly income.
II. Behaviors of Chinese tourists in Bangkok, i.e., number of visiting, objectives of visiting, the person visiting with, travelling preparation, place of residence, frequent duration of visiting, length of visiting, using service at the information center, impressive attractions, souvenirs, average expenses during travelling and re-visiting Bangkok. III. Expectation of Chinese tourists towards tourism management in Bangkok, i.e., tourism products in Bangkok, price, distribution channels/access to customers and promotions. Part 2: Inferential analysis to test hypotheses Hypothesis 1: Basic information of the respondents, that is, gender, age, marital status, educational level, current position,
and average monthly income had effects to expectation of Chinese tourists towards tourism management in Bangkok. Hypothesis 2: Basic information of the respondents, that is, gender, age, marital status, educational level, current position, and average monthly income had relations to behaviors of Chinese tourists in Bangkok. I.Basic information of the respondents, i.e., gender, age, marital status, educational level, current position, and average monthly income was shown by frequency and percentage in Table I
TABLE I NUMBER AND PERCENTAGE OF BASIC INFORMATION OF THE RESPONDENTS
Basic Information Number Percentage Gender : Male Female
171 229
42.8 57.3
Age : Less than 15 years old 15-25 years old 26-36 years old 37-47 years old 48-58 years old More than 59
13 139 112 65 50 21
3.3 34.8 28.0 16.3 12.5 5.3
Marital Status : Single Married Divorce
157 226 17
39.3 56.5 4.3
Educational Level : Less than Secondary Secondary Bachelor’s degree Master’s degree More than Master’s degree
14 87 233 48 18
3.5 21.8 58.3 12.0 4.5
Current Position : Student Housewife Government Private Officer Agriculturist Retire Freelance Others
98 44 42 93 6 27 70 20
24.5 11.0 10.5 23.3 1.5 6.8 17.5 5.0
Average Monthly Income : Less than 3,000 yuan 3,001- 5,000 yuan 5,001-7,000 yuan 7,001-9,000 yuan 9,001-11,000 yuan More than 11,000 yuan
104 116 76 36 43 25
26.0 29.0 19.0 9.0 10.8 6.3
TOTAL 400 100 II.Behaviors of Chinese tourists in Bangkok, i.e., number of visiting, objectives of visiting, the person visiting with, travelling preparation, place of residence, frequent duration of visiting, length of visiting, using service at the information center, impressive attractions, souvenirs, average expenses during travelling and re-visiting Bangkok was shown by frequency and percentage in Table II
Recent Advances on Energy, Environment, Ecosystems, and Development
ISBN: 978-1-61804-291-0 66

TABLE II NUMBER AND PERCENTAGE OF BEHAVIORS OF CHINESE TOURISTS
IN BANGKOK
Tourists’ behaviors Number Percentage Number of visiting : once 2-4 times More than 5 times
260 119 21
65.0 29.8 5.3
Objectives of visiting : Relaxation Honeymoon Education Relatives Business
257 45 64 11 23
64.3 11.3 16.0 2.8 5.8
Person visiting with : Family Friends Lover alone
133 149 69 49
33.3 37.3 17.3 12.3
Travelling preparation : Finding tourism information on their own Buying Package Tour in China Buying Package Tour in Thai
221
172
7
55.5
43.0
1.8
Place of residence : Beijing Shanghai Shenzhen Guangzhou Chengdu Kunming Xiamen Guangxi Others
41 69 55 69 35 43 16 42 30
10.3 17.3 13.8 17.3 8.8
10.8 4.0
10.5 7.5
Frequent duration of visiting : December - February March - May June - August September - November
109 84 97
110
27.3 21.0 24.3 27.5
Length of visiting : 1-3 days 4-6 days 7-9 days More than 9 days
99
184 83 34
24.8 46.0 20.8 8.5
Using service at the information center : Everytimes Sometime Never
51 152 197
12.8 38.0 49.3
Impressive attractions : Wat Phra Kaew Wat Pho Khao San Road China Town Asiatique Central World Siam Square Amusement Park/Zoo Night Place Others
106 63 44 20 25 36 31 15 42 18
26.5 15.8 11.0 5.0 6.3 9.0 7.8 3.8
10.5 4.5
Average expenses during travelling : Less than 5,000 baht 5,001 - 20,000 baht 20,001 – 40,000 baht More than 40,001 baht
40 151 119 90
10.0 37.8 29.8 22.5
Re-visiting Bangkok : Certainly Uncertainly No come again
162 220 18
40.5 55.0 4.5
TOTAL 400 100
IV. RESULTS OF DATA ANALYSIS I. Basic information of the respondents Basic information of the respondents, that is, gender, age, marital status, educational level, current position, and average monthly income had effects to expectation of Chinese tourists towards tourism management in Bangkok in Table III
TABLE III INFERENTIAL ANALYSIS TO TEST HYPOTHESES BETWEEN BASIC INFORMATION
AND EXPECTATION OF CHINESE TOURISTS Basic information Expectation Level of Chinese Tourists
S.D. t/F Gender Male Female
3.88 3.86
0.61 0.51
0.379
Age 3.87 0.56 0.548 Marital Status 3.87 0.56 0.228 Educational Level 3.87 0.56 3.979 Current Position 3.87 0.56 0.214 Average Monthly Income
3.87 0.56 1.127
From Table III Results of Analysis compare between Expectation and Basic Information with t-test and One Way Analysis of Variance : One Way ANOVA is accept Null Hypothesis and decline Alternative Hypothesis that mean Chinese Tourists have gender, age, marital status, educational level, current position, and average monthly income different, have not different in Expectation.
II.Expectation of Chinese tourists towards tourism management in Bangkok, i.e., tourism products in Bangkok, price, distribution channels/access to customers and promotions was presented by means and standard deviations in Table IV
TABLE IV
MEANS AND STANDARD DEVIATION OF EXPECTATION OF CHINESE TOURISTS TOWARDS TOURISM MANAGEMENT IN BANGKOK
Expectation of Chinese tourists
Expectation Level S.D. Interpretation
Tourism products in Bangkok
Attractive capital that they would like to visit once
4.14 0.70 high
Historically and culturally beautiful tourist attractions
4.00 0.66 high
Safe nightlife entertainment
4.06 1.66 high
Souvenir shops found easily
4.15 2.08 high
Various activities for tourists to do, such as, spa, Thai
4.07 0.71 high
x
x
Recent Advances on Energy, Environment, Ecosystems, and Development
ISBN: 978-1-61804-291-0 67

traditional massage, and amusement park Clean and safe accommodations for tourists
4.02 0.71 high
Accommodations with fully equipped facilities
3.93 0.74 high
Hygienic food for consumers
3.95 0.74 high
Hot and spicy Thai food taste according to Thai style
3.89 0.76 high
Service providers having good behaviors and being honest to the tourists
3.92 2.09 high
Bangkokians having positive attitudes towards Chinese tourists
3.84 0.76 high
Bangkok having plans in systematically providing services to the tourists
4.02 2.61 high
Overall tourism products in Bangkok
4.00 0.59 high
Price Clear and accurate price tags
3.91 0.70 high
Informing price before providing services
3.81 0.74 high
Reasonable price of products and services
3.85 0.71 high
Overall price 3.86 0.59 high Distribution channels/Access to customers
Convenient and safe travelling in Bangkok
3.82 2.71 high
Clear, accurate and easily understandable guideposts
3.67 0.91 high
Sufficient tourist information staff
3.68 0.86 high
Service providers able to communicate with tourists understandably
3.75 0.85 high
Overall distribution channels/Access to customers
3.73 0.98 high
Promotion Arranging interesting tourism programs/package
3.87 0.77 high
s Continually holding activities in various kinds of festivals, such as, Songkran Festival, New Year Festival, Loy Krathong Festival and new activities for tourists
3.89 0.77 high
Overall promotion 3.88 0.70 high Overall expectation of the tourists
3.87 0.56 high
V. DISCUSSIONS AND SUGGESTIONS The research on expectation and behaviors of Chinese tourists towards tourism management in Bangkok could be discussed as follows:
1. The analysis on behaviors of Chinese tourists in Bangkok showed that most of them visited Bangkok for the first time with the objective of relaxation and travelling with friends. They prepared their travelling by searching information by themselves and their places of residence were Shanghai and Guangzhou. Time of duration they frequently travelled was between September and November for 4-6 days. Most of them never use the service at the tourist information center. The impressive attraction was Wat Phra Kaew. Mostly they bought bags, NaRaYa bags and crocodile leather bags as souvenirs. Average expenses were between 5,001 and 20,000 baht. Most of them were unusual whether they would visit Bangkok again. Export-Import Bank of Thailand (2013) [6] stated travelling with the tour group arranging the tour program was convenient readily provided accommodations and tour guides to facilitate in both languages and solving problems. The tourists who travelled to a foreign country for the first time chose to travel with the tour group. The tour group frequently brought the tourists to visit famous places, important attractions or popular attractions, followed by going shopping. Chinese tourists went shopping as the presents for their family, friends, and co-workers. The most popular luxury goods that well-off Chinese tourists bought were wrist watches and ornaments, followed by leatherwork, clothes, cosmetics and electronics appliances. Currently, more than 80% of Chinese tourists searched information on new destinations, accommodations and travelling from the internet, which was consistent with the research of Lei Jun (2010) [7] studying behaviors of Chinese tourists in Chiang Mai, Thailand. According to that research, Chinese tourists came from Shanghai, Guangdong, Beijing and Jiangsu, and more than half travelled with employees in the company and friends without using the service of the travel agency. On average, they travelled for 4 days for relaxation and sightseeing. Consistently, the research of Somying Thongprada (2010) studied on opinions and behaviors of 369 Thai tourists towards tourism in Ko Lan, Pattaya and found that they frequently travelled with at least two friends and more than half were impressed of beautiful scenery and wanted
Recent Advances on Energy, Environment, Ecosystems, and Development
ISBN: 978-1-61804-291-0 68

to visit Pattaya beach again. 2. The analysis on expectation of Chinese tourists towards tourism management in Bangkok found that overall tourism products in Bangkok, price, distribution channels/access to customers and promotions had expectation at the high level. According to Oxford Advanced Learner's Dictionary (2000), expectation was a strong belief about the way something should happen or how somebody should behave. Sukhothai Thammathirat Open University (1997:18) stated expectation of clients that when clients contacted with any organizations or service businesses, they always expect to receive any of services. The service providers needed to acknowledge and learn about basic expectation, and survey specific expectation of clients to satisfy their needs, which created satisfaction among the clients. Consistently, the research of Somying Thongprada (2010) [8] on opinions and behaviors of Thai tourists towards tourism in Ko Lan, Pattaya found that the tourist had opinion on overall tourism appropriateness at the moderate level and they thought tourism resources were more appropriate than tourism services. Consistently, the research of Bhubate Prapharat (2010) [9] on tourism behaviors and opinions of Thai tourists towards tourism management at Pattaya Beach found that opinions on tourism management at Pattaya Beach was at the moderate level and wanted to be managed on service most, followed by personnel and places, respectively. Cultural sensitivity could be both threat and opportunity that tourism industry should be consider, especially in the era of widely developed information technology. For example, Hong Kong began to face the problems when there were a lot of Chinese tourists visiting there. Tourism entrepreneurs need to understand very well about important roles of this industry which has long been history and has reliable service quality. According to the research of Hong Kong Polytechnic University, Yong Chen, the tourism researcher, described behaviors of Chinese tourists with 3 academic principles as follows: 1. Educational level stated that well-educated Chinese tourists would not be as rude as the lower-educated. This indicator showed that if Chinese tourists were from the middle age to the old age with lower education because China had to face with internal political issues. This probably led to them ruder than the new generation. 2. Disobedience and disregard of local customs or visiting places
3. Tourists did not obey laws nor follow rules and regulations of visiting places, lack of consciousness and tourism disciplines. Research Suggestions 1. The results showed that most of Chinese tourists visited Bangkok for the first time with the objective of relaxation and travelling with friends. They prepared their travelling by searching information by themselves and their places of residence were Shanghai and Guangzhou. Time of duration they frequently travelled was between September and November for 4-6 days. Most of them never use the service at the tourist information center. The impressive attraction was
Wat Phra Kaew. Mostly they bought NaRaYa bags and crocodile leather bags as souvenirs. Average expenses were between 5,001 and 20,000 baht. Most of them were unusual whether they would visit Bangkok again. Therefore, the related units should have plans in providing the training to tourism companies to acquire tourism knowledge that changes from time to time, i.e., preparing information of tourism, tourism
duration, souvenir shops and service training for staff.
2. The results found that overall tourism products in Bangkok, price, distribution channels/access to customers and promotions had expectation at the high level. Therefore the related units should have plans in creating positive attitudes of Bangkokians towards Chinese tourists, providing clear price tags, clear, accurate and easily understandable guideposts and encouraging the tourism companies to arrange interesting and innovative tourism programs/packages.
ACKNOWLEDGMENT This Study was possible due to the financial support from
the Research and Development Institute at Suan Sunandha Rajabhat University and much helps from our colleague.
REFERENCES [1] http://th.wikipedia.org/wiki retrieved on January 23, 2015. [2] Department of Tourism, Ministry of Tourism and Sports,
2014, Summary on Tourism Situation concerning In-bound Foreign Tourists as of April 2014
[3] http://www.m-ociety.go.th/article_attach/12133/16378.pdf retrieved on January 23, 2015
[4] Chantouch Wanatanom and teams. 2014. Elderly Behavior to Promote Healthy Tourism in Bangkok. Suan Sunandha Rajabhat University.
[6] Export-Import Bank of Thailand. (Jun 2013). Nature and Behavior of Chinese Tourist. retrieved on March 8, 2014. From http://www.exim.go.th.
[7] Lei Jun. 2010. Chinese Tourist Behaviors is to travel in Chieng Mai Province Thailand. Chieng Mai : Master of Art Thesis, Recreation and Tourism, Mae Jo University.
[8] Somying Thongprada. 2010. Opinion and Tourist Behaviors to the Coral Island area Pattaya. Chonburi : Master of Case Study Political, Burapa University.
[9] Bhubate Prapharat. 2010. Tourism Behaviors and Opinion of Tourist to Tourism Management on the Pattaya Beach. Bangkok : Independent Studies Master of Art, Krirk University.
Recent Advances on Energy, Environment, Ecosystems, and Development
ISBN: 978-1-61804-291-0 69
[5] Yamane,Taro. (1973).Statistic : Introductory Analysis. (2nd ed. New York : Harper and Row p.125.

Abstract—Theaim of this research is to study potential factors relating to the decision of return migration of Myanmar migrant workers in PrachuapKhiri Khan Province by conducting a random sampling of 400 people aged between 15-59 who migrated from Myanmar. The information collected through interviews was analyzed to find a percentage and mean using the Stepwise Multiple Regression Analysis. The results have shown that 33.25% of Myanmar migrant workers want to return to their home country within the next 1-5 years, 46.25%, in 6-10 years and the rest, in over 10 years. The factors relating to such decision can be concluded that the scale of the decision of return migration has a positive relationship with a statistical significance at 0.05 with a conformity with friends and relatives (r=0.886), a relationship with family and community (r=0.782), possession of land in hometown (r=0.756) and educational level (r=0.699). However, the factor of property possession in PrachuapKhiri Khan is the only factor with a high negative relationship (r=0.-537). From the Stepwise Multiple Regression Analysis, the results have shown that the conformity with friends and relatives and educational level factors are influential to the decision of return migration of Myanmar migrant workers in PrachuapKhiri Khan Province, which can predict the decision at 86.60% and the multiple regression equation from the analysis is Y= 6.744+1.198 conformity+0.647 education
Keywords—Decision of return migration, factors of return
migration, Myanmar migrant workers and PrachuapKhiri Khan Province.
I. INTRODUCTION HE return migration situation is a situation considered significant in all regions of the world and considered a
policy of several countries [1]. Such situation leads to the economic, social, cultural and political changes which have never happened in the world before. It is certain that Thailand cannot avoid this situation either. The important factors behind the migration into Thailand are the number of working-age population and that the qualification of Thai workers do not correspond with the need of a domestic labor market, especially when Thai workers lack required skills. Workers who have registered in a job application at the Department of Employment do not want to work as housemaids, laborers, agricultural, manufacturing and fishery workers and other jobs in the fishery industry [2].As they are low-paid, labor-intensive and socially-unaccepted jobs. The lack of domestic unskilled workers becomes an
Musthaya Patchanee is a professor at Faculty of Humanity and Social
Science, SuanSunandhaRajabhat University, Bangkok, Thailand (phone: +66863002389;e-mail: [email protected], [email protected]).
opportunity for migrant workers to replace unskilled Thai workers in the labor market. From the statistics, the number of Myanmar, Cambodian and Lao migrant workers, who have proved their nationalities and been permitted to work in the kingdom in 2013, totaled 717,167, 95,472 and 34,491 persons respectively[3]. Such numbers signify that most migrant workers who migrated into Thailand are from Myanmar and they have become an important unskilled group of labors that propels Thai economy. In the meantime, the current political, economic and social situation in Myanmar is rapidly changing. The United States of America, Japan, India, European Union and its members, leaders from The United Nations and other international organizations have offered help to Myanmar in forms of science and money to support the reform process of the country as well as suspend sanctions against Myanmar, causing the investment flow from other countries to Myanmar, as reference [4] stated that Myanmar may attract as much as 100 billion US dollars in foreign direct investment over the next two decades and Myanmar may “seize the opportunity” through the process of AEC integration within 2015 [5]. It has been forecast that the Gross Domestic Product (GDP) of Myanmar will expand 8% per year, the economic numbers will quadruple to more than 200 billion US dollars. Within 2030, a right investment direction will create more than 10 million jobs other than agricultural jobs; 6 million of which will be jobs in the industry sector [4]. From the prediction, it is shown that the future Myanmar migrant workers will have more job choices in their country and if the economic development in Myanmar is carried out as expected, the behaviors and patterns of migration of Myanmar workers into Thailand will change which will heavily affect various economic activities in Thailand. From the review of the research concerning Myanmar migrants in Thailand, it is found that the previous study focused on the behaviors, patterns and effects of Myanmar migrant workers. Even though this migration process has occurred for over 20 years, there has not been any studies that pay attention to the behaviors and factors behind the decision of return migration of workers aged 15-59, which will become an important substitution of unskilled group of workers under a labor shortage crisis that is intensifying every day. Therefore, researchers wish to conduct a study to collect an information from evidence-based assessment, concerning personal behaviors and factors relating to the decision of return migration of Myanmar migrant workers by using
The tendency of behaviors and potential factors in return migration of Myanmar migrant workers: A
case study in PrachuapKhiri Khan Province MusthayaPatchanee
T
Recent Advances on Energy, Environment, Ecosystems, and Development
ISBN: 978-1-61804-291-0 70

PrachuapKhiri Khan Province as a case study in order to generate research results to seek ways and offer policy suggestions to relevant agencies to slow down the situation or seek solutions and long-term prevention.
II. OBJECTIVES OF STUDY A. To study personal behaviors and characteristic of
Myanmar migrant workers in PrachuapKhiri Khan Province
B. To study factors relating to the decision of return migration of Myanmar migrant workers in PrachuapKhiri Khan Province
III. SCOPE OF STUDY
A. Scope of content
The study focuses on conducting a primary data survey on a sample, concerning personal behaviors and factors relating to the decision of return migration of Myanmar migrant workers in PrachuapKhiri Khan Province by doing an structured in-depth interview with a sample group through a questionnaire created by the researchers. The questionnaire consists of four sections of questions
- General information on population and economy
- Expectation of jobs and income in hometown
- Information on social psychology
- Decision of return migration.
The secondary data is collected from documents, books and journals from relevant government and private sector. The obtained data will be stored in a database and analyzed both descriptively and inferentially.
B. Scope of area
The study focuses on conducting a primary data survey, concerning personal behaviors and factors relating to the decision of return migration of Myanmar migrant workers in all 8 districts of PrachuapKhiri Khan Province - Hua Hin, Pranburi, Sam RoiYot, KuiBuri, Muang, Thap Sakae, Bang Saphan and Bang SaphanNoi which has 21 sub districts and and 48 villages bordering Myanmar. There are 35 border passes; 34 natural passes and 1 checkpoint which isSingkhorn Pass. PrachuapKhiri Khan occupies an area of 6,367.62 sq. km.
C. Scope of Time
The study focuses on conducting a primary data survey through interviews, concerning personal behaviors and factors relating to the decision of return migration of Myanmar migrant workers in PrachuapKhiri Khan Province in the period of 3 months (October 1, 2014 - December 31, 2014) The secondary data is about the registration result of Myanmar migrant workers who requested a work permit from PrachuapKhiri Khan Provincial Employment Office from 2013 to 2014.
D. Scope of Variable
Independent variable is a variable expected to relate to the decision of return migration of Myanmar migrant workers in PrachuapKhiri Khan Province as follows:
- Gender - Age - Hometown - Educational level - Dependency in household - Duration of stay in PrachuapKhiri Khan Province after migration - Possession of land in hometown - Property in PrachuapKhiri Khan Province - Family debt - Average monthly income - Expectation of jobs in hometown - Expectation of income in hometown - Relationship with family and community in hometown - Conformity with neighbors in hometown Dependent variable is the decision of return migration of
Myanmar migrant workers in PrachuapKhiri Khan Province.
IV. METHODOLOGYAND DATA ANALYSIS This research focuses on describing the situation and
explaining the occurrence of the situation by conducting a quantitative research and qualitative research as well as the process of finding an independent variable, expected to relate to the decision of return migration of Myanmar migrant workers in PrachuapKhiri Khan Province. The methodology can be divided into 6 sections as follows:
A. Population
This research has a unit of analysis as an individual which is 21,285 Myanmar migrant workers who requested for a work permit at PrachuapKhiri Khan Provincial Employment Office from 2013 to 2014.
B. Sample As the population that this research is conducted on is a big population, it is impossible to study all of them so only some people will be studied on. Therefore, the researchers have selected 400 people as a sample by doing a calculation in accordance with a Yamane formula [6] as follows:
n = N /1+(e) 2 (1)
when n= the number of sample
N= number of studied population
E= error of random sampling (0.05)
Substitute n= 21285/1+21285(0.05) 2
= 392.64 persons
C. Random sampling This research uses the Multi-Stage Sampling. The first step, stratified sampling, is to set all 8 districts divided by administrative district as a spatial framework. The second step, simple sampling, is to draw 5 sub districts from all 8
Recent Advances on Energy, Environment, Ecosystems, and Development
ISBN: 978-1-61804-291-0 71

districts, totaling 40 sub districts, and conduct an interview on 10 Myanmar migrant workers in each sub district in PrachuapKhiri Khan Province, totaling 400 persons.
D. Data collection instruments The data collection instrument is an interview, consisting of 4 sections as follows: 1) General information on population and economy such as gender, age, educational level, hometown, number of family members, duration of stay in PrachuapKhiri Khan Province, average monthly income, property and debt in the form of the mix of open-ended and closed questionnaire. 2) Expectation of jobs and income in hometown such as employment status, job searching and the adequacy of income with the selection of 3 answers; Agree, Not sure and Not agree. 3) Assessment on social psychology such as the relationship with family and community in hometown and conformity with neighbors and relatives that encourage them to return to their home country with the selection of 3 answers; Agree, Not sure and Not agree. 4) Assessment on the decision of return migration and the number of years they plan to stay in their hometown with a closed questionnaire.
E. Data analysis
In this research, the researchers have conducted a new data by dividing an analysis method into two methods as follows:
1)Analyzing data to answer the first objective, using frequency, percentage, mean and standard deviation.
2) Analyzing data to answer the second objective, using Pearson-Product Moment Correlation Coefficient and Multiple Regression Analysis
2.1) The study of factors relating the decision of return migration of Myanmar migrant workers in PrachuapKhiri Khan Province by turning data into a statistical unit which will be used in the calculation of a relationship of variables used in the study to find if it is positive, negative or nonexistent relationship
2.2) Multiple Regression Analysis used for analyzing the factors relating the decision of return migration of Myanmar migrant workers in PrachuapKhiri Khan Province by setting the number of Myanmar migrant workers with an decision of return migration as dependent variable and other factors as independent variable
IV. RESULT AND ANALYSIS The aim of this research is to study personal behaviors and
characteristic as well as factors relating to the decision of return migration of Myanmar migrant workers in PrachuapKhiri Khan Province. The results relating the objectives are as follows:
1. Results of the study of personal behaviors and characteristic of Myanmar migrant workers in PrachuapKhiri Khan Province.
1.1 Population
Myanmar migrant workers, used as a sample for this research, are males more than females with an average age of 33 years; 32.00% of which migrated from Myeik, 20.50% migrated from Tanintharyi, 18.25% from Yangon, 16.75% migrated from Kawthaung and 12.50% migrated from Dawei. Most of them only has an elementary school degree. 52.8% of migrant workers migrated into PrachuapKhiri Khan in the group of 2-3 people 3-6 years ago but not over 10 years. There are 1-3 family members who are still in the dependency status.
1.2 Economy - Possession of land and property All Myanmar migrant workers do not own a land in
PrachuapKhiri Khan Province but the majority does have a land in their home country for an average of 3 rai per family. Myanmar migrant workers have a property worth 13,000 baht in PrachuapKhiri Khan Province but 71.3% do not have any properties in their home country.
- Debt From the analysis, 65.8% have a monthly family debt and
34.2% do not have any. After classifying the workers with monthly family debt, it is found that the sample has a debt of approximately 1,800 baht per month in PrachuapKhiri Khan Province and has a debt of approximately 1,300 baht per month in their hometown.
- Average monthly income From the analysis, 59.80% have an average monthly income
of 4,001-8,000 baht. 1.3 Social psychology - Expectation of jobs in hometown From the score analysis of an expectation of job in
hometown, the highest score is 38 points and the lowest is 21 points. In other words, 62.1% of Myanmar migrant workers in PrachuapKhiri Khan Province have a medium-level expectation of jobs in hometown, 19.5% have a high-level expectation of jobs and 18.4% have a low-level expectation of jobs.The average score equals 27.3 which signifies that Myanmar migrant workers in PrachuapKhiri Khan workers have a medium-level expectation of jobs in hometown as shown in details in Table 1;
TABLE I EXPECTATION OF JOBS IN HOMETOWN
The level Numbers Percentage
Highexpectation of jobs 68
19.5
Moderate expectation of jobs Low expectation of jobs Total
249
74
400
62.1
18.4
100.0
- Expectation of income in hometown From the score analysis of an expectation of job in
hometown, the highest score is 15 points and the lowest is 6 points. In other words, 60.6% of Myanmar migrant workers in PrachuapKhiri Khan Province have a low-level expectation of income in hometown, 41.1% have a medium-level expectation of income and 9.3% have a high-level expectation of income. The average score equals 9.6 which signifies that Myanmar
Recent Advances on Energy, Environment, Ecosystems, and Development
ISBN: 978-1-61804-291-0 72

migrant workers in PrachuapKhiri Khan Province have a medium-level expectation of income in hometown as shown in details in Table 2;
TABLE II EXPECTATION OF INCOME IN HOMETOWN
The level Numbers Percentage
High expectation of income in hometown
37
9.3
Moderate expectation of income in hometown Low expectation of income in hometown Total
241
122
400
60.6
30.1
100.0
- Relationship with family and community in
hometown From the score analysis of a relationship with family and
community in hometown, the highest score is 23 points and the lowest is 8 points. In other words, 48.6% of Myanmar migrant workers in PrachuapKhiri Khan Province have a high-level relationship with family and community in hometown, 41.1% have a medium-level relationship with family and community in hometown and 8.1% have a low-level relationship with family and community in hometown. The average score equals 16.82 which signifies that Myanmar migrant workers in PrachuapKhiri Khan Province have a high-level relationship with family and community in hometown as shown in details in Table 3;
TABLE III RELATIONSHIP WITH FAMILY AND COMMUNITY IN HOMETOWN
The level Numbers Percentage
High of relationship 194
48.6
Moderate of relationship Low of relationship Total
174
32
400
43.3
8.1
100.0
- Conformity with neighbors and relatives in
hometown From the score analysis of a conformity with neighbors and
relatives in hometown, the highest score is 23 points and the lowest is 9 points. In other words, 52.0% of Myanmar migrant workers in PrachuapKhiri Khan Province have a medium-level conformity with neighbors and relatives in hometown, 24.9% have a high-level conformity with neighbors and relatives in hometown and 16.82% have a low-level conformity with neighbors and relatives in hometown. The average score equals 16.82 which signifies that Myanmar migrant workers in PrachuapKhiri Khan Province have a high-level relationship with family and community in hometown as shown in details in Table 4;
TABLE IV CONFORMITY WITH NEIGHBORS AND RELATIVES IN HOMETOWN
The level Numbers Percentage
High of conformity with neighbors
99
24.9
Moderate of conformity with neighbors Low of conformity with neighbors Total
264
37
400
66.6
8.5
100.0
1.4 The decision of return migration - The decision of return migration of Myanmar
migrant workers in PrachuapKhiri Khan Province78.8% of workers have the decision of return migration. Only a quarter of workers or 21.3% do not have the decision of return migration. Among the sample that wants to return to their home country, 40% thinks they will return to their home country within 1-5 years; 21%, 6-10 years and 17.8%, over 10 years as shown in details in Table 5;
TABLE V CONFORMITY WITH NEIGHBORS AND RELATIVES IN HOMETOWN
Years Numbers Percentage
Between 1-5 Between 1-5
133
185
33.25
46.25 More than 10 Total
82
400
20.5
100.0
2. Results of research and analysis of factors relating to the
decision of return migration of Myanmar migrant workers in PrachuapKhiri Khan Province
2.1 Pearson’s Product Moment Correlation Coefficient :r) The researchers have analyzed all variables to find the
correlation coefficient by Pearson’s Product Moment Correlation Coefficient, using PSPP software. The results show that the scale of the decision of return migration has a positive relationship with a statistical significance at 0.05 with a conformity with friends and relatives (r=0.886), a relationship with family and community (r=0.782), possession of land in hometown (r=0.756) and educational level (r=0.699). However, the factor of property possession in PrachuapKhiri Khan is the only factor with a high negative relationship (r=0.-537).
2.2 In the multiple regression analysis, the researchers have used the stepwise regression to select the variables. The results show that the conformity with friends and relatives and educational level factors are two factors that can be used in the regression equation and have the coefficient of multiple correlation or R, which equals to 0.948 or R2, which equals to 0.899. It is found that the conformity with friends and relatives and educational level factors are able to explain the changes and fluctuation of the scale of the decision of return migration
Recent Advances on Energy, Environment, Ecosystems, and Development
ISBN: 978-1-61804-291-0 73

at 86.60% of all variations of factors. The remaining 14.40% is influenced by other variables not considered in the research. After the adjustment of R2, R2
adj (Adjusted R Square) will equal 0.866, showing that after the adjustment, the conformity with friends and relatives and educational level factors remain highly influential to the decision of return migration, as shown in details in Table 6;
TABLE VI
MODEL SUMMARY IN MULTIPLE REGRESSION
TABLE VII COEFFICIENT IN MULTIPLE REGRESSION
Table 7 shows regression coefficient: B of an equation and gets a constant (b0) of 6.744 and a regression coefficient of variable conformity (b1) of 1.198 and variable education (b2) of 0.647. Therefore, a regression equation is Y= 6.744+1.198 conformity+0.647 education
V. SUMMARY OF RESEARCH From the results of the study of personal behavior and
characteristic as well as the analysis of factors relating to the decision of return migration of Myanmar migrant workers in PrachuapKhiri Khan Province, using Pearson’s Product Moment Correlation Coefficient and Multiple Regression Coefficient, it is shown that 33.25% of Myanmar migrant workers want to return to their home country within the next 1-5 years, 46.25%, in 6-10 years and the rest, in over 10 years. Reference[7] indicated that mostly migrant revealed that they are just work in Thailand for a period and back to long live in their hometown. Therefore, welfare even public and private sectors have to prepare to support workforce labor. The conformity with friends and relative in their hometown and educational level factors are influential to the decision of return migration of Myanmar migrant workers which corresponds with the concept of “Migration networks” defined by [8] in 1998 as sets of interpersonal ties that link migrants, former migrants, and non-migrants inorigin and destination areas through the bonds of kinship, friendship, and shared communityorigin which is the bonds of internal society, household, kinship, friendship, community and fellow
countrymen at the destination areas that have interpersonal ties between destination areas and origin of migrants or between former migrants from origin to destination areas of migrants who have experiences with migration, decision making in terms of economy, society and personal factors. The decision to migrate depends on such bonds as well as an individual educational level factor reflected through working skills. The educational level defines the level of jobs and skills development allowing workers to be more proficient in jobs, able to learn, adapt, absorb the way of thinking and working, memorize, imitate the technology of career and others better than those with lower educational level and allowing them to be leaders with new ideas and skills and share them with the community they return to as well as being able to economically adjust [9].
ACKNOWLEDGMENT Many thanks to Research and Development institute,
SuanSunandhaRajabhat University for the support.
REFERENCES [1] Andy Hall, “Migration and Myanmar: Exploratory report on recruitment
channels”. Research report, Mahidol Migration Center, 2012. [2] Labor demand research Division, Ministry of Labor, Recommendations
on statistics of International Thailand’s borderlands Migration [Online]. Accessed 20 June 2014. Available from <http://www.doe.go.th/lmi_new.index.asp>
[3] Planning and Information Technology Division, “Statistical of migration yearbook 2013-2014 (Unpublished work style),” unpublished. 2014
[4] McKinsey Global Institute, Myanmar’s moment: Unique opportunities, major challenges. [n.p.] :McKinsey & Company, 2013.
[5] Yumezaki So,“Building the ASEAN Economic Community: Challenges and Opportunities for Myanmar”in Economic Reforms in Myanmar:Pathways and Prospects. Tokyo:Japan Center for Economic Research (JCER), 2012.
[6] ManasSuwan, Quantitative techniques for Geography. Bangkok: OS printingHouse, 1998.
[7] SivilaiJayankuru, “Migrants and the need of care for elderly in Yhailand”. Research report,SuanSunandhaRajabhat University, 2012.
[8] Massey D.S., Arango J., Hugo G., Kouaouci A., Pellegrino A., and Taylor J.E.,Worlds in motion: Understanding international migration at the end of the millennium.New York: Oxford University Press,1998.
[9] Parnwell Mike, Population Movement and the Third Word. London: routledge, 1993.
Recent Advances on Energy, Environment, Ecosystems, and Development
ISBN: 978-1-61804-291-0 74

Abstract— The topicality of the investigations conducted lies in
the necessity of the development of the technologies bases involving low-temperature catalytic treatment of organic and organo-mineral materials including local biogenic resources, as well as agricultural waste.
The object of the investigation is dispersed flax tow (waste from flax processing) with silica-alumina materials additions and spherical granules obtained by the method of waste flax-mineral mixture balling in a plate granulator. The granules size depending on the raw material physical mechanical properties and the equipment operating parameters is 5 … 25 mm.
The use of silica-alumina natural materials as the additions to a flax tow matrix allows improving structural (strength, porosity) and sorption characteristics (sorption rate) of the molded compositions and can serve as a catalyst during their subsequent thermal conversion. The introduction of a certain amount of mineral additions improves the processability of the molding process; the mass plasticity rises and the initial molding moisture decreases by 10 … 15% approximately. Keywords— low-temperature catalytic pyrolysis, flax shives,
silica- alumina materials, pyrolysis gases.
I. INTRODUCTION T present the problem of the use of local raw-material sources of energy (biofuels and peat in particular)
becomes important due to the increasing costs of energy carriers [1]. Flax straw and shive can move beyond their lowly status as a waste product [2]. This unique natural source belongs to partly renewable energy sources.
To use such a fuel effectively the scientific base for novel processing technologies meeting the modern requirements is necessary. First of all it relates to the manufacturability and affectivity of the processes and also to ecological compatibility of new productions. The processes of thermal biofuels treatment (pyrolysis and gasification) are the most widely used ones.
This work was supported by the Ministry of Education and Science of Russia (Grant RFMEFI57414X0075) and Russian Foundation for Basic Research.
1Tver State Technical University, Department of biotechnology and chemistry, A.Nikitin Str., 22, 170026, Tver, Russia, phone/fax: +74822449317, e-mail: [email protected].
*Corresponding author: phone/fax: +74822449317, e-mail: [email protected].
Modern technologies of solid fuels pyrolysis could be divided into groups according to the following characteristics: heating rate (quick and slow pyrolysis); pyrolysis media (vacuum pyrolysis, hydropyrolysis, methane-pyrolysis), process temperature (low-temperature – lower than 700ºC and high-temperature – higher than 700ºC) [3].
The main process taking place during the pyrolysis [4] is cracking – destruction of –С–С– bounds of organic molecules chains and also total or partial removal of functional groups with the formation of various organic and inorganic compounds – water, hydrogen, ammonium, carbon oxide and dioxide. One of the possible ways to decrease the power inputs for the implementation of thermal treatment processes of biogenic raw-materials with the production of combustible gases mixture is gasification – heating of biofuels using expulsion by various gases [5]. Traditionally gasification is carried out in the reactors with fixed or pseudo-liquefied bed, with air, oxygen or steam blowing or their combination.
The analysis of the literature devoted to the catalytic thermo-conversion of biofuels shows that the use of catalytic systems decreases the temperature of pyrolysis and gasification processes [6], increases the rate of initial hydrocarbons decomposition and thus eliminates many disadvantages of technologies based on torch combustion of solid fuels: complexity of heat-generators and boilers constructions, necessity of usage of special and, as usual, expensive equipment for the neutralization of toxic substances evolving during thermal decomposition (sulfur and nitrogen oxides, dioxins, furan, polyaromatic hydrocarbons).
Among numerous developed and proposed catalysts of pyrolysis potassium vanadate, indium oxide, calcium oxide, magnesium oxide, some zeolites (mordenite modified with nickel) are the most investigated ones [7]. Alkali catalysts (sodium carbonate, potassium carbonate and etc.) were found to increase considerably the yield of synthesis gas during the gasification by steam at the temperature ranged from 550C to 750C. Transition metals salts reveal high activity at the initial stage of the reaction, but they are deactivated during the process [8].
Leading European countries and the USA actively develop novel catalytic materials for the pyrolysis and gasification of organogeneous raw-materials. The examples are: zeolites
Low-temperature catalytic pyrolysis of waste of flax processing using silica-alumina catalytic
systems E. M. Sulman1*, Yu. Yu. Kosivtsov1, A. I. Sidorov1, A. A. Stepacheva1, Yu. V. Lugovoy1
A
Recent Advances on Energy, Environment, Ecosystems, and Development
ISBN: 978-1-61804-291-0 75

ZSM-5 [9], zeolites catalyst DС-11 [10], mineral silica-alumina materials MCM-41 [11], Al-MCM-41, Al-SBA-15 [12, 13], silica, Al2O3, γ-Fe2O3, Fe3O4, α-FeOOH [14], clays [15], Ni/Al [16], boric and phosphoric acids [17], zinc chloride [18], KNO3-B2O3/Al2O3 [19], Co/MgO [20], Pd-Pt-La/Al2O3 [21]. Catalysts on the base of zeolites and like-zeolites minerals are the most prospective ones for the thermal treatment of biofuels. Thus the affectivity of thermo-chemical conversion of biomass to fuels is considerably increase while using silica-alumina catalysts which accelerate the decomposition of high-molecular substances, increase selectivity, allow controlling the obtaining of the products having the required volatility and inflammability limit.
The most prospective methods of thermo-chemical processing of flax shives are pyrolysis and gasification which include heating of biofuels without the access of air or with the expulsion by steam, oxygen, carbon dioxide or gaseous mixture to obtain combustible gases. Transformation of initial raw material is a complex system of subsequently-parallel reversible or irreversible reactions, among which there are both exo- and endothermic reactions. Such processes have rather high activation energies, that is high temperatures are necessary for their realization. Introduction of the catalysts into the reaction mixture leads to a considerable decrease of the activation energy and allows obtaining greater amounts of hydrocarbons at the same temperature compared to noncatalytical processes [22]. The gas having the required heat of combustion and composition can be obtained (3…30 MJ/m 3 ) depending on the process conditions. The gases having heat of combustion up to 7 MJ/m 3 are used in power engineering and for technological needs. The heat of combustion of a producer gas obtained from wood or organic waste by the use of steam-air blow is about 6 MJ/m3. The gases having heat of combustion higher than 7 MJ/m 3 are obtained by the use of steam-oxygen blow under the pressure.
In the work presented the investigations of catalytic properties of natural silica-alumina materials (clays) in the process of flax shives pyrolysis were carried out. The objective of these investigations was screening of the effective catalyst for the processing of the biofuel mentioned. The choice of clays and others silica-alumina materials as the catalysts for the pyrolysis and gasification was based on the effectiveness of theirs influence on the conversion of organic flax substances. Besides, the availability and, thus, the low cost of catalytically active mineral raw material have great importance. Especially because many kinds of such raw materials (clays and other clay materials) can be located near of the agricultural processing [23].
The composition of clays is known to include considerable proportion of minerals, which belong (as well as zeolites) to class of silica-alumina. For example, bentonite clay consists of 70…80 % of montmorillonite having the following composition: (Na, K, Ca)(Аl, Fe, Мg)[(Si, Al) 4 O 10](OH) 2n H 2 O. Its structure is organized by the
atoms of silicon, aluminium and oxygen, which form tetrahedral group. This mineral has a peculiar structure typical only for so-called clay minerals. For example, it has lamellar structure similar to the structure of mica with very strong cleavage. The lattice of montmorillonite is formed by two external tetrahedral layers and one internal octahedral layer (see Fig. 1) [24].
Fig. 1. lattice of monymorillonite
II. EXPERIMENTAL O investigate the catalytic influence of clay minerals the samples of bentonite clay, cambrian clay (mineralogical
composition of this clay includes kaolin, hydromica and montmorillonite) and kaolin clay, clay mergel and also synthetic zeolites H-Beta-25 и H-MORD (Zeolyst International) were chosen. The choice of bentonite clay is based on the literature data [26], which point out the high content of metal cations in this mineral and the high surface area.
Zeolites NH 4 -Mordenite-20 and NH 4 -Beta-25, produced by «Zeolyst International», were transferred into catalytically active protonated form of H-MORD and H-Beta-25 by calcination in a muffle kiln.
Mineral materials were introduced in a form of aqueous suspensions in fragmented flax shives in concentration (dry unit weight) of 1, 2, 3, 4, 5 and 10 %. Then spherical granules with size varied (depending on physical-chemical properties of raw material and operating parameters of equipment) from 5 to 25 mm (see Fig. 2) were formed from the obtained mixture in an ablative granulator. These granules dried to equilibrium moisture content (16…20 %) underwent low-temperature pyrolysis. Flax straw and shives with the degree of decomposition of 25…30 % was used as initial raw material.
T
Recent Advances on Energy, Environment, Ecosystems, and Development
ISBN: 978-1-61804-291-0 76
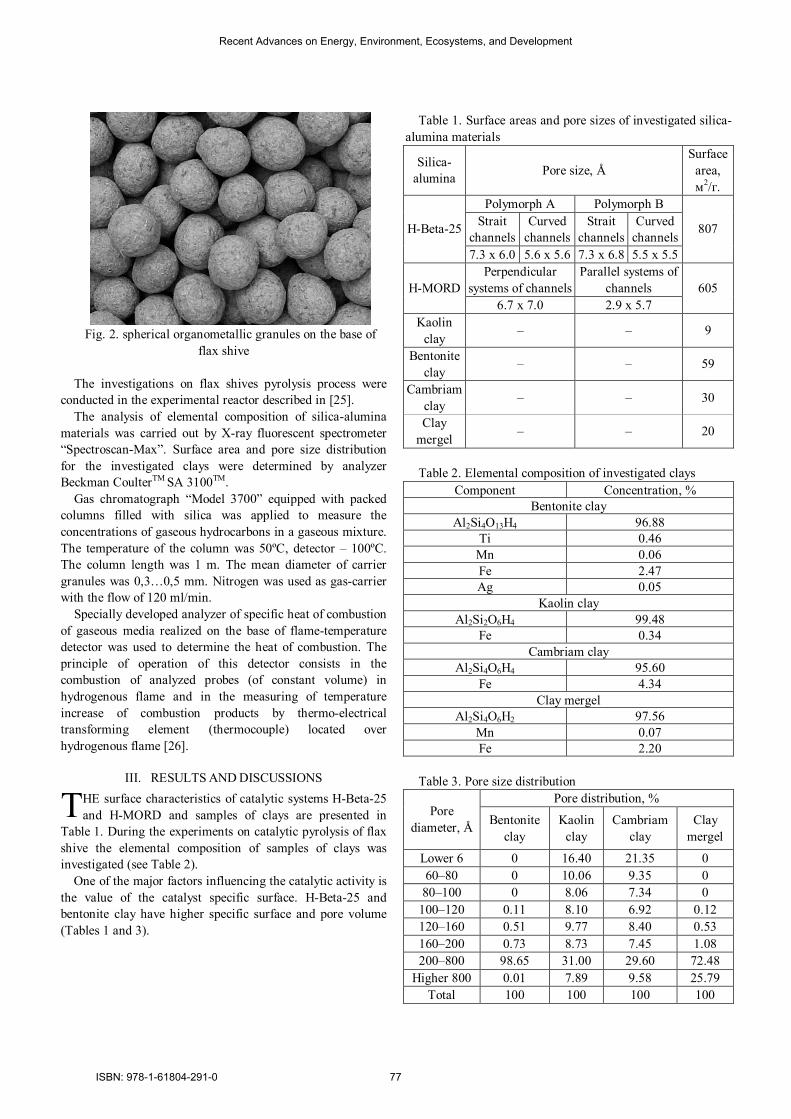
Fig. 2. spherical organometallic granules on the base of
flax shive The investigations on flax shives pyrolysis process were
conducted in the experimental reactor described in [25]. The analysis of elemental composition of silica-alumina
materials was carried out by X-ray fluorescent spectrometer “Spectroscan-Max”. Surface area and pore size distribution for the investigated clays were determined by analyzer Beckman CoulterTM SA 3100TM.
Gas chromatograph “Model 3700” equipped with packed columns filled with silica was applied to measure the concentrations of gaseous hydrocarbons in a gaseous mixture. The temperature of the column was 50ºС, detector – 100ºС. The column length was 1 m. The mean diameter of carrier granules was 0,3…0,5 mm. Nitrogen was used as gas-carrier with the flow of 120 ml/min.
Specially developed analyzer of specific heat of combustion of gaseous media realized on the base of flame-temperature detector was used to determine the heat of combustion. The principle of operation of this detector consists in the combustion of analyzed probes (of constant volume) in hydrogenous flame and in the measuring of temperature increase of combustion products by thermo-electrical transforming element (thermocouple) located over hydrogenous flame [26].
III. RESULTS AND DISCUSSIONS HE surface characteristics of catalytic systems H-Beta-25 and H-MORD and samples of clays are presented in
Table 1. During the experiments on catalytic pyrolysis of flax shive the elemental composition of samples of clays was investigated (see Table 2).
One of the major factors influencing the catalytic activity is the value of the catalyst specific surface. H-Beta-25 and bentonite clay have higher specific surface and pore volume (Tables 1 and 3).
Table 1. Surface areas and pore sizes of investigated silica-alumina materials
Silica-alumina Pore size, Å
Surface area, м2/г.
Polymorph A Polymorph B Strait
channels Curved
channels Strait
channels Curved
channels H-Beta-25
7.3 x 6.0 5.6 x 5.6 7.3 x 6.8 5.5 x 5.5
807
Perpendicular systems of channels
Parallel systems of channels H-MORD
6.7 x 7.0 2.9 x 5.7 605
Kaolin clay
– – 9
Bentonite clay
– – 59
Cambriam clay – – 30
Clay mergel – – 20
Table 2. Elemental composition of investigated clays
Component Concentration, % Bentonite clay
Al2Si4O13H4 96.88 Ti 0.46 Mn 0.06 Fe 2.47 Ag 0.05
Kaolin clay Al2Si2O6H4 99.48
Fe 0.34 Cambriam clay
Al2Si4O6H4 95.60 Fe 4.34
Clay mergel Al2Si4O6H2 97.56
Mn 0.07 Fe 2.20
Table 3. Pore size distribution
Pore distribution, % Pore
diameter, Å Bentonite clay
Kaolin clay
Cambriam clay
Clay mergel
Lower 6 0 16.40 21.35 0 60–80 0 10.06 9.35 0 80–100 0 8.06 7.34 0
100–120 0.11 8.10 6.92 0.12 120–160 0.51 9.77 8.40 0.53 160–200 0.73 8.73 7.45 1.08 200–800 98.65 31.00 29.60 72.48
Higher 800 0.01 7.89 9.58 25.79 Total 100 100 100 100
T
Recent Advances on Energy, Environment, Ecosystems, and Development
ISBN: 978-1-61804-291-0 77

The results of the investigation of pore volume distribution
(Table 4) show that the structure of all the samples investigated is represented mainly by mesopores and also micropores (for kaolin).
Catalytic action of natural silica-alumina minerals and synthetic zeolites was estimated basing on the value of volume of the evolving gaseous mixture obtained during the process of flax shives pyrolysis, on the values of concentrations of hydrocarbons in gaseous mixtures and also on the value of the heat of combustion of combustible gases. The experiments were conducted at a temperature of 400-480ºС, because their conduction at higher temperatures doesn’t lead to a considerable increase of the products heat of combustion. The experimental data presented are mean values obtained on the base of the results of five experiments.
The preliminary search experiments showed that the addition to waste of flax processing of 2 % of synthetic zeolites and of 30% of natural alumosilicates was optimal. The results of the investigation of the dependence of heat of combustion of combustible gases on the content of bentonite clay and synthetic zeolite are presented in Tables 4 and 5, respectively.
Table 4. Dependence of heat of combustion of gaseous
mixture on the concentration of bentonite clay in a substrate (at 460ºС) Concentration of bentonite clay,
% 2 8 10 20 30
Q, MJ/m3 16.27
19.7
20.45
21.14
23.88
Table 5. Dependence of heat of combustion of gaseous
mixture on the concentration of synthetic zeolites in a substrate (at 460ºС)
Concentration of H-Beta-25, % 2 20 30 Q, MJ/m3 20.74 19.56 18.29
In the presence of catalysts the amount of hydrocarbons in
a gaseous mixture noticeably increased. The increase of the heat of combustion of gaseous mixture was due to the increased content of alkanes and alkenes obtained with the use of alumosilicate materials. The average value of specific heat of combustion was higher approximately in 1,5-2 times in comparison with the data received for non-catalytic process.
Table 6 shows the dependence of the heat of combustion on the type of the catalyst at 460°C. As it can be seen from Table 6, among natural alumosilicate minerals the bentonite clay was the most effective one.
The influence of the temperature on the pyrolysis of flax shive in the presence of bentonite clay was investigated. The experiments showed that the highest heat of combustion (23.88 MJ/m3) was reached at 460°C (Table 7).
Table 6. The influence of mixture composition on the heat of combustion of pyrolysis gases
Component of the substrate
Heat of combustion at 2% of catalyst
loading, MJ/m3
Heat of combustion at 30% of catalyst loading, MJ/m3
Bentonite clay 16.28 23.89 Cembrian clay 14.66 19.16 Caoline clay 10.65 19.92 Clay mergel 10.71 19.94 H-Beta-25 20.73 18.28 H-Mord 20.75 18.11
Flax shive without any
additives 8.51
Table 7. Influence of pyrolysis temperature in the presence
of bentonite clay on heat of combustion of gaseous mixture Temperature, °С 440 450 460 480
Heat of combustion, MJ/m3 18.55 19.04 23.88 23.31 The significant distinction in the percentage of optimal
amount of alumosilicate component of the reaction mixture between natural and synthetic alumosilicates was likely due to the different structures of these substances. Besides, natural alumosilicates while added in considerable amount in reaction mixture, along with catalytic action were also heat-carriers, considerably increasing heat conductivity of the mixture and promoting more uniform heating.
While using clay minerals a considerable increase of the amount of the evolved hydrocarbons in a gaseous mixture was observed. These values exceeded the values obtained during the pyrolysis of the sample without any catalysts almost twice (Table 8).
To estimate the kinetic parameters the investigation of the temperature influence in the range of 400…480ºС on the rate of concentration change of the lower hydrocarbons obtained during pyrolysis process was conducted. From the data obtained in can be seen (Table 9) that the value of activation energy for the catalytic process of flax shive pyrolysis is lower almost twice compared to non-catalytic one. At the same time the value of preexponential parameter (k0) increases in several orders that is due to the increase of reactive centers amount.
As a result of the work performed closed to the optimal conditions of catalytic conversion of flax shives with the production of combustible gases mixture using natural silica-alumina minerals were determined. It was established that bentonite clay has the best catalytic effect on the process of pyrolysis at the concentration of 30 % and at the temperature of 460…480ºС.
The balance of the process can be described in the following way. The flax tow, straw and shives used approximately contain 53.61 % of carbon, 5.96 % of
Recent Advances on Energy, Environment, Ecosystems, and Development
ISBN: 978-1-61804-291-0 78

hydrogen, 0.79 % of nitrogen and 40.79 % of oxygen [6]. If nitrogen can be assumed as neglected, this composition approximately corresponds to the following gross-formula: C44H60O25. While decomposing in the process of pyrolysis oxygen can contact carbon and form carbon mono- or dioxide or hydrogen and form water. “The excesses” of hydrogen can contact carbon or evolve in a form of H2. “The excesses” of carbon carbonizes that is remains in a solid phase as coal. Thus, if the higher amount of oxygen binds with hydrogen to form water the lower content of carbon oxides and the higher content of hydrocarbons will be present in a gaseous mixture. On condition of steam condensation the calorific value of gaseous mixture will be higher due to the higher specific content of hydrocarbons.
Table 8. Dependence of hydrocarbons accumulation on the
catalyst nature (at 440ºС) Accumulation of hydrocarbons, ml.
Hydro- carbons
Time, s
Flax shive
without additives
Bento-nite clay
Cembrian clay
Kaolin clay
Clay mergel
H-Beta-
25
720 3.8 7.6 6.6 6.2 8.7 5.2 1320 6.4 15.3 11.7 11.6 13.9 10.1 1920 10.4 20.1 14.7 15.0 17.3 12.6 2880 11.7 23.5 17.5 18.1 20.1 14.8 4080 12.8 25.5 19.2 20.2 21.9 16.3
Methane
5280 15.7 26.4 20.1 21.4 22.6 17.0 720 0.5 1.1 1.0 0.9 1.5 0.7 1320 1.0 3.3 2.3 2.4 2.9 1.8 1920 2.1 4.8 3.1 3.4 4.0 2.6 2880 2.5 5.7 3.8 4.2 4.7 3.3 4080 2.7 6.1 4.2 4.7 5.1 3.8
Ethane
5280 3.4 6.3 4.4 5.0 5.2 4.0 720 0.3 1.1 0.9 0.7 1.1 0.8 1320 0.59 2.2 1.5 1.4 1.8 1.6 1920 1.1 2.8 1.8 1.8 2.2 2.1 2880 1.3 3.0 2.0 2.0 2.3 2.4 4080 1.3 3.1 2.1 2.1 2.4 2.5
Ethylene
5280 1.4 3.1 2.1 2.2 2.4 2.6 720 0.2 0.6 0.6 0.5 0.76 0.7 1320 0.4 1.5 1.2 1.1 1.3 1.4 1920 0.9 2.0 1.6 1.5 1.7 1.7 2880 1.0 2.2 1.8 1.8 1.9 2.0 4080 1.1 2.4 1.9 2.0 2.1 2.2
Propane
5280 1.4 2.4 2.0 2.0 2.1 2.2 Table 9. Values of activation energies for the process of
flax shives pyrolysis Ea, kJ/mol k0
Gas Not catalytic process
Catalytic process
Not catalytic process
Catalytic process
Methane 85 38 1·102 7·106
Ethane 68 37 6·104 2·109 Ethylen
e 51 38 90 5·104
Propane 41 22 3·103 9·108
IV. CONCLUSION HE use of catalyst allows decreasing the temperature of pyrolysis from 700ºС to 450…480ºС, decreasing the
activation energy almost twice and increasing the rate of pyrolysis.
The data given can be used for further investigations, liquid biofuels and organometallic sorbents production.
The presented analysis of literature and the experimental data allows coming to the conclusion of the availability of bentonite clay use as the catalytic system in the processes of waste of flax processing pyrolysis for the industrial production of combustible gases as an alternative source of energy.
REFERENCES [1] B.N. Kuznetsov “Catalytic chemistry of plant biomass” in Soros
Educational Journal (Russia). Vol. 12. 1996. pp. 47-55. [2] Francis A. Kolla, John J. Balatinecz “Flax shives reinforced thermoplastic
resin composition” US Patent US6133348. [3] V.M. Kostantinov, Yu.B. Chelidze “Ecological bases of nature
management”. Moscow “Academy”, 2003. [4] J. Stevens “Hot gas conditioning: Recent progress with larger-scale
biomass gasification systems”. Washington: Pacific Northwest National Laboratory, 2001. 102 p.
[5] M. Ising, J. Gil, C.H. Unger in 1st World Conference and Exibition on Biomass for Energy and Industry. 5-9 June. 2000. Sevilla, Spain. P.1775-1778.
[6] T.N. Mukchina, N.L. Barabanov, S.E. Babash, V.A. Menschikov, G.L. Averkch. “Pyrolysis of carbon-containing raw materials”. Moscow “Chemistry”. 1987. 240 p.
[7] A. Marcilla, A. Gomes, J.A. Reyes-Labarta, A. Giner, F. Hernández. “Kinetic study of polypropylene pyrolysis using ZSM-5 and an equilibrium fluid catalytic cracking catalyst” in Journal of Analytical and Applied Pyrolysis. Vol. 68-69. August. 2003. P. 467.
[8] J. Monnier, G. Tourigny, R. Le van Mao in 13th international congress on catalysis. 11-16 July. 2004. Paris. France. Vol.2. P.216.
[9] A. Marcilla, A. Gomes, S. Menargues, J. García-Martínez, D. Cazorla-Amorós. “Catalytic cracking of ethylene-vinyl acetate copolymers: comparison of different zeolites” in Journal of Analytical and Applied Pyrolysis. Vol. 68-69. 2003. P. 495.
[10] D. Serrano, J. Aguado, J. Escola, J. Rodríguez, L. Morselli, R. Orsi “Thermal behaviour during the pyrolysis of low rank perhydrous coals” in Journal of Analytical and Applied Pyrolysis. Vol. 68-69, August, 2003. P. 481.
[11] G. Nierop, F. van Bergen “Clay and ammonium catalyzed reactions of alkanols, alkanoic acids and esters under flash pyrolytic conditions” in Journal of Analytical and Applied Pyrolysis. Vol. 63. March. 2002. P. 197.
[12] M. Brebu, M. Azhar, A. Muto, Y. Sakata, C. Vasile “The role of temperature program and catalytic system on the quality of acrylonitrile-butadiene-styrene degradation oil” in Journal of Analytical and Applied Pyrolysis. Vol. 63. March. 2002. P. 43.
[13] R. Van Grieken, D. Serrano, J. Aguado, R. García, C. Rojo “Thermal and catalytic cracking of polyethylene under mild conditions” in Journal of Analytical and Applied Pyrolysis. Vol. 58-59. April. 2001. P. 127.
[14] L. García, M.L. Salvador, J. Arauzo, R. Bilbao “Catalytic pyrolysis of biomass: influence of the catalyst pretreatment on gas yields” in Journal of Analytical and Applied Pyrolysis. Vol. 58-59. April. 2001. P. 491.
[15] H. Eun-Young, K. Jong-Ryeul, C. Jeong-Kun, W. Hee-Chul, P. Dae-Won “Performance of acid treated natural zeolites in catalytic degradation of
T
Recent Advances on Energy, Environment, Ecosystems, and Development
ISBN: 978-1-61804-291-0 79

polypropylene” in Journal of Analytical and Applied Pyrolysis. Vol. 62. February. 2002. P. 351.
[16] P.T. Williams, A.R. Reed “High grade activated carbon matting derived from the chemical activation and pyrolysis of natural fibre textile waste” in Journal of Analytical and Applied Pyrolysis. Vol. 71, July, 2004. P. 971.
[17] H.C. Jong, M.J. Sang, H.K. Jun, K.P. Sang, L. Won-Ho in 13th international congress on catalysis (Paris, France, 11-16 July, 2004), Palais des Congres. Paris. Vol.2. P.217.
[18] N. Kraikul, S. Jitkarnka, A. Luengnaruemitchai in 7th World Congress of Chemical Engineering. 10-14 July. 2005. Glasgow, Scotland. P.245.
[19] K. Tasaka, T. Furusawa, A. Tsutsumi in 7th World Congress of Chemical Engineering. 10-14 July. 2005. Glasgow, Scotland. P.208-209.
[20] A.D. Simonov, N.A. Yazykov, P.I. Vedyakin, V.N. Parmon in 3-d Russia-China Seminar on Catalysis (Novosibirsk, 26-28 April 2003). Boreskov Institute of Catalysis SB RAS. Novosibirsk. Russia. P.35.
[21] T.V. Bukcharkina, N.G. Digurov “Chemistry of natural energy carriers and carbon materials”. School-book. Moscow, D.I. Mendeleyev RChTU, 1998.
[22] J. Rabo “Chemistry of zeolites and catalysis with zeolites”. Т.2. Moscow “Mir”. 1980. 422 p.
[23] Yu.I Tarasevich “Natural sorbents in water purification processes” Kiev “Naukova dumka”. 1981. 208 p.
[24] J.A. Martens, P.A. Jacobs, J. Weitkamp “Attemps to rationalize the distribution of hydrocracked products” in Appl.Catal. 1986. Vol.20. P.239.
[25] S. Ayabe, H. Omoto, T. Utaka, R. Kikuchi, K. Sasaki, Y. Teraoka, K. Eguchi “Catalytic autothermal reforming of methane and propane over supported metal catalysts” in Applied catalysis A: General. 2003. P.261-269
[26] O.V. Kislitsa, V.V. Alfyorov, A.E. Usanov, E.M. Sulman “Production of fuel gases by catalytic destruction of waste of cross-linked rubbery polymers” in Catalysis in Industry. 2004. №1, P. 35.
[27] L.V. Ilasov et all. Patent 38507 (Russia). 2004.
Recent Advances on Energy, Environment, Ecosystems, and Development
ISBN: 978-1-61804-291-0 80

Abstract—Bamboo shoots may be used as raw material for
downstream biochemical production. In this work, reducing sugars were produced from bamboo shoots using acid and enzymatic hydrolysis. Initially, they were reacted with dilute sulfuric acid in a batch reactor at a fixed temperature of 140oC and an acid loading between 0.4 – 1.6% w/w. A reaction time between 45 – 135 min was used. The treated material was subsequently analyzed for reducing sugars. Water insoluble solids were subsequently hydrolysed with cellulase and β-glucosidase to obtain more glucose. From the initial acid hydrolysis process, maximum glucose and xylose yields were obtained at 34.5 and 9.4 mg/mL, respectively. It was found that increasing yields were realised with increasing reaction times. More sugar yields from bamboo shoot can be obtained from enzymatic hydrolysis.
Keywords—Biomass; lignocellulosic; pretreatment; glucose; renewable energy.
I. INTRODUCTION T was estimated that over 350 million dry tons of woody biomass are available, accounting for 30% of the total global
biomass [1]. Apart from wood, other biomass feedstocks including fast growing grasses, weeds, agricultural residues, aquatic plants and wastes have great potential for energy utilization [2, 3, 4].
Bamboo is a common name used for a broad group of woody grasses, encompassing 1250 species within 75 genera. It is widely distributed in the Tropics. Bamboo is of economic and high cultural significance in Thailand and Asia [5, 6]. It is used extensively as building materials, furniture, chopsticks and food steamers. Bamboo is a fast growing plant, has a high density and can be harvested all year round. It is a lignocellulosic biomass source with high potential for biofuels [7].
Ethanol is a renewable biofuel that can be used to power engines. Production of alcohol fuels from lignocellulose materials can be advantageous if biomass sources are available locally. Bamboo is considered to have potential as a
This work was supported by Chiang Mai University. N. Tippayawong is with the Department of Mechanical Engineering,
Faculty of Engineering, Chiang Mai University, Thailand. (corresponding author: tel.: +66 5394 4146; fax: +66 5394 4145; e-mail: [email protected]).
N. Chanhom was with the Department of Mechanical Engineering, Chiang Mai University, Thailand. She is now pursuing her PhD degree at King Mongkut University of Technology Thonburi, Thailand (e-mail: [email protected]).
lignocellulosic source for ethanol production. One major route to produce ethanol is via biochemical conversion. The materials are broken down into fermentable sugars and then fermented by organisms. In a bioconversion process, pretreatment is important. Dilute acid pretreatment is one of the most widely adopted methods. It was shown to improve the enzymatic saccharification rates of many biomass feedstocks [8, 9, 10]. Research was also conducted to investigate the production of fermentable sugars [11, 12].
Many lignocellulosic materials have been investigated to produce fermentable sugars for ethanol production. But, published works on acid pretreatment and enzymatic hydrolysis of bamboo and bamboo shoots to produce fermentable sugars was scarcely found. This work is about utilization of bamboo shoots for bioproduct applications. The objective of this work is to evaluate the effects of dilute acid pretreatment and enzymatic hydrolysis of bamboo shoots on sugar yields, under various acid concentrations and residence times.
II. MATERIALS AND METHODS
A. Raw Materials The raw material used was bamboo shoot (Dendrocalamus
asper Backer). It was collected locally and chopped in the field. Example is shown in Fig. 1. Once in the laboratory, the bamboo shoot samples were air dried at room temperature and cut to sizes of about 10 x 50 mm. They were then milled and sieved. The fraction containing particles with a size less than 0.25 mm were selected to provide a fine size class and stored in plastic bags at room temperature until further processed. Composition of bamboo shoot was determined according to the US National Renewable Energy Labolatory, similar to that used by Sathitsuksanoh et al. [13]. The structural carbohydrate composition of the biomass was determined using a modified quantitative saccharification. Monomeric sugars were measured by a high performance liquid chromatography (HPLC) instrument with a Bio-Rad Aminex HPX-87P column. The prepared bamboo shoot samples were subsequently converted to reducing sugars via acid and enzymatic hydrolysis, shown schematically in Fig. 2.
B. Dilute Acid Pretreatment The pretreatment was performed in a laboratory scale stirred
autoclave. It has a total volume of 1 L, equipped with an electric heater, a magnetic stirrer and a control unit for
Fermentable sugars from dilute acid and enzymatic hydrolysis of bamboo shoots
Nakorn Tippayawong, and Nuttida Chanhom
I
Recent Advances on Energy, Environment, Ecosystems, and Development
ISBN: 978-1-61804-291-0 81

temperature and agitation. All raw materials were dried at 103oC for 72 h to ensure low moisture content, prior to the pretreatment. The amount of biomass sample loaded was 5 g on dry basis for each experiment. Each pretreatment was carried out using 50 mL of acid at concentrations between 0.4 – 1.6% w/w. The samples were then held at 140oC for 45 – 135 min. After allowing the temperature to drop to 40oC, the treated samples were immediately quenched. The wet samples were then separated into solid and liquid fractions by filtration.
The filtrate was sampled in order to determine the concentrations of glucose and xylose in the hydrolysates. The pretreated solid residues or water insoluble solid (WIS) fractions were washed with water until the pH value of washed water was greater than 5.0 and later used as substrates in subsequent hydrolysis process. Total reducing sugars were determined by the HPLC and the dinitrosalicylic acid method using glucose as the standard.
C. Enzymatic Saccharification Preliminary investigation was conducted for enzymatic
saccharification. It was performed in 100 mL Erlenmeyer flasks using 5% dry matter (w/w) and 50 mM sodium citrate buffer (pH 4.8) at 2% (w/v) dry. The loading enzyme used was cellulase from Trichoderma reesei with an activity of 65 filter paper units (FPU)/g, and β-glucosidase (Novozyme 188) with an activity of 590 international unit (IU)/g. The enzyme loading was 15 FPU/g of dry pretreated substrate of cellulase and 15 IU/g of dry pretreated substrate of β-glucosidase. Enzymatic hydrolysis was conducted for 72 h. All experiments were repeated at least three times and average results were presented.
III. RESULTS AND DISCUSSION
A. Composition of Bamboo Shoot Table 1 shows the chemical composition of the bamboo
shoot. It was found to have high cellulose content (over 60%). It was noted that the glucan content of bamboo shoot was higher than that of fully grown bamboo. This implies that potentially more reducing sugars were likely to be obtained from bamboo shoots than fully grown bamboo.
B. Acid Pretreatment The effects of acid concentration and time at a stable
temperature of 140oC, and their combinations on dilute acid
Fig. 1 Bamboo shoots
Table 1 Chemical composition of bamboo shoots
Composition % w/w Cellulose 61.2 Glucan 61.2 Hemicellulose 18.2 Xylan 15.4 Mannan 0.6 Arabinan 1.1 Gallactan 1.1 Ash 0.7 Lignin 21.1
Table 2 Total xylose yields for dilute acid pretreatment
Time (min) Concentration (%w/w)
Xylose (mg/mL)
45 1.0 1.7 60 0.6 1.9 60 1.4 5.1 90 0.4 3.5 90 1.0 4.1 90 1.6 9.4
120 0.6 5.9 120 1.4 5.1 135 1.0 8.1
Fig. 2 Conversion of bamboo shoots to fermentable sugars
Recent Advances on Energy, Environment, Ecosystems, and Development
ISBN: 978-1-61804-291-0 82

treatment of bamboo shoot is shown in Tables 2 and 3, showing xylose and glucose recovery. The main mode of action in dilute acid pretreatment is to solublize hemicellulose, convert it to sugars and increase digestibility of the remaining cellulose for subsequent enzymatic hydrolysis. The highest xylose yield was found to be 9.4 mg/mL, at 90 min, an acid concentration of 1.6% w/w. This was over 60% of potential maximum amount estimated from the xylan content in bamboo shoot. As the pretreatment became less severe, xylose yields were smaller. İt was noted that longer residence times did not appear to generate higher xylose yield.
The glucose yields were in the range of 24.6 – 34.5 mg/mL. Maximum glucose yield was found to occur at 135 min residence time and an acid concentration of 1.0% w/w. At the condition in which the maximum xylose yield was obtained, glucose yield was found to be 27.3 mg/mL. This value was in the low end of the glucose recovery range found in this work. This implies that more glucan was available for subsequent enzymatic saccharification.
For a fixed residence time, the glucose yields did not appear to increase with increasing acid concentration. As the residence time increased, glucose recovery tended to increase. The findings revealed that the cellulose fraction of the bamboo shoot was affected by the pretreatment. This is not desirable for an effective pretreatment. It should be noted that the glucose recovery observed in the prehydrolysate was rather high. There was about 40 – 47% glucan content in the raw material. The highest combined glucose and xylose yields were measured at a residence time of 135 min and an acid concentration of 1.0% w/w, due mainly to high glucose recovery. Other sugars such as galactose, arabinose and mannose were present, but in very small amounts, compared to glucose and xylose
C. Enzymatic Hydrolysis Enzymatic conversion was conducted for cellulose in the
WIS fraction using cellulase from Trichoderma reesei and β-glucosidase (Novozyme 188). It was found that, after 72 h, the maximum glucose yields were obtained at about 60 – 70 mg/mL. The system of enzymes which usually contains hemicellulase was expected to convert any hemicellulose not
solubilised in the dilute acid pretreatment. In this work, xylose yields obtained from the bioconversion process were very small.
IV. CONCLUSION Bamboo shoots may be important feedstocks for future
biofuels because of their glucan- and xylan-rich components. In this work, the conversion of bamboo shoots by dilute acid treatment and enzymatic hydrolysis to produce sugars was investigated. Utilization of bamboo shoots for bioenergy and bioproduct applications was successfully demonstrated. It was shown that acid catalyzed pretreatment of bamboo shoot can produce digestible solid residues and solubilise significant amount of the hemicellulose fraction.
ACKNOWLEDGMENT The authors wish to thank Departments of Biology and
Agricutural Science for technical assistance with analytical facilities.
REFERENCES [1] J. Y. Zhu, and X. J. Pan, “ Woody biomass pretreatment for cellulosic
ethanol production: technology and energy consumption evaluation,” Bioresour. Technol., vol. 101, pp. 4992-5002, 2010.
[2] T. Wongsiriamnuay, and N. Tippayawong, “Non-isothermal pyrolysis characteristics of giant sensitive plants using thermogravimetric analysis,” Bioresour. Technol., vol. 101, pp. 5638-5644, 2010.
[3] T. Wongsiriamnuay, and N. Tippayawong, “Thermogravimetric analysis of giant sensitive plants under air atmosphere,” Bioresour. Technol., vol. 101, pp. 9314-9320, 2010.
[4] N. Tippayawong, C. Chaichana, A. Promwungkwa, and P. Rerkkriangkrai, “Gasification of cashew nut shells for thermal application in local food processing factory,” Energy Sustain. Dev., vol. 15, pp. 69-72, 2011.
[5] W. Leenakul, and N. Tippayawong, “Dilute acid pretreatment of bamboo for ethanol production,” J. Sustain. Energy Environ., vol. 1, pp. 117-120, 2010.
[6] N. Tippayawong, and N. Chanhom, “Conversion of bamboo to sugars by dilute acid and enzymatic hydrolysis,” Int. J. Renew. Energy Res., vol. 1, pp. 240-244, 2011.
[7] J. M. O. Scurlock, D. C. Dayton, and B. Hames, “Bamboo: an overlooked biomass resource,” Biomass Bioenergy, vol. 19, pp. 229-244, 2000.
[8] Y. Sun, and J. Cheng, “Dilute sulfuric acid pretreatment of rye straw and bermudagrass for ethanol production,” Bioresour. Technol., vol. 96, pp. 1599-1606, 2005.
[9] I. D. Campo, M. Z. Alegr, M. Echeverr, and I. Echeverr, “Diluted acid hydrolysis pretreatment of agri-food wastes for bioethanol production,” Ind. Crop. Prod., vol. 24, pp. 214–221, 2006.
[10] I. Ballesteros, M. Ballesteros, P. Manzanares, and M. J. Negro, “Dilute sulfuric acid pretreatment of cardoon for ethanol production,” Biochem. Eng. J., vol. 60, pp. 84–91, 2008.
[11] T. A. Lloyd, and C. E. Wyman, “Combined sugar yields for dilute sulfuric acid pretreatment of corn stover followed by enzymatic hydrolysis of the remaining solid,” Bioresour. Technol., vol. 96, pp. 1-11, 2005.
[12] C. Cara, E. Ruiz, J. M. Oliva, F. Saez, and E. Castro, “Conversion of olive tree biomass into fermentable sugars by dilute acid pretreatment and enzymatic saccharification,” Bioresour. Technol., vol. 99, pp. 1869–1876, 2007.
[13] N. Sathitsuksanoh, Z. Zhu, T. Hoc, M. Bai, Y. Heng, and P. Zhang, “Bamboo saccharification through cellulose solvent-based biomass pretreatmentfollowed by enzymatic hydrolysis at ultra-low cellulase loadings,” Bioresour. Technol., vol. 101, pp. 4926–4929, 2010.
Table 3 Total glucose yield for dilute acid pretreatment
Time (min) Concentration (%w/w)
Glucose (mg/mL)
45 1.0 26.3 60 0.6 27.5 60 1.4 27.5 90 0.4 24.6 90 1.0 31.1 90 1.6 27.3
120 0.6 29.3 120 1.4 31.5 135 1.0 34.5
Recent Advances on Energy, Environment, Ecosystems, and Development
ISBN: 978-1-61804-291-0 83

Nakorn Tippayawong received his BEng degree in mechanical engineering and PhD degree in internal combustion engines from Imperial College London, UK in 1996 and 2000, respectively. He is currently an associate professor at the Department of Mechanical Engineering, Faculty of Engineering, Chiang Mai University, Chiang Mai, Thailand. His research interests include biomass utilization, energy efficiency improvement, and emission control. So far, he has published about 100 papers in peer reviewed international journals. Dr Tippayawong serves as an associate editor and an editorial board member of several leading international journals. Nuttida Chanhom graduated with MEng degree in energy engineering from Chiang Mai University, Chiang Mai, Thailand in 2011. She was a lecturer at Suan Sununtha Rajabhat University in Bangkok. She is currently working towards her PhD in sustainable energy at King Mongkut University of Technology Thonburi, Thailand.
Recent Advances on Energy, Environment, Ecosystems, and Development
ISBN: 978-1-61804-291-0 84

Abstract— According to section 1448 of Thai Civil and
Commercial Code, sex plays a crucial role on a marriage. It stated that “A marriage can take place only when the man and woman have completed their seventeenth year of age. But the Court may, in case of having appropriate reason, allow them to marry before attaining such age.” So, in Thai law, the marriage can be done only when one party is male and other is female basing on his and her inborn sex. Even a man went through transgender’s surgery; he’s still been recognized as man in the eyes of the law. In legal procedure, petition for sex changing is not authorized in Thai law also. Though Thai court possesses discretion on allowing marriage to be taken place, such discretion is being executed on the matter of minors whose age have of yet completed their seventeenth year of age. Therefore, it has nothing to do with same-sex marriage. Simply put, firstly, marriage between persons who are in the same inborn sex is unauthorized by the law. Secondly, it does not establish any legal rights and duties of husband and wife as appear in Thai Civil and Commercial Code. Keywords— Development ,Law ,Same Sex Relationship ,Husband and Wife
I. 0BINTRODUCTION UMANS are described as social animal so that they tend to live together. Relationships among human beings
normally begin with primary group. Later, it grows bigger and bigger and finally be a family which is the biggest group in primary level. Family members, highly share their love and attachment to their parents and to their next of kin. However, when they turn to teens, sex thought and sex drive eventually come across their minds. Sex, therefore, can be considered as one of many reasons for humans to be together and they finally become family. As a universal and fundamental institution both in civil law and common law countries, social norms and legislations are set to authorize and protect the will of citizens to create their own family. To be emphasized, peace and welfare in family are guaranteed by social and state protection basing on security of right and person status without all forms of discrimination [ 1F1].
Prior to October 1st 2478, Thai law authorized status of family members when man and woman religiously express their commitment without considering registration as a condition in accepting or rejecting their marriage relationship.
Kamonwan Yoowattana, is the lecturer in Law Program of Faculty of
Humanities and Social Sciences at Suan Sunandha Rajabhat University, Dusit Bangkok 10300, Thailand (corresponding author to provide phone: +66-081-142-3540, +66-02160-1304; fax: +66-02160-1306; e-mail address : [email protected])
Moreover, the law also embraced polygamy system by considering that all types of wife are legitimate but possessing higher or lower status in the family2F
2as influenced by present norms and cultures. After law reforms, monogamy principle is applied as appear in Book V of Thai Civil and Commercial Code so that marriage can only be completed by registration [3]. Since then, man and woman who cohabit as husband and wife possess legitimate status as the registration is made due to section 1457 and 1448 of Thai Civil and Commercial Code stating that a marriage can be taken place only when the man and woman have completed their seventeenth year of age. Bu the court may, in case of having appropriate reason, allow them to marry before attaining such age. This statement show that the right of husband and wife can only be legally protected and authorized when registration is taken place though there are kind of illegitimate couples such as non- registered couple and same-sex couples do still exist in Thai society. For this reason, even though those couples are willing to cohabit as husband and wife, they cannot retain such status in the eyes of the law.
Social factors such as gender affect the development with regards to quality of life [8]. Persons at all sex orientation are entitled to have right to choose spouse and create family basing on Freedom of Contract without limitation on gender issue. Therefore, researcher is interested in studying about legal rights and duties on same-sex marriage in order to seek for appropriate provision to apply with the issue. This is because the law should grant fair protection to all types of relationships. Scope of Study
Researcher intends to study the issues related to rights duties and status of husband and wife in Thai Civil and Commercial Code with regards to same-sex relationship.
Expected Benefit Researcher expects that this study will grant benefit to legal area and will be a guideline to amend and develop legislations regarding same-sex relationship in order to encourage development of Thai society in the future. Review Literature
1. Principle of Human dignity 1.1 Human Dignity by the law
Interim Constitution of Thailand 2557 shows its concern about security of human dignity in rights
Kamonwan Yoowattana
Law development on accommodating the rights of same-sex relationship
H
Recent Advances on Energy, Environment, Ecosystems, and Development
ISBN: 978-1-61804-291-0 85

duties and freedom of people. Person can claim human dignity or exploit his/her rights and freedom as long as it does not affect rights and freedom of others. Also, person must not exercise the right in contrary with constitution or good morals. The ability to exercise such right is an evidence to guarantee that rights of persons is protected by law in accordance with the traditions of governing the Thai nation under a system of democracy with the King as Head of State and in accordance with international agreements to which Thailand is a party.
1.2 Human Dignity by Human Rights Acknowledged by United Nations General
Assembly in accordance with resolution no. 217 (III) at Dec 10th 1948 , the Universal Declaration of Human Rights was supported by Thailand as intention of guarantee fundamental rights of person in article 16(1) stating that Men and women of full age, without any limitation due to race, nationality or religion, have the right to marry and to found a family. They are entitled to equal rights as to marriage, during marriage and at its dissolution. The declaration pays attention to human dignity especially in equality before the law as describe as principle of family relationship protection without discrimination. 2. Marriage Theory 2.1 Social Contract In the eyes of Natural Law, law is originated by natural reason of human kinds. Family husband wife and child, each atom or unit, are unrelated. However, they are next to each other so that they gather and be a family. Thus, stated in theory of social contract, collective group of people is together with freedom and consent to attach themselves with others. As persons are agreed to cohabit as husband and wife, they now commit themselves as a couple basing on theory of social contract in order to live their lives in harmony with nature [5]. 2.2 Pactum Subjection State sovereignty is originated by citizens. Therefore, the citizens must observe and follow state law. This s an origination of Pactum Subjection. The principle requires natural law applying to citizens [3]. Therefore, power that grants to head of state relating to marriage is the consent of persons of the state to follow the law in term of marriage conditions, rights, and duties on marriage basing on natural law.
3. Right Duties and Status of Husband and Wife
Meaning of rights (Right).
In accordance with the Royal Institute dictionary of rights means that the power of the Buddhist Era 2554 righteous person such as have the rights and duties in accordance with the Constitution and they have the rights to the land of power that this law shall be made by any of the good faith and freely, but shall not affect the rights of other people. In H. predict (remember last year) ear of plants [1] saw that the rights certificate and legal protection is a benefit that is to be able to come into force in accordance with the law, it is usually the legal documents shall constitute a complete with a move to the right, that is, there was a motion to protect the law and stop the light and looked at it, the rising will be deemed eligible for the benefit, protection law was narrow
because it has the right to a lot of the right not to be beneficial to the owner [2]. rights are crucial elements are as follows: 1. The right holder or the owner may be entitled to be a person who is a natural person or a juridical person. 2. There must be an object of right or has content, it may be real estate or property. 3. Other person must respect the rights of the right holder holders can be used against other people. 4. There must be a legitimate exercise of the right is to be exercised within the limits of the law. Therefore, it may be concluded that the rights given to a person is authorized by law, may be within the powers that are available over the property or authority over the person.
Conditions of Marriagethe law are as follow.
1) Sex of spouse In general, marriage is taken place in order to create family and child. Therefore, marriages in most countries acknowledge such relationship between man and woman . Presently, however, same-sex marriage is accepted by the law of many countries worldwide. On the contrary, marriage does exist only between man and woman. It does not matter even he or she is under trasgender’s operation since gender status basing on inborn sex. Though his or her appearance has changed, that does not verify them to file for the change of their gender status. Therefore, same-sex relationship in Thailand does not count as marriage. Moreover, in the eyes of the law, such relationship is null and void.
2) Age of Spouse According to Thai Civil and Commercial Code, A marriage can take place only when the man and woman have completed their seventeenth year of age. But the Court may, in case of having appropriate reason, allow them to marry before attaining such age (section 1448). If marriage failed to comply with section 1448, such marriage is voidable according to section 1503. In this case, interested person such as parents is entitled to apply for cancellation of marriage (section 1504) but they tend to do it before both man and woman have complete their age required under section 1448. If the age requirement is fulfilled, such marriage cannot be cancelled and shall be deemed to be valid from the time it was made according to section 1504 paragraph 2.
3) Competence of Spouse According to Thai Civil and Commercial Code a marriage cannot take place if either the man or the woman is an insane person or adjudged incompetent (section 1449). If such marriage fails to fulfill the condition, it is definitely void due to section 1495. In such case, interested persons may apply for a judgment of the Court affecting the void of marriage and such marriage shall be deemed to invalid from the time it was made.
4) Marriage with blood related A marriage cannot take place if the man and woman
are blood relations in the direct ascendant or descendant line, or brother or sister of full or half blood. The said relationship shall be in accordance with blood relation without regard to its legitimacy. Otherwise, such marriage is void according to section 1495 Thai Civil and Commercial Code.
Recent Advances on Energy, Environment, Ecosystems, and Development
ISBN: 978-1-61804-291-0 86

5) Adopter and Adopted An adopter cannot marry the adopted. If the marriage fails to comply with this condition, The adoption will become dissolved due to section 1451 of Thai Civil and Commercial Code.
6) Plural Marriage A marriage cannot take place if the man or woman is
already the spouse of another person. This is not include man or woman who married and his or her marriage come to an end, then, remarry again or cohabit as husband and wife without registration. Therefore, plural marriage is prohibited due to section 1452. If the marriage fails to comply with this condition, The adoption will become dissolved due to section 1495 of Thai Civil and Commercial Code. Though marriage registration is taken place with good faith of one side of spouse, such marriage is still invalid.
7) A marriage of widow, woman with dead of her husband, woman whose marriage had ended
Widow, woman with dead of her husband, woman whose marriage had ended can remarry only when previous marriage is at the end at least 310 days except such woman gave birth to a child during the periods or remarry with ex-husband or can show medical certificate stating that there is no sign of pregnant or can show court permission on marriage.
8) Consent of Spouse A marriage can take place only if the man and woman agree to take each other as husband and wife, and such agreement must be declared publicly before the Registrar in order to have it recorded by the Registrar according to section 1458 of the Thai Civil and Commercial Code.
9) Consent of parents, adopter, or guardian In case of marriage of a minor, 17 to not completed
full age of 20, the consent of parents, adopter, or guardian is required otherwise such marriage failing to comply with the condition is voidable. 10( Registration of Marriage Marriage under the Thai Civil and Commercial Code is legitimate only registration is completed according to section 1457. Prior to Oct 1st, 1953, marriage was valid without any registration according to Law relating to Husband and Wife. After law reform with regards to conditions of marriage, registration has to be performed in order to authorize the marriage between man and woman. As a form of marriage, registration acts as legal acknowledgement to public in change of status [6].
II. 1BMETHODOLOGY The research on Law development on
accommodating the rights of same-sex relationship aims to seek for appropriate legal resolution for marriage with different sex orientations in Thai Law. Researcher selects to perform qualitative research through documents. The primary resources are Code, Act, legislations, Court Case, books, articles, journals, and research etc. Therefore, sample group is not designated in this reaserch.
III. 2BRESULT AND DISCUSSION
In accordance with section 1448 the Thai Civil and Commercial Code, marriage can be done only between man and woman. Gender or sex of spouse is basing his or her inborn thereof. Transgender’s operation can be performed to persons but the inborn sex is not changed by such surgery. Also, persons, in accordance with Thai law, are not entitled to apply to court either for changing their gender or for requesting legitimate registration of marriage. As a result, there is no authorization or rights of same-sex relationship under Thai law.
Table I STATISTIC OF COUPLE WITH MARRIAGE CERTIFICATE BY REGION AND PROVINCE: 2011 - 2012 Unit: Couple
Source : of Department Provincial Administration, Ministry of Interior. Discussion
Marriage under Thai law is legitimate only if it is done by registration between man and woman. No rights of same-sex relationship stated in Thai Civil and Commercial code. It can be concluded that cohabit between persons with same sex is not accepted and is not valid. as provided by law, the marriage has been registered, but only the men and women in the marriage, there is no provision for the right to same-sex parties that will be able to make the wedding, it is the wife of the person Sharing my husband sex. So I don't give rise to the rights and duties in the law, the person who saw that the rights to research the family as a fundamental right, the state should be the protection of the people and of the equally. In the spouse of his spouse in accordance with the principles of a single (Monogamy) with free trade and imposes is not because of the sexual act in accordance with the principles of freedom of speech; (Freedom of Contract), so it should be to support development of a law, same-sex rights of a person to live together in my husband wife
2011 2012 and Region province 308,048 314,338 Whole Kingdom 42,316 45,064 Bangkok 86,787 88,569 Central Region 49,319 51,343 Northern Region 92,609 89,891 Northeastern Region 37,017 39,471 Southern Region
Recent Advances on Energy, Environment, Ecosystems, and Development
ISBN: 978-1-61804-291-0 87

IV.CONCLUSION
It has nothing to do with same-sex marriage. Simply put, firstly, marriage between persons who are in the same inborn sex is unauthorized by the law. Secondly, it does not establish any legal rights and duties of husband and wife as appear in Thai Civil and Commercial Code. Recommendations
In order to guarantee the right of same-sax relationship or same-sex marriage. The related law should be amended from “Marriage can be taken place between man and woman when both parties … ” to “Marriage can be taken place between persons when both parties …”. This provision encourages effective law enforcement in practice and in protection of persons without all form of discrimination including sexual issue.
ACKNOWLEDGMENT The author would like to express sincere thanks to Suan
Sunandha Rajabhat University for kindness and support to this paper.
REFERENCES [1] National Human Rights Committee, the Universal Declaration of
Human Rights, Bangkok: Office of National Human Rights Committee,
2550, Article 25 (2).
[2] Prayawinaisoontorn. Notes on Law of Husband and Wife, (Bangkok:
Pipattanakorn, 2472), p. 23.
[3] Civil and Commercial Code Book I-VI, Bangkok Artitaya Millionium,
2551, section 1457.
[4] Development on quality of life of civilians in Dusit Area, (Bangkok :
Research and Development Institue Suansunandha Rajabhat University ,
2557)
[5] Pridee Kasemsap. Philosophy of Law.1 1st Edition.Bangkok: Thammasat
University, 2553p. 190 - 197.
[6] Ibid, 2553, p. 199 - 205.
[7] Prasopsuk Bundech, Ibid, p. 148.
[8] W. Suridechakul, (2014). The Potential of Social Factors to the quality
of life of people in Dusit Community, Bangkok. International Science
Index Vol 8. No.8 (596-598).
Recent Advances on Energy, Environment, Ecosystems, and Development
ISBN: 978-1-61804-291-0 88

Abstract— The mass amount of industrial emissions of Volatile Organic Compound’s (VOC) is very small compared to other pollutants like sulphur, heavy metals, dust or oil. But due to the reactivity even a small amount of organic compounds can have a significant effect on water and air pollution. Denuders are used since long time in air quality analysis as a sampling tool for VOC’s. Lately denuders have also proven to be useful for sampling organic compounds in water. The biggest chemical complex in Romania operates a prominent Oxo-Alcohol and causes significant emissions of aldehydes. The paper shows the theoretical basis of the use of denuders and why aldehydes are a relevant pollutant in air and water. Denuders are used in a study to investigate the relation between emissions of aldehydes from a chemical complex and the relevant imissions in the river Olt.
Keywords— Volatile Organic Compounds, Aldehyde, Denuder
I. INTRODUCTION
Together with the industrial development the awareness of the Romanian society for environmental protection has increased steadily. “Visible” pollution like smoking exhaust gases, smell in the air or litter pollution of surface water has raised most of the public concerns so far. Until the 1960s only dust-, sulfurdioxid- and nitrous oxide emissions have been considered. Since then a number of VOC’s (Volatile Organic Compounds) like aldehydes, amines and cyclical hydrocarbons have been added to the list of monitored substances. These substances are dissolved easily in water or get adsorbed at particles. The chemical reactions of these substances are difficult to be monitored. That’s why the primary emissions should be monitored at first hand. Denuders shall be used to sample both, direct emissions of aldehydes and the imissions into the river Olt. To sample directly at the production site a new sampling device has to be constructed. For constructing this device the high temperature, moisture and particle content in the exhaust gas of the Oxo-Alcohol production has to be considered.In parallel the corresponding emissions in the river Olt are measured using denuders as sampling device. The idea is to get a direct correlation between the operation of the chemical complex and the pollution of the river Olt with aldehydes.
F. O. Pfann , Head of sub Region Southeast Europe at Linde Gas, Timisoara, Romania ( e-mail: [email protected] ).
S. C.Badaluta Minda , “Politehnica” University of Timisoara, Hydrotechnical Department, Timisoara, Timis, 300022, Romania (corresponding author to provide e-mail: [email protected] ).
T. Gh. Cretu, “Politehnica” University of Timisoara, Hydrotechnical Department, Timisoara, Timis, 300022, Romania (e-mail: [email protected] ).
II. BACKGROUND
After a decade of strong economic growth also the environmental pollution resulting from industry and traffic has significantly increased in Romania. As emissions mainly greenhouse gases like CO2, NOX and Methane are measured. The concentration in the air of none of these substances could be reduced during the last decades (see Fig. 1-3).
Research on monitoring of the emitted aldehydes from a fixed source in the water
course
O.Pfann, C. Badaluta Minda, Gh. Cretu
Recent Advances on Energy, Environment, Ecosystems, and Development
ISBN: 978-1-61804-291-0 89

Fig. 1 evaluation of CO2-content in atmosphere
Fig. 2 evaluation of Methan-content in atmosphere
Fig. 3 evaluation of NOX-content in atmosphere
Recent Advances on Energy, Environment, Ecosystems, and Development
ISBN: 978-1-61804-291-0 90

Fig. 4 evaluation of Hydrocarbon-content in atmosphere
Only the content of organic compounds (hydrocarbons) could be reduced due to new filter technologies and the usage of new catalysts, in traffic and in industry (Fig. 4).Aldehydes have hardly been considered as pollutant so far and the emissions are very small in respect to the share of mass of the total emissions. On the other hand they have a considerable effect on numerous chemical reactions in the atmosphere and surface water. [1]Aldehydes are formed through oxidation of primary alcohols. An oxidation means the substitution of 2 hydrogen atoms. This reaction has also leaded to the name for the aldehydes: („Alcohol dehydrogenatus“). Following common particular characteristics in the molecular structure aldehydes can be divided into different groups:
Table 1 groups of Aldehydessaturated unbranched or branched aliphatic aldehydes (IUPAC
name: n-and i-alkanals) such as Methanal (older name: formaldehyde), n-hexanal, 3-methylbutanal, 2-ethyl hexanalsaturated cyclic aldehydes, for example Cyclohexylmethanalaromatic aldehydes such as, for example Phenylmethanal (benzaldehyde) and unsaturated cyclic aldehydes as 2-Furylmethanal (furfural)mono- or polyunsaturated aldehydes (alkenals, Alkadienale) such as propenal (acrolein), trans-Butenal (crotonaldehyde), 3-phenylpropenal (cinnamaldehyde)polyvalent aldehydes (Alkandiale) such as ethanedial (glyoxal), propandial (malondialdehyde), Pentandianal (Glutaraldehyd)
Aldehydes are partly emitted from natural sources like plants or forest fires. The main shares are man-made, mainly from combustion processes. [8]
Table 2 aldehyde emissionsCombustible Firing Emissions (g/GJ)
Gas Industry 1,2
Oil Good combustion 2,6
Bad combustion 7,1
Coal Good combustion 0,07
Bad combustion 0,1
An important source for aldehydes is the road traffic. Cars with diesel motor achieve better results than those with gasoline motor. In average the share of Formaldehyde is 60% of the total aldehyde emissions, while Acetaldehyde represents 12%. Estimations in the USA amount to 65.000 tons/year total aldehyde emissions from road traffic, 54.000 tons/year from combustion processes and 23.000 tons/year from other industrial processes.The whole carcinogen potential of aldehydes is not yet fully explored. For some of the aldehydes exists more detailed data, such as Formaldehyde which has the following effects:
Table 3 effects of exposure to aldehydes
Concentration mg/m3 Exposure time
Remark
1.100 30 min 50% of rats died
25 1 minlonger stay for humans impossible
11 10 min hard to withstand
2,4-4 till 8honly small irritations to eyes and nose
13-26 10 min difficulties to breathe
In connection with this alcohol production also significant quantities of aldehydes are emitted into the atmosphere. The actual situation gives the chance to measure the increase of the imissions simultaneous with the putting in function of the chemical production. The time span between emission and entry into the river Olt will allow conclusions in regard to the chemical effects happening. The following aldehydes can be measured in water: Formaldehyde, Acetaldehyde, Propionaldehyde, Butyraldehyde, Valeraldehyde, Hexanat and Acrolein.The total man-made influence on the aldehyde-contamination
Recent Advances on Energy, Environment, Ecosystems, and Development
ISBN: 978-1-61804-291-0 91

cannot be established. But with analysis of the headwaters of the Olt River and directly after the city the effect of a locality can be captured.With the Directive 2000/60/EC, the EU has created in 2000 a comprehensive scheme for the sustainable use and protection of inland surface water, groundwater and coastal waters to protect the environment and improving the status of aquatic ecosystems. The directive is intended to gradually improve the waters and all member states should reach at least a good water status.
III. EXPERIMENTAL
To capture emissions of volatile organic compounds Denuders are used successfully since a long time. The principle is based on the fact that within a laminar flow small particles and gases diffuse faster lateral to the flow than bigger particles due to the higher diffusion coefficient. At two particles with a diameter of 1 nm and 10 nm the diffusion coefficient of the smaller particle is 100 times higher. If you coat the surface so that analyze is adsorbed selectively organic compounds can be separated from the flow. By this is built up a concentration gradient [2, 3] that keeps the diffusion to the denuder walls running (Fig. 5).
Fig. 5 diffusion of particles
Fig.6 sampling tool
The diffusion can be described with the kinetic theory. Main influence factors are temperature and mobility of the particles[3]
T · B ·k D = (1)Where: D - Diffusion coefficientk: Boltzmann constant (1,38 · 10-23 J/K)T:TemperatureB:Particle mobility
And
rnr
br
Qr
A
⋅⋅⋅
⋅−⋅⋅+⋅+= ~6
))(exp()()(1 B
π
λλλ (2)
Where: A, Q, b - Empiric constantsr -Particle radiusλ- Avg. free space
n~ - Viscosity of the mediumAs you can see from the equation the particle mobility and by this the diffusion coefficient increases with reduced particle radius. The equation is valid for particles < 2 µm and only at laminar flow, this means a Reynolds-coefficient below 2000. At a turbulent flow the lateral move is motivated by the flow rather than by diffusion. With known diffusion coefficients the adsorption efficiency can be defined. In Figure 7 the adsorption efficiency of a 50 cm long tube with a diameter of 0,6 cm and a flow of 40 l/h can be seen.
Fig. 7 adsorption of particles in a tube [6]
It can be clearly seen that the adsorption decreases by particles with bigger radius and is then increasing again. This increase is due to sedimentation and can be calculated as follows [7]
3
1
3
1
3
1
3
2
0
1arcsin12(2
1 Θ−⋅Θ−Θ+Θ−⋅Θ⋅⋅−=πN
Ne (3)
With
wd
lvs
⋅⋅⋅⋅=Θ
4
3 (4)
Where: sv - sedimentation speedl: Tube lengthd: Tube diameterw : Avg. linear speed Bigger particles can be either separated before or the denuder has to be mounted vertical to avoid unwelcome mass loss. At the river Olt have been selected 4 measuring points within a distance of 20 km. At this measuring points are taken samples every second day for a period of 2 months to create a profile of the aldehyde concentration without the chemical complex in operation. Simultaneous with the restart of the chemical plants the effect on the contaminations of the river Olt will be measured. Therefore in December, when planned restart is carried out, similar measures will be conducted to measure the time gap
Recent Advances on Energy, Environment, Ecosystems, and Development
ISBN: 978-1-61804-291-0 92

between emissions from the pollutant and their deposit into the river Olt.For the measurement of the emissions of aldehydes out of the chemical plant there exist appropriate analytical methods, but no standardized method for sampling. Because the aldehydes have, depending on the matrix in which they occur, gaseous, adsorbed at particles or dissolved in droplets, different toxic potential it is desired to capture the aldehydes according to their phase. For measuring imissions Denuders are used successfully since a long time. The principle is based on the fact that within a laminar flow gases diffuse based on their high coefficient for diffusion faster lateral to the flow than particles.Also for the ongoing analysis of the samples of water from the River Olt are used Denuders. The selected annular denuders are made of sandblasted glass. The tubes are hold together by attached glass sparkles. The adsorbed aldehydes are extracted from the Denuders with nitric acid. The analysis itself is done by photometry.
IV. RESULTS. CONCLUSIONS
Daily measurements throughout the year 2010 have shown the following emissions of aldehydes from the chemical complex:
Fig. 8 aldehyde-emissions in µg/m3
During September and August 2010 a total number of 120 samples have been taken from the river Olt to see if there can be detected a contamination with Aldehydes. Following Aldehydes have been considered in the analysis: Formaldehyde, Acetaldehyde, Propionaldehyde, Hexanal, Aceton, Benzaldehyde, Decanal, Furaldehyde. All the analysis done so far show that the content of all aldehydes in the Olt is currently below the detection limit of 400 µg/dm3.It is shown that other aldehyde sources like traffic or combustion processes have no significant effect and no imissions in the river Olt could be proven. In order to exclude any mistake in the sampling process or the analysis a double check with an external laboratory from Germany has led to the same results.It has to be considered that the heating season in winter had not started when the sampling in the river Olt was carried out.The results can be used to develop recommendations to
reduce the emission of aldehydes in order to minimize negative effects on surface water and nature.
REFERENCES
[1] P. Kirschmer, “Aldehydes in air“, in Analusis Magazin, vol. 20, 1992, pp. 48-50[2] D. Klockow “ Zum gegenwärtigen Stand der Probenahme von Spurenstoffen in der freien Atmosphäre“, Fres. Z. Anal. Chem, 1987, pp 326[3] R. Niessner, M. Maleiczyk, M. Schilling, D. Klockow, “Die Diffusion als Probenahmeprinzip zur Gas/Partikel-Trennung“, Aktuelle Aufgaben der Messtechnik in der Luftreinhaltung, VDI-Berichte, Nr. 608, VDI-Verlag Düsseldorf, 1987[4] A. Einstein, “ Zur Theorie der Brown’schen Bewegung“, Annalen der Physik, 19, 1906 [5] P.G. Gormley, M. Kennedy,” Diffusions From a Stream Flowing Through a Cylindrical Tube”, Proceedings of the Royal Irish Academy, 52 , 1948[6] M. Malejczyk, “Beiträge zur Analytik atmosphärischer Stickstoff – Sauerstoff – Verbindungen. Universität Dortmund, Dissertation, 1987[7] M. Possanzini, “New Design of a High – Performance Denuder for the Sampling of Atmospheric Pollutants” , Atmos. Environ., vol. 17, 1983[8] F.J.C. Roe, D. Wood, “Acetaldehyde and Formaldehyde: Is There a Cancer Risk for MAN?”, Indoor Environment, 1 1992[9] D.R. Worsnop, M.S. Zahniser, C.E. Kolb, “Uptake of Gas – Phase Aldehydes by Water Surfaces”, J. Phys. Chem., vol. 96, 2008[10] J.P. Garcia, S.Beyne–Masclet, G. Mouvier, P. Masclet, “Emissions of Volatile Organic Compounds by Coal – Fired Power Stations”, Atmos. Environ., 26A, 1992[11] V.M. Brown, D.R. Crump, M.A. Gavin, D. Gardiner, “ Aldehydes in the Non-Industrial Indoor Environment”, Royal Society of Chemistry, Spec. Publ., 108, 2004[12] P. Kirschmer, “Messverfahren mit automatisierter Probenahme zur Bestimmung von Aldehyden in der Luft“, LIS-Berichte, 92 , 2009[13] G.Kallinger, “Entwicklung einer diffusionskontrollierten Probenahme von C1-C4 Aldehyden zum Einsatz in der Emissionsüberwachung“, LMU, 2004[14] C. Badaluta Minda, Gh. Cretu, bazele gospodaririi apelor, Orizonturi universitare, 2010[15] A. Varduca, “Monitoringul integrat al calitatii apelor”, *H*G*A*, 1999
Recent Advances on Energy, Environment, Ecosystems, and Development
ISBN: 978-1-61804-291-0 93

Abstract— This research is the study of the affecting factors
of decision making of study in Suan Sunandha Rajabhat University : A Case study Bachelor of Arts Program in Tourism Industry and Hospitality Management. The Objectives are (1) to study the level affecting factors of decision making of study in Suan Sunandha Rajabhat University Bachelor of Arts Program in Tourism Industry and Hospitality Management. (2) to study the affecting factors of decision making of study in Suan Sunandha Rajabhat University Bachelor of Arts Program in Tourism Industry and Hospitality Management. The sample of students in Tourism Industry and Hospitality Management the first year. (University students 300 research questionnaire). The data were analyzed to determine the frequency , percentage, mean and standard deviation of the static tests and the relation of the course syllabus followed by the image, the public education, the place , the cost of education , the personal and the procedure provides factors respectively. By using hypothesis testing to determine the value of the Pearson correlation coefficient (Pearson’ s Correlation).
Results of study . (1) The affecting factors of decision making of study in Suan Sunandha Rajabhat University Bachelor of Arts Program in Tourism Industry and Hospitality Management. Students focus on the factors of course. Because the course is interesting and Corresponding to the desired career after graduation. The course also provides learners develop and enhance the teaching efficiency. followed by the image, the public education, the place , the cost of education , the personal and the procedure provides factors respectively. (2) The factors are the course, the image, the public education, the place , the cost of education , the personal and the procedure provides affecting of decision making of study in Suan Sunandha Rajabhat University at Bachelor of Arts Program in Tourism Industry and Hospitality Management. Relationship significant at 0.01 level statistically.
Keywords— Affecting factor of decision making of study , Suan Sunandha Rajabhat University, Bachelor of Arts Program in Tourism Industry and Hospitality
Poonsup Setsri is Tourism industry subject, Faculty of Humanities and
Social sciences, Suan Sunandha Rajabhat University Tel.+662-160 1539 mobile+6681-9012928E-mail:[email protected], [email protected].
Asst. Prof. Chantouch Wannathanom is prefacer at Tourism Industry, Faculty of Humanities and Social Science, Suan Sunandha Rajabhat University. Bangkok, Thailand. (phone: +662-160-1548; Mobile: +668106448199; Email: [email protected], [email protected])
Sujitar Rimdusit is prefacer at Tourism Industry, Faculty of Humanities and Social Science, Suan Sunandha Rajabhat University, Bangkok, Thailand. (phone: +662-160-1549; Mobile: +66859935609 Email: [email protected], [email protected]).
I. INTRODUCTION UAN Sunandha Rajabhat University opened Learning teaching service in Bachelor degree, Master degree and
Doctoral degree level, both regular and special semester, with various curriculas more than 50 subjects and students can choose in many ways such as by On line, e-learning. University managed internet system, intranet, and Wire-less campus guaranteed all points and Data base system. Official and research work will search On-line, student enrollment, confer of student ,registration, mark assignment, (grade), report of student result, payment total by On-line, also faculty is responsible to 15 subjects, in each subject will open teaching learning service for compatible with vision and mission of university and faculty [1].
Since 1986 Suan Suanadha Rajabhat University provided Tourism Industry one group. So disciplines can apply the knowledge to professionals in the tourism industry.
Since 2011 Suan Suanadha Rajabhat University provided Tourism Industry and Hospitality Management five group followed by Travel Agency, Airline Business, Health Tourism, Tourism Attraction Management and MICE, Event and Exhibition Management. Students interested in attending the primacy of the Faculty of Humanities and Social Sciences [2]. It is the reason to increase the number of students who want to attend to study in Suan Sunandha Rajabhat University. It is shown in table as below.
Fig. 1 Suan Sunandha Rajabhat University [3].
The affecting factors of decision making of study in Suan Sunandha Rajabhat University :
A Case study Bachelor of Arts Program in Tourism Industry and Hospitality Management.
Poonsup Setsri, Asst.Prof.Chantouch Wannathanom , Sujittra Rimdusit
S
Recent Advances on Energy, Environment, Ecosystems, and Development
ISBN: 978-1-61804-291-0 94
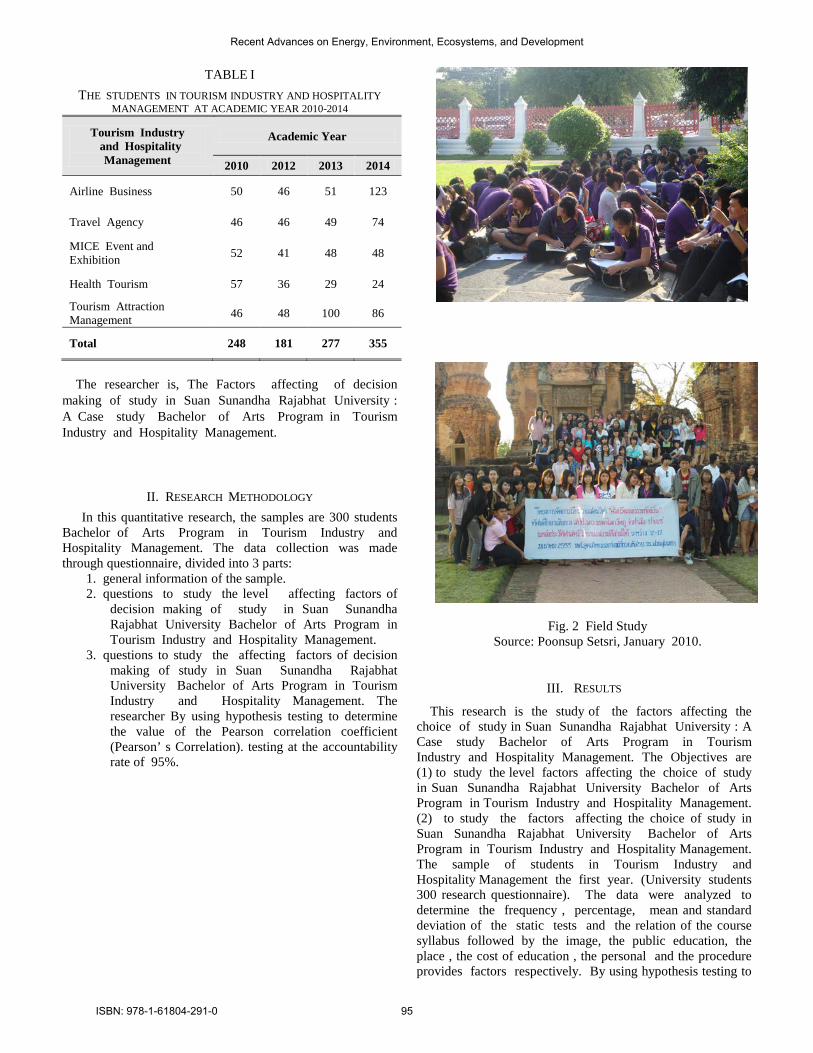
TABLE I THE STUDENTS IN TOURISM INDUSTRY AND HOSPITALITY
MANAGEMENT AT ACADEMIC YEAR 2010-2014
Tourism Industry and Hospitality
Management
Academic Year
2010 2012 2013 2014
Airline Business 50 46 51 123
Travel Agency 46 46 49 74
MICE Event and Exhibition 52 41 48 48
Health Tourism 57 36 29 24
Tourism Attraction Management 46 48 100 86
Total 248 181 277 355
The researcher is, The Factors affecting of decision
making of study in Suan Sunandha Rajabhat University : A Case study Bachelor of Arts Program in Tourism Industry and Hospitality Management.
II. RESEARCH METHODOLOGY In this quantitative research, the samples are 300 students
Bachelor of Arts Program in Tourism Industry and Hospitality Management. The data collection was made through questionnaire, divided into 3 parts:
1. general information of the sample. 2. questions to study the level affecting factors of
decision making of study in Suan Sunandha Rajabhat University Bachelor of Arts Program in Tourism Industry and Hospitality Management.
3. questions to study the affecting factors of decision making of study in Suan Sunandha Rajabhat University Bachelor of Arts Program in Tourism Industry and Hospitality Management. The researcher By using hypothesis testing to determine the value of the Pearson correlation coefficient (Pearson’ s Correlation). testing at the accountability rate of 95%.
Fig. 2 Field Study Source: Poonsup Setsri, January 2010.
III. RESULTS
This research is the study of the factors affecting the choice of study in Suan Sunandha Rajabhat University : A Case study Bachelor of Arts Program in Tourism Industry and Hospitality Management. The Objectives are (1) to study the level factors affecting the choice of study in Suan Sunandha Rajabhat University Bachelor of Arts Program in Tourism Industry and Hospitality Management. (2) to study the factors affecting the choice of study in Suan Sunandha Rajabhat University Bachelor of Arts Program in Tourism Industry and Hospitality Management. The sample of students in Tourism Industry and Hospitality Management the first year. (University students 300 research questionnaire). The data were analyzed to determine the frequency , percentage, mean and standard deviation of the static tests and the relation of the course syllabus followed by the image, the public education, the place , the cost of education , the personal and the procedure provides factors respectively. By using hypothesis testing to
Recent Advances on Energy, Environment, Ecosystems, and Development
ISBN: 978-1-61804-291-0 95

determine the value of the Pearson correlation coefficient (Pearson’ s Correlation).
Results of study .
1. The most students were female 60 percentages. They were student are choice of study in Airline Business and Tourism Attraction Management the most for 65 percentages. The cost of education of relate 5,000 Baht the most for 67 percentages. They were student come from Central region in Thailand the most for 63 percentages. Moreover , they were student is the study in bachelor of Arts program in Tourism Industry and Hospitality Management at parent the most for 86 percentage. It is shown in table as below.
TABEL II GENERAL INFORMATION OF THE SAMPLE
General Information
Percentage
Sex Male Female
40 60
The Group in program Airline Business Travel Agency MICE Event and Exhibition Health Tourism Tourism Attraction Management
30 15 30 10 15
The cost of expense education Less than 5,000 baht 5,001-15,00 baht 10,001-15,000 baht More than 15,001 baht
67 20 8 5
Birthplace The Northern part The Northeast part The Central region part The Southern part
7
10 63 20
Occupation Business Employee Privet Company Employee Government Employee
63 14 23
The Factors of personnel Parent Friend Alumnus Senior
86 6 4 4
2. The affecting factors of decision making of study in Suan Sunandha Rajabhat University Bachelor of Arts Program in Tourism Industry and Hospitality Management. Students focus on the factors of course with mean of 4.09 to high level. Because the course is interesting and Corresponding to the desired career after graduation. The course also provides learners
develop and enhance the teaching efficiency. followed by the image with mean of 4.05 to high level, the promote of education with mean of 3.90 to moderate level, the place with mean of 3.78 to moderate level , the cost of education , the personal and the procedure provides factors respectively. The table below.
TABEL III THE LEVE AFFECTING FACTORS OF DECISION MAKING
The affecting factors of decision making of
study in Suan Sunandha
Rajabhat University Bachelor of Arts
Program in Tourism Industry and Hospitality
Management
Mean ( X )
S.D. Level
The factors of course 4.09 .69 High The factors of cost of education
3.90 .95 Moderate
The factors of promote of education
3.90 .95 Moderate
The factors of procedure
3.78 .87 Moderate
The factors of personal
4.05 .64 High
The factors of place 3.78 .87 Moderate The factors of image 4.05 .64 High
3. The factors are the course, the image, the public education, the place , the cost of education , the personal and the procedure provides affecting the choice of study in Suan Sunandha Rajabhat University Bachelor of Arts Program in Tourism Industry and Hospitality Management. Relationship singinficant at 0.01 level statistically.
IV. DISCUSSION
The affecting factors of decision making of study in Suan Sunandha Rajabhat University Bachelor of Arts Program in Tourism Industry and Hospitality Management. Students focus on the factors of course. Because the course is interesting and Corresponding to the desired career after graduation. The course also provides learners develop and enhance the teaching efficiency. followed by the image, the public education, the place , the cost of education , the personal and the procedure provides factors respectively. Consistent with the results of Songtham Teerakul (2010) Factors Influenced the Decision to Study the Graduate Level at Thaksin University [4].
The factors are the course, the image, the public education, the place , the cost of education , the personal and the procedure provides affecting the choice of study in Suan Sunandha Rajabhat University Bachelor of Arts Program in Tourism Industry and Hospitality Management.
Recent Advances on Energy, Environment, Ecosystems, and Development
ISBN: 978-1-61804-291-0 96
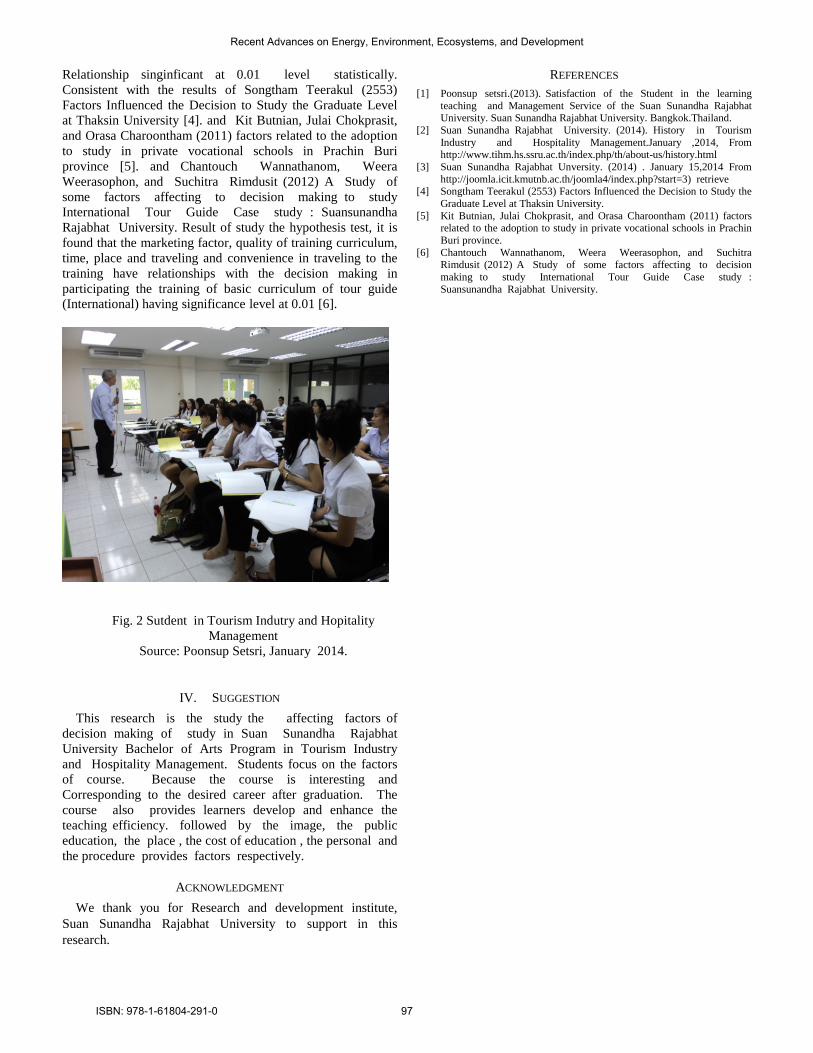
Relationship singinficant at 0.01 level statistically. Consistent with the results of Songtham Teerakul (2553) Factors Influenced the Decision to Study the Graduate Level at Thaksin University [4]. and Kit Butnian, Julai Chokprasit, and Orasa Charoontham (2011) factors related to the adoption to study in private vocational schools in Prachin Buri province [5]. and Chantouch Wannathanom, Weera Weerasophon, and Suchitra Rimdusit (2012) A Study of some factors affecting to decision making to study International Tour Guide Case study : Suansunandha Rajabhat University. Result of study the hypothesis test, it is found that the marketing factor, quality of training curriculum, time, place and traveling and convenience in traveling to the training have relationships with the decision making in participating the training of basic curriculum of tour guide (International) having significance level at 0.01 [6].
Fig. 2 Sutdent in Tourism Indutry and Hopitality Management
Source: Poonsup Setsri, January 2014.
IV. SUGGESTION This research is the study the affecting factors of
decision making of study in Suan Sunandha Rajabhat University Bachelor of Arts Program in Tourism Industry and Hospitality Management. Students focus on the factors of course. Because the course is interesting and Corresponding to the desired career after graduation. The course also provides learners develop and enhance the teaching efficiency. followed by the image, the public education, the place , the cost of education , the personal and the procedure provides factors respectively.
ACKNOWLEDGMENT We thank you for Research and development institute,
Suan Sunandha Rajabhat University to support in this research.
REFERENCES [1] Poonsup setsri.(2013). Satisfaction of the Student in the learning
teaching and Management Service of the Suan Sunandha Rajabhat University. Suan Sunandha Rajabhat University. Bangkok.Thailand.
[2] Suan Sunandha Rajabhat University. (2014). History in Tourism Industry and Hospitality Management.January ,2014, From http://www.tihm.hs.ssru.ac.th/index.php/th/about-us/history.html
[3] Suan Sunandha Rajabhat Unversity. (2014) . January 15,2014 From http://joomla.icit.kmutnb.ac.th/joomla4/index.php?start=3) retrieve
[4] Songtham Teerakul (2553) Factors Influenced the Decision to Study the Graduate Level at Thaksin University.
[5] Kit Butnian, Julai Chokprasit, and Orasa Charoontham (2011) factors related to the adoption to study in private vocational schools in Prachin Buri province.
[6] Chantouch Wannathanom, Weera Weerasophon, and Suchitra Rimdusit (2012) A Study of some factors affecting to decision making to study International Tour Guide Case study : Suansunandha Rajabhat University.
Recent Advances on Energy, Environment, Ecosystems, and Development
ISBN: 978-1-61804-291-0 97

Abstract—The main purpose of this research was to study how to communicate the identity of Samut Songkram province for tourism. The qualitative data was collected through studying related materials, exploring the area, in-depth interviews with three groups of people: three directly responsible officers who were five key informants of the district, twenty foreign tourists and five Thai tourist guides. A content analysis was used to analyze the qualitative data. The two main findings of the study were as follows:
1. The identity of Samut Songkram province. This establishment was near the Mouth of Maekong River for normal people and tourists, consisting of rest accommodations. There are restaurants where food and drinks are served, rich mangrove forests, Hoy Lod (Razor Clam) and Amphawa Floating Market. Don Hoy Lod, is characterized by muddy beaches, is a coastal wetland for Ramsar Site. It is at 1099th ranging where the greatest number of Hoy Lod (Razor Clam) can be seen from March to May each year. Moreover, Amphawa Floating market is an interesting floating market by the canal near Wat Amphawan Chetiyaram. 2. The communication of the identity of Samut Songkram province which the researcher could find and innovate to present in English materials can be summed up in 2 items: 1) The Learning source of tourism: Don Hoy Lod 2) Amphawa Floating market for tourism. KeyWords—foreigner tourists, signified, semiotics, innovation.
I. INTRODUCTION OURISM is an important industry because it creates income for developing countries [5]. Thailand realizes the
importance of continuously developing its tourism industry. The country supports and promotes many activities and projects with advertisements and publications geared toward people who are in this area. Also, Thai people are beginning to realize the importance of preserving their tourism resources and supporting tourism. The Ministry of Tourism and Sports said foreigners visited Thailand in 2014, with the East Asia (6.20 million), Europe (3.40 million), South Middle East (2.7 million), South Asia (0.95 million), followed by Oceania and Middle East (0. 49 million) [14]. This increase in tourists has boosted many local careers and income as well as helping develop the transportation, basic construction and public utilities in the local communities where tourism is important
Kitda Praraththajariya is at the Suansunandha Rajabhat University, Bangkok, Thailand (phone: +668 7694 6230; fax: +66 2160 1341; e-mail: [email protected]).
[13]. Tourism has been one of the most prominent to exist on the face of the globalization. Travelling, leisure and recreation have been significantly associated with tourism since people visited different places, exploring all sites for adventure and peace at the same time [12]. At the present, the tourism industry has changed because it has become more about experience packages. It is divided into different segments such as travelling, accommodations, meals and etc. [11].The local people are less likely to emigrate to other places with these improvements in their own area. Tourism in Thailand was recently affected by the changing world economy and natural disasters [2]. The Tourism Authority of Thailand has continuously encouraged Thais to understand their Thai identities and the value of their historical sites, culture and tradition.
The tourism resources have recently been moving toward sustainable tourism [4]. The tourism industry in Thailand has achieved this. At the present, there are many aspects to manage effectively including various signs to the important places [7]. There are some problems to group of tourists which are not clear such as signs to tell ways, signs for educational information of tourism sources. The location signs are only in the Thai language which can make it difficult for foreign tourists to understand. The information shows that the Thai identity is extremely necessary and important as a tourism resource. The way that the identity of the tourism resources is communicated is very important to help tourists understand and learn these ideals [10]. These groups are important to Thai tourism resources at Samut Songkram province. In this research, Samut Songkram province is identified by: the learning sources of the tourism: Don Hoy Lod and Amphawa Floating market. These topics are useful for both the Thai people and foreign tourists. The important problems took place at Samut Songkram province that the communication to foreigners in English is the least important [9]. These situations may reduce the number of foreign visitors. Because Thai people could not still communicate with the foreigner tourists by using the English language. This problem made the researcher do this research.
The Innovative Development of the English Materials to Communicate the Identity of Samut
Songkram for Tourism Kitda Praraththajariya
T
Recent Advances on Energy, Environment, Ecosystems, and Development
ISBN: 978-1-61804-291-0 98

For this research, the researcher chose Samut Songkram province to be the research area. This area is very interesting to foreign tourists and helps them understand Samut Songkram province. ICOMOS (The International Council on Monuments and Sites) tries to communicate new events in the communities and the past civilization at the same time [6]. This function was too plain for the both the Thai people and the foreigner's younger generations to learn. If the researcher had not explored the topic for this paper, it is possible the Samut Songkram province would not be understood this important tourism resource. Sumut Songkram province in Thailand is a historic site which identify Thai culture, tradition, ancient customs and life styles. These identify the identity of Samut Songkram provice. Moreover, this provice is an interesting historic site where the king of Rama II was born. It is impressed for Thai people. The researcher is an English teacher who is interested in finding the identities of Samut Samut Songkram province and the Innovative Development of the English Materials to Communicate Samut Songkram for Tourism
II. OBJECTIVES OF THE RESEARCH
1. To study the data and analyze the identities of the Identity of Samut Songkram province, for tourism. 2. To communication the Identity of Samut Songkram province, for tourism develop the sustainable materials as a communication some sustainable tourism.
Methodology The Innovative Development of the English Materials to Communicate Samut Songkram for Tourism. This research is qualitative research. The objectives of this research are the Innovative Development of the English Materials to Communicate Samut Songkram for Tourism.
Population and Samples
There are three groups of samples that are outlined in the following items: 1. The key informant group in Samut Songkram province is five persons: the chief persons and officers in Samut Songkram province. 2. The foreigner group is made up of ten people per day who visited Thailand. The researcher interviewed the thirty people for the foreigner group by the following criterions:
2.1 The foreigner group who had come in Samut Songkram province, Thailand more than one time.
2.2 The foreigner group who specially visited Samut Songkram province, Thailand, and did not go to any other places.
2.3 In this case for the foreigner group, if a group included two persons traveling together only one person was chosen for the interview.
There are also the following conditions: 1. The age of the tourists interviewed is more than twenty years old. 2. There are twenty foreigners tourists from Europe and Asia.
TABLE I
GROUP OF KEY INFORMANTS IN SAMUT SONGKRAM PROVINCE
General data of group of key informant
Gender
Age
Level of
Education F
M
26- 35
36-45
46-55
B
M
Key informant group in Samut Songkram province
3
2
1
2
2
2
3
Total 3 2 1 2 2 2 3 The five key informants had worked in Samut Songkram province for five years work experience. Their education graduated both Bachelor and Master Degrees.
TABLE II
GROUP OF FOREIGNER TOURISTS WHO CAME TO SAMUT SONGKRAM PROVINCE
The Europe tourists were four females and six males. They would like to visit in Samut Songkram, Thailand. The Europe females were more satisfied than the Europe males. For the Asia tourists were five both females and males. They would like to visit in Samut Songkram province both females and males. But the Asia females were more interested in visiting than the Asia males.
Samples group
Gender
Age
Times
Level of education
F
M
21 30
3140
41 50
51 60
1
2
B
M
Europe
Asia
4
5
6
5
4
3
2
1
2
2
2
4
7
8
3 2
7
8
3
2
Total
9
11
7
3
4
6
15
5
15
5
Recent Advances on Energy, Environment, Ecosystems, and Development
ISBN: 978-1-61804-291-0 99

TABLE III GENDER * COUNTRY CROSS TABLE
The females came from the Europe country to be four tourists were 20 % and the five females came from the Asia country were 25 %. Then, the six males came from the Europe country were 30 % and the five males came from the Asia country who were 25 %. They would like to visit in Samut Songkram province.
TABLE IV
AGE * COUNTRY CROSS TABLE
Country
Age
21 30
31 40
41 50
51 60
Total
Country Europe Count
% Within Country
4 20 %
2 10%
2 10%
2 10%
10 50%
Asia
% Within Country
3 15%
1 5%
2 10%
4 20 %
10 50%
Total Count % Within Gender
7 35%
3 15%
4 20%
6 30%
20 100%
There were the four Europe tourists who were between 21
to 30 years old. They were 20 %. There are also the two Europe tourists who were between 31 to 40, 41-50 and 51-60 years old. Each of them was 10 %. They visited in Samut Songkram province.
TABLE V Country * Level of Education CROSS TABLE Level of Education
Country
Total
Europe
Asia
Bachelor degree Count
% Within Bachelor degree
7 35%
3 15%
10 50%
Master degree Count
% Within Master degree
8 40%
2 10%
10 50%
Total Count
% Within Level of Education
15 75%
5 25%
20 100%
The foreigner tourists graduated both Bachelor and Master
Degrees to visit to Samut Songkram province. Firstly, the seven Europe tourists graduated Bachelor degree to be 35% while the three Asia tourists graduated Bachelor degree to be 15%. Then, the eight Europe tourists graduated Master Degree to be 40% while the two Asia tourists graduated Master Degree to be 10%.
TABLE VI
Times * TOURISTS CROSS TABLE
Foreigner Tourists
Times
Total
Once
Twice
Europe Tourists Count
% Within Times
7 35%
3 15%
10 50%
Asia Tourists Count
% Within Times
8 40%
2 10%
10 50%
Total Count
% Within Times
15 75%
5 25%
20 100%
The seven Europe tourists visited only once to be 35% and
the three Europe tourists visited twice to be 15 % in Samut Songkram province. The eight Asia tourists visited only once to be 40 % and the two Asia tourists visited twice to be 10 %. Most foreigner tourists would like to visit twice because they were satisfied to Thai ways, Thai food and Amphawa Floating Market.
Gender
Country
Europe
Asia
Total
Gender Female Count
% Within Gender
4 20%
5 25%
9 45%
Male Count % Within Gender
6 30%
5 25%
11 55%
Total Count % Within Gender
10 50%
10 50%
20 100%
Recent Advances on Energy, Environment, Ecosystems, and Development
ISBN: 978-1-61804-291-0 100

TABLE VII GROUP OF TOURIST GUIDES
There were five tourist guides. They had had the working experience in Samut Songkram province, Thailand since they were trainers. They were able to speak the English language clearly to explain about Samut Sonkram province to the foreign tourists and they also knew about Samut Sonkram province very well.
III. Delimitation of Research Proposal
Delimitation of Research Proposal During this research, the researcher conducted the study at
Samut Songkram province, Thailand, to study the data to analyze the identity and communication at Samut Songkram province, for ecotourism. This study was conducted from October 2013 to September 2014 by triangulation methodology such as observations, asking questions, taking notes on the data and checking documents.
Conceptual framework Literature Review was conducted on the theory of
sustainable tourism, the theory of communication, the theory of Semiology and other research for the conceptual frameworks for the following items:
The identities of Songkram province 1. The Learning source of Ecotourism: Don Hoy Lod 2. Amphawa Floating Market for tourism.
Research Instruments The researcher used the qualitative method for this research.
The research instruments consisted of in-depth interviews, direct observation and content analysis of written materials with the details below:
The interview was used in the unstructured-interview with both the Thai language and English language. The questions were divided by sample groups into the following items: Interview for key informant group in Samut Songkram province had two parts, each is listed below:
Part I General information of interviewers consisted of name, surname, gender, age, education, status, and position at Samut Songkram province.
Part II The Interview Questions are listed below: 1. The history of Samut Songkram province 2. The Learning source of Ecotourism: Don Hoy Lod
and Amphawa Floating market for tourism
Interview for tourist guides had two parts, each is listed below:
Part I General information of interviewers consisted of name, surname, gender, age, education, status, position at Samut Songkram province.
Part II The Interview Questions are listed below:
1. How do you know Samut Songkram province? 2. What is the identity Samut Songkram province according
to your own idea? Please give examples. 3. What do you want to communicate to others about Samut
Songkram province? 4. In what matters do foreign tourists recognize Samut
Songkram province 5. How can you help preserving Samut Songkram province
for sustainable tourism? 6. What are your suggestions to promote tourism at this
tourist attraction? 7. What are the problems that affect foreign tourists at
Samut Songkram province? 8. How do you keep Samut Songkram province for
sustainable tourism? 9. What are the big images of Samut Songkram province
according to you?
Observations Observations were collected to provide a content analysis of
written materials at Samut Songkram province. They consisted of the contents analysis to communicate about Samut Songkram province, Don Hoy Lod and Amphawa Floating market for tourism nearby environmental areas.
Records the conversation in a group
Workshop The data was collected from field trips and separated by
each categorical variables topic of research.
Taking notes The researcher took notes at each interview and used
equipment such as a recorder, a camera, etc.
Data Collection
1. Survey study The researcher collected the data by reviewing of literature
and documents related to surveyed areas and collected the data from literature that were related to surveyed areas of Samut Songkram province.
2. Key informants The researcher had an appointment with the five key
informants for in-depth interview at Samut Songkram province.
Sample group
Gender
Age
Working experience
Total
Group of Tourist Guides
M
F
25 35
36 45
2-5
6-10
3
2
3
2
2
3
5
Total
3
2
3
2
2
3
5
Recent Advances on Energy, Environment, Ecosystems, and Development
ISBN: 978-1-61804-291-0 101

3. Group of Tourists The researcher interviewed the tourists who visited Samut
Songkram province by interviewing thirty tourists from Europe and Asia.
4. Tourist guides The researcher asked the five tourist guides the following
questions in their interviews.
IV. ANALYZING THE DATA AND WRITING THE RESEARCH REPORT
The researcher collected the data from the interviews, studied the data and the documents and analyzed the content analysis. The researcher used the data of interviews from key informants, foreigner tourists and tourist guides. The researcher took photographs and recorded the documents. After that, the researcher gathered the conclusion from the answers and discussions in a research report following the conceptual framework and the theories outlined in this paper. The researcher described the report and related information in the content analysis. The foreigner tourists who visited to Samut Songkram province in Thailand twice came from Europe and Asia. They would like to visit again because they were satisfied with visiting Amphawa Floating market. Amphawa Floating market is an interesting floating market by the canal near Wat Amphawan Chetiyaram. They had never seen in their countries. Moreover, they enjoy having Thai food dishes such as seafood, Phat Thai (noodle), spicy hot soup (Tom Yam Kung) and Thai desserts. Thai desserts types were cooked here which were original recipes in Samut Songkram province. Thai people called Khanom Boran. It identified Thai culter in the past. Not only Thai food were cheap but also delicious, too. Furthermore, Don Hoy Lod was an interesting place to looking for Hoy Lod or razor clam. This place was famous about Hoy Lod or razor clam. The tourists were able to catch them from the muddy sand or walked and looked around this area. They could see how to catch them on the muddy sand. Don Hoy Lod was created by sedimentation of sandy soil at the mouth of the Mae Klong River. It occupies a vast area 8 kilometres wide and 5 kilometres long. Sedimentation of sandy soil or “Khee Ped Sand” as called by the local people. It occupies a vast area 3 kilometres wide and 5 kilometres long. There are divided into three places: the first place is Don Nok which is located at the mouth of Mae Klong Gulf. The second place is Don Nai which is located at Chu Chi village’s beach, Tambon Bang Cha Kreng and the last place is at Bang Bo Village’s Beach, Tambon Bang Kaeo. There are three channels on the sedimentation of sandy soil at the mouth of the Mae Klong River. The tide is occurred twice a day. The high tide flows to the north but the ebb tide flows to the south. Sometimes the tide may be changed a little bit by the wind. Don Hoi Lod was registered as an international wetland under the Ramsar Convention in 2001 with the 1099th ranking, A
lot of razor clams live in this area whereas is the most razor clams are found at the mouth of the Mae Klong River. Don Hoy Lod was a coastal wetland for Ramsar Site. It was at 1099th ranging where the greatest number of Hoy Lod (Razor Clam) could be seen from March to May each year. So Sumut Songkram province is well known about seafood, Hoy Lod (Razor Clam) from Don Hoy Lod, Ampha Floating market and firefly which is not far Bangkok.
V. DISCUSSION AND CONCLUSION This report analyzed “The Innovative Development of the
English Materials to Communicate SamutSongkram for tourism by the following two items: 1. The Learning source of Ecotourism: Don Hoy Lod 2. Amphawa Floating Market for tourism. The tourism has occurred because of the affections of the national resources [8]. It was a center of learning about natural resources, a pleasure to view the mangrove forest scenery, plants and animals including mangroves, cork trees and fireflies. They were found in Cembalos’ research, 2012. And Bushel's 'research in Interpretation in National Parks: Some Critical Questions [1]. Sustainable tourism is the application of the standards to sustainable development tourism. Besides, the individual communication gives a sense of judgment that is linked positively and negatively by oneself. The communication is well developed through what one sees with the art of perception on it [3]. The communication for the natural resources found that the communication should be geared toward tourism and stress the knowledge and the suggestions in the natural resources crossing the cultural divide: Western visitors and interpretation at Ayutthaya World Heritage Site, Thailand. The researcher found that the communication should show the highlight, preparing the manual for services and giving the information to the information center [7]. Moreover, it should create leaflets and a CD of Samut Songkram province. The communication should show meaning and important things which were found in [10]. [9] mentioned the communication showed the information and true facts. Offering every type of communication means giving the information and presenting it to natural sciences and history classes. It made the tourists feel better and better understand the contents. It increased the tourists’ morale to protect the natural environments for local persons, tourist guides and government officers who were responsible the natural resources [5]. The communication in the English language is very important for Samut Songkram province, for tourism. Studying the identities of the natural resources in the international language of English, made it easier for the foreign tourists to understand the identity of the natural resources in Thailand.
Recent Advances on Energy, Environment, Ecosystems, and Development
ISBN: 978-1-61804-291-0 102

Suggestion for the Next Research This research can be applied to the next research on other
natural resources or historical sites, tradition and culture where searches for the identity of local culture are needed any sites that is interested in ecotourism or sustainable tourism in the future would be a good location to study.
Fig. 1 Don Hoy Lod
Fig. 2 Razor clam (Hoy Lod)
Fig. 3 Hot spicy stirred – fry Hoy Lod
Fig. 4 Amphawa Floating Market in evening
Recent Advances on Energy, Environment, Ecosystems, and Development
ISBN: 978-1-61804-291-0 103

Fig. 5 Amphawa Floating Market
Fig.6 Amphawa Floating market
Fig.7 Firefly in Amphawa district
Fig.8 Thai desserts: Foy Thong, Thong Yip, Luk Choob and Mek Khanun
Recent Advances on Energy, Environment, Ecosystems, and Development
ISBN: 978-1-61804-291-0 104

VI. ACKNOWLEDGMENT This research “The Innovative Development of the English
Materials to Communicate Samut Songkram for tourism” This research would not have been possible without the
guidance and the help of several individuals who in one way or another contributed and extended their valuable assistance in the preparation and completion of this study.
This research was support by The Research and development institute, Suan Sunandha Rajabhat University Bangkok, Thailand.
Furthermore, the researcher would like to say thank you once more to acknowledge the key informants, the foreigner tourists and the tourist guides. They are very important persons who help me success my research.
REFERENCES [1] Bushel, E. (2014). Planning for tourism. Retrieved May 20, 2014, fromhttp://www.en.wikipedia. Org/wiki/boo_elisabeth. [2] Chetanont, S. (2014). Marketing Planning Strategy to Promote Family Agro-Tourism: A Case Study of Bang Nam Phueng Community Prapradeang District, Samutprakarn Province [3] Communication Theory. (2015). Retrieved March 27, 2015,
from http://www. www.researchomatic.com/communication-theory 182748 [4] David, E SR & Sung C. K.(2011). Managing ecotourism: A Legacy for the Future. New York: Haworth Press. [5] Gee, Chuck Y., James C. Makens and Deriter J. L. Choy. (20147). Travel industry. NewYork: John Wiley and Sons. [6] ICOMOS Charter for the interpretation and presentation of cultural heritage sites. Retrieved March 28, 2015, from http://www.icomos.org. [7] Lisa, K. (2014). Sustainable tourism. Retrieved September 20, 2014, from http// ww.naturevacations.com/blog/costa-rica-eco-travel. [8] Mc Intosh, Robert W., Goeldner Charles R, and Ritchie Brent. J.R. 2014. Tourism: principles, practice and philosophies (7th ed.). New York: John Wiley & Sons. [9] Praraththajariya,K.(2010).The Design of English Materials to communication the Identity of Bangpoo, SamutPrakran Province, for Sustainable Tourism. [10] Praraththajariya,K.(2011).The Design of English Materials to communication the Identity of Amphawa District, Samut Songkram Province, for Sustainable Tourism. [11] Saayman, M.& Slabbert, E. (2015). Travel and Tourism Entrepreneurs. Retrieved March 27, 2015, from http://www. [12] Sustainable Tourism. (2015). Retrieved March 27, 2015, from
http: www.researchomatic.com/Sustainable-Tourism- 147360 [13] Tilden, F. (20143). Semiotics. Retrieved March 20, 2014, from http:// www. wikipedia.org/wiki/Tilden_Ferdenansis. [14] Tourisms and Sport Ministry.(2014). Retrieved March 20, 2014, from http// www.mots.go.th/main.php?filename =index__EN [15] Wikipedia. (2015). Tourism. Retrieved March 27, 2015, from http://www.en.wikipediaorg/ wiki/eco-tourism.
Recent Advances on Energy, Environment, Ecosystems, and Development
ISBN: 978-1-61804-291-0 105

Abstract— Problems of resource management in community in
current conditions were more conflict between government and community. It was essential to have a sustainable community development model in order to be a guideline for application of community action. The purposes of this research were to construct and develop the community sustainable development model in Dusit District Community. The subjects used in the research, the selected through purposive sampling, consisted of successful community in sustainable community development in Dusit District Community (100 people in total). The instruments used for collecting the data were an interview form and a rating scale questionnaire. The statistics were used for analyzing the data percentage, mean, standard deviation (S.D), median and quartile range. The research findings reveal that most of the representatives of the community who had participated the sustainable development project were male. They were 31 - 40 years of age (32.5 percent), got married (62 percent), graduated from elementary school (37.5 percent), and average income got over 5,000 Baht per month (49 percent). The following three key factors affecting sustainable development community were Community business management, social management, and environmental management. There were eight steps of sustainable community development model in Dusit District Community study, community problem analysis, community needs and problems ordering, problem solving plan, consideration for conducting, conducting, work evaluation, and revision for problem-solving and obstacles in order to be accepted by the experts based on the criteria (Mdn.> 3.50 and IQR < 1.50). This indicates that the model was suitable for sustainable community development in Dusit District Community.
Keywords—Sustainable community development, Local
administration organizations
I. INTRODUCTION
NDER the direction of the developing countries to economic growth and industrial cause problems with
public resources with local communities are dependent on cultural resource management for living together with State Capital Group created the wealth of resources in the development of local communities and to lose resources, which is a major factor in the lives of the people in the community and contribute to the Cultural Foundation of the community of the problem of poverty and the social rolling up from the problem and made social movements of the
Dr.Wasana Suridechakul is the lecturer in the Faculty of Humanity and Social Science, Suan Sunandha Rajabhat University, Bangkok, Thailand 10300 (e-mail: [email protected], [email protected]).
community for the protection of the rights and liberties of the community, the economy, society, and environment in accordance with their rights and duties in the Constitution of the Kingdom of Thailand B.E. 2550 section 12 community rights section 66 provided that the person, as well as a local community or a local community traditional community shall have the right to conserve or restore tradition, local knowledge and culture as well as of local and national and participate in the management, maintenance and exploitation of the natural resources and environment, as well as balance of biodiversity and sustainable and Section 67 provided that the rights of a person to give the state and the community in the conservation of natural resources maintenance of biodiversity in the protection, promotion and preservation of the quality of the environment for their livelihood for regular and continued in the environment which is not hazardous to their health welfare or quality of life shall be protected in accordance with the appropriate. [1-8]
United Nations has been assign the policy of the in century 2005-2014 is a decade of education for sustainable development by the idea of sustainable development is "development must be balanced between the economy and nature" and "Sustainable Development will need to balance between the economy and sustainable culture" and in accordance with the master plan the other countries signed a bond in case of Brazil on June B.E. 2535. Defines a sustainable development as development that meets the needs of the current generation without disturbing the development potential of the new generation of key elements in the future of sustainable can be divided into a 3-dimensional, the economic dimension of social and natural resources and the environment through the development of sustainable development should be a combination of the economic, social and ecological system to go with it. Without a balanced conflict each other the development of the national sustainable development in the context of Thailand has a basic idea of sufficiency economy philosophy [19], the importance of a balanced development of the social, economic and environmental aspects of development, 3-D will need to help each other and do not conflict with the goal of the development of 4 as follows :
1) Quality : there is a better quality of life. 2) Stability and adjustment : economic stability and growth
in the domestic and external level.
Dr.Wasana Suridechakul
Factors Affecting Sustainable Community Development: A Case Study of Dusit District
Community.
U
Recent Advances on Energy, Environment, Ecosystems, and Development
ISBN: 978-1-61804-291-0 106

3) The distribution of development, fairness : a population of sexual equality and occupational income. The study of the basic needs of living and social basic services.
4.) The system has a good management : Population all sectors of society have the opportunity and the right to information and public policy decision-making process to the public, through the management and the cooperation of financial institutions. The integrated social, economic and political environment in a serious as well as to the cause of the community choice in the lives of so many forms of reliance by the villagers caused the sustainable skills in reliance on the combination of knowledge and be able to have many of the people live on the base of the family and relatives. At present, there are many communities that exist in a sustainable community, including Don rattan market in Nakhon Pathom community market 100 years Suphan Buri province Community bank community crab volumes were intrigued war city community District, oven temperature range (loosely) a Dusit District and many other communities in the life of the community in a sustainable system. Use the reliance and the reliance on each other in the process of wisdom. In the society of the community from the former co-developed the management system and the research, realized the importance of the development of sustainable communities, so the research is of interest to study the factors that affect the community in a sustainable development with the analysis and documentation and to remove synthetic knowledge in community development in a sustainable management in Dusit District by using a Delphi technique, so that the research results of this study will be valuable in accordance with the objectives and policies of the local government and the community to develop their own communities and sustainable community development in a sustainable way and performance in other community development operations.[9-15].
II. METHODOLOGY
A. OBJECTIVE OF THE STUDY
1.To study factors affecting sustainable community development of Dusit District community.
2.To find the model and development model of sustainable community development.
B. HYPOTHESIS FOR STUDY
The model of sustainable community through the criteria considered by the experts that is specified is (Mdn > 3.50 and IQR<1.50 ).
C. TOOLS USED IN THE RESEARCH
Scope of research The aim of this research is to learn specific information in
Dusit District Community action community development in a sustainable information that will lead to the creation of the format of the research and development, so it is necessary to
learn to conduct development to lead to sustainable community development in a sustainable community, a new concept of knowledge will be more consistent with the target group research has limits.
The research is as follows: 1. The research community is in Dusit District. 2. The variables used in the Research are :
2.1 Variables is the beginning of community development in a sustainable way.
2.2 Variable is the result of the development of sustainable community development.
How to do research This research is carried out as follows : 1. Population and sample group population. The population used in this research consists of population
for developed a variety of community development and sustainable growth in the User research has created and developed by : a successful community in the community in a sustainable development in Dusit District.
sample group That is used to make the selection from this research group.
The above population by selecting a specific (Purposive Sampling) is a representative to join the program at a community of 100 people, as well as all the criteria considered. The chosen features are as follows:
1) is a person who has a role or participation in the development of communities, success in community development sustainable from the start.
2) is a person who lived in the community and continue to do so, in the face of community development continuously.
3) is a specialist in the development of communities in a sustainable selection from the person on duty at the development.
It is a community that has accepted the knowledge and experience of community development and a consultant is not less than 10 years.
2. Tools used in data collection. 2.1 the tools used in this research include 2.1.1. tools for data collection in the form of a draft
sustainable development from a community representative of the 100 people who are in-depth interviews, a structure, and there is no structure.
2.1.2. tools used to develop a sustainable community development by using a Delphi Technique include:
1) a draft format for the development of communities in a sustainable in Dusit District
2.) survey of the opinions of experts about the and the right to be of the community in a sustainable development in Dusit District
2.2 tools to create There is an interview with a structure (Structured Interview). A Opened-End interview with a successful community representative in the development of communities in a sustainable by the opportunity to be able to answer an interview with a very independent character concept is the question because, why, What with clear layout interview. Draft model of development in a sustainable community in Dusit District.
There is a process as follows:
Recent Advances on Energy, Environment, Ecosystems, and Development
ISBN: 978-1-61804-291-0 107

1) Synthetic analysis document research and theory, that is associated with the development of communities with
1.1) The theory that public participation in the development
Includes the theory of persuade the masses to using the methods and systems of the funding to create the gift theory, theory to change attitudes theory and theory of economic development.
1.2) The community development. 1.3) Target of the community development. 1.4) Features, the distribution of the accepted 1.5) Community development process 1.6) The assessment. 1.7) And other documents 2) Workshop in a sustainable community development by
A representative of the community and a representative from the organization carrying out their duties in the organization which is how to do this as follows:
2.1) To study and analyze the information in Dusit District community.
2.1.1.) Study community problem analysis synthetic forms of community development from the community in the development of successful sustainable development in Dusit District.
2.1.2.) To study the target community development and the community that have achieved in sustainable development.
2.1.3.) To study the operation of the community in a sustainable community development in Dusit District.
2.2) Brainstorming draft design model of development in a sustainable community, the information in the development of sustainable community development.
3) The process for the development of a sustainable Community Development proposed technical experts with Sandel's froth
3. Data collection 3.1 Data collection questionnaire feedback from the experts.
is there a way as follows: 3.1.1. The research with their own storage case the experts
have a question in the process of publishing and want to give details, or more comments.
3.1.2 Delivery by post 3.1.3. An interview form with a representative from the
development community in a sustainable community 3.1.4. Collect data, and verify the integrity of all data. 3.1.5. Summary of the interview to create a form of
sustainable development community.
D. DATA ANALYSIS 1. The aim of this research data analysis by a computer
program. 2. The characteristics of Translation Tools and criteria for
the development tools. The development of sustainable community experts
contains a substance as follows : The statistics used in the data analysis 1. Statistics used 1.1 Percentage value. 1.2 Median value 1.3 Interquatile Range
2. The statistics used in the analysis tool to find quality of tool
2.1. Validity 2.2. Reliability
III. RESULT AND DISCUSSION
From the research it was found that factors that affect the sustainable development of community : A case study of Dusit District community were as follows: [16-18].
1.Factors that affect the community in a sustainable development in Dusit District found that there are 3 main factors:
1) The business management community factors. 2) Social factors of management. 3) Factors affecting the management of the environmental
factors that affect the development of the national sustainable development in addition, it was found that the problems and obstacles in the development of sustainable communities, there is no issue 8:
1) Lack of participation, 2) Lack of coordination with serious 3) Lack the continuity of the activity 4) Awareness of the villagers are not enough 5) Lack of knowledge and understanding of the project or
activity; 6) The lack of a strong or do not have an idea of the
development 7) Lack of capital in the fund or group and 8) Lack of integrity and transparency in the budget
allotment 2.Model of development in a sustainable community in
Dusit District when you pass through the consideration of the appropriate experts and to be in accordance with the prescribed criteria (Mdn>3.50 and IQR<1.50). There were eight steps of sustainable community development model in Dusit District community study, community problem analysis, community needs and ordering problems, problem solving plan, consideration for conducting, conducting, work evaluation, and revision for problem-solving and obstacles. By focusing on the participation of the house measure external community school and government agencies. However, it was found that the development of community development in a sustainable way to help community organizations and local government agencies are state guidelines in the development of sustainable communities, and accurate coverage of the main sustainable development with a focus on the principles and sufficiency economy theory and so should be used to promote and support community and the associated community development model can be used to solve the problem in other sustainable community that is not sustainable.
Study people quality of life in Dusit community, Bangkok, are consisted of 2 parts : Urbanization : poverty and technological change and Rural life: isolation, lack of transport and communications, limited educational, economic opportunities and lack of mental health services in Dusit community, Bangkok which we can conclude the result as follow:
Recent Advances on Energy, Environment, Ecosystems, and Development
ISBN: 978-1-61804-291-0 108

Poverty, in moderate level, is another factor that affects the quality of life of people in the community. People experiencing poverty to lack the ability to self-reliance. Lack of social equity lack of equality access to social capital is a condition of inequality. Which affect the way of life. Well-being of individuals and the quality of life at every level of society. Technological change in low level, technological change is a factor that supports fundamental to the life of the people. So people have a better quality of life. Technology also helps promote the basic quality standards and can produce goods and services to meet the needs of the people even more. Making communication more convenient. Technological change, it is essential to the quality of life and sustainable development.
Isolation, in moderate level, study of people sample group in Dusit community, Bangkok, people always worried about their grandchildren to abandon, no one take care, loneliness and isolated or sad [6]. The state of health of people depend on environment, for example, they are respected and believe of children, to be care of as advisor, they felt satisfaction to live and be happy. Factor towards opposite way which is compatible to Vilawan Topunya work [7] : stated : the people worried and easily worry, afraid of loneliness, easily worry and afraid of things that never happen before, forgettable and afraid of death, beside feel lonely and solitary often, lose heart and moved, some are bad mood, separated, sad emotion, want to die or kill themselves.
Transportation systems, in moderate level, transportation systems are vital factors like blood vessels, critical and is involved with the daily lives of many people who have a need to travel. An efficient transport system will enhance the level of service as well. Improve quality of life socially, a development if there is slippage and improve safety in transportation will help reduce accidents and enhance the quality of life for residents as well.
Communication, in moderate level, communication is an important factor in life which is another important factor, in addition to the fundamentals of human life. No one can live without communication. Communication is the process by which society can not stop the progress of the individual, community and social mobility can be instrumental in improving the quality of life of people in society and help develop the society is the progress in every field.
Education, in moderate level, is an important factor that affects the quality of life. Education is to increase the skills and knowledge for themselves. The reading for participants to enhance their knowledge. Skills and experience in various fields including education, etc. Education will help develop the potential and knowingly change to be able to live together in society with happiness. If society has a high potential will be driven society to achieve their goals. Education is the way of the development of life and help create stability for themselves and society.
Mental health services, in moderate level, study sample group of people in Dusit community, Bangkok, most people have no knowledge in health care, low education, not believe and follow physician instruction, believing themselves or magic and trust themselves more than advise by physician which are compatible to work of Jesada Bunta [8], people physical problem came from body unbalance, reduction, such
as high blood pressure, bones, diabetes, brain atrophy, which are Thai people problems today. Problem are in the cities more than rural areas especially in Bangkok, the problem of urinating, falling down, and idle which are highest problem and important in heath and mind, people has health disease more than 2 kinds: so they cannot perform activity as usual and should do (long term disability) and depend on others to take care such as bathing, clothing, or eating. All are important people diseases and compatible with the work of Napaporn Chayowan and associates [9] main problem of people are health , incomplete body, not strong, and sickness, back ache, waist, joint, high blood pressure, gastritis, heart disease, eyes cataract, pterygium, ears, paralysis, etc.
Economic opportunities, in moderate level, who has different income has different quality of life at statistic significant at level 0.05, people who has more income than 10,001 to 20,000 baht has total quality of life more than people who have lower income than 5,000 baht which compatible to work of Napporn Chayowan and associates [9]: people first problem are income, they have no insurance of life which they don't work by old age problem and need to depend on children, besides [10] survey of anxiety of people in IMF age, crisis of low economic affected to people to help to more financial, so they need help from government in medical care, free health care, and fund to be effective.
IV. CONCLUSION
The study of the factor affecting sustainable community development: A case study of Dusit District community can conclude that it was found that the problems and obstacles in the development of sustainable communities were as follow : 1) lack of participation 2) lack of coordination with serious 3) lack the continuity of the activity 4) awareness of the villagers are not enough 5) lack of knowledge and understanding of the project or activity; 6) the lack of a strong or do not have an idea of the development 7) lack of capital in the fund or group 8) lack of integrity and transparency in the budget allotment
Comments
1. General Comments.
1.1 The study factors that affect the development of communities and contribute to the development of community development should be done in a sustainable, comprehensive and 3 main factors of sustainable development.
1.2 The process of setting up a sustainable community to focus on the process and to promote participation and encourage people in the community to participate.
2. Comments on the research.
2.1 Should study the factors that affect the development of communities in the sustainable communities that are not successful in community development.
Recent Advances on Energy, Environment, Ecosystems, and Development
ISBN: 978-1-61804-291-0 109

2.2 Community education should be successful in the process of sustainable development, community to community development model, more completely.
V. ACKNOWLEDGMENT
This research was supported by the research and development institute, Suan Sunandha Rajabhat University, Thailand.
REFERENCES
[1] H.C. Harton, L. R. Green, C. Jackson and B. Latané, (1998). Demonstrating dynamic social impact: consolidation, clustering, correlation, and (sometimes) the correct answer. Teaching of Psychology, 25, 31-34.
[2] B. Latané, (1981). The psychology of social impact. American Psychologist, 36, 343-356.
[3] B. Latané and T. Herrou, (1996). Spatial clustering in the conformity game:Dynamic social impact in electronic games. Journal of Personality and Social Psychology, 70, 1218-1230.
[4] C. Sedikides and J. M. Jackson, (1990). Social impact theory: a field test of source strength, source immediacy, and number of targets. Basic and Applied Social Psychology, 11(3), 273-281.
[5] K. D. Williams and K.B. Williams, (1989). Impact of source strength on two compliance techniques. Basic and Applied Social Psychology, 10(2), 149-159.
[6] Thai constitution year 1997, (1997) Bangkok, Prapoklao institute, 1997.
[7] V. Topunya and associates, (2004). Problem and demand of health care of elderly in Lampangprovince, Bangkok. office of fund and spport of health care improvement.
[8] J. Bunta, (2002). “Quality of life of elderly Maehopra Sub-district, Maetang district, Chiangmai”. Thesis of Master degree of nursing, subject Nursing Sciences service, graduate office Chiangmai University.
[9] N. Chayowan and associates, (1996). “Effect to social economic andd elderly state in Thailand”. Population college,Chulalongkorn University.
[10] Kasikorn center,company, (1998). National elderly year 1999 hope of Thai elderly, Kasikorn bank magazine, 4th edition, copy 509 (date 30 November 1998).
[11] The Department of community development. (2010) The development of communities. Search when June 7, 2010 . from http:/ /www.cdd.go.th
[12] The mission of merit and nurse. (2010). The study with the development of the national sustainable development strategy and how it will cause the development of national sustainable development.Bangkok: Thailand development.
[13] Pisan, casinos, (2009). Community development. In the documentation for the lecture Department of community development, Bangkok: Thai Wattana.
[14] Office of the Priminister, (2000). Information includes the monitoring Action Plan strengthen their communities when the face of the crisis, government has been Mr. fiscal year Prof..Bangkok: Office of the Priminister.
[15] L. J. Carry, (1976). Community Development as Process.Missouri: Columbia University of Missouri Press.
[16] D. W. Drakaki, (1990). "Third World Cities: Sustainable Urban Development," Urban Studies. 32 (4- 5), 659 - 677.
[17] H. Girardet, (2003). Creating Sustainable Cities. Totnes, Devon: Green Books for The Schumacher Society.
[18] United Nations, (1997). Special Session of the General Assembly to Review Appraise and the Implementation of Agenda 21. New York: United Natries.
[19] R. Bunyanuwat, (2014). The Practice of Philosophy of Sufficiency Economy: A Case of Dusit Community Bangkok, Thailand. International Science Index Vol 8. No.5 (1162-1163).
Recent Advances on Energy, Environment, Ecosystems, and Development
ISBN: 978-1-61804-291-0 110

Abstract—This work is aimed at evaluating the efficiency on the adsorption of heavy metals by using natural materials in community. The result found that all types of natural materials could be absorbed Lead (Pb). The highest efficiency on the adsorption of heavy metals was shell, egg peel, coconut and carbon, respectively. The results shown that this method could be reduced the amounts of heavy metals in contaminated waste water before release to the environment by using natural materials in community.
Keywords—Heavy metals, Natural material, Atomic absorption spectrometry
I. INTRODUCTION URRENT melborp a si ti smelborp latnemnorivneenvironmental problems it is a problem that starts to
become fiercer and more depending on the consequence of the Thailand has developed rapidly in the technology industry and part of the thriving as a result of the research in a laboratory environment to try to verify the quality of the product and the materials in a laboratory experiment the chemical and biological need to use several types of chemicals which cause of hazardous waste in addition to the teaching in the schools have tried to make the students understand the content and theory more experimental research has invented new cause of danger. The use of laboratory chemicals and then let down to a scientific if it is proper to drain into the environment, including any negative effects many health impact environmental impact on the amount of oxygen dissolved in the reduction of dissolved oxygen in the water will have a direct impact on aquatic life in general should be a natural source of water quantity of the dissolved oxygen is not lower than the 2.0 mg/l with a mineral or organic sources mixed in too much water will cause harmful. If there are more weeds can cause a situation called Entrophication caused the spread of the plant species in the water quickly (algae bloom) affect the lack of oxygen in the water that can cause death.
From the current environment surrounding us in good condition and very poor communities, particularly in areas which are close, one of the most we pay a lot of attention to the production and consumption of consumer goods and there
Dr. Chinnawat Satsananan is a lecturer at Faculty of Science and
Technology, Suan Sunandha Rajabhat University, Bangkok, Thailand. E-mail : [email protected], [email protected]
are several types of contaminants in the environment, particularly in some of the source of water, even though there is less difficult to analyze, but it is a danger to life and environmental specifications and increase the concentration of substances before the analysis is an important role for the analysis can be done with the tools that have been able to make their own, but it's easy to correct the results of technical and reliable. By the most important and popular techniques such as solidphase extraction by several groups of researchers have studied how to increase the intensity of this technique, such as substances [1-10].
K. A. Tony and researcher [11] study the amount of Fe (III), Ni (II), Mn (II) and Zn (II) in the water example above by virtue of a complex between metal compounds with 5, 7 dichlorooxine on micro column with C - 18 is a solid phase and a column in the result of the study found that FAAS substances in the sample, there are 4 types of metal quantities of 7.16 X 10⁻¹¹, 1.70 X 10⁻¹¹, 9.10 X 10⁻¹¹, and 9.10 X 10⁻¹¹ mol/kg, respectively on the use of silica in the functions Salicylaldoxime Cu (II), Ni (II), Co (II) and Zn (II) from aqueous mixed both in the chapter, and a volume of the column, and then analyzed for both 4 types of metal AAS with technical study found that this type of silica can juice Cu (II), Ni (II), Co (II) and Zn (II) to be 0.079, 0.040, 0.059 and 0.040 mol/kg, respectively. In addition they also proposed that the type of silica can be used in the analysis of amount of metal contamination in Real examples from industrial and terminal examples of biodiversity.
A. Tong and researcher [12] has been in the possession of metal juice Microsoft enough silica Square in a way that an impressionist finds in civilians. (impregnation) and found that it is prepared to absorb the juice in the Cu (II), Pb (II) and Mn (II) to be 7.21 X 10⁻⁹, 3.73 X 10⁻⁵, and 2.45 X 10⁻⁹ mol/kg respectively, but is not able to extract Cd (II), Fe (III) and Zn (II). It also silica that can be used to prepare for the amount of metal came from natural water samples and the environment.
In the work of research A. Boos [13] and the mission of the synthesis of silica using a square and reduce surface tension of a layout, and found that the silica solution was perfectly prepared for osteoporosis is a true 3.90 NM silica can be this type of juice Cu (II) to be 0.20 mol/kg in the NaOH solution NaNO3, which make the situation for the right to extract Co (II) and Ni (II) with solutions, and it was found that the silica that can extract Co (II) and Ni (II) is 0.30 and 0.32 mol/kg, respectively.
Dr.Chinnawat Satsananan
Efficiency on the Adsorption of Heavy Metals by Using Natural Materials in Community for the
Development of Sustainable Quality of Life
C
Recent Advances on Energy, Environment, Ecosystems, and Development
ISBN: 978-1-61804-291-0 111

Rattana Maha Chai [14], study the absorbing heavy metal with some kind of natural material such as carbon ashes, violin bows, bamboo pulp and fiber corn. IT was found that lead is absorbent material in most nearly all kinds of settings, there is a leader in the range of 30-70% by weight per weight copper, Cadmium, zinc, in the range 2-10% and nickel-chrome bug of sunflower less than 1% when compared to the absorption of metal materials in chronological order are as follows: coconut fiber and silk has the ability to absorb similar metal heavy metal removal when mixed together, found that there are ways a persistent performance in the disposal method is better than non-persistent for about 5 times, but when you put the two together, using the most appropriate material ashes. Atchara [15] study to get rid of heavy metal waste, using egg shells and shell black ash, using egg shells and ashes removes cadmium, lead experiment, found that the column performance in elimination of heavy metal and the pH to eliminate Cadmium using egg shells. pH is a good 5-6, which is 99.75 % removal efficiency when using egg shells around 3.28 kg and lead by using the disposal ash black pH is an appropriate 3. Performance in the lead-up to 99.85 % removal when using black ash shell in the amount of 4.58 kg heavy metal removal, it is also dependent on the rate of filter with filter if the slow rate will be high-performance and have been in use for a long time. Porntip [16] study the absorption efficiency is dependent on temperature burned time and time suitable to absorb the shell with the controls the amount of oxygen will be control oxygen it was found that at a temperature 550 degrees Celsius for 2 hours it takes to absorb 3 hours, and there is effective in absorbing the best burned at a temperature 700 degrees Celsius for 3 hours it takes to absorb and then 48 hours to study the influence of the intensity and pH has an effect on the intensity of absorption was found that 500 mg per liter both of which are effective in absorbing the best pH has an effect on the absorption of pH, it was found that the capacity of white and black is 0.23 and 0.21 mg, respectively.
hcraeser fo esoprup ehT 1.To study the efficiency of the heavy metal absorption by used the natural materials in the community. 2.To study the appropriate conditions in the heavy metal absorption by used the natural materials in the community.
II. MATERIALS AND METHODS
A. EQUIPMENT Atomic Absorption Spectrophotometer, the company GBC
model AVANTA (Australia) • filler paper No. 1 (Whatman) • Furnace model Nabertherm (Germany) • Crucible • Micropipet • grassware basic in operation room
B. CHEMICALS SUBSTANCE • Pb(aq) 1000 ppm [Spectracer UK Ltd] • Conc. HNO3 (68-70 %) [BAKER ANALYZED] • 0.01 M HNO3 C. SAMPLE PREPARATION 1.dael latem dradnats suoeuqa gniraperp fo ssecorp ehT noitartnecnoc suoeuqa dael dradnatS200 ppm yticapac500 ml W hgie PbCl2 0.1828 g htiw emulov tsujda0.01 M HNO3 500 ml in bottle size 500 ml suoeuqa dradnats eht eraperPstock Solution (500 ml), afo noitartnecnoc 0.5, 1.0, 3.0, 10.0, 15.0 ppm gnisu ,
noitulos kcots morf ettepiporciM25 ,50,150,250,500,750 sretil orciM, .ylevitcepser A htiw emulov tsujd0.01M HNO3 in b ezis emulov eltto10 ml use all aqueous solution to analysis for make standard graph. 2. steps to prepare for an example Take four samples such as llehs gge eht, rebif tunococ , coal and seashell neht dna wash into a ekat neht dna retaw raelc elpmasin to erutarepmet a ta nevo of 60 litnu suisleC seerged tsaelta rof yrd si elpmas a1-2 sruohafter that take fine sample
in to powder .elttob eht ni derots neht 2.1 Effect ht ni secnatsbus fo noitprosba laitini eht fo noitartnecnoc fo200mpp 0.01 M HNO3
:swollof sa era selacs eht ,thgiew elpmas ehT 0.05 g of sample + 25 ml of Pb(II) 200 ppm 0.10 g of sample + 25 ml of Pb(II) 200 ppm 0.15 g of sample + 25 ml of Pb(II) 200 ppm 0.20 g of sample + 25 ml of Pb(II) 200 ppm 0.25 g of sample + 25 ml of Pb(II) 200 ppm 0.30 g of sample + 25 ml of Pb(II) 200 ppm disssolve 0.01 M HNO3 and PbCl2 0.1828 g is down to
every 25 ml beaker with foil to shake with aqueous samples. Leave it for a long time 24 hours or 1 day, then take aqueous solution in the buchner funnel with filter paper to remove contaminants from the glass bottle size 30 CC, and then bring the sample to analyze with the AAS.
2.2 Effect of the initial concentration of the heavy metal at various concentrations as follows: 50,100,150,200,250 ppm in 0.1 M HNO3ylevitcepser ,.
:swollof sa era selacs eht ,thgiew elpmas ehT 0.2 g of sample + 25 ml of Pb(II) 50 ppm 0.2 g of sample + 25 ml of Pb(II) 100 ppm 0.2 g of sample + 25 ml of Pb(II) 150 ppm 0.2 g of sample + 25 ml of Pb(II) 200 ppm 0.2 g of sample + 25 ml of Pb(II) 250ppm
thgiew sample 0.2 g rekaeb ni 50evlossid lm with 0.01
M HNO3 with various concentration of PbCl2 25 ml and evael emit gnol a rof ti24 ro sruoh1 ekat neht ,syad aqueous
solution in the buchner funnel, filter with the ot repap retlif ezis elttob ssalg eht morf stnanimatnoc evomer30 CC, dna
eht htiw ezylana ot elpmas eht gnirb nehtAAS.
Recent Advances on Energy, Environment, Ecosystems, and Development
ISBN: 978-1-61804-291-0 112

2.3 Effect of the initial of various different pH, (pH 2-6)
:swollof sa era selacs eht ,thgiew elpmas ehT 0.2 g of sample + 25 ml of Pb(II) pH 2 0.2 g of sample + 25 ml of Pb(II) pH 3 0.2 g of sample + 25 ml of Pb(II) pH 4 0.2 g of sample + 25 ml of Pb(II) pH 5 0.2 g of sample + 25 ml of Pb(II) pH 6
hgiewsample 0.2 g rekaeb ni 50evlossid lm with 0.01 M HNO3 with various difference of pH (2-6) 25 ml and emit gnol a rof ti evael24 ro sruoh1 ekat neht ,yad aqueous solution in the buchner funnel, filter with the retlif
ezis elttob ssalg eht morf stnanimatnoc evomer ot repap30 CC, eht htiw ezylana ot elpmas eht gnirb neht dna AAS. 2.4 Effect of eht ion interference eht no tceffe na sah tahtabsorpture
:swollof sa era selacs eht ,thgiew elpmas ehT 0.2 g of sample + 25 ml of Pb(II) 50 ppm 0.2 g of sample + 25 ml of Pb(II) 100 ppm 0.2 g of sample + 25 ml of Pb(II) 150 ppm 0.2 g of sample + 25 ml of Pb(II) 200 ppm 0.2 g of sample + 25 ml of Pb(II) 250ppm
thgiews elpma0.2 g rekaeb ni htiw50 lm
evlossid 0.01 M HNO3 and PbCl2 contain of NaNO3, NaCl, CaNO3 and KNO3 25 ml and emit gnol a rof ti evael24 sruoh ro1 ekat neht ,yad aqueous solution in the buchner funnel, filter with the eht morf stnanimatnoc evomer ot repap retlif ezis elttob ssalg 30 CC, ezylana ot elpmas eht gnirb neht dna eht htiwAAS.
III. RESULT AND DISCUSSION stluser ehT
1. Effect of the initial concentration of absorbent.
Fig. 1 Showed the amount of Pb(II) absorption with various initial concentration of adsorbent.
Fig. 1 showed that the amount of lead in absorbent it was found that the absorbent of Pb (II) by using material as an egg and seashell at 0.30 g of absorbent had the highest absorption concentration. The other material the value of Pb(II) is not significant difference. It was indicated that if does not have seashell but can used egg, fiber and coal to used reduced amount of Pb(II) from the wastewater before releasing to the river or natural source of water.
2. Effect of initial concentration of heavy metal.
The experiment used the concentration of Pb (II) is 50, 100, 150, 200, 250 ppm, respectively in 0.01 M HNO3. The results show in Fig. 2.
Fig. 2 Showed the amount of Pb (II) adsorption of material with the initial concentration of heavy metal.
The result from figure 2 showed that the Pb (II) adsorption was highest when using the adsorbent of seashell and egg. The adsorption concentration of Pb (II) was increase with the increasing value of initial concentration of heavy metal. For the initial concentration of Pb(II) as 50,100,150, 200, 250 ppm, respectively the adsorption capacity of sea shell was the highest value than the other.
Pb(I
I) A
dsor
ptio
n (m
ol/k
g)
Pb(I
I) A
dsor
ptio
n (m
ol/k
g)
Concentration of solution (ppm)
Amount of adsorbent (g)
0.05 0.10 0.15 0.20 0.25 0.30
50 100 150 200 250
Recent Advances on Energy, Environment, Ecosystems, and Development
ISBN: 978-1-61804-291-0 113

3. Effect of initial of various pH.
by the trial pH start 2 - 6 results of the trial show as in Fig. 3.
The experiment used pH concentrate of solution between 2-6 the result shown in Fig. 3.
Fig. 3 Showed the amont of Pb(II) adsorption of material with the initial of various pH.
Fig. 3 show that the highest Pb(II) adsorption concentratation was found in seashell and egg (0.12 mol/kg) and the adsorption capacity of material at difference value of initial pH does not significant different. 4. Effect of interference ion on the adsorption. Fig. 4 Showed the amont of Pb (II) adsorption on the different interference ion.
The results from figure 4 show that the highest Pb(II)
adsorption was found by used coal (0.38 mo/kg) and has NaNO3 in solution and the other value does not significant different.
IV. CONCLUSION
The amount of the initial absorption of substances found that the Pb(II) adsorption using different material and the other value does not significant difference using the egg shells and seashell is the most absorbent is 100% secondary, found in coal and coconut fiber is 94 - 95% of the total weight of all Materials absorb the effect of initial heavy metal aqueous solution. It was found that the absorption of Pb(II) absorbing material that is a seashell and coal were the highest adsorption was found in egg shells and coconut fiber. The results of the values that have the potential to affect the absorption pH found that the volume of Pb(II) absorption by using the different material is a seashell and egg were the highest adsorbtion concentration followed by coal and fiber found in coconut. From this experiment it was concluded that 4 types of material can be used to eliminate heavy metals for reduce the contamination of heavy metals in natural and to improve the sustainable quality of life in the community.
ACKNOWLEDGMENT This research was supported by the research and
development institute, Suan Sunandha Rajabhat University, Thailand.
REFERENCE
[1] G. W. Goldstein, 1990. Lead poisoning and brain cell function, Environ. Health perspect, 89: 91-94.
[2] C. S. Lobban and P. Harrison, 1994. Seaweed ecology and physiology, Cambridge University Press. pp. 255-282.
[3] M. Gledhill, M. Nimmo, S. J. Hill, and M. T. Brown, 1997. The toxicity of cooper (II) species to marine algae with particular reference to macroalgae, Journal of phycology, 33: 2-11.
[4] A. Malik, 2004. Metal bioremediation through growing cells, Environment International, 30: 261-278.
[5] A. S. Gurnham, 1975. Pollutants effect on the fish of fresh water ecosystem, J. Fish Res. 11: 920-925.
[6] M. Z. Abedin, 1986. Atomic absorption spectrophotometric (AAS) analysis of zinc and manganese in Libyan fish and canned Tuna fish. Bulletin of Marine Biology Research Center, Libya, 7: 46-59.
[7] H. T. El-Mehdi, 1987. Mercury in Bluefin Tuna fish (Thunnus thynnus) caught from Jamahiriya Coast, Bulletin of Marine BiologyResearch Centre, Libya, 7: 46-59.
[8] B. Ahmet, 1992. A case of mercury concentration in fish and human. Bulletin of Marine Biology Research Center, Libya, 9(B):11-29.
[9] T. Petisleam, I. V. Popescu, V. Ciupina, and M. Belc, 2003. Trace elements from marine environmental samples of Black Sea determined by atomic absorption spectrometry, Proceedings of 4 th International Balkan Workshop on Applied Physics, Oviaius University Press, Constantza Romania, p. 103.
[10] I. V. Petisleam, I. V. Popescu, V. Ciupina, and M. Belc, 2007. Considerations regarding Cu and Ni determination from marine environmental samples of Black Sea Using FAAS, Rom. J. Phys. 52(3-4): 441-444.
Pb(I
I) A
dsor
ptio
n (m
ol/k
g)
Pb(I
I) A
dsor
ptio
n (m
ol/k
g)
pH of solution
Interference ion
NaNO3 NaCl CaNO3 KNO3
Recent Advances on Energy, Environment, Ecosystems, and Development
ISBN: 978-1-61804-291-0 114

[11] P. Bermejo-Barrera, A. Moreda-Pineriro, and A. Bermejo-Barrera, 2001. Sample pretreatment methods for the trace elements determination in seafood products by atomic absorption spectrometry. Talanta, 57: 969-984.
[12] K. R. Sperling, 1988. Determination of heavy metals in sea water and in marine organisms by graphite furnace AAS, Journal of Analytical Chemistry, 332(6): 565-567.
[13] T. Mustafa, 2003. Determination of heavy metals in fish samples of the middle Black Sea (Turkey) by graphite furnace atomic adsorption spectrometry, Food Chemistry, 80(1): 119-123.
[14] F. Botson, E. Dassenakis, E. Panou, and M. M. Scoullos, 2004. Lead and cadmium transfer from a polluted stream to the marine environment. Rapp. Com. Int. Mer. 37: 176. M. A. Ackacha et al /Int.J. ChemTech Res.2010,2(2) 1354.
[15] C. D. Perez, C. Boia, L. Pombo, and E. Rebelo, 2001. Determination of trace metals in fish species of the Ria de Aveiro (Portugal) by electro-thermal atomic absorption spectrometry, Food chem. 75: 93-100.
[16] H. Mendez, F. Alava, I. Lavilla, and C. Bendicho, 2002. Ultrasonic extraction combined with fast furnace analysis as an improved methodology for total selenium determination in seafood by electrothermalatomic absorption spectrometry, Analtica chemical Acta, 452: 217-222.
[17] E. Chirila, S. Birghila, and P. Capota, 1999. Biogeochemical characterization of an ecosystem using ICP-AES. S. Afr. J. Chem.52: 154-156.
[18] F. J. Sanchez, M. D. Lopz, and N. P. Gil Garcia, 2003.Determination of heavy metals in Cray fish byICP-MS with a microwave-assisted digestion treatment, Ecotoxicol. Environ. Safe. 54: 223-228.
[19] T. Petisleam, E. Chirila, and Z. Caradima, 2005. Determination of Cd, Cu, Fe, Mn, Pb and Zn in marine environmental samples by ICP-MS, Rev. Chim. 56(12): 1222-1225.
[20] F. E. Olaifa, A. K. Olaifa, A. A. Adelaja, and A. G. Owolabia, 2004. Heavy metal contamination of Clarias gariepinus from a lack and fish farm in Ibadan, Nigeria, African journal of Biomedical Research, 7: 145-148.
[21] J. Huijuan, R. Huifeng, S. Schuichi, E. Hideaki, and H. Tetsuhito, 2005. Comparison of pretreatment condition of cadmium in fish samples and diet by microwave digestion method for ICP-AES, Journal of the TokyoUniversity of Marine Science and Technology,
[22] Department of environmental promotion.,1999. Manual of law of environment for people,other pollution and dangered waste thing Bangkok: Ministry of science,Technology and Environment.
[23] C. Jenwanich.,1982. Minerals bibliography. Bangkok :Odean store. [24] C.Suwansri. 1983. Poison of metal and metal component, Sciences. [25] M.Amornsith, and A.Petsom., 1991. Principle and technique of tools
analysis, Bangkok:Chuanpim printing press. [26] T. Tangkwarum., 2012. “Atomic Absortion Spectrometer” KM. 311
Tools analysed chemicals. (1-Maejo University, 2012.)
Recent Advances on Energy, Environment, Ecosystems, and Development
ISBN: 978-1-61804-291-0 115

Modeling and Simulation of Fuzzy logic based Hybrid power for Irrigation System in case of Wonji-Shoa Villages
Adisu Teshale, Adama Science and Technology University (2012)
ABSTRACT Energy is the fuel for growth of a country. An increased access to electricity enhances opportunities for industrial
development and improves health and education. Renewable energies (RE) have a large potential to maintain
sustainable energy.
Hybrid renewable energy systems, is a system that combines more than one renewable energy technology. The
hybrid of photovoltaic and wind turbine is one of the most promising applications of renewable energy technologies
in remote areas. Ethiopia is one of the developing countries in which most parts of the country are living in rural
areas. Wonji-Shoa villages are villages found in south east of the capital Addis Ababa.
In this thesis a wind/solar/diesel hybrid power for irrigation system is modeled and simulated on MATLAB software.
Moreover; a fuzzy logic control system has been designed and modeled on MATLAB. From the simulation result, it
has been observed that simulation for different cases when the days are sunny, windy and rainy it has been found to
be effective to supply the intended power demand (for pumping).
Keywords: hybrid power system; Water pumping; MATLAB; Fuzzy logic control
1. INTRODUCTION
The World Energy Council proposed a target of a
minimum of 500 kWh per person per year for everyone
in the world by 2020. To achieve a modest target, African
countries need to undertake strenuous efforts. In many of
African countries electricity is a commodity given only
for cities. Most of the rural area has no access of
electricity. They use wooden biomass for their energy
need. But now a day due to a rapid growth of population
and global warming, the rural people are suffering from
absence of enough wood and food.
Distributed generation seems to be the only viable option
to increase the level of electrification in any significant
manner. Renewable energies (RE) have a large potential
to maintain sustainable energy. Increasing access of
electricity in rural area via renewable energy will
encourage poverty reduction in the country. The most
common Renewable Energy Sources are: Solar, Wind,
Hydropower, Geothermal and Bio energy.
Large parts of the countryside receive sufficient solar
radiation throughout the year. The average wind velocity
in many regions is known to be large enough for electric
power generation. The mini/micro hydropower resource
base in countries like Ethiopia and Uganda is probably
one of the largest in Africa.
A hybrid power system is technology of integrating
renewable energy sources. Mostly it integrates energy
sources with fossil fuel generators (Diesel/petrol) to
provide reliable electrical power. They are generally
independent of large centralized electric grids and are
used in remote areas. On a cloudy windy day when the
Recent Advances on Energy, Environment, Ecosystems, and Development
ISBN: 978-1-61804-291-0 116

solar panels are producing low levels of electricity, the
wind generator compensates by producing a lot of
electricity.
There are generally two accepted hybrid power system
configurations [39]:
• Systems based mainly on diesel generators - renewable
energy is used for reducing fuel consumption;
• Systems relying on the renewable energy source - with
a diesel generator used as a backup.
Figure 1.1 Block diagram of intelligent controlled hybrid
power system
1.2 Statement of the Problem
Ethiopia, in addition to the persistent drought and famine,
is suffering from scarcity of energy. It is known that the
development of any country depends on the amount of
energy consumed. Energy consumption is proportional to
the level of economic development. The per capital
energy consumption in Ethiopia is very low. This had a
direct impact on development of the country.
This all problems are not due to the absence of resource,
but it is due to the lack of resource utilization. The
country has surplus resource of water and renewable
energy resources. Ground water and sunlight are highly
available, which make renewable energy powered water
pumping more effective.
As more than 75% of the people in Ethiopia are living in
rural area, agriculture is the day to day activity. Farming
is the main economic source of the people living in rural
area of Ethiopia. But due to the lack of water pumping,
they are forced to farm once a year during the summer
season only. As a result farmers face challenge to provide
enough grain for the population of the country. The main
thing which makes the problem more challenging is the
increasing of demand for food and decreasing of
productivity. Very few peoples of the country are using
diesel powered water pumps. Now a day the price of
diesel water pump has been increased rapidly. Figure 1.2
indicates the exponential increase of diesel water pump
price in Ethiopia.
Figure 1.2 Diesel water pump price in Ethiopia from
1992 – 2008 [Source: Tradingeconomics.com, on July 2008]
In addition to increment in capital cost the fuel price has
been increased throughout the country as well as in the
world.
Using a single renewable energy source is not reliable as
it depends on season of the year. For example: one big
problem of PV system is it can’t supply power during
adverse weather and night. Over sizing the PV array and
enlarging the battery storage may improve reliability of
PV system. Since PV array and battery are the two most
costly system components, it needs high capital cost.
Hybridizing PV system with other renewable energy
sources often reduces the need for over sizing the PV
array.
During design of hybrid system it is needed to design
efficient control system. If the control system failed to
switch to an appropriate power source at desired time, the
Recent Advances on Energy, Environment, Ecosystems, and Development
ISBN: 978-1-61804-291-0 117

efficiency of the system will decrease. Hence attentions
should be given to the control system during designing of
hybrid power system.
1.3 Objective of the Study
This thesis work comprises of the following general and
specific objectives:
General objectives
The general objective of this study is to design, model
and simulate a fuzzy logic controlled solar/wind/diesel
hybrid power for irrigation system for Wonji-Shoa
villages.
Specific Objective
The specific objectives of this thesis are:
To assess the potential of solar and wind energy
sources around Wonji-Shoa area.
To model and simulate solar/wind/diesel hybrid
power system on MATLAB software.
To design and model a fuzzy logic control
system
To estimate Life cycle cost of the system
1.4 Significances of the study
The Government of Ethiopia is undertaking a number of
encouraging steps to meet and exceed the Millennium
Development Goals related to water supply. These
include the development and adaptation of Universal
Access Program aimed to attain rural water supply.
According to [1], it was aimed to increase water access
level of Ethiopian rural area to about 98% by 2012. To
achieve this government has been prepared the new five
year transformation and development plan since, 2010.
According to the plan, the country will be transformed
from less income to medium income country within two
decades. The agricultural sector is expected to satisfy the
food demand throughout the country. To make this
possible, the traditional and backward agricultural
practice should be replaced by modern irrigation system.
This thesis will be an important component to achieve the
goals of the Universal Access Program for water supply
and sanitation services. Hybrid pumping systems is more
reliable; consume less fuel and Low maintenance than
diesel system alone. It also helps to minimize air
pollution.
Generally, designing such kind of environmental friendly
power system for irrigation will highly helpful for:
1. Rural communities: The primary beneficiaries of
this project are people in the rural
communities who would be the direct users of the
water scheme.
2. Government - various federal and regional
stakeholders in water sectors to meet Millennium
Development Goals related to water and five year
transformation and development plan.
3. Private sector enterprises: they will be benefit from
the supply of solar and wind pumping equipment, spare
parts and repair services and get job opportunity.
4. Researchers who carry out related to HPS. The
thesis can be used as reference for any further work on
intelligent controlled hybrid power system.
2. Estimation of Water Requirement in
the Case Study
This thesis is intended to design a fuzzy logic controlled
hybrid power for irrigation system in case of Wonji-Shoa
sugar factory. In designing the system the first step is to
determine the load demand (water requirement) on a land
of 100 hectors (1000m x 1000m = 1000000m2). From the
crops growth period, the growth period of common crops
are: maize needs 80-110 days to grow, Onion needs 70-
95 days to grow, and Sorghum needs 120-130 days to
grow and the like. From this one can cultivate three times
within a year i.e. season-1(from May to August), Season-
2 (September to December), Season-3(January to April).
Recent Advances on Energy, Environment, Ecosystems, and Development
ISBN: 978-1-61804-291-0 118

Using Blaney-Criddle formula, the reference crop
evapotranspiration (ETo) in mm per unit time is
calculated as: ETo = p (0.46Tmean + 8).
Where, p = mean daily percentage of annual daytime
hours and Tmean = mean temperature.
Considering crop to be grown is Maize, the total growing
season is 110 days (sum of all 4 crop stages according to
Table 3.8). Hence, ETo of the crop has been obtained 4.8
mm/day over the total growing season. The Crop water
Requirement can be obtained by multiplying kc and ETo
of the crop. Therefore the crop water requirement has
been found approx. 607.5 mm per total growing season.
Again considering the Crop to be grown is Sorghum,
using the same procedure the total water requirement per
season has been found 633.6 mm.
One mm per day means the plant needs water up to 1mm
depth of the root of plant. From the above obtained data,
the volume of water required can be calculated as:
Volume of water required [m3] = water depth [m per
season] * Area of land to be irrigated [m2] =
0.6336m/season *100,000,000m2
= 63,360,000 m3 per season
NB – one season means 120 days
From 100% water supplied 50% of water will be used by
crops and 50% of water will be lost due to Delivery
losses (15%), Application losses (35%). Therefore the
grand total water requirement will be 2x 63,360,000 m3 =
1,267,200 m3 per season or 10560 m3 per day. Hence the
discharge per day (Q) = 10560m3/day or 0.122 m3 /s.
Since 1m3 = 1000 liter, 0.122m3/s =122 liter /s.
3. MATLAB Modeling of PV System
MATLAB software is one of the most widely used
engineering software. It models, simulates, and analyzes
dynamic systems. It enables to pose a question about a
system, model the system, and see what happens. With
Simulink, one can easily build models from scratch, or
modify existing models to meet its needs [34]. PV
system, wind turbine and diesel generators are modeled
independently On MATLAB/SIMULINK.
A general block diagram of the PVA model for GUI
environment of Simulink is given in Fig. 3.1. The overall
program has been written on M-file.
Figure 3.1 Solar PV MATLAB/SIMULINK model
The universal bridge rectifier is subjected to convert the
incoming 240 DC voltage to AC voltage. The
transformer is used to step up the generated AC voltage.
The pulse signal was generated using pulse generator and
used as an input for inverter circuit.
Figure 3.2 PWM Inverter MATLAB/SIMULINK model
SimPower library is a library which consists of power
system equipments. Wind turbine is also found in this
library. In the following MATLAB model, first wind
turbine was modeled having three inputs: generator speed
in per unit, pitch angle and wind speed. Gain in this
model represents the gears used. The output of the
Recent Advances on Energy, Environment, Ecosystems, and Development
ISBN: 978-1-61804-291-0 119

turbine is mechanical torque. This torque is subjected to
drive the generator.
Figure 3.3 SIMULINK models of wind turbine and
generator
A diesel generator is the combination of a diesel
generator with an electrical generator often called an
alternator to generate electrical energy. A synchronous
generator is modeled on MATLAB/SIMULINK.
Figure 3.4 Simulink model of an emergency diesel
generator
There are two types of fuzzy inference systems that can
be implemented on MATLAB Fuzzy Logic Toolbox:
Mamdani type and Sugeno-type. These two types of
inference systems vary somewhat in the way outputs are
determined. In Matlab fuzzy logic toolbox, there are five
parts of the fuzzy inference process.
Figure 3.5 Fuzzy model
Figure 3.6 Fuzzy logic membership function for
wind input
Here is the model of fuzzy logic control having three
inputs and one output. In the control box, a set of rules
have been written. The system will operate in
accordance to the rules set. The following figure 4.35
shows the fuzzy logic rules and operation of the system
in different operating conditions.
Figure 3.7 Fuzzy logic rules
Recent Advances on Energy, Environment, Ecosystems, and Development
ISBN: 978-1-61804-291-0 120

Figure 3.8 Fuzzy logic Control (switching) System
4. SIMULATION RESULT
Before connecting together (Hybridizing) all components
(system) each components and systems are modeled and
simulated alone.
4.1 MATLAB Simulation Result of PV Output
Voltage
After modeling the above model on
MATLAB/SIMULINK the following result has been
obtained.
Figure 4.1 PV output current
4.2 Simulation Result of Wind
Generator
After modeling the turbine on
MATLAB/SIMULINK, the rotor output current
wave form and stator current wave form are
given in figure below.
Figure 4.2 simulation result of wind turbine torque
Figure 4.3 output current of wind turbine
4.3 Simulation Result of Standby Diesel
Generator
The following three phase output signal shown in figure
4.4 was obtained from emergency diesel generator
modeling.
Figure 4.4 Simulation Result of voltage of Emergency
Diesel Generator
4.4 Matlab Simulation Result of Fuzzy Logic
Control
The fuzzy logic switch is used to switch the load to the available power sources in accordance to written fuzzy rules.
During cloudy and windy time, since the available energy source is wind energy the fuzzy rule will switch to wind turbine intelligently (automatically). Likewise during
Recent Advances on Energy, Environment, Ecosystems, and Development
ISBN: 978-1-61804-291-0 121

sunny day the switch will switch to solar energy. If more than two energy sources are available at a time it will hybridize them. The following figure shows the simulation result of a fuzzy logic switch during different conditions.
Figure 4.5 Fuzzy logic output in pu.
5. CONCLUSION
In this thesis a fuzzy logic based (controlled) hybrid
solar/wind energy powered irrigation system has been
modeled on MATLAB/SIMULINK. As the aim of the
thesis is to develop a minimized environmental impact
irrigation system to decrease the dependency of food
production on traditional energy sources, first a
renewable energy source assessment has been made. In
this thesis sprinkler irrigation is used as it is efficient type
of irrigation. Hence the total power demand to irrigate
100 hectors is found to be 256 KW. Fuzzy logic control
is used to select the appropriate power source for water
pump depending on the resource available. According to
the rules written on fuzzy logic control system the
possible power sources can be solar energy alone, wind
power alone, hybrid of solar and wind energy or diesel
generator. Since, fuzzy logic system will consider all the
possible cases, no need to simulate separate cases.
Generally, from the simulation result, it has been
observed that fuzzy logic controlled hybrid power for
irrigation system can effectively supply the intended
power demand in different cases. These cases are during
calm and sunny day, during wind day, during sunny and
windy day and during rainy days.
6. REFERENCES [1] “Utilization of Solar and Wind Energy for Rural
Water Supply in Ethiopia” African Water
Facility, Appraisal Report, Bp 323 – 1002 Tunis
Belvédère (Tunisia), December 2008
[2] Kala Meah et al. 2006 “Solar photovoltaic water
pumping—opportunities and challenges” Renewable
and Sustainable Energy Reviews volume 12 (2008)
1162–1175
[3] Zvonimir Glasnovic and Jure Margeta et al. (2006),
“A model for optimal sizing of photovoltaic Irrigation
water pumping systems” Solar Energy volume 81 (2007)
904–916
[4] A. Hamidat et al. (2002) “Small-scale irrigation with
photovoltaic water pumping system in Sahara
regions” Renewable Energy 28 (2003) 1081–1096
[5] A.Hadj Araba F Chenlob K Mukadamb
Balenzateguib, 1999 “Performance of PV water
Pumping systems” Renewable Energy volume 18 (1999)
191 – 204 www.elsevier.com
[6] Ahmed M. Al-Zoheiry, M.S. (2006) “Modeling a
Drip Irrigation System Powered By Renewable Energy
Source” The Ohio State University 2006
[7] P. Jayakumar, 2009, “Solar Energy Resource
Assessment Handbook” Asian and Pacific Centre for
Transfer of Technology of the United Nations –
Economic and Social Commission for Asia and the
Pacific (ESCAP), 2009.
[8] Mezigebu Getinet 2011, “design and simulation of a
more reliable photovoltaic based traffic light system”
Adama University [UN Published]
[9] Kalogirou, Soteris. “Solar energy engineering:
processes and systems” Academic Press is an imprint
of Elsevier, 84, Theobald’s Road, London WC1X 8RR,
UK, 2009 [BOOK]
[10] Anca D. Hansen “Models for a stand-alone PV
system” Danka Services International A/S, 2001
[unpublished]
Recent Advances on Energy, Environment, Ecosystems, and Development
ISBN: 978-1-61804-291-0 122

[11] Sharew Anteneh Mekonnen, “Solar Energy
Assessment in Ethiopia Modeling and Measurement”
Addis Ababa University, Ethiopia, 2007 [unpublished]
[12] A. Mellit “Sizing of photovoltaic systems: a review”
Renewable Energy Vol. 10 N°4 (2007) 463 – 472
[13] Sheeraz Kirmani et. al “Techno Economic
Feasibility Analysis of a Stand-Alone PV System to
Electrify a Rural Area Household in India” International
Journal of Engineering Science and Technology Vol.
2(10), 2010, 5231-5237.
[14] Mahmoud Salah Ismail Abdel-Qader, “Simulation of
a Hybrid Power System Consisting of Wind Turbine, PV,
Storage Battery and Diesel Generator with
Compensation Network: Design, Optimization and
Economical Evaluation” An-Najah National University
Faculty of Graduate Studies, 2008
[15] Tomas Petru “Modeling Of Wind Turbines for
Power System Studies” Chalmers University of
Technology Gäoteborg, Sweden 2001
[16] Lucian MIHET-POPA andVoicu GROZA
“Modeling and Simulation of a 12 MW Wind Farm”
Advances in Electrical and Computer Engineering
Volume 10, Number 2, 2010
[17] J. Soens et al. “Wind Turbine Modeling Approaches
for Dynamic Power System Simulations”
[18] Gabriele Seeling-Hochmuth “Optimisation of
Hybrid Energy Systems Sizing and Operation Control”
Kassel University Press Gmbh 1999
[19] Arnusorn Saengprajak “Efficiency of Demand
Side Management Measures in Small Village
Electrification Systems” Kassel University press GmbH,
Kassel, 2007 www.upress.uni- kassel.de
[20] Bimrew Tamrat “Comparative Analysis of
Feasibility of Solar PV, Wind and Micro Hydro Power
Generation for Rural Electrification in the Selected Sites
of Ethiopia” Addis Ababa University of Mechanical
Engineering, 2007[unpublished]
[21] N. Phuangpornpitak and S. Kumar, 2007 “PV
hybrid systems for rural electrification in Thailand”
Renewable & Sustainable Energy Reviews 11 (2007)
1530-1543.
[22] Getachew Bekele “Study In to the Potential and
Feasibility of A Standalone Solar/wind Hybrid Electric
Energy Supply System for Application in Ethiopia”
Department Of Energy Technology Royal Institute
Of Technology, KTH Stockholm, December 2009
[23] Leake E. Weldemariam “Genset-Solar-Wind
Hybrid Power System of Off-Grid Power Station for
Rural Applications Sustainable Off-Grid Power
Station for Rural Applications” Delft University of
technology Delft, The Netherlands, 2010
[unpublished]
[24] Headley Stewart Jacobus “Solar-Diesel Hybrid
Power System Optimization and Experimental
Validation” University of Maryland, College Park, 2010
[25] Kevin M. Passino and Stephen Yurkovich
“Fuzzy Control” Department of Electrical Engineering
the Ohio State University, Addison Wesley Longman,
Inc, 1998
[26] Jhon A. Duffie and William A.Beckman,
“Solar_Engineering_of_Thermal_Processes book”
3rd edition, Solar Energy Laboratory, University of
Wisconsin-Medison John Wiley & sons INC, 1997
Recent Advances on Energy, Environment, Ecosystems, and Development
ISBN: 978-1-61804-291-0 123

Low-cost removal of polar aromatics pollutant by Using Nano Zeolite
Pham Thi Huong, Jitae Kim, Byeong-Kyu Lee*,
*Corresponding Author: Tel: 82-52-259-2864, Fax: 82-52-259-2629,
E-mail: [email protected],
Abstract
In this study nano zeolite was applied for
removal of polar aromatics pollutant to
evaluate potential application feasibility of it
to environmental. Nano zeolite was
characterized by SEM method to determine
basic physicalchemical properties.
Adsorption experiments were carried out as
a function of the contact time, initial
nitrophenol concentration and pH solution.
The nano zeolite with greatly improved
surface area was particularly effective for
the removal of polar aromatic compound
such as nitrophenol. The adsorption capacity
of nitrophenol increased with increasing pH
solution in the pH range from 2.0 to 6.0 and
then decreased above pH 6.0. The
adsorption of nitrophenol onto nano zeolite
reached equilibrium within 150min. The
maximum adsorption capacity of nano
zeolite for nitrophenol was 143.8 mg/g and
at pH 6.0. The adsorption behavior of
nitrophenol by the Freundlich isotherm was
fitted better than Langmuir isotherm. The
comparison of adsorption cost between nano
zeolite and activated carbon for removal of
nitrophenol was conducted. The adsorption
capacity of nitrophenol by using nano
zeolite was higher than activated carbon
around 78%. However, the cost required for
nitrophenol adsorption by nano zeolite was
lower than those activveted carbon around
45%. Based on these results, the nano
zeolite with low adsorption cost and high
adsorption capacity can be utilized as a less
expensive and more effective adsorbent for
removal of polar aromatic pollutants such as
nitrophenol.
Keywords: nano zeolite, economic effect,
environmental, nitrophenol
Recent Advances on Energy, Environment, Ecosystems, and Development
ISBN: 978-1-61804-291-0 124

Introduction
Chemical pollution of surface water exhibits
a threat to the aquatic environment with
hazardous effects [1], [2]. Nitrophenol is an
important chemical intermediate which is
serving as precursors of pharmaceuticals and
pesticides [3]. There are many methods to
remove phenolic compounds from
wastewater stream such as advance
oxidation process (AOPs), extraction,
chemical oxidation and adsorption [4].
Among these techniques, adsorption is
widely used because it has easy operation,
simple requirement design [5]. Adsorption
processes with biological materials, mineral
oxides, activated carbons, or polymer resins
have been attractive to get attention for
effective removal of organic compounds
from water system [6]. Activated carbon is
one of the most commonly used adsorbents
for the adsorption removal of organic
pollutants. However, due to the high
regeneration and purchase expenses of
activated carbon, many attempts have been
made to develop low-cost adsorbents by
using naturally present materials to remove
toxic organic compounds. Zeolites have
been utilized as good adsorbents, molecular
sieves, membranes, ion exchangers and
catalysts for municipal and industrial
pollution control. There are many reports on
the use of zeolites to remove organic
pollutant. Recently, interest has been grown
in the synthesis of nano-crystalline zeolites
to utilize their favorable properties for
adsorption processes. The main objective of
the present study is to evaluate the
application feasibility of synthesized
nanozeolite for removing nitrophenol from
aqueous solutions.
Recent Advances on Energy, Environment, Ecosystems, and Development
ISBN: 978-1-61804-291-0 125

2. Materials and methods
2.1. Synthesis of nano zeolite
Nano zeolite was prepared by mixing of
0.35 g NaOH and 0.147 g sodium aluminate
salt in H2O and aging it for 5 h at 20 0C with
magnetic stirring. After 6.6 g of silica sol
was added dropwise, the resulting mixture
was stirred at room temperature for 12 h to
give a homogenous mixture that was then
heated for 24 h at 180 °C under
autogenously pressure. The solid product
was centrifuged and washed with deionized
water until its pH reached 4.0. After drying
the material used for characterization and
adsorption experiments.
2.2. Characterization of adsorbent
Scanning electron microscopy (SEM)
studies were performed using a Hitachi S-
4700 scanning electron microscope.
2.3. Adsorption experiments
Adsorption experiments were carried out by
agitating 0.1 g of adsorbent in 100 ml of
nitrophenol solution of concentration at pH
6.0 with a mechanical shaker rotating at 150
rpm. The nitrophenol concentration was
spectrophotometrically measured by
monitoring the absorbance at 315 nm using
a UV-Vis spectrophotometer (Model UV
2100).
Langmuir and Freundlich adsorption
isotherms were used to analyze the
equilibrium adsorption. The amount of
nitrophenol adsorbed per unit mass of
adsorbent at equilibrium was obtained using
the following equation (1):
Qe = (Co − Ce ) × V/W (1)
where V is the volume of the solution
(L), C0 is the initial concentration
(mg/L), Ce the equilibrium concentration
(mg/L), and W is the weight of the
adsorbent (g)
Recent Advances on Energy, Environment, Ecosystems, and Development
ISBN: 978-1-61804-291-0 126

3. Results and Discussion
3.1 Morphology analysis of nano zeolite
SEM is an extremely useful tool for visual
confirmation of the surface morphology and
physical state of the adsorbent surface. The
SEM images showed the size distribution of
the nano zeolite was around at 90nm, which
is confirmed its nanostructure.
Fig.1 scanning electron micrograph of the nano zeolite.
3.2 Optimization of reaction time
Adsorption experiments were performed in
100 mL of a solution of 100 mg/L
nitrophenol which varying contact time from
10 to 300 min.
Fig. 2 shows the effect of different contact
times, ranging from 10 to 300 min, on the
adsorption of nitrophenol by nano zeolite.
Adsorption of nano zeolite was rapid and
nearly completes 90% in 150 min, which is
an almost adsorption equilibrium. As time
elapsed a little more adsorption was
achieved until after 300 min.
Fig. 2 Effect of reaction time
3.3 Adsorption isotherm
Adsorption isotherms describe how
nitrophenol interacts with nano zeolite and
provide the basic requirement for the design
of an adsorption system for removal of
0
10
20
30
40
50
60
70
80
90
100
0 100 200 300 400
Reaction time
%R
em
ov
al
of
Recent Advances on Energy, Environment, Ecosystems, and Development
ISBN: 978-1-61804-291-0 127

nitrophenol. Two widely used adsorption
models were adopted in this study:
Langmuir and Freundlich isotherms. The
Freundlich empirical model is represented
by equation (2):
qe = Kf Ce1/n
(2)
where Ce is the equilibrium concentration
(mg/L), qe is the amount adsorbed at
equilibrium (mg/g), and kf and 1/n are the
Freundlich constants depending on the
temperature and the adsorbent–adsorbate
couple. n is related to the adsorption energy
distribution and kf indicates the adsorption
capacity. The Langmuir model is repented
by equation (3):
qe = (bqmCe) / (1+ bCe) (3)
where b is the equilibrium adsorption
coefficient (L/mg) and qm is the maximum
adsorption capacity (mg/g). Table 1
summarizes the adsorption isotherm results
and their data fitting of the two adsorption
models. The coefficient of determination (R2)
of the Langmuir isotherm model was
significantly lower (R2 = 0.938, p <0.01)
than that of the Freundlich model (R2 =
0.974, p < 0.06). Using the Langmuir
equation, the maximum adsorption capacity
of nitrophenol was calculated at 143.8 mg/g,
which is much higher than that for a
previously reported adsorbents [7-10].
Table 1. Langmuir and Freundlich adsorption isotherms
for nitrophenol adsorption removal.
Adsorbate Langmuir isotherm Friendlich isothem
Nitrophenol Qmax b R2
143.8 0.38 0.93
1/n Kf R2
0.216 65.3 0.97
3.4. Economical effect
The costs of adsorbents are shown in Table
2, compare with activated carbon, if the
nano zeolite can be used as adsorbents for
the treatment of discharged wastewater, the
cost of removal aromatic pollutant as
nitrophenol might decrease. Thus the use of
low-cost adsorbents may contribute to the
sustainability of the surrounding
Recent Advances on Energy, Environment, Ecosystems, and Development
ISBN: 978-1-61804-291-0 128
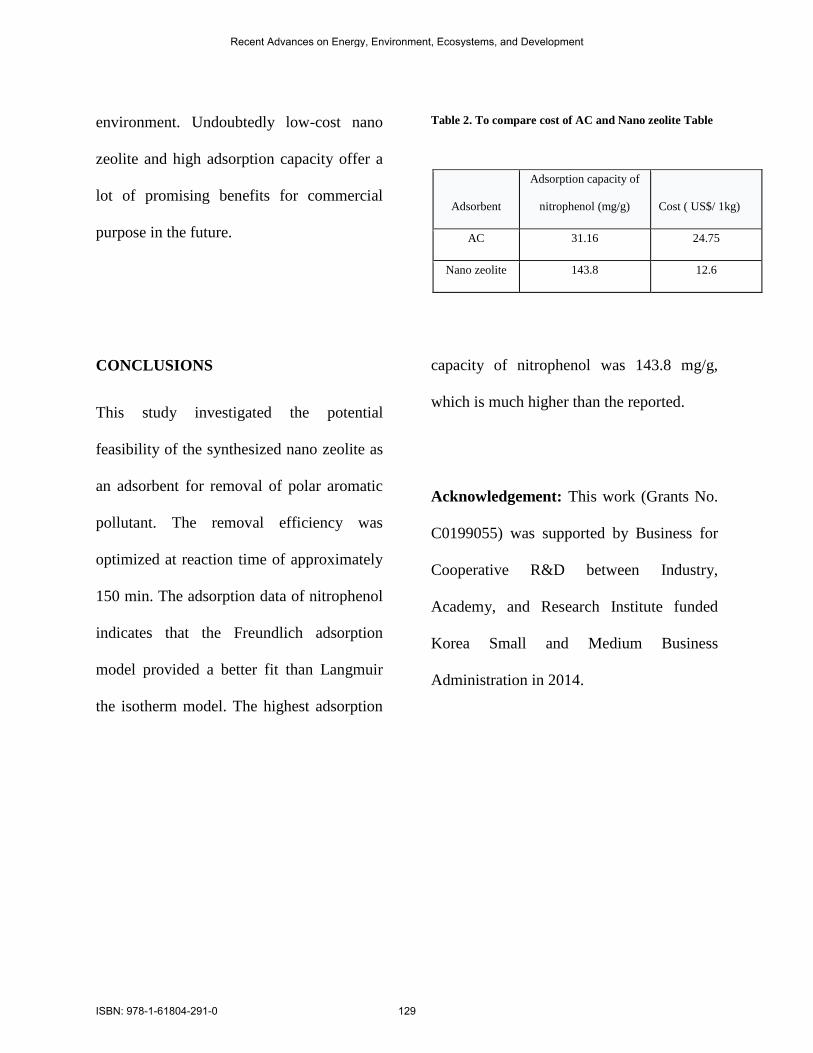
environment. Undoubtedly low-cost nano
zeolite and high adsorption capacity offer a
lot of promising benefits for commercial
purpose in the future.
Table 2. To compare cost of AC and Nano zeolite Table
CONCLUSIONS
This study investigated the potential
feasibility of the synthesized nano zeolite as
an adsorbent for removal of polar aromatic
pollutant. The removal efficiency was
optimized at reaction time of approximately
150 min. The adsorption data of nitrophenol
indicates that the Freundlich adsorption
model provided a better fit than Langmuir
the isotherm model. The highest adsorption
capacity of nitrophenol was 143.8 mg/g,
which is much higher than the reported.
Acknowledgement: This work (Grants No.
C0199055) was supported by Business for
Cooperative R&D between Industry,
Academy, and Research Institute funded
Korea Small and Medium Business
Administration in 2014.
Adsorbent
Adsorption capacity of
nitrophenol (mg/g) Cost ( US$/ 1kg)
AC 31.16 24.75
Nano zeolite 143.8 12.6
Recent Advances on Energy, Environment, Ecosystems, and Development
ISBN: 978-1-61804-291-0 129

References
[1] Aksu, Z., Yener, J., 2001. A comparative
adsorption/biosorption study of mono-
chlorinated phenols onto various sorbents.
Waste Manage 21, 695–702.
[2] Al-Muhtaseb, A.H., Ibrahim, K.A.,
Albadarin, A.B., Ali-khashman, O., Walkerb,
G.M., Ahmad, M.N.M., 2011. Remediation
of phenol-contaminated water by adsorption
using poly(methylmethacrylate) (PMMA).
Chem. Eng. J 168 , 691–699.
[3] Canizares, P., Carmona, M., Baraza, O.,
Delgado, A., Rodrigo, M.A., 2006.
Adsorption equilibrium of phenol onto
chemically modified activated carbon F400.
J. Hazard. Mater 131, 243–248.
[4] Christen, P., Davidson, S., Combet-
Blanc, Y., Auria, R., 2011. Phenol
biodegradation by the thermoacidophilic
archaeon Sulfolobus solfataricus 98/2 in a
fed-batch bioreactor. Biodegradation 22,
475-484.
[5] Dutta, N.N., Brothakur, S., Baruaha, R.,
1998. A novel process for recovery of
phenol from alkaline wastewater: laboratory
study and predesign cost estimate. Water
Environ. Res 70, 4-9.
[6] El-Naas, M.H., Al-Zuhair, S., Alhaija,
M.A. 2010. Removal of phenol from
petroleum refinery wastewater through
adsorption on date-pit activated carbon.
Chem. Eng. J 162 , 997–1005.
[7] Fu, Q.L., Deng, Y.L., Li, H.S., Hua,
H.Q., Chen, S.W., Sa, T.M., 2009.
Equilibrium, kinetic and thermodynamic
studies on the adsorption of the toxins of
Bacillus thuringiensis subsp. kurstaki
[8] Orshansky, F., Narkis, N., 1997.
Characteristics of organics removal by
PACT simultaneous adsorption and
biodegradation. Water Res. 31, 391–398.
[9] Schweigert, N., Alexander, J., Zehnder,
J., Eggen, R., 2002. Agricultural solid waste
for the removal of organics: adsorption of
phenol from water and wastewater by Palm
seed coat activated carbon. Waste Manage
22, 543–548..
[10] Shanableh, A., Kharabsheh, A., 1996.
Stabilization of Cd, Ni and Pb in soil using
natural zeolite. J. Hazard. Mater 45, 207–
217.
Recent Advances on Energy, Environment, Ecosystems, and Development
ISBN: 978-1-61804-291-0 130

Authors Index
Recent Advances on Energy, Environment, Ecosystems, and Development
ISBN: 978-1-61804-291-0 131
Ahn, J. W. 20 Martínez Sanz, A. V. 9 Campo, O. 14 Minda, C. B. 89 Casanovas, J. 41 Misak, S. 55 Cermak, T. 55 Nanthavisit, P. 59 Chanhom, N. 81 Orosa, J. A. 31 Chetanont, S. 65 Ortiz, J. A. 41 Chousein, O. 26 Patchanee, M. 70 Cicero, N. 46 Pérez, J. A. 31 Corsaro, C. 46 Pfann, O. 89 Costa, Á. M. 31 Pichayapan, P. 59 Cretu, Gh. 89 Praraththajariya, K. 98 Dugo, G. 46 Rimdusit, S. 94 Fernández, A. M. 9 Ritkrerkkrai, C. 50 Fonseca i Casas, A. 41 Romero, V. C. 9 Fonseca i Casas, P. 41 Salom, J. 41 Fraguela, F. 31 Satsananan, C. 111 Garrido-Soriano, N. 41 Setsri, P. 94 Huong, P. T. 124 Sidorov, A. I. 75 Jegal, Y. 20 Soler, I. J. M. 9 Kartal, S. 26 Stepacheva, A. A. 75 Kim, J. 124 Sulman, E. M. 75 Kirubasankar, K. 55 Suridechakul, W. 106 Kolodyazhny, S. A. 36 Teshale, A. 116 Kosivtsov, Y. Y. 75 Thriveni, T. 20 Kronprasert, N. 59 Tippayawong, N. 81 Kumar, A. S. 55 Vasi, S. 46 Lee, B.-K. 124 Wannathanom, C. 94 Lugovoy, Y. V. 75 Wongsapai, W. 50 Mallamace, D. 46 Yoowattana, K. 85 Mallamace, F. 46


![Chapter 3: Fuzzy Rules & Fuzzy Reasoning513].pdf · CH. 3: Fuzzy rules & fuzzy reasoning 1 Chapter 3: Fuzzy Rules & Fuzzy Reasoning ... Application of the extension principle to fuzzy](https://img.pdfslide.us/doc/110x75/5b3ed7b37f8b9a3a138b5aa0/chapter-3-fuzzy-rules-fuzzy-513pdf-ch-3-fuzzy-rules-fuzzy-reasoning.jpg)