Embed Size (px)
Citation preview
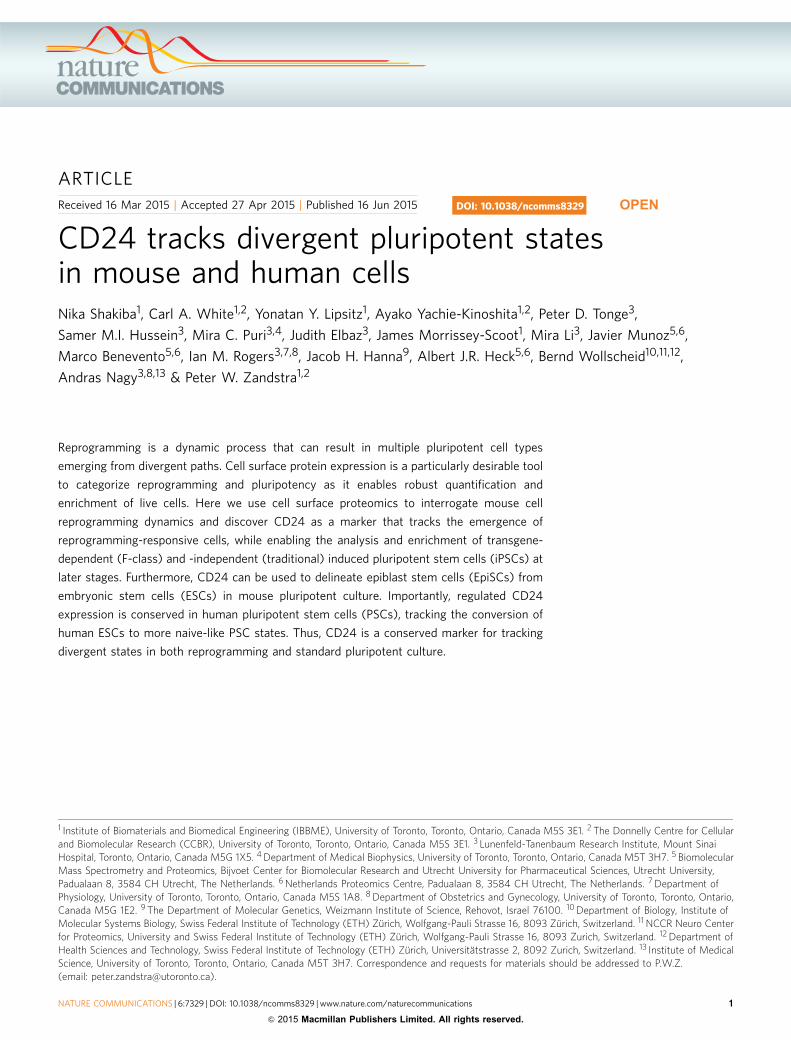
ARTICLE
Received 16 Mar 2015 | Accepted 27 Apr 2015 | Published 16 Jun 2015
CD24 tracks divergent pluripotent statesin mouse and human cellsNika Shakiba1, Carl A. White1,2, Yonatan Y. Lipsitz1, Ayako Yachie-Kinoshita1,2, Peter D. Tonge3,
Samer M.I. Hussein3, Mira C. Puri3,4, Judith Elbaz3, James Morrissey-Scoot1, Mira Li3, Javier Munoz5,6,
Marco Benevento5,6, Ian M. Rogers3,7,8, Jacob H. Hanna9, Albert J.R. Heck5,6, Bernd Wollscheid10,11,12,
Andras Nagy3,8,13 & Peter W. Zandstra1,2
Reprogramming is a dynamic process that can result in multiple pluripotent cell types
emerging from divergent paths. Cell surface protein expression is a particularly desirable tool
to categorize reprogramming and pluripotency as it enables robust quantification and
enrichment of live cells. Here we use cell surface proteomics to interrogate mouse cell
reprogramming dynamics and discover CD24 as a marker that tracks the emergence of
reprogramming-responsive cells, while enabling the analysis and enrichment of transgene-
dependent (F-class) and -independent (traditional) induced pluripotent stem cells (iPSCs) at
later stages. Furthermore, CD24 can be used to delineate epiblast stem cells (EpiSCs) from
embryonic stem cells (ESCs) in mouse pluripotent culture. Importantly, regulated CD24
expression is conserved in human pluripotent stem cells (PSCs), tracking the conversion of
human ESCs to more naive-like PSC states. Thus, CD24 is a conserved marker for tracking
divergent states in both reprogramming and standard pluripotent culture.
DOI: 10.1038/ncomms8329 OPEN
1 Institute of Biomaterials and Biomedical Engineering (IBBME), University of Toronto, Toronto, Ontario, Canada M5S 3E1. 2 The Donnelly Centre for Cellularand Biomolecular Research (CCBR), University of Toronto, Toronto, Ontario, Canada M5S 3E1. 3 Lunenfeld-Tanenbaum Research Institute, Mount SinaiHospital, Toronto, Ontario, Canada M5G 1X5. 4 Department of Medical Biophysics, University of Toronto, Toronto, Ontario, Canada M5T 3H7. 5 BiomolecularMass Spectrometry and Proteomics, Bijvoet Center for Biomolecular Research and Utrecht University for Pharmaceutical Sciences, Utrecht University,Padualaan 8, 3584 CH Utrecht, The Netherlands. 6 Netherlands Proteomics Centre, Padualaan 8, 3584 CH Utrecht, The Netherlands. 7 Department ofPhysiology, University of Toronto, Toronto, Ontario, Canada M5S 1A8. 8 Department of Obstetrics and Gynecology, University of Toronto, Toronto, Ontario,Canada M5G 1E2. 9 The Department of Molecular Genetics, Weizmann Institute of Science, Rehovot, Israel 76100. 10 Department of Biology, Institute ofMolecular Systems Biology, Swiss Federal Institute of Technology (ETH) Zurich, Wolfgang-Pauli Strasse 16, 8093 Zurich, Switzerland. 11 NCCR Neuro Centerfor Proteomics, University and Swiss Federal Institute of Technology (ETH) Zurich, Wolfgang-Pauli Strasse 16, 8093 Zurich, Switzerland. 12 Department ofHealth Sciences and Technology, Swiss Federal Institute of Technology (ETH) Zurich, Universitatstrasse 2, 8092 Zurich, Switzerland. 13 Institute of MedicalScience, University of Toronto, Toronto, Ontario, Canada M5T 3H7. Correspondence and requests for materials should be addressed to P.W.Z.(email: [email protected]).
NATURE COMMUNICATIONS | 6:7329 | DOI: 10.1038/ncomms8329 | www.nature.com/naturecommunications 1
& 2015 Macmillan Publishers Limited. All rights reserved.
Exogenous overexpression of four key transcription factors—Oct4, Klf4, c-Myc and Sox2 (OKMS)—allows somatic cellsto be induced to a pluripotent state1,2. The induced
pluripotent stem cells (iPSCs) that emerge as a result ofreprogramming are able to contribute to all three germ layersand give rise to an adult organism1. Analysis of thereprogramming time course has revealed checkpoints throughwhich cells traverse at the genomic3,4, proteomic5,6 andepigenetic4 levels to achieve a final iPSC state. In the mousesystem, SSEA1 is a widely used marker to track the initiation ofreprogramming, Nanog and Oct4 for maturation, and Pecam1 tosignify stabilization in an iPSC state3,4. Important hallmarks ofsuccessful reprogramming include the ability to silence transgenesand the ability to give rise to all germ layers on differentiation1,7,8.
While surrogate markers have been used to track theemergence of embryonic stem cell (ESC)-like iPSCs duringreprogramming, not all cells traverse common checkpoints toattain a final transgene-independent pluripotent cell state4,8. Infact, it has been shown that OKMS factor expression levels play arole in directing cell fate changes during reprogramming.Recently, Tonge et al.9 showed that high levels of OKMSexpression direct cells along a divergent reprogramming route toproduce ‘F-class’ iPSCs, a novel class of iPSC that is transgene-dependent while exhibiting pluripotent properties. This novelstate provides insights into the potential spectrum of statesemerging as a result of OKMS overexpression while alsopossessing advantageous properties over traditional, ESC-likecells. F-class iPSCs not only possess a growth advantage overESC-like iPSCs, but their self-renewal is leukemia inhibitoryfactor (LIF)-independent, allowing for cost-efficient cellproduction9. Furthermore, F-class cells can be transitioned toan ESC-like iPSC state with the addition of histone deacetylaseinhibitors9.
With growing knowledge on the role of OKMS expressionlevels in directing cell fate changes there is a need for easy andreliable benchmarking tools to track cell state during reprogram-ming. Cell surface proteins are particularly desirable as a toolbecause of their ability to be quantified with relative ease andwithout the need to sacrifice cell viability.
As part of the international Project Grandiose initiative10, weset out to identify surface glycoproteins emerging during highOKMS factor expression that could capture divergent cell statechanges between transgene-dependent (F-class) and ESC-likeiPSCs9. Our analysis and subsequent validation reveal CD24 as anovel candidate marker that is able to demarcate transgene-dependent (F-class) and transgene-independent (ESC-like) mouseiPSCs while identifying ‘primed’ and ‘naive’ pluripotent states intransgene-independent populations. Importantly, CD24 exhibitsconservation in the human system, tracking the conversion ofhuman ESCs to more naive-like alternative pluripotent states11,thus allowing for enrichment of these cells.
ResultsCell surface proteome dynamics during reprogramming. Inorder to investigate changes in cell surface glycoproteins resultingin high OKMS factor expression, we employed a secondary (2�),doxycycline (DOX)-inducible mouse embryonic fibroblast (MEF)1B reprogramming system7,10. As previously described10, cellsamples were collected at multiday intervals over the completereprogramming time course of 30 days (cultured at1,500 ng ml� 1 of DOX and termed the ‘DOX-high (H)’ timecourse), and over one derivate time course (cultured at5 ng ml� 1, termed ‘DOX-low (L)’), which was split from theDOX-high time course on day 8 (ref. 10). Samples were thenprepared for protein analysis using mass spectrometry through
enrichment for cell surface glycopeptides12, and labelling of ‘full’protein content for quantification13, reported by Beneventoet al.14. A summary of the mass spectrometry pipeline is shownin Supplementary Fig. 1a.
We identified a total of 896N-glycosylated peptides, representing432 protein groups (or ‘proteoforms’15) at an estimated confidencelevel of 98% (Supplementary Data 1 provides a deconvolution ofisoforms). To the best of our knowledge, 34 of these proteoformshave not previously been definitively detected at the cell surfaceand 86 have not been reported in the context of ESC/iPSC. A list ofamino-acid sequences for the 896 detected glycopeptides isprovided with sequons highlighted as a resource addressing sitesof N-glycosylation (Supplementary Data 2). Panther gene listanalysis16,17 of the genes corresponding to the full set of detectedsurface proteins reported their division into eight functionalcategories (Supplementary Fig. 1b). Receptor, catalytic, bindingand transporter activities proved to be dominant. The s.d. of thepercentage proportion across the intervals for a given categoryaveraged to 1.5% for all categories (Supplementary Data 3).
Raw, normalized and averaged spectral counts across threetechnical replicates per point of the DOX-high time course arepresented in Supplementary Data 4. Results are also available onwww.stemformatics.org as track files, which enables automatedupload to the UCSC genome browser18. In order to improve therigour of the quantitative analysis, we used only that subset of thedetected cell surface proteome which overlapped those proteinsdetected in the ‘full’ proteome14, namely 185 proteoforms, exceptwhere otherwise noted. Together, these are listed for furtherexamination as potential surface markers (Supplementary Data 5).
The sharpest degree of protein change at the cell surfaceoccurred between days 0 and 2 (Supplementary Fig. 1c). Down-regulation was observed across all of the functional categories(Supplementary Data 6). The distribution of the downregulatedproteins among functional categories was congruent to theproportions of the categories for the full list of detected cellsurface proteins. Complementary upregulation occurred betweenday 18 (H) and the 2� iPSC state (Supplementary Fig. 1d), and toa lesser extent, between day 21 (DOX-low) and the 2� iPSC state.Overall, 78% of the post day 18 upregulated proteins (includingmost collagens and integrins) were previously downregulatedtwofold or more (between days 0 and 2). This indicatesthe impact of transgene activation in directing changesat the cell surface. Interestingly, as compared with the globalproteome monitored throughout reprogramming14, cell surfaceglycoproteins are proportionally over-represented amongproteins exhibiting twofold or greater change between eachtime point, and in proteins associated with cell signalling and cellsurface receptor expression (Supplementary Data 6). Together,these results underline the importance of utilizing these proteinsto track cell state changes.
Consistent with the other ‘omic’ analyses conducted as part ofthe Project Grandiose reprogramming analysis10, principalcomponent analysis of surface proteins depicted the DOX-hightime course diverging from an ESC-like state to a separate state,whereas the DOX-low time course converges on the ESC-likestate (Fig. 1a). The divergence suggests the possibility of capturingan alternative reprogramming state, F-class9, by means of surfaceproteomics. We then conducted subsequent analysis to selectsurface proteins for additional scrutiny and validation(Supplementary Fig. 2). First, we conducted K-means clusteringanalysis to select genes that are differentially expressed in theF-class state, identifying two clusters of genes that are upregulatedfollowing DOX induction and maximally expressed at the F-classstate (Supplementary Fig. 2). Of these genes, we selected thosewith the highest contribution to the principal componentsseparating the F-class and ESC states as well as F-class and
ARTICLE NATURE COMMUNICATIONS | DOI: 10.1038/ncomms8329
2 NATURE COMMUNICATIONS | 6:7329 | DOI: 10.1038/ncomms8329 | www.nature.com/naturecommunications
& 2015 Macmillan Publishers Limited. All rights reserved.

MEF states. This produced a list of genes, of which many weremetabolic or neural markers. A handful of proteins were chosenbased on this analysis as well as antibody availability(Supplementary Fig. 3) for validation along the reprogrammingtime course (Fig. 1b), which revealed CD24 as the best candidatebased on its ability to differentiate between emerging F-class andESC-like iPSCs (Fig. 1c). We next proceeded with a detailedcharacterization of CD24 expression during reprogramming.
CD24 as a marker of divergent reprogramming states. ProjectGrandiose ‘omic’ data show transcriptional upregulation of CD24expression following DOX addition and a reduction in the ESC-like iPSC state (Supplementary Fig. 4a). Furthermore, the CD24locus exhibits high levels of H3K4me3 and H3K36me3 activationmarks during the reprogramming time course, with elevatedH3K27me3 repressive mark at the final ESC-like iPSC stage10
(Supplementary Fig. 4a). This trend was conserved in previouslypublished reprogramming systems3,4,8,19,20, where the levels ofCD24 increase following reprogramming induction anddownregulate at the iPSC state where ectopic transgeneexpression is removed (Supplementary Fig. 5). Furthermore,CD24 levels are further reduced in the Thy1þ fraction of cells ascompared with the reprogramming Thy1-/SSEA1þ fractions inthe Polo et al. data set, supporting the view that expression of
CD24 can help distinguish reprogramming cells from somaticand pluripotent cell states (Supplementary Fig. 5d).
Recently, CD44 and Icam1 were used to track the progressionof reprogramming MEFs as they move through CD44þ /Icam1� and CD44� /Icam1� /Nanogþ states to reach a finalCD44� /Icam1þ iPSC state6. CD44/Icam1 dynamics in theProject Grandiose data exhibited a similar trajectory, with CD44transcriptome levels reaching maximal levels following DOXaddition and decreasing as the ESC-like iPSC state is reached,consistent with the acquisition of the H3K27me3 repressive markat the ESC-like iPSC state10 (Supplementary Fig. 6a). Icam1 levelsdecrease following DOX removal and increase as cells progressthrough reprogramming, reaching a maximal level at theESC-like iPSC state where H3K27me3 repression marks are lostand H3K36me3 activation marks are gained10 (SupplementaryFig. 6a). In order to assess the utility of combining CD44/Icam1and CD24 as markers to delineate divergent reprogrammingpopulations, we next evaluated the expression of these markers onlive reprogramming cells using flow cytometry.
Analysis of CD24 expression was conducted using 2�MEFstreated in the DOX-high (DOXH), DOX-low-to-negative(DOXL� ) and DOX-high-to-negative (DOXH� ) time course,as previously described (Fig. 1b)10. Importantly, CD24 expressionlevels showed concordance across flow cytometry and massspectrometry platforms (Supplementary Fig. 4b). Flow cytometry
2°MEF
1°iPS
ESC-like state
2°iPS
2°MEF
D5HD2HD8H
D11H
D16H D18H
D21Ø 1.5 µg ml–1
Sampled time point
5 ng ml–1
D0 D2 D5 D8D11 D14 D16 D18 D30
0 ng ml–1
[DO
X]
DOX low(DOXL–)
DO
XL–
DO
XH
–
DOX highto negative(DOXH–)
DOX high(DOXH)
D21L
D16LESC
PC
2 (2
4% o
f var
ianc
e)
D0
ESC
SS
EA
1
CD24
DOX highfavoured
DOX lowfavoured
SSEA1–
CD24L CD24H
CD24L CD24H
CD24L CD24H CD24L CD24H CD24L CD24H CD24L CD24H CD24L CD24H CD24L CD24H CD24L CD24H
DO
XH
D2
PC1 (45% of variance)
F-class state
D5 D8 D11 D16 D18 D30
CD24L CD24H CD24L CD24H CD24L CD24H CD24L CD24H
CD24L CD24H
Figure 1 | Surface proteome analysis during reprogramming identifies CD24 as a differentially expressed surface marker. (a) Principal component
analysis of the surface proteome (including only the subset of surface proteins that were also present in the global proteome screen to improve rigour of
quantitative analysis) of reprogramming secondary MEF 1B cells derived from tetraploid complementation, showing divergent routes of F-class and ESC-like
iPSCs. (b) Summary of sampling time course and DOX treatment protocols. (c) Representative flow cytometry plots of CD24 versus SSEA1 expression
during reprogramming of secondary MEF 1B cells derived from tetraploid complementation, revealing emerging CD24high/SSEA1þ (CD24H) and
CD24low/SSEA1þ (CD24L) subpopulations. ESC control is included for comparison. Flow plots are representative from three biological replicates.
NATURE COMMUNICATIONS | DOI: 10.1038/ncomms8329 ARTICLE
NATURE COMMUNICATIONS | 6:7329 | DOI: 10.1038/ncomms8329 | www.nature.com/naturecommunications 3
& 2015 Macmillan Publishers Limited. All rights reserved.
for CD24/SSEA1 expression along the three DOX time coursesrevealed the emergence of a CD24high/SSEA1þ population inthe DOXH condition, hereafter referred to as CD24H cells, whilea CD24low/SSEA1þ population stabilized in the DOXL� andDOXH� conditions, hereafter referred to as CD24L cells(Fig. 1c, Supplementary Fig. 7a). The gating strategy henceforthused to define and quantify CD24H/L cells is shown inSupplementary Fig. 7b. Importantly, when the CD24/SSEA1staining strategy was applied to a different reprogrammingsystem, Col1a1 secondary reprogramming MEFs21, the utility ofCD24 as a marker for tracking reprogramming is conserved(Supplementary Fig. 8a). As anticipated, DOX treatmentupregulated CD24 such that nearly all cells (93.8±0.4%) wereCD24high by 2 days (Supplementary Fig. 8a). While thisreprogramming system did not give rise to SSEA1þ cells asquickly as the 1B system, a small CD24H fraction emerged after8 days of DOX treatment (Supplementary Fig. 8a); however, thisCD24H subpopulation was largely transient and the CD24Lfraction dominated (Supplementary Fig. 8a). This is consistentwith the observation of Tonge et al.22 that these cells do notstabilize in an F-class state.
F-class cells are known to homogenously emerge in DOXHconditions (using the 2�MEF 1B tetraploid system) while ESC-like iPSCs are observed solely in DOX-negative (DOX� )conditions9,10. This suggested that CD24H cells (in DOXH)may correspond to F-class cells, while CD24L cells maycorrespond to ESC-like iPSCs. Control ESCs exhibited a CD24Lstaining profile, supporting this hypothesis (Fig. 1c). F-class cellsderived from primary DOX-inducible 1B cells as well as tail tipfibroblasts also showed a consistent CD24H expression profile(Supplementary Fig. 8b). Interestingly, secondary MEFs derivedfrom a 27% chimera, exhibiting different OKMS expression levels,also traverse a CD24H state following DOX induction(Supplementary Fig. 9). This observation also supports the factthat OKMS stoichiometry plays a role in directing cell fate inreprogramming9,10. In fact, a recent report shows that lowerlevels of Klf4 overexpression during reprogramming stalls thecells in a partially reprogrammed, transgene-dependent state23,which is consistent with our observation that, while MEF 1Bsderived from tetraploid complementation give rise to F-class cellsrobustly, 1B MEFs from 27% chimeras exhibit higher levels ofKlf4 transgene (Supplementary Fig. 9c) and are able to give rise toESC-like iPSCs in DOXH culture (Supplementary Fig. 9a).
While CD24 shows potential for demarcating divergentpopulations emerging from unique DOX treatment time courses,flow cytometry staining for CD44/Icam1 shows DOXH-treatedcells prematurely transition to a CD44� /Icam1þ state, whichis reportedly indicative of Nanogþ iPSCs6 (SupplementaryFig. 6b,c). Thus, CD44/Icam1 cannot demarcate F-class and ESC-like iPSCs, demonstrating the utility of CD24 for categorizingreprogramming populations. Interestingly, CD44þ /Icam1þcells maintain the highest proportions of CD24high cells, whileCD44-/Icam1þ cells exhibit the lowest proportion of CD24high
cells in intermediate reprogramming stages (SupplementaryFig. 6d). As a positive marker for the F-class state, CD24allows for a direct demarcation of divergent reprogrammingfrom an ESC-like state, which is well characterized andidentified by surface proteins such as Pecam1, E-cadherin3 andCD44/Icam1 (ref. 6).
Characterization of CD24H and CD24L subpopulations. Inorder to comprehensively compare CD24H and CD24L cells toF-class/ESC-like iPSCs, we chose the following criteria to char-acterize the newly defined cells (Fig. 2a): CD24/SSEA1 expressionlevels compared with ESC controls; morphology in native culture;
morphology in response to DOX removal; stability followingextensive passaging; dependence of proliferation on DOX; andgene expression profile.
Quantification of the percentage of CD24H and CD24L cellsemerging in the DOX time courses suggested that CD24H cellsarise homogenously in DOXH culture, exhibiting an F-classmorphology, while CD24L cells emerge in DOXL� andDOXH� culture, exhibiting an ESC-like morphology(Fig. 2b,c, Supplementary Fig. 10a). Control ESCs expressed aCD24low/SSEA1þ profile, consistent with CD24L cells (Figs 1cand 2b). This trend was independent of passaging frequency(Supplementary Fig. 10b). Following sorting for the CD24H andCD24L populations from DOXH and DOXL� time courses onday 30 of reprogramming, CD24H cells maintained their F-classmorphology while DOX removal resulted in the loss of these cells(Fig. 2d), consistent with reports from Tonge et al.9 On the otherhand, CD24L-sorted cells maintained their ESC-like morphologyand were stable in both DOXH and DOX� conditions (Fig. 2d).
Continued passaging of CD24H cells in DOXH and CD24L cells(from DOXL� and DOXH� time courses) in DOX�conditions revealed that these cells maintained their CD24expression profiles in their native DOX conditions (Fig. 2e;Supplementary Figs 10c and 11a). Consistent with the observationof CD24H DOX dependence, removal of DOX in these cellsresulted in reduced proliferation, assessed by 5-ethynyl-20-deoxyuridine (EdU) staining (Fig. 2f). Gene expression analysisshowed CD24H cells (derived from day 30 DOXH culture)clustered with F-class cells (taken from Tonge et al.9),while CD24L cells (derived from day 30 DOXL� and DOXH�culture) clustered with ESCs, confirming the ability of CD24/SSEA1 staining to demarcate F-class and ESC-like iPSCpopulations (Fig. 2g). As expected, ESC-like iPSC markers,Pecam1 and E-cadherin, were seen in CD24L cells while not inCD24H cells (Supplementary Fig. 11b). Furthermore, CD24L cellsexhibited levels of OKMS expression that are consistent with ESCs(Fig. 2g). Consistent with Tonge et al.9, both CD24H and CD24Lcells were able to contribute to the three germ layers followingin vitro differentiation (Supplementary Fig. 12). Overall, thesestudies reveal that CD24 can separate the transgene-dependentF-class iPSCs from the transgene-independent ESC-like iPSCs.
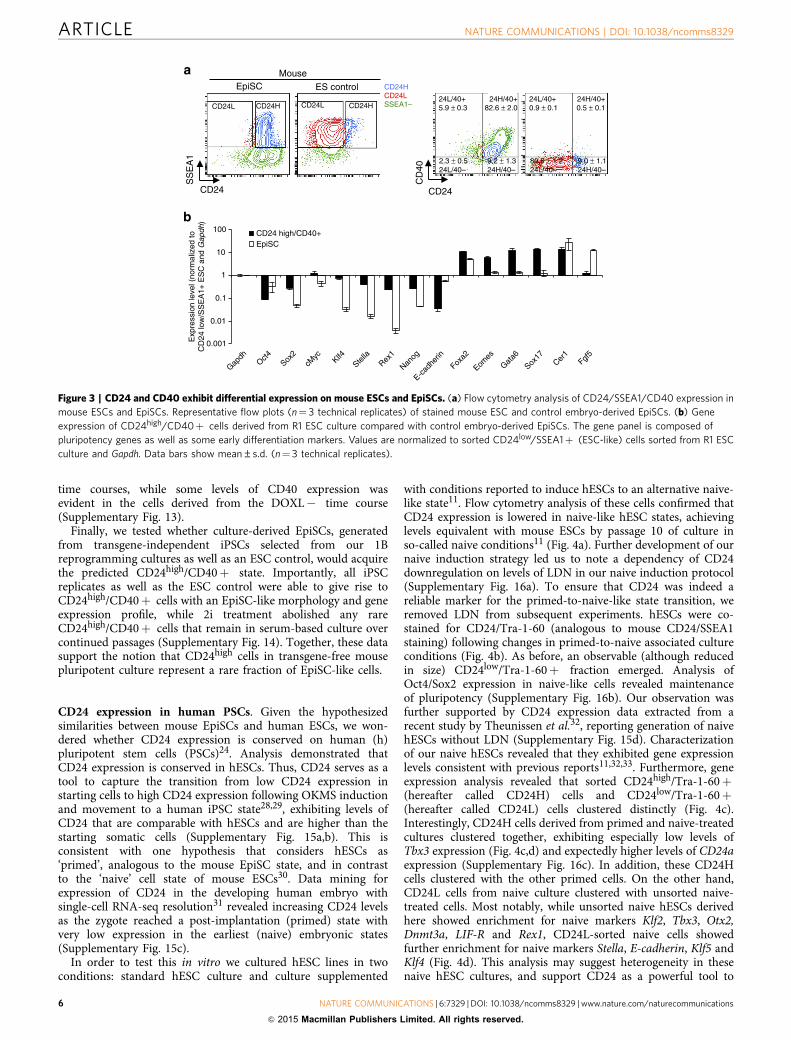
CD24 demarcates transgene-independent pluripotent states.We have shown that CD24 can be used to demarcate transgene-dependent F-class cells from ESC-like iPSCs. Given the role ofCD24 in separating these iPSC states, we wondered whether CD24would show conservation and utility in nonreprogrammed plur-ipotent populations. In order to investigate this possibility, we co-stained both mouse ESC and epiblast stem cell (EpiSC) popula-tions for CD40 (a known EpiSC surface marker24) and CD24.Staining for CD24/CD40/SSEA1 levels in control mouse ESCs andEpiSCs confirmed the ability of CD24high/CD40þ staining toidentify the EpiSC state, while ESCs were CD24low/CD40�(Fig. 3a). In order to better characterize the rare CD24high cellsemerging in standard ESC populations, we cultured ESCs in serumand LIF conditions and sorted for the rare CD24high/CD40þ(EpiSC-like) as well as the prevalent CD24low/SSEA1þ (standardESC) fraction of cells and conducted a survey of pluripotency andearly differentiation gene expression25 (Fig. 3b). As expected,EpiSC-like CD24high/CD40þ cells exhibited lowered levels ofnaive pluripotency genes such as Stella, Rex1 and Nanog while alsoexhibiting higher levels of Foxa2, Eomes, Gata6, Sox17, Cer1 andFgf5 (Fig. 3b). The observation of this rare EpiSC-like fraction ofcells in serum-based ESC culture has been previously observed26,27.
Importantly, CD40 staining was negative in F-class and ESC-like iPSCs derived from the DOXH or DOXH� reprogramming
ARTICLE NATURE COMMUNICATIONS | DOI: 10.1038/ncomms8329
4 NATURE COMMUNICATIONS | 6:7329 | DOI: 10.1038/ncomms8329 | www.nature.com/naturecommunications
& 2015 Macmillan Publishers Limited. All rights reserved.

DOXH
DOXH
DOXL–
DOXL–
DOXH–
DOXH–
DOXH– CD24L cells in DOX–
DOXH CD24H cells in DOXHDOXL– CD24L cells in DOX–
Comprehensivecharacterization
ESC
ESC
Property
CD24 expression profile
Figure
2b
2c
2d
2e
2f
2g
Morphology in native DOX
Morphology after DOX removal
Stability over passages
Proliferation after DOX removal
Gene expression profile
(comparison withF-class and
ESC-like iPSC)
0
20
40
60
% C
D24
H%
CD
24L
% C
D24
H%
CD
24L
80
100
0
20
D0
p7 p11
p13
p14
p15
D2 D5 D8D11 D16 D18 D30
ESC
40
60
80
100
020406080
100
020406080
100
2010
100
CD24
SSEA1–
DOX lowfavored
D30sort
DOXhighfavoured
SS
EA
1
0
DO
XH
CD
24H
DOXH
DOXH
DOXH
CD24H
CD24LD
OX
L–C
D24
LDOX–
DOX–
DOX–
DO
XH
–C
D24
L
ES
C4030
50
% E
dU+
7060
8090
0
Log
(gen
e ex
pres
sion
nor
mal
ized
to M
EF
)
1
–1
2
–2
3
–3
Thy
1
Esr
rb
Nan
og
Sal
l4
Nkx
2_3
Klf4
cMyc
Insm
l
Sox
2
Fet
ub
Oct
4
E-c
ad
Oct
4_en
do
D2 1B tetr DOXH
D30 DOXH CD24H
F-class
D30 DOXL– CD24L
D30 DOXH– CD24L
D30 DOXH– CD24L
ESC
DOXL– DOXH– ESDOXH
Figure 2 | CD24H and CD24L subpopulations correspond to transgene-dependent (F-class) and ESC-like iPSCs, respectively. (a) Summary of approach
to characterize CD24H and CD24L populations. (b) Percentage of CD24H and CD24L cells in DOXH, DOXL� and DOXH� culture time courses. Data
bars show mean±s.d. (n¼ 3 biological replicates). (c) Representative phase contrast images (n¼ 3 biological replicates) of emerging colonies in the three
DOX treatments, including ESC control. Scale bar, 125mm. (d) Summary of sorting strategy used to separate CD24H and CD24L subpopulations from D30
culture. Representative phase contrast images (n¼ 3 technical replicates) of sorted CD24H and CD24L cells in DOXH and DOX� conditions. Scale bar,
125mm. (e) Effect of long-term passaging on levels of CD24H and CD24L cells in D30-sorted DOXH CD24H, DOXL� CD24L and DOXH� CD24L cells.
ESCs are included as a control. Data bars show mean±s.d. (n¼ 3 technical replicates). (f) EdU staining of DOXH CD24H, DOXL� CD24L and DOXH�CD24L cells in DOXH and DOX� conditions to assess DOX dependence of proliferation. Data bars show mean±s.d. (n¼ 3 technical replicates).
(g) Expression levels of various pluripotent and F-class-specific genes in CD24H and CD24L cells with unsupervised hierarchical clustering, including
F-class and ESC cell controls, normalized to Gapdh and MEF cells.
NATURE COMMUNICATIONS | DOI: 10.1038/ncomms8329 ARTICLE
NATURE COMMUNICATIONS | 6:7329 | DOI: 10.1038/ncomms8329 | www.nature.com/naturecommunications 5
& 2015 Macmillan Publishers Limited. All rights reserved.
time courses, while some levels of CD40 expression wasevident in the cells derived from the DOXL� time course(Supplementary Fig. 13).
Finally, we tested whether culture-derived EpiSCs, generatedfrom transgene-independent iPSCs selected from our 1Breprogramming cultures as well as an ESC control, would acquirethe predicted CD24high/CD40þ state. Importantly, all iPSCreplicates as well as the ESC control were able to give rise toCD24high/CD40þ cells with an EpiSC-like morphology and geneexpression profile, while 2i treatment abolished any rareCD24high/CD40þ cells that remain in serum-based culture overcontinued passages (Supplementary Fig. 14). Together, these datasupport the notion that CD24high cells in transgene-free mousepluripotent culture represent a rare fraction of EpiSC-like cells.
CD24 expression in human PSCs. Given the hypothesizedsimilarities between mouse EpiSCs and human ESCs, we won-dered whether CD24 expression is conserved on human (h)pluripotent stem cells (PSCs)24. Analysis demonstrated thatCD24 expression is conserved in hESCs. Thus, CD24 serves as atool to capture the transition from low CD24 expression instarting cells to high CD24 expression following OKMS inductionand movement to a human iPSC state28,29, exhibiting levels ofCD24 that are comparable with hESCs and are higher than thestarting somatic cells (Supplementary Fig. 15a,b). This isconsistent with one hypothesis that considers hESCs as‘primed’, analogous to the mouse EpiSC state, and in contrastto the ‘naive’ cell state of mouse ESCs30. Data mining forexpression of CD24 in the developing human embryo withsingle-cell RNA-seq resolution31 revealed increasing CD24 levelsas the zygote reached a post-implantation (primed) state withvery low expression in the earliest (naive) embryonic states(Supplementary Fig. 15c).
In order to test this in vitro we cultured hESC lines in twoconditions: standard hESC culture and culture supplemented
with conditions reported to induce hESCs to an alternative naive-like state11. Flow cytometry analysis of these cells confirmed thatCD24 expression is lowered in naive-like hESC states, achievinglevels equivalent with mouse ESCs by passage 10 of culture inso-called naive conditions11 (Fig. 4a). Further development of ournaive induction strategy led us to note a dependency of CD24downregulation on levels of LDN in our naive induction protocol(Supplementary Fig. 16a). To ensure that CD24 was indeed areliable marker for the primed-to-naive-like state transition, weremoved LDN from subsequent experiments. hESCs were co-stained for CD24/Tra-1-60 (analogous to mouse CD24/SSEA1staining) following changes in primed-to-naive associated cultureconditions (Fig. 4b). As before, an observable (although reducedin size) CD24low/Tra-1-60þ fraction emerged. Analysis ofOct4/Sox2 expression in naive-like cells revealed maintenanceof pluripotency (Supplementary Fig. 16b). Our observation wasfurther supported by CD24 expression data extracted from arecent study by Theunissen et al.32, reporting generation of naivehESCs without LDN (Supplementary Fig. 15d). Characterizationof our naive hESCs revealed that they exhibited gene expressionlevels consistent with previous reports11,32,33. Furthermore, geneexpression analysis revealed that sorted CD24high/Tra-1-60þ(hereafter called CD24H) cells and CD24low/Tra-1-60þ(hereafter called CD24L) cells clustered distinctly (Fig. 4c).Interestingly, CD24H cells derived from primed and naive-treatedcultures clustered together, exhibiting especially low levels ofTbx3 expression (Fig. 4c,d) and expectedly higher levels of CD24aexpression (Supplementary Fig. 16c). In addition, these CD24Hcells clustered with the other primed cells. On the other hand,CD24L cells from naive culture clustered with unsorted naive-treated cells. Most notably, while unsorted naive hESCs derivedhere showed enrichment for naive markers Klf2, Tbx3, Otx2,Dnmt3a, LIF-R and Rex1, CD24L-sorted naive cells showedfurther enrichment for naive markers Stella, E-cadherin, Klf5 andKlf4 (Fig. 4d). This analysis may suggest heterogeneity in thesenaive hESC cultures, and support CD24 as a powerful tool to
100
CD24CD24
MouseCD24HCD24LSSEA1–
EpiSC ES control24L/40+0.9 ± 0.1
24H/40+82.6 ± 2.0
24L/40+5.9 ± 0.3
2.3 ± 0.524L/40–
9.2 ± 1.324H/40–
89.5 ± 1.224L/40–
9.0 ± 1.124H/40–
24H/40+0.5 ± 0.1CD24L CD24H CD24L CD24H
CD
40
SS
EA
1
CD24 high/CD40+EpiSC
10
1
0.1
Exp
ress
ion
leve
l (no
rmal
ized
toC
D24
low
/SS
EA
1+ E
SC
and
Gap
dh)
0.01
0.001
Gapdh
Oct4Sox
2cM
yc Klf4Ste
llaRex
1
Nanog
E-cad
herin
Foxa2
Eomes
Gata6
Sox17
Cer1
Fgf5
Figure 3 | CD24 and CD40 exhibit differential expression on mouse ESCs and EpiSCs. (a) Flow cytometry analysis of CD24/SSEA1/CD40 expression in
mouse ESCs and EpiSCs. Representative flow plots (n¼ 3 technical replicates) of stained mouse ESC and control embryo-derived EpiSCs. (b) Gene
expression of CD24high/CD40þ cells derived from R1 ESC culture compared with control embryo-derived EpiSCs. The gene panel is composed of
pluripotency genes as well as some early differentiation markers. Values are normalized to sorted CD24low/SSEA1þ (ESC-like) cells sorted from R1 ESC
culture and Gapdh. Data bars show mean±s.d. (n¼ 3 technical replicates).
ARTICLE NATURE COMMUNICATIONS | DOI: 10.1038/ncomms8329
6 NATURE COMMUNICATIONS | 6:7329 | DOI: 10.1038/ncomms8329 | www.nature.com/naturecommunications
& 2015 Macmillan Publishers Limited. All rights reserved.

resolve this heterogeneity and enrich for hPSCs in differentpluripotent states.
DiscussionHere we have identified CD24 as a novel cell surface markerexpressed dynamically during reprogramming. CD24 servesboth as a marker to demarcate transgene-dependent (F-class)and -independent (ESC-like) mouse iPSCs and for delineating
naive-like and primed pluripotent states in both mouse andhuman (Fig. 5).
CD24, also known as heat-stable antigen, is a glycosylpho-sphatidylinositol-linked cell surface protein, with a core of 27amino acids34. It is abundantly expressed in haematopoietic andneural cells34 and is a known marker for B cells35, pancreatic stemcells36 and keratinocytes, with particular expression in areas ofthe hair follicle containing the colony-forming cells37,38. Indevelopment, CD24 expression can be found in the primitive
Passage 6CD24L
CD24L
CD24H
CD24H
CD24L CD24H
CD24L CD24H CD24L CD24H CD24L CD24H CD24L CD24H
Passage 10
Flu
ores
cenc
e (a
.u.)
Prim
ed h
ES
2
p8
p14
CD24
Unstained
1
0.5
0
–0.5
–1 Klf5
Esn
bO
ct4
Nan
ogD
ppa5
Dpp
a2E
-cad
Dnm
t3b
Ste
llaS
ox2
GA
PD
HC
D24
aR
ex1
LIF
-RD
nmt3
aO
tx2
Tbx
3K
lf2
Klf4
Primed hES2
Naive hES2
10 **
** ** ***
1
0.1
1
0.1
Unsor
ted
CD24H-s
orte
d
CD24L-
sorte
d
Unsor
ted
CD24H-s
orte
d
CD24L-
sorte
d
Unsor
ted
CD24H-s
orte
d
CD24L-
sorte
d
Unsor
ted
CD24H-s
orte
d
CD24L-
sorte
d
10
1
0.1
10
1
0.1
10
1
0.1
10
Tbx3
Stella E-cad Klf4 Klf5
Log
(gen
e ex
pres
sion
norm
aliz
ed to
‘prim
ed’ h
ES
2)Lo
g(ge
ne e
xpre
ssio
n no
rmal
ized
to ‘p
rimed
’ hE
S2)
‘Primed’ hES2
‘Naïve’ hES2
‘Naïve’ H9
Naïve (p13) CD24 high/Tra+
Naïve (p13) CD24 low/Tra+
Unsorted primed
Unsorted naive (p13)Unsorted naive (p10)
Primed CD24 high/Tra+
Primed CD24 low/Tra+
p9 p10 p13
CD24Tra
-1-6
0
Tra-1-60–
CD24 high/Tra-1-60+
CD24 low/Tra-1-60+
p16
Nai
ve h
ES
2N
aive
H9
Figure 4 | CD24 delineates ’primed’ and ’naive’ pluripotent states in human cells. (a) Flow cytometry analysis of CD24 expression in ‘primed’ and ‘naive’
human ESC lines following passages 6 and 10 in naive conditions. Flow plots are representative from three technical replicates. (b) CD24/Tra-1-60 s
taining of primed hES2 and naive-induced hES2 and H9 hESCs at indicated number of passages in naive conditions. Flow plots are representative
from three technical replicates. (c) Gene expression analysis of CD24high/Tra-1-60þ and CD24low/Tra-1-60þ cells sorted from primed and naive culture
at indicated passage number with unsupervised hierarchical clustering. Expression data are normalized to GAPDH and primed hES2 cells. (d) Gene
expression analysis comparing unsorted, CD24H-sorted and CD24L-sorted hES2 cells. Expression data are normalized to GAPDH and primed hES2
cells. Statistical significance is assessed by a Student’s t-test (heteroscedastic, two-sided). **Po0.05, *Po0.1. Data bars show mean±s.d. (n¼ 3 technical
replicates).
NATURE COMMUNICATIONS | DOI: 10.1038/ncomms8329 ARTICLE
NATURE COMMUNICATIONS | 6:7329 | DOI: 10.1038/ncomms8329 | www.nature.com/naturecommunications 7
& 2015 Macmillan Publishers Limited. All rights reserved.

ectoderm, mesoderm and ventral endoderm39. In general, CD24is expressed at higher levels in progenitor cells and metabolicallyactive cells than in terminally differentiated cells38. CD24 hasbeen shown to support cell adhesion of myeloid cells toP-selectin, whereby P-selectin acts as a ligand, triggeringdownstream src-family tyrosine kinases34. In the cancerliterature, CD24 has been found to correlate with aggressivetumour behaviour40,41 and serves as a marker for diagnosis andprognosis38. For example, CD24þ hepatocellular carcinoma cellsshowed an increased propensity for self-renewal, differentiationand metastasis as well as enriched levels of Sox2 and Oct4expression40. Importantly, knockdown of CD24 suppressed thesecharacteristics, supporting the functional role of CD24 intumorigenesis. Nanog has also been identified as an importantdownstream effector of CD24-mediated tumorigenicity and self-renewal, where CD24 phosphorylates STAT3 through src40.CD24-mediated c-src kinase activity has also been reported topromote integrin-mediated adhesion, epithelial-to-mesenchymaltransition and invasion in breast cancer42,43. Furthermore, arecent report has shown that CD24 affects cell cycle dynamics,whereby CD24 plays a role in functionally inactivating p53 inhuman prostate cancer cells44. These reported signalling cascadesmay provide insight into the CD24 status in pluripotent culture aswell, as there has been clear links between CD24 and corepluripotency and cell cycle regulators.
The cell surface proteome provides a means of accessing the cellstate without sacrificing viability6. We used mass spectrometry tomeasure changes in surface glycoprotein12 expression throughoutthe reprogramming time course and found that cell surfaceproteins are markedly over-represented in proteins undergoingtwo- or higher fold changes in expression. This suggested that thesurface proteome serves as a rich data set to identify markers thattrack cell state changes during reprogramming.
CD24 is upregulated quickly after reprogramming induction,reaching maximal levels within a few days of transgene over-expression in both the 1B and Col1a1 systems, with similar trendsobserved in other reported reprogramming systems. As a result,CD24 acts as a good marker to track the initiation ofreprogramming following OKMS overexpression, during whichthe cells acquire a CD24high/SSEA1� state. In the 1B system, cellstraversing the reprogramming route can become stabilized in aCD24high/SSEA1þ state, which is shown here to correspond torecently discovery transgene-dependent F-class iPSCs, derivedfrom high transgene reprogramming9. Cells that are able to acquirea transgene-independent ESC-like iPSC state are characterized by
CD24low/SSEA1þ expression. Following transgene removal,CD24 also shows the ability to distinguish primed and naivetransgene-independent pluripotent states. Published RNA-Seq datacomparing mouse ESC and EpiSC states suggest that EpiSCsexhibit higher CD24 levels45. Here we have confirmed that CD24shows strong correlation with the known EpiSC marker, CD40(ref. 24), and is able to separate ESCs and EpiSCs. Thus, we haveshown that three observed states in pluripotent culture could beidentified as a function of culture conditions and CD24 expressionin the following manner: CD24H cells in DOXH culture, which aretransgene-dependent, F-class, iPSCs; CD24L cells in DOX� ,which are ESC-like iPSCs; and CD24high cells in DOX� , whichare EpiSCs. The dual role of CD24 in delineating these threepopulations is outlined in Fig. 5b. An important methodologicaladvantage of CD24 during reprogramming is its ability to replacethe use of reprogramming state reporters. Other end-stage iPSCsurface markers, such as Pecam1 and E-cadherin, have the addeddifficulty of being sensitive to trypsinization46,47 and therefore arenot ideal for use. Furthermore, CD24 allows for the identificationof cells diverting to a transgene-dependent iPSC state, and theseparation of this cell type from more ESC-like iPSCs.
Importantly, CD24 also shows conservation in the humansystem. Consistent with the hypothesis that hESCs are in aprimed pluripotent state30, they exhibit high levels of CD24,analogous to mouse EpiSCs. Thus, CD24 may provide someutility in tracking the conversion towards a human iPSC state,which is characterized by high CD24 levels28,29. The recentidentification of culture conditions that promote conversion tonaive-like hESCs11,48 enabled the demonstration that CD24tracks these changes in the human system. Interestingly, duringin vivo human embryonic development, CD24 levels increase atthe single-cell level as the blastocyst undergoes implantation andreaches an epiblast stage31. Furthermore, naive-induced hESCpopulations that were sorted for CD24low cells were furtherenriched for naive hESC gene expression. Thus, CD24 serves as amarker for resolving heterogeneity in the naive hESC pool.
MethodsIdentification of cell surface proteins. A streamlined version of the cell surfacecapture protocol introduced in ref. 12 with simplified sample handling was appliedto identify N-glycosylated surface proteins over the project time course. The stepsinvolved are described in detail here. Between 5� 107 and 30� 107 cells (individualcounts varied by time points) were collected in a 50-ml tube and pelleted throughcentrifugation (350g), and then placed on ice. The pellets were resuspended once inice-cold labelling buffer (PBS-adjusted to pH 6.5 with 85% phosphoric acid), andthen again pelleted through centrifugation.
MEFHigh OKMS
F-class iPSC
OKMStransgeneremoval ESC-like iPSC
Multiplepluripotentstates
EpiSC
Latereprogramming
Earlyreprogramming
CD24
CD24
CD24H
SSEA1
CD24L
Tra-1-60
CD40
ESC
Mou
seH
uman
F-class EpiSC
PrimedNaive
Figure 5 | Summary of CD24 as a marker for three pluripotent states. (a) Overview of CD24 as a tool for tracking transgene induction in early
reprogramming, demarcating divergent reprogramming to F-class and ESC-like iPSC states in late reprogramming, and identifying multiple pluripotent
states in transgene-independent pluripotent culture. (b) Summary of approach for identifying mouse F-class iPSCs, ESC-like iPSCs and EpiSCs via CD24/
SSEA1/CD40 staining as well as human primed and naive hESCs via CD24/Tra-1-60 staining.
ARTICLE NATURE COMMUNICATIONS | DOI: 10.1038/ncomms8329
8 NATURE COMMUNICATIONS | 6:7329 | DOI: 10.1038/ncomms8329 | www.nature.com/naturecommunications
& 2015 Macmillan Publishers Limited. All rights reserved.

The cells were subsequently resuspended and oxidized for 15 min in the dark at4 �C with 1.6 mM sodium-meta-periodate (Sigma) in labelling buffer while beinggently agitated. The cell pellet was washed once with labelling buffer to removeresidual sodium-meta-periodate and to deplete dead cells and cell fragments.Following centrifugation, the cell pellet was resuspended and the cells exposed tothe labelling agent, biocytin hydrazide (Biotium), 5 mM in 10 ml labelling buffer,for 60 min at 4 �C on a rotator on slow speed. On labelling, the cell pellet waswashed once with ice-cold labelling buffer to remove unreacted biocytin hydrazideand to deplete dead cells/fragments.
The cell pellet was resuspended in 1 ml of ice-cold 0.1 M ammoniumbicarbonate (Sigma) and then transferred to a 1.5-ml Eppendorf tube. After 30 s ofindirection sonication on a VialTweeter (Hielscher) at 100% amplitude and 0.5cycle time, the suspension was centrifuged at 400g at 4 �C for 2 min and the size ofthe (now reduced) pellet noted. Additional sessions of 15 s of sonication followedby centrifugation were performed until the pellets no longer appeared to change insize. The lysate was then centrifuged at 2,500g at 4 �C for 15 min. The still-cloudysupernatant was transferred to another Eppendorf tube. After thorough mixing,two 2 l aliquots were set aside to perform a duplicate DC protein assay (Bio-Rad).The remaining supernatant was stored at � 80 �C.
The supernatant was thawed on ice once needed. A proportion calculated to hold5 mg of protein was transferred to a separate tube and the remainder put back instorage. Sufficient 100 mM ammonium bicarbonate was added to bring the volumeup to 1 ml, following which 100 ml of 1% RapiGest (Waters) in 100 mM ammoniumbicarbonate was added to bring the final concentration to 0.1%. This membranepreparation was indirectly sonicated at 100% amplitude and 0.5 cycle time for 3 minin a VialTweeter to obtain a translucent solution. Reduction: 100 mM TCEP (Sigma)in 100 mM ammonium bicarbonate was added to a final concentration of 5 mMTCEP. After 3 min as before in a VialTweeter, the sample was allowed to stand for30 min at room temperature. Alkylation: 500 mM iodoacetamide (Sigma) in 100 mMammonium bicarbonate was added to a final concentration of 10 mM iodoacetamideand the sample incubated for 30 min in the dark at room temperature. Digestion:50 mg of trypsin (Promega) was added to establish a 1:100 ratio with the measuredprotein content. The proteins were digested overnight at 37 �C while the sample wasgently tumbled. After digestion, the peptide mixture was centrifuged for 10 min at15,000g and the supernatant transferred to a new Eppendorf tube, which was thenheated for 15 min at 95 �C to inactivate the trypsin.
UltraLink Streptavidin Plus bead slurry (200 ml; Piercenet) was placed in aMobicol (Bocascientific) and washed four times with 100 mM ammoniumbicarbonate. The beads were resuspended in 100 mM ammonium bicarbonate andadded to the peptide mixture. Together, they were incubated for 1 h at roomtemperature to allow the labelled peptides to bind to the beads. The beads werethen returned to a Mobicol and washed intensively: 20 times with 5 M NaCl, 20times with Stim-Lys buffer, and then finally 20 times with 100 mM ammoniumbicarbonate heated to 60 �C. The Stim-Lys buffer consisted of 137 mM NaCl,50 mM Tris adjusted to pH 7.8 with HCl, 100 mM glycerol, 0.5 mM EDTA adjustedto pH 8.0 with HCl and 1% Triton X (all Sigma). Washing was performed byimmersing beads while in the Mobicol, and then spinning out the liquid content bycentrifuging for 2 min at 2,000g.
The beads were again immersed, in 400 ml of 100 mM ammonium bicarbonate(still within the Mobicol), to which 1 ml of PNGaseF (NEB) was added. They werethen gently tumbled overnight at 37 �C. After incubation, the Mobicol wascentrifuged for 2 min at 2,000g and the eluate collected in an Eppendorf tube. Overall,500 ml of 100 mM of ammonium bicarbonate in 4% acetonitrile was added toresuspend the beads and was collected in the same manner. The two eluates werecombined and then acidified with 150 ml of 10% formic acid to below pH 3.0. Thisglycopeptide mixture was vortexed until no more bubble formation was apparent, andthen stored at � 80 �C for later liquid chromatography-mass spectrometry (LC-MS).
Microcolumns were created from capillary-scale nanoflow 75-mm I.D. fusedsilica tubing (Polymicro Technologies) and then pulled to a fine tip using a P-2000laser puller (Sutter Instruments). Each of them were packed to a length of 10 cmwith 5 mm Luna C18 resin (Phenomenix) using a pressure vessel, and then flushedfor 15 min with methanol.
Chromatography buffer ‘A’ consisted of 5% acetonitrile and 0.1% formic acid inHPLC-grade water (Fisher), while chromatography buffer ‘B’ consisted of 95%acetonitrile and 0.1% formic acid in HPLC-grade water.
Beginning with a proportion of the glycopeptide mixture calculated to bederived from a volume of pre-digestion sample holding 2 mg of total protein,vacuum centrifugation was performed until the volume was concentrated to severalml. The volume was then adjusted to 11 ml with 0.1% formic acid and placed in awell of a 96-well plate, which in turn was placed in an EASY-nLC nano LC pump(Proxeon) connected to a microcolumn.
Microcolumns were regenerated with buffer ‘A’ before loading of sample bythe nano LC pump. Each chromatography session began with a linear gradientelution of 5–25% buffer ‘B’ over 45 min followed by a linear gradient of 25–80%buffer ‘B’ over 9 min. A flow rate of 300 nl min� 1 was maintained. Peptides wereanalysed using nanospray ionization on an Orbitrap-Velos mass spectrometer(Thermo). MS and MS/MS spectra were acquired with the instrument operatingin the data-dependent mode of one MS scan (on the Orbitrap) followed by up to10 MS/MS scans (on the LTQ-Velos) when triggered by ion signals above a specifiedthreshold. Fragmentation was accomplished using collision-induced association.Three LC-MS replicates were performed for each of the selected time points.
Database searching and analysis. All MS/MS spectra were searched against theInternational Protein Index mouse database (Version 3.84) using the SEQUESTalgorithm. Confidences in peptide identifications were evaluated using the Stat-quest probabilistic model49 and further filtered to within a mass tolerance of 20parts-per-million using the accurate ion masses generated by the Orbitrap. Thisachieved an estimated false-positive rate of 2%. Any identified peptides were thenexcluded if they did not include the N-glycosylation consensus sequon NxS/T ordid not demonstrate the asparagine to aspartic acid deamidation of 0.986 Daresulting from the treatment with PNGaseF. Relative quantities of cell surfaceproteins were assessed using spectral counting. The mass spectrometryproteomics data have been deposited to the ProteomeXchange Consortium(http://proteomecentral.proteomeexchange.org) via the PRIDE partner repositorywith the data set identifier PXD001456.
Culture and reprogramming of pluripotent mouse cells. MEFs (inducible 1Blines7 and Col1a1 lines21) and control mouse ES cells (R1 line) were maintained inDulbecco’s modified Eagle medium (DMEM) supplemented with 10% (v/v) fetalbovine serum (FBS; Gibco), 1 mM sodium pyruvate (Gibco), 2 mM Glutamax(Invitrogen) and 1% (v/v) penicillin and streptomycin (Invitrogen). Mousefibroblasts were reprogrammed in serum-containing mouse ESC mediumconsisting of DMEM supplemented with 15% (v/v) FBS (Wisent), 0.1 mMb-mercaptoethanol (BME, Sigma), 1 mM sodium pyruvate, 0.1 mM MEMnonessential amino acid (NEAA, Gibco), 2 mM Glutamax, 1% (v/v) penicillin–streptomycin and 1,000 U ml� 1 of LIF (Millipore). EpiSCs (CDE) used for controlstaining were cultured as previously described25.
For reprogramming, secondary MEF 1B cells (isolated as previously described7
from tetraploid complementation and chimeras) or MEF Col1a1 cells21 wereseeded as reported10, in 0.2% gelatin-coated T25 or T75 plates (Sarstedt). Cellswere maintained in DOX (Sigma) high culture (1.5 mg ml� 1) and were fedregularly and passaged at sampling time points and whenever confluence wasreached. Cells were maintained on three DOX treatment time courses: DOX-high(DOXH), DOX-low-to-negative (DOXL� ) and DOX-high-to-negative(DOXH� ) time course, as previously described10. For the DOXH time course,cells were maintained in DOX-high culture (1.5 mg ml� 1). For the DOXL� timecourse, cells were passaged on day 8 and half of the cells were transitioned to aDOX-low level (either 5 ng ml� 1). DOX-low-treated cells subsequently underwentpassaging and DOX removal on day 14. For the DOXH� time course, DOX-highcells were transitioned to DOX� culture.
For derivation of EpiSCs from iPSCs and ESC controls, cells were maintainedeither in standard ESC culture (serumþ LIF), 2i culture supplemented with3 mM CHIR99021 and 1 mM PD0325901 (Reagents Direct), or standardEpiSC culture, as previously described25. Following 18 days of culture in theseconditions, with regular passaging, the cells were sampled for FACS and qPCRanalyses.
Cells were incubated in a humidified 5% (v/v) CO2 air environment at 37 �C.
Flow cytometry and immunocytochemistry staining. Antibodies used for flowcytometry are listed in Supplementary Table 1. Surface stainings for flow cytometrywere performed in the presence of 7AAD (Molecular Probes) or LIVE/DEADFixable Near-IR Dead Cell Stain (Life Technologies), and populations were gatedon live cells. Flow cytometry was conducted on an LSRFortessa (BD Biosciences).For cell sorting, cells labelled with antibodies above and sorted using a FACSAriaflow cytometer (BD Biosciences) or MoFlo Astrios (Beckman Coulter). Analysiswas performed on FACSDiva (BD Biosciences) as well as FlowJo (Tree Star).
Immunocytochemistry stainings were performed by fixing cells in PBScontaining 4% (v/v) formaldehyde. Cells were permeabilized in PBS containing0.1% (v/v) Triton X-100 and subsequently blocked in PBS containing 10% (v/v)donkey serum. Samples were incubated with primary and secondary antibodies inPBS containing 1% (w/v) BSA and imaged using a confocal microscope (FV1000laser scanning confocal; Olympus). Images represent the z-stack projection ofconfocal optical sections. EdU cell proliferation assays were performed according tothe manufacturer’s protocol using the Click-iT EdU Pacific Blue Flow CytometryAssay Kit (Invitrogen).
Quantitative PCR analysis. Total RNA was extracted from cells using QiagenRNAeasy miniprep columns according to the manufacturer’s protocol. Total RNAwas used to generate cDNA using Superscript III reverse transcriptase (Invitrogen)according to the manufacturer’s instructions. Generated cDNA was mixed withrespective primers and SYBR green mix (Roche, Sigma) and run on an AppliedBiosystems 7900 HAT real-time PCR machine. Relative expression of describedgenes was determined by the delta–delta cycle threshold (Ct) method with theexpression of Gapdh (or GAPDH) as an internal reference. Primer sequences arelisted in Supplementary Table 2.
Differentiation protocols. Differentiation was conducted as previously reported19.Mesoderm and endoderm differentiation was carried out by dissociating iPSC andseeding in low-adhesion plates at a density of 1� 106 cells per 10 ml in DMEMcontaining 15% (v/v) FBS, 1% (v/v) penicillin and streptomycin, 2 mM Glutamax,0.1 mM BME and 0.1 mM NEAA. Cells were cultured for 4 days on an orbital
NATURE COMMUNICATIONS | DOI: 10.1038/ncomms8329 ARTICLE
NATURE COMMUNICATIONS | 6:7329 | DOI: 10.1038/ncomms8329 | www.nature.com/naturecommunications 9
& 2015 Macmillan Publishers Limited. All rights reserved.

shaker (65 r.p.m.) with medium exchange on day 2. After 4 days, suspensionaggregates were seeded on gelatin-coated tissue-culture plates and cultured foranother 5 days before staining with antibodies.
Ectoderm differentiation was performed by trypsinizing and plating iPSCs at5� 105 cells per 10 ml in SFEB medium (Glasgow minimum essential mediumsupplemented with 5% (v/v) knockout serum replacement, 0.1 mM NEAA, 1 mMsodium pyruvate, 1% (v/v) penicillin and streptomycin and 0.1 mM BME). Cellswere cultured for 3 days in low-adherence plates. On day 3, cells were re-fed byreplacing 70% of the medium and were cultured for another 2 days. Spheres weretransferred intact to Geltrex-coated six-well plates and incubated for 5 days inN2B27 medium (DMEM with F12 and Neurobasal medium supplemented withB27, N2 supplements, 0.005% (w/v) BSA and 1 mM sodium pyruvate) before beingstained with antibodies.
Human ESC cultures and induction to naive state. H9 hESCs were obtainedfrom the WiCell Research Institute. HES2 hESCs were provided by G. Keller(McEwen Centre for Regenerative Medicine/University Health Network). HES2and H9 cells were cultured on Geltrex LDEV-Free Reduced Growth Factor Base-ment Membrane Matrix (Life Technologies)-coated plates in Nutristem hESC XFCulture Media (Biological Industries), supplemented with 1� Penicillin–Streptomycin (Life Technologies). H9 cells were passaged 1:12–1:24 every 5–6 daysand were disassociated into small clumps using 0.1% collagenase IV (Invitrogen).HES2 cells were passaged 1:12–1:24 every 5-6 days and were dissociated to singlecells using TrypLE Express (Life Technologies). All cell-line stocks were confirmednegative for mycoplasma contamination.
To convert H9 and HES2 hESCs to a naive state, primed hESCs werepassaged on feeder layers of irradiated mouse embryonic fibroblasts in NHSMmedia as described previously11 with modifications recommended by J. Hanna.In brief, NHSM media contained Knockout DMEM (Life Technologies),15% Knockout Serum Replacement (Life Technologies), 1� glutamax (LifeTechnologies), 1� NEAAs (Life Technologies), 1� penicillin–streptomycin(Life Technologies). Added to this base media were 12.5 mg ml� 1 Insulin (Sigma),20 ng ml� 1 human Leukemia Inhibitory Factor (made in-house11), 20 ng ml� 1
human LR3-IGF1 (prospec), 2 ng ml� 1 tgfb1 (RnD), 12 ng ml� 1 fgf2 (peprotech),1 mM PD0325901 (Reagents Direct), 3 mM CHIR99021 (Reagents Direct), 5 mMSP600125 (Santa Cruz Biotechnology), 2 mM BIRB796 (Cayman Chemical), 5 mMY-27632 (Reagents Direct) and 0.4 mM LDN193189 (Cayman Chemical).Subsequent experiments involving naive induction were conducted with an alteredinduction cocktail in which LDN and IGF1 were removed and the followingreagents were added: 0.25 mg ml� 1 Albumax (Invitrogen), 1� N2 supplement(Life Technologies), 500 mg ml� 1 Ascorbic acid (Sigma) and 1 mM Go6983 (TocrisBiosciences). HES2 cells were passaged 1:30 every 4–5 days, and H9 cells werepassaged 1:30 every 5–6 days on irradiated MEF-coated plates and were dissociatedinto single cells using TrypLE Express (Life Technologies).
Statistical and data analysis. Results were expressed as mean±s.d. fromreplicates indicated in figure legends. Statistical tests were conducted as reportedfor each figure. A minimum sample replicate size of n¼ 3 was used for all dataanalyses to allow for appropriate statistical testing. Calculations for statisticalsignificance were performed using Excel and MATLAB software. For most samples,a Student’s t-test was used for pairwise comparison of an experimental condition ofinterest compared to control. Hierarchical clustering of gene expression data wasconducted using the clustergram command in MATLAB. PCA and K-meansclustering analysis of surface proteome data in reprogramming time course wasperformed using R.
References1. Takahashi, K. & Yamanaka, S. Induction of pluripotent stem cells from mouse
embryonic and adult fibroblast cultures by defined factors. Cell 126, 663–676(2006).
2. Park, I.-H. et al. Reprogramming of human somatic cells to pluripotency withdefined factors. Nature 451, 141–146 (2007).
3. Samavarchi-Tehrani, P. et al. Functional genomics reveals a BMP-drivenmesenchymal-to-epithelial transition in the initiation of somatic cellreprogramming. Cell Stem Cell 7, 64–77 (2010).
4. Polo, J. M. et al. A molecular roadmap of reprogramming somatic cells into iPScells. Cell 151, 1617–1632 (2012).
5. Hansson, J. et al. Highly coordinated proteome dynamics duringreprogramming of somatic cells to pluripotency. Cell Rep. 2, 1579–1592 (2012).
6. O’Malley, J. et al. High-resolution analysis with novel cell-surface markersidentifies routes to iPS cells. Nature 499, 88–91 (2013).
7. Woltjen, K. et al. PiggyBac transposition reprograms fibroblasts to inducedpluripotent stem cells. Nature 458, 766–770 (2009).
8. Golipour, A. et al. A late transition in somatic cell reprogramming requiresregulators distinct from the pluripotency network. Stem Cell 11, 769–782(2012).
9. Tonge, P. D. et al. Divergent reprogramming routes lead to alternative stem cellstates. Nature 516, 192–197 (2012).
10. Hussein, S. M. I. et al. Genome-wide characterization of the routes topluripotency. Nature 516, 198–206 (2012).
11. Gafni, O. et al. Derivation of novel human ground state naive pluripotent stemcells. Nature 504, 282–286 (2013).
12. Wollscheid, B. et al. Mass-spectrometric identification and relativequantification of N-linked cell surface glycoproteins. Nat. Biotechnol. 27,378–386 (2009).
13. Thompson, A. et al. Tandem mass tags: a novel quantification strategy forcomparative analysis of complex protein mixtures by MS/MS. Anal. Chem. 75,1895–1904 (2003).
14. Benevento, M. et al. Proteome adaptation in cell reprogramming proceeds viadistinct transcriptional networks. Nature 5, 5613 (2014).
15. Smith, L. M. & Kelleher, N. L. Proteoform: a single term describing proteincomplexity. Nat. Methods 10, 186–187 (2013).
16. Thomas, P. D. PANTHER: a library of protein families and subfamilies indexedby function. Genome Res. 13, 2129–2141 (2003).
17. Mi, H. The PANTHER database of protein families, subfamilies, functions andpathways. Nucleic Acids Res. 33, D284–D288 (2004).
18. Kuhn, R. M. et al. The UCSC Genome Browser Database: update 2009. NucleicAcids Res. 37, D755–D761 (2009).
19. Fluri, D. A. et al. Derivation, expansion and differentiation of inducedpluripotent stem cells in continuous suspension cultures. Nat. Methods 9,509–516 (2012).
20. Hou, P. et al. Pluripotent stem cells induced from mouse somatic cells by small-molecule compounds. Science 341, 651–654 (2013).
21. Carey, B. W., Markoulaki, S., Beard, C., Hanna, J. & Jaenisch, R. Single-genetransgenic mouse strains for reprogramming adult somatic cells. Nat. Methods7, 56–59 (2010).
22. Tonge, P. D. et al. Divergent reprogramming routes lead to alternative stem-cellstates. Nature 516, 192–197 (2014).
23. Nishimura, K. et al. Manipulation of KLF4 expression generates iPSCs pausedat successive stages of reprogramming. Stem Cell Rep. 3, 915–929 (2014).
24. Rugg-Gunn, P. J. et al. Cell-surface proteomics identifies lineage-specificmarkers of embryo-derived stem cells. Dev. Cell 22, 887–901 (2012).
25. Onishi, K., Tonge, P. D., Nagy, A. & Zandstra, P. W. Microenvironment-mediated reversion of epiblast stem cells by reactivation of repressed JAK-STAT signaling. Integr. Biol. (Camb.) 4, 1367–1376 (2012).
26. Toyooka, Y., Shimosato, D., Murakami, K., Takahashi, K. & Niwa, H.Identification and characterization of subpopulations in undifferentiated ES cellculture. Development 135, 909–918 (2008).
27. Hayashi, K., Lopes, S. M., Tang, F. & Surani, M. A. Dynamic equilibrium andheterogeneity of mouse pluripotent stem cells with distinct functional andepigenetic states. Cell Stem Cell 3, 391–401 (2008).
28. Takahashi, K. et al. Induction of pluripotent stem cells from adult humanfibroblasts by defined factors. Cell 131, 861–872 (2007).
29. Yu, J. et al. Induced pluripotent stem cell lines derived from human somaticcells. Science 318, 1917–1920 (2007).
30. Nichols, J. & Smith, A. Naive and primed pluripotent states. Cell Stem Cell 4,487–492 (2009).
31. Yan, L. et al. Single-cell RNA-Seq profiling of human preimplantation embryosand embryonic stem cells. Nat. Struct. Mol. Biol. 20, 1131–1139 (2013).
32. Theunissen, T. W. et al. Systematic identification of culture conditions forinduction and maintenanceof naive human pluripotency. Stem Cell 15, 471–487(2014).
33. Takashima, Y. et al. Resetting transcription factor control circuitry towardground-state pluripotency in human. Cell 158, 1254–1269 (2014).
34. Sammar, M., Gulbins, E., Hilbert, K., Lang, F. & Altevogt, P. Mouse CD24 as asignaling molecule for integrin-mediated cell binding: functional and physicalassociation with src-kinases. Biochem. Biophys. Res. Commun. 234, 330–334(1997).
35. Goode, I., Xu, H. & Ildstad, S. T. Regulatory B cells: the new ‘it’ cell. Transplant.Proc. 46, 3–8 (2014).
36. Quan, M., Wang, P., Cui, J., Gao, Y. & Xie, K. The roles of FOXM1 inpancreatic stem cells and carcinogenesis. Mol. Cancer 12, 159 (2013).
37. Magnaldo, T. & Barrandon, Y. CD24 (heat stable antigen, nectadrin), a novelkeratinocyte differentiation marker, is preferentially expressed in areas of thehair follicle containing the colony-forming cells. J. Cell Sci. 109, 3035–3045(1996).
38. Fang, X., Zheng, P., Tang, J. & Liu, Y. CD24: from A to Z. Cell Mol. Immunol. 7,100–103 (2010).
39. Shirasawa, T. et al. Gene expression of CD24 core peptide molecule in developingbrain and developing non-neural tissues. Dev. Dyn. 198, 1–13 (1993).
40. Lee, T. K. W. et al. CD24(þ ) liver tumor-initiating cells drive self-renewal andtumor initiation through STAT3-mediated NANOG regulation. Cell Stem Cell9, 50–63 (2011).
41. Smith, S. C. et al. The metastasis-associated gene CD24 is regulated by RalGTPase and is a mediator of cell proliferation and survival in human cancer.Cancer Res. 66, 1917–1922 (2006).
ARTICLE NATURE COMMUNICATIONS | DOI: 10.1038/ncomms8329
10 NATURE COMMUNICATIONS | 6:7329 | DOI: 10.1038/ncomms8329 | www.nature.com/naturecommunications
& 2015 Macmillan Publishers Limited. All rights reserved.
42. Baumann, P. et al. CD24 interacts with and promotes the activity of c-srcwithin lipid rafts in breast cancer cells, thereby increasing integrin-dependentadhesion. Cell Mol. Life Sci. 69, 435–448 (2012).
43. Lee, K.-M. et al. CD24 regulates cell proliferation and transforming growthfactor b-induced epithelial to mesenchymal transition through modulation ofintegrin b1 stability. Cell Signal. 24, 2132–2142 (2012).
44. Wang, L. et al. Intracellular CD24 disrupts the ARF-NPM interaction andenables mutational and viral oncogene-mediated p53 inactivation. Nat.Commun. 6, 5909 (2015).
45. Tesar, P. J. et al. New cell lines from mouse epiblast share defining features withhuman embryonic stem cells. Nature 448, 196–199 (2007).
46. Le, T. L., Yap, A. S. & Stow, J. L. Recycling of E-cadherin: a potentialmechanism for regulating cadherin dynamics. J. Cell Biol. 146, 219–232 (1999).
47. Marelli-Berg, F. M., Peek, E., Lidington, E. A., Stauss, H. J. & Lechler, R. I.Isolation of endothelial cells from murine tissue. J. Immunol. Methods 244,205–215 (2000).
48. Ware, C. B. et al. Derivation of naive human embryonic stem cells. Proc. NatlAcad. Sci. USA 111, 4484–4489 (2014).
49. Kislinger, T. PRISM, a Generic Large Scale Proteomic Investigation Strategy forMammals. Mol. Cell. Proteomics 2, 96–106 (2003).
AcknowledgementsWe thank Kento Onishi for providing EpiSC samples. We also thank Dr Jeff Wrana andDr Dan Trcka for providing secondary DOX-inducible reprogramming system to allowfurther validation of our findings. We would also like to acknowledge the assistance andsupport of laboratory colleagues and collaborators. This work has been supported by aGL2 grant from Ontario Government (AN) and a CIHR Grant to P.W.Z. N.S. is therecipient of the NSERC Vanier Canada Graduate Scholarship. A.N. is Tier 1 CanadaResearch Chair in Stem Cells and Regeneration. P.W.Z. is the Canada Research Chair inStem Cell Bioengineering.
Author contributionsN.S. and P.W.Z. conceived and designed the experiments, and wrote the manuscript. A.N.contributed to study design. N.S. performed all validation flow cytometry, live imaging andcell culture work. C.A.W. performed mass spectrometry analysis, with input from B.W.Global proteomics data were collected and analysed by J.M., M.B. and A.J.R.H. N.S. andP.D.T. performed the qPCR analysis. A.Y.-K. performed data mining of surface proteomeanalysis. Y.L. and J.M. performed all hESC culture and naive induction with input fromJ.H.H. S.M.I.H. contributed to data analysis. M.C.P. and J.E. created secondary repro-gramming lines from embryos derived by tetraploid complementation. M.L. contributed tosample preparation for validation sequencing analysis, with support from I.M.R.
Additional informationAccession codes: The mass spectrometry proteomics data have been deposited to theProteomeXchange Consortium (http://proteomecentral.proteomeexchange.org) via thePRIDE partner repository with the data set identifier PXD001456.
Supplementary Information accompanies this paper at http://www.nature.com/naturecommunications
Competing financial interests: The authors declare no competing financial interest.
Reprints and permission information is available online at http://npg.nature.com/reprintsandpermissions/
How to cite this article: Shakiba, N. et al. CD24 tracks divergent pluripotent states inmouse and human cells. Nat. Commun. 6:7329 doi: 10.1038/ncomms8329 (2015).
This work is licensed under a Creative Commons Attribution 4.0International License. The images or other third party material in this
article are included in the article’s Creative Commons license, unless indicated otherwisein the credit line; if the material is not included under the Creative Commons license,users will need to obtain permission from the license holder to reproduce the material.To view a copy of this license, visit http://creativecommons.org/licenses/by/4.0/
NATURE COMMUNICATIONS | DOI: 10.1038/ncomms8329 ARTICLE
NATURE COMMUNICATIONS | 6:7329 | DOI: 10.1038/ncomms8329 | www.nature.com/naturecommunications 11
& 2015 Macmillan Publishers Limited. All rights reserved.