Embed Size (px)
Citation preview

FULL YEAR RESULTS 2014March 17, 2015

AGENDA
2
RECAP: STRATEGIC ANNOUNCEMENT JANUARY 2015
FULL YEAR 2014 ― FINANCIAL REVIEWTRADING UPDATE
STRATEGY FOCUSED ON GLOBAL AND GROWING TRAVEL SERVICES
NEW MID-TERM TARGETS 2017
ADDITIONAL INFORMATION
2
3
1
KUONI GROUP – INVESTORS PRESENTATION FULL YEAR RESULTS 2014 – 17 MARCH 2015
4

RECAP: STRATEGIC ANNOUNCEMENT JANUARY 2015

KUONI GROUP – INVESTORS PRESENTATION FULL YEAR RESULTS 2014 – 17 MARCH 20154
FOCUS ON CORE DIVISIONS FOLLOWINGCOMPREHENSIVE STRATEGY REVIEW
PORTFOLIO CHANGE OVER TIME
► Focus on core business as a service provider tothe global travel industry and to governments
► Focus on growing three Divisions:
− Global Travel Distribution (previously FIT)− Global Travel Services (previously Group
Travel and DM Specialists)− VFS Global
► Intention to find new owners for all touroperating activities: Kuoni Switzerland, UK,Benelux, Hong Kong, India andScandinavia/Finland
OutboundEurope & Asia
Outbound Nordic
DM Specialists
Group Travel
FIT
VFS5 508
3 894
Turnover (CHF milion)
Of whichTourOperating
75% 39%
2009 2014
CoreDivisions
Exit ofTour
OperatingActivities

5
NEW STRUCTURE REFLECTS FOCUS ON THREEDIVISIONS WITH LEADING GLOBAL POSITIONS
OLD STRUCTURE NEW STRUCTURE
VFS
Glo
bal
Tour
Ope
rati
ngD
esti
nati
on &
Acc
omm
odat
ion
Man
agem
ent
Global TravelDistribution
(GTD)
► Leading and highly experienced B2B providerof accommodation and land components
Global TravelServices
(GTS)
► Long-standing and leading provider of grouptravel and destination management services
VFS Global ► Pioneer and global leader as visa serviceprovider
Outbound ► Exit of tour operating activities
Fully IndependentTraveller (FIT)
Group Travel
VFS Global
OutboundEurope/Asia
DestinationManagement
Specialists
OutboundNordic
KUONI GROUP – INVESTORS PRESENTATION FULL YEAR RESULTS 2014 – 17 MARCH 2015

56%36%
8%
VFS Global
GlobalTravelDistribution(GTD)
GlobalTravelServices(GTS)
Total: CHF 3 436 mFTEs: 8 081
KUONI GROUP – INVESTORS PRESENTATION FULL YEAR RESULTS 2014 – 17 MARCH 20156
2 OUT OF 3 DIVISIONS POSTED POSITIVEORGANIC GROWTH, 43% APAC AS A SOURCE
► Three divisions concentrated on markets andservices with attractive long-term growthpotential and in which Kuoni has globally leadingpositions
► Unique set-up with strong focus on Asia willenable Kuoni to expand positions further byleveraging scale and exploring cross-sellingopportunities
► Launch of strategic initiatives to accelerategrowth and improve profitability across businesssegments
TURNOVER 2014(EXCLUDING OUTBOUND UNITS)
KUONI GROUP – INVESTORS PRESENTATION FULL YEAR RESULTS 2014 – 17 MARCH 20157
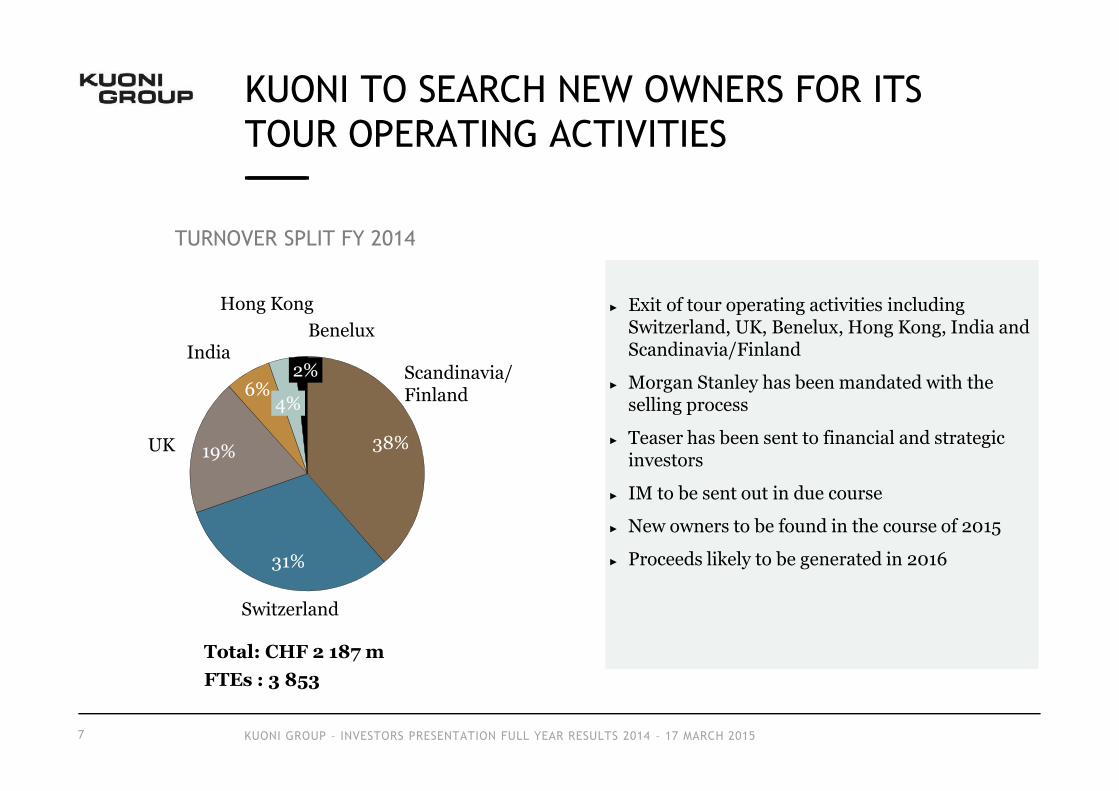
► Exit of tour operating activities includingSwitzerland, UK, Benelux, Hong Kong, India andScandinavia/Finland
► Morgan Stanley has been mandated with theselling process
► Teaser has been sent to financial and strategicinvestors
► IM to be sent out in due course
► New owners to be found in the course of 2015
► Proceeds likely to be generated in 2016
38%
31%
19%
6%4%
2%
Switzerland
UK
India
Hong KongBenelux
Scandinavia/Finland
TURNOVER SPLIT FY 2014
Total: CHF 2 187 mFTEs : 3 853
KUONI TO SEARCH NEW OWNERS FOR ITSTOUR OPERATING ACTIVITIES

FULL YEAR 2014 ‒ FINANCIAL REVIEW

KUONI GROUP – INVESTORS PRESENTATION FULL YEAR RESULTS 2014 – 17 MARCH 20159
ORGANIC TURNOVER GROWTH OF 2.8%IN THE FUTURE CORE BUSINESS (FX IMPACT ‒1.7%)
TURNOVER
(CHF million) FY14 FY13 Δ %nominal
Δ %organic
Global Travel Distribution (previously FIT) 1 933 1 802 +7.3 +8.8
Global Travel Services 1 238 1 360 -9.0 -7.3
Group Travel Experts 873 943 -7.4 -6.5
Destination Management Specialists 365 417 -12.5 -8.9
VFS Global 271 244 +11.1 +13.9
Subtotal 3 436 3 406 +0.9 +2.8
Outbound Units 2 187 2 396 -8.7 -4.5
Outbound Nordic 844 982 -14.1 -9.0
Outbound Europe/Asia 1 343 1 414 -5.0 -1.4
Kuoni Group 5 508 5 669 -2.8 -0.1
Futu
re c
ore
busi
ness

TURNOVER BASED ON OLD STRUCTURE
(CHF million) FY14 FY13 Δ %nominal
Δ %organic
Group Travel 873 943 -7.4 -6.5
FIT (Fully Independent Traveller) 1 933 1 802 +7.3 +8.8
Outbound Nordic 844 982 -14.1 -9.0
Outbound Europe/Asia 1 343 1 414 -5.0 -1.4
Destination Management Specialists 365 417 -12.5 -8.9
VFS Global 271 244 +11.1 +13.8
Less turnover between segments -121 -133
Kuoni Group 5 508 5 669 -2.8 -0.1
KUONI GROUP – INVESTORS PRESENTATION FULL YEAR RESULTS 2014 – 17 MARCH 201510
ORGANIC TURNOVER GROWTH OF ‒0.1%IN A CHALLENGING ENVIRONMENT

PROFIT & LOSS
(CHF million) FY14 FY13adjusted*) Δ % FY13
As reported
Turnover 5 508 5 669 -2.8 5 669
GOP Margin 18.6% 19.5% 19.5%
EBITAEBITA-Margin
122.22.2
150.12.6
-18.6 191.43.4
EBITEBIT-Margin
85.71.6
112.92.0
-24.1 154.22.7
Net result 67.4 36.7 +83.7 69.2
Diluted earnings per registered share ADiluted earnings per registered share B
3.4417.20
3.5517.77
Free cash flow 33.2 124.6 -73.4 124.6
KUONI GROUP – INVESTORS PRESENTATION FULL YEAR RESULTS 2014 – 17 MARCH 201511
NET RESULT IN LINE WITH PREVIOUS YEAR
*) excluding the effect of Swiss pension plan changes and a curtailment of CHF 41.3m in total

GROUP TRAVEL: MAINTAINS STRONG MARKET POSITIONIN A CHALLENGING ENVIRONMENT
12
(CHF million)FY14 FY13 ∆% Organic turnover decline by 6.5%
Lower demand in the important Japanesemarket persists (35% of top line)
Weak economy and currency continues
Increase of consumer tax
Smaller group sizes
China (over 20% of top line) slow start into2014 due to changes of travel law, picking uptowards the end of the year
Higher volumes from Taiwan, South Korea,India and Hong Kong
# of room nights fell by 3.0% to 3.1 million
excl Swisspension
KUONI GROUP – INVESTORS PRESENTATION FULL YEAR RESULTS 2014 – 17 MARCH 2015
Turnover 873 943 ‒7.4
GOP 145.9 165.6 ‒11.9
EBITA 16.9 23.2 ‒27.2
FTE (end of period) 1 618 1 633

Turnover 1 933 1 802 +7.3
GOP 220.6 224.1 ‒1.6
EBITA 63.2 73.0 ‒13.4
FTE (end of period) 1 414 1 366
FIT: ORGANIC GROWTH OF 8.8% ‒WELL ABOVE 13M ROOM NIGHTS SOLD
KUONI GROUP – INVESTORS PRESENTATION FULL YEAR RESULTS 2014 – 17 MARCH 201513
(CHF million)FY14 FY13 ∆% Room nights up by 7.2% to 13.6 million
Growth in Asia ex Japan as a source of +13%achieved
Double digit growth rates for Asia as adestination
More competitive margins fuelled growthstrategy
Investment in improved booking systems andnew applications/features as well as higherstaffing costs resulting from growth strategy
excl Swisspension

OUTBOUND NORDIC: EXCESS FLIGHT CAPACITYLOWERED PRICES AND MARGINS
14
(CHF million)FY14 FY13 ∆% Organic turnover decline of 9.0%
Challenging market environment
Excess flight capacity
Reduced demand due to geopolitical eventsand exceptional summer weather
Measures initiated:
Renegotiated agreements with Novair crew
Streamlined product/destination portfolio
Reduction of headcount
New managing director
75% of turnover sold direct (vs 73% in 2013)
excl Swisspension
KUONI GROUP – INVESTORS PRESENTATION FULL YEAR RESULTS 2014 – 17 MARCH 2015
Turnover 844 982 ‒14.1
GOP 125.9 188.1 ‒33.1
EBITA ‒ 7.6 37.8 ‒120.1
FTE (end of period) 782 867

Turnover remaining 1 343 1 355 ‒0.9
Turnover sold/closed n/a 59 n/a
GOP 273.5 272.0 +0.6
EBITA remaining 20.5 8.6 +138.4
EBITA sold/closed n/a ‒3.0 n/a
FTE (end of period) 3 071 2 928
OUTBOUND EUROPE/ASIA: SUBSTANTIALIMPROVEMENT OF OPERATING EARNINGS
15
(CHF million) FY14 FY13 ∆% Positive development of the Swiss, Indian andHong Kong units
Switzerland improved profitability to a doubledigit EBITA
India improved considerably its operatingperformance (low single digit vs high singledigit loss in 2013)
Hong Kong recorded a 32% improvement in itsoperating performance
UK suffered from the travel warning to Kenyaand Thailand, but still achieved higher EBIT inabsolute terms and also margin wise
excl Swisspension
KUONI GROUP – INVESTORS PRESENTATION FULL YEAR RESULTS 2014 – 17 MARCH 2015
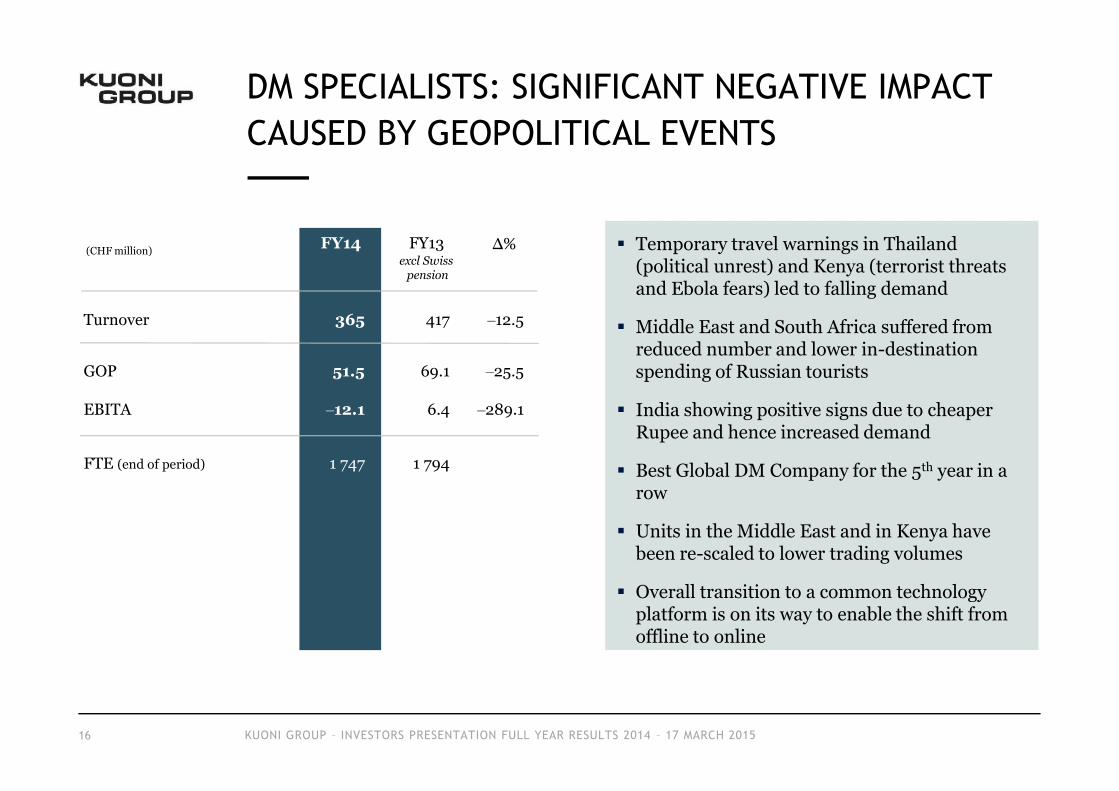
Turnover 365 417 ‒12.5
GOP 51.5 69.1 ‒25.5
EBITA ‒12.1 6.4 ‒289.1
FTE (end of period) 1 747 1 794
DM SPECIALISTS: SIGNIFICANT NEGATIVE IMPACTCAUSED BY GEOPOLITICAL EVENTS
16
(CHF million) FY14 FY13 ∆% Temporary travel warnings in Thailand(political unrest) and Kenya (terrorist threatsand Ebola fears) led to falling demand
Middle East and South Africa suffered fromreduced number and lower in-destinationspending of Russian tourists
India showing positive signs due to cheaperRupee and hence increased demand
Best Global DM Company for the 5th year in arow
Units in the Middle East and in Kenya havebeen re-scaled to lower trading volumes
Overall transition to a common technologyplatform is on its way to enable the shift fromoffline to online
excl Swisspension
KUONI GROUP – INVESTORS PRESENTATION FULL YEAR RESULTS 2014 – 17 MARCH 2015

Turnover 271 244 +11.1
GOP 207.7 178.3 +16.5
EBITA 52.5 40.2 +30.6- whereof JV ‒2.0 ‒2.7 +25.9
FTE (end of period) 3 209 2 752
VFS GLOBAL: ORGANIC GROWTH +13.9%
17
(CHF million)FY14 FY13 ∆% 18.2m # of applications processed – just a slight
increase vs 2013
Substantial drop in # of visas from Russia
Withdrawal from unprofitable contracts
Two new global contracts won in 2014 (Norwayand Slovenia)
Non-religious applications for the SaudiGovernment are being processed
850k # of applications in 54 centres in 26countries
First Front Office Services (FOS) went live in2014
In-country public citizen services
Launched in Asia, Africa and Europe
excl Swisspension
KUONI GROUP – INVESTORS PRESENTATION FULL YEAR RESULTS 2014 – 17 MARCH 2015

EBIT BRIDGE ‒ DECREASE DRIVEN MAINLY BYMARGIN DEVELOPMENT
KUONI GROUP – INVESTORS PRESENTATION FULL YEAR RESULTS 2014 – 17 MARCH 201518
41.3
18.9
53.2 41.8
EBIT 2014REPORTED
543EBIT 2013ADJUSTED
21
3.1
EBIT 2013REPORTED
16.7
1: Impact of exit of European tour operator activities in 20132: One-time positive effect from pension fund plan change and curtailment in Switzerland3: Impact of turnover development on EBIT4: Impact of gross profit margin development5: Impact of decrease in operating costs, including one-time positive effect from the sale of Geroldstrasse (CHF 10.1 million)
(CHF million)
10.1
154.2
85.7
116.0
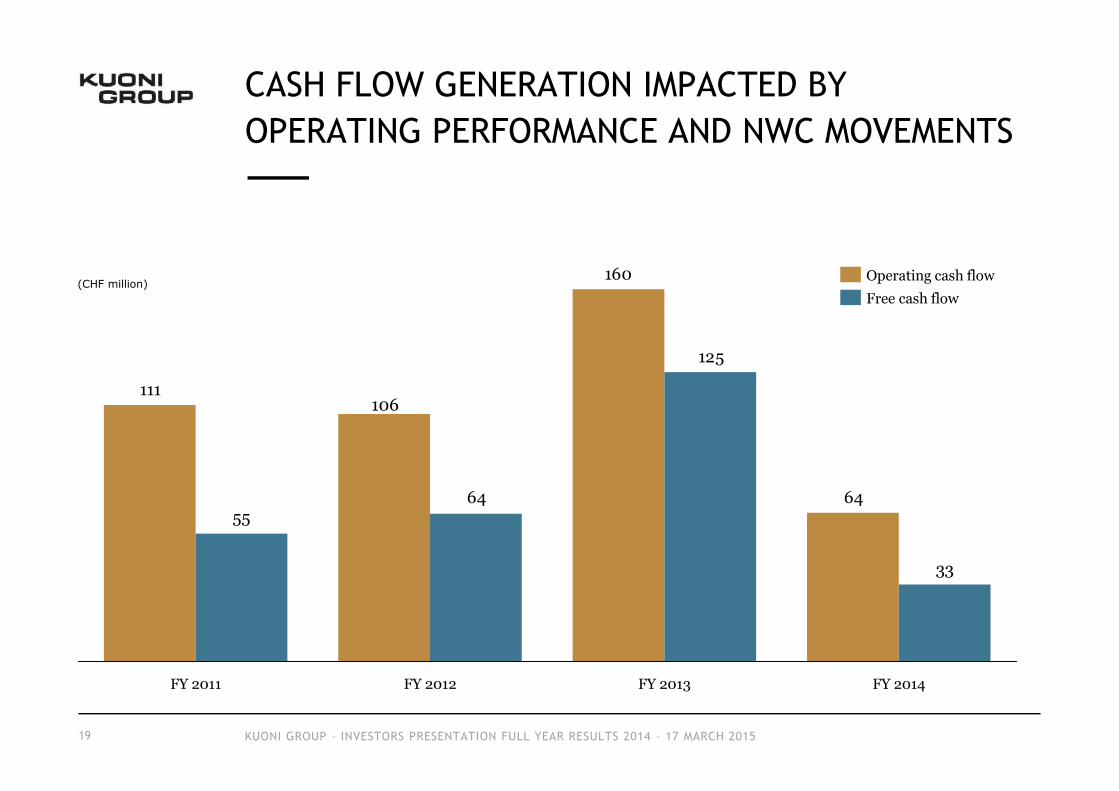
CASH FLOW GENERATION IMPACTED BYOPERATING PERFORMANCE AND NWC MOVEMENTS
KUONI GROUP – INVESTORS PRESENTATION FULL YEAR RESULTS 2014 – 17 MARCH 201519
(CHF million)
64
160
111
33
125
6455
FY 2012FY 2011 FY 2013 FY 2014
Operating cash flowFree cash flow
106

HEALTHY AND STABLE EQUITY RATIOAND SOUND BALANCE SHEET STRUCTURE
KUONI GROUP – INVESTORS PRESENTATION FULL YEAR RESULTS 2014 – 17 MARCH 201520
(CHF million)
738 699 779 779
1'748 1'703 1'614 1'640
32.2
32.6
29.129.7
0
500
1'000
1'500
2'000
2'500
024
681012
14161820
22242628
303234
31 Dec 2014
2’419
31 Dec 2013
2’393
31 Dec 2012
2’402
31 Dec 2011
2’486
EquityLiabilityEquity ratio
in %

LIQUIDITY AND DEBT POSITIONAS PER 31.12.2014
21
200
51
-274
99
350
Net debt positionAdvance paymentsby customers
-373
Net Liquid FundsOther debtBond nominalLiquid funds
(CHF million)
vs. 31.12.2013CHF 141m
vs. 31.12.2013CHF -241m
SENIOR CREDIT FACILITY USED AT 31.12.2014 CHF 15M
KUONI GROUP – INVESTORS PRESENTATION FULL YEAR RESULTS 2014 – 17 MARCH 2015

FX VOLATILITY COULD HAVE A SIGNIFICANTTRANSLATION IMPACT ON 2015
KUONI GROUP – INVESTORS PRESENTATION FULL YEAR RESULTS 2014 – 17 MARCH 201522
TURNOVER CURRENCY MIX FOR TRANSLATION FOR THE NEW CORE AS OF 2015
Due to the currency mix of the subsidiaries’ operating activities, it is expected that the SNB’sdecision to remove the CHF peg will have considerable, negative impact on the Swiss francs-denominated consolidated income statement.
52%
18%
8%
8%
3%4%
4%
3%
EURUSD
Other
AEDINR
AUD
GBPCHF
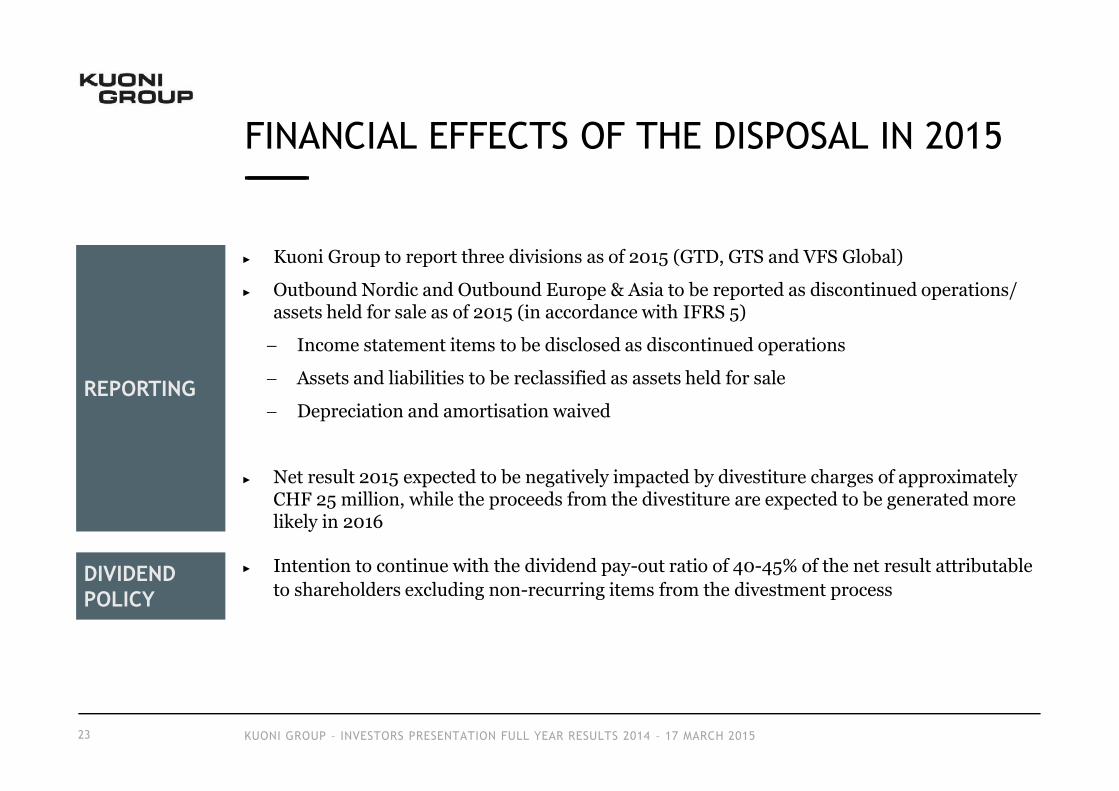
FINANCIAL EFFECTS OF THE DISPOSAL IN 2015
KUONI GROUP – INVESTORS PRESENTATION FULL YEAR RESULTS 2014 – 17 MARCH 201523
► Intention to continue with the dividend pay-out ratio of 40-45% of the net result attributableto shareholders excluding non-recurring items from the divestment process
► Kuoni Group to report three divisions as of 2015 (GTD, GTS and VFS Global)
► Outbound Nordic and Outbound Europe & Asia to be reported as discontinued operations/assets held for sale as of 2015 (in accordance with IFRS 5)
Income statement items to be disclosed as discontinued operations
Assets and liabilities to be reclassified as assets held for sale
Depreciation and amortisation waived
► Net result 2015 expected to be negatively impacted by divestiture charges of approximatelyCHF 25 million, while the proceeds from the divestiture are expected to be generated morelikely in 2016
REPORTING
DIVIDENDPOLICY
KUONI GROUP – INVESTORS PRESENTATION FULL YEAR RESULTS 2014 – 17 MARCH 201524
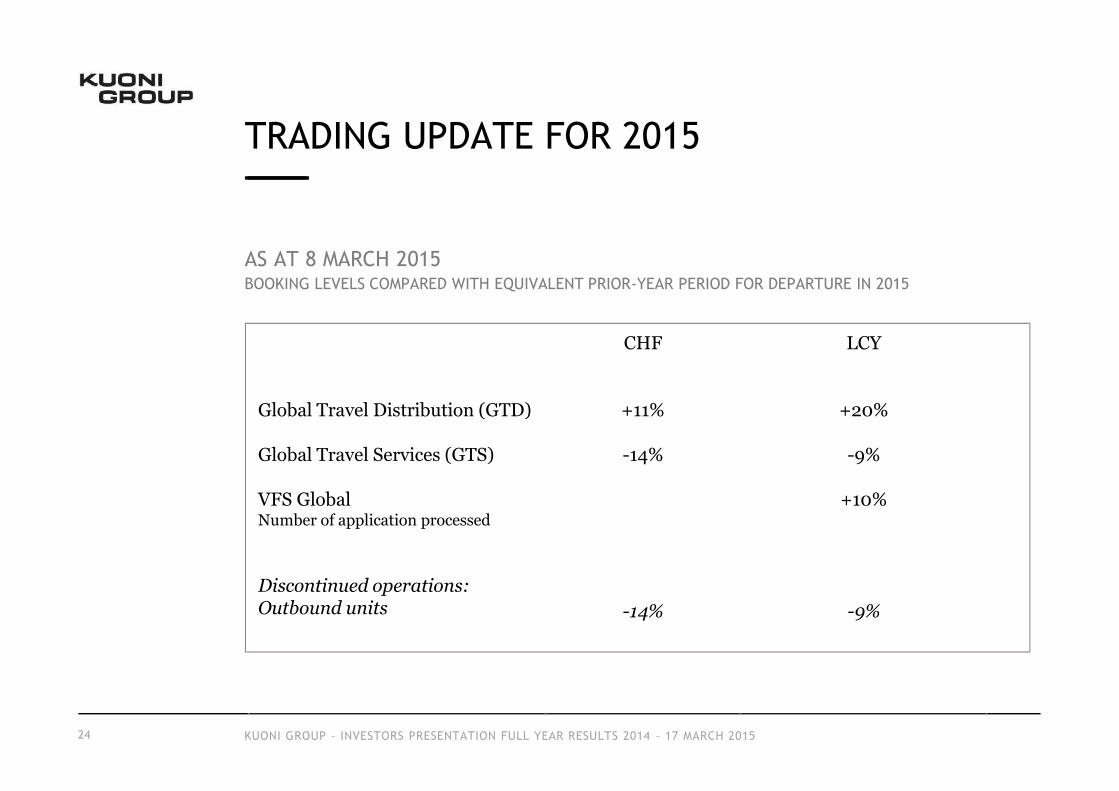
TRADING UPDATE FOR 2015
Global Travel Distribution (GTD)
Global Travel Services (GTS)
VFS GlobalNumber of application processed
Discontinued operations:Outbound units
CHF
+11%
-14%
-14%
LCY
+20%
-9%
+10%
-9%
AS AT 8 MARCH 2015BOOKING LEVELS COMPARED WITH EQUIVALENT PRIOR-YEAR PERIOD FOR DEPARTURE IN 2015

STRATEGY FOCUSED ON GLOBAL AND GROWINGTRAVEL SERVICESNEW MID-TERM TARGETS 2017

THREE STRATEGIC INITIATIVES TO ACCELERATEGROWTH AND IMPROVE PROFITABILITY
KUONI GROUP – INVESTORS PRESENTATION FULL YEAR RESULTS 2014 – 17 MARCH 201526
EXPANDING FOOTPRINT INASIA, MIDDLE EAST AND
AFRICA
► Invest additional resources inAsia, the Middle East andAfrica by leveraging existingfootprint and expandingcapabilities across allsegments
FURTHERDIGITALISATION
► Enhance customer serviceand increase efficiency byimplementing new state-of-the-art technology platforms
► Develop new service offeringfor digital travellers
EXPANDSERVICE OFFERING
► Build on existing customerbase and global footprint
► Provide existing services to awider range of customersegments by realisingcross-selling potential
► Introduce new products andservices

27
EXPAND FOOTPRINT AND OFFERING, FURTHERDIGITALISATION WILL LEAD TO MORE GROWTH
Global Travel Distribution(GTD)
► Expand service and product offering to cater specific needs of Asian,Middle Eastern and African source markets
► Deploy innovative customer facing systems and implemente-commerce platform
► Enhance mobile features of existing applications► Increase number of beach destinations and third party products► Exploit new sales opportunities by introducing mobile travel assistant
VFS Global► Digital visa processing for interaction with governments► Expand into services adjacent to visa processing and new disciplines
such as front office services
KUONI GROUP – INVESTORS PRESENTATION FULL YEAR RESULTS 2014 – 17 MARCH 2015
Global Travel Services(GTS)
► Rollout new proprietary reservation systems► Increase sales activities with key accounts for smaller groups► Group travel online sales► Grow share of DM Services for non-Europe customer segments
Fost
er c
ross
-sel
ling
oppo
rtun
itie
s su
ch a
s de
stin
atio
nse
rvic
es o
r vi
sa s
ervi
ces
acro
ss d
ivis
ions
off
ice
serv
ices

AS A CONSEQUENCE OF NEW STRATEGYNEW FINANCIAL TARGETS 2017
KUONI GROUP – INVESTORS PRESENTATION FULL YEAR RESULTS 2014 – 17 MARCH 201528
FORECASTING HAS BECOME MORE CHALLENGING ON ACCOUNT OF THEUNCERTAINTIES REGARDING THE LEVEL OF THE SWISS CURRENCY
3.53.0
3.4 -14%
2017 Target2014 FXadjusted
2014 asreported
70
56
2014 FXadjusted
2014 asreported
-21%
2017 target
8110
2.5% 5% p.a.
Turnover growth per annum1)
above the global travel marketEBIT margin Free Cash Flow margin
3%
1.9%
3%
► Capex expected in line withdepreciations
► Tax rate estimated at ~25%
► NWC changes and non-cashitems expected neutral
Turn
over
in C
HF
bln
EBIT
in C
HF
mill
ion
1) >5% turnover growth on CHF 3.0bn baseline in 2014. Aspiration is to grow significantly faster than the global travel markets, which accordingto UNWTO will expand by 3.8% p.a.
Assumption: Tour operating entities can be divested by 2016 as planned
3.6% EBITA margin

ADDITIONAL INFORMATION

DestinationManagement
WELL POSITIONED WITHIN THE COMPLEX TRAVELDISTRIBUTION ECO-SYSTEM AND CLEAR FOCUS ON B2B
30
TRAVEL ECO-SYSTEM Kuoni Group
Supplier.com
Large international OTAs
TravelRetail
Metasearch
Smaller/regional OTAs
Visa ProcessingServices
Hotels
Transfers
Tours
Flights
Highlyfragmented
2014: >1bninternationalarrivals
Switches/GDS
Consolidators/Brokers
Grouptravel
Tour Operators
Changingbehaviours
Countlessdesires
SUPPLIERS CUSTOMERS
KUONI GROUP – INVESTORS PRESENTATION FULL YEAR RESULTS 2014 – 17 MARCH 2015
GTD(FIT Wholesaler)

31 KUONI GROUP – INVESTORS PRESENTATION FULL YEAR RESULTS 2014 – 17 MARCH 2015
► Leading and highly experienced B2B wholesalerand provider of accommodation and landcomponents to tour operators and offline andonline travel agencies globally
► 7% share in the intermediated accommodationmarket with 38’000 room nights sold online perday
► 48’000 hotels in the database (online bookable,real-time pricing)
► ~43% of turnover generated in fast-growingAsia/Pacific, the Middle East and Africa markets
► Top source markets: UK, Australia, Spain
► Top destinations: USA, Italy, France
► Launch of a prototype mobile application fortravel agents
CHF million
TURNOVER
1 7031 802
1 933
2012 2013 2014
BUSINESS OVERVIEW
GLOBAL TRAVEL DISTRIBUTION (GTD)

32 KUONI GROUP – INVESTORS PRESENTATION FULL YEAR RESULTS 2014 – 17 MARCH 2015
964 943 873
400 417365
1 364 1 3601 238
2012 2013 2014
Group Travel Experts DM Specialists
CHF million
TURNOVER1)
► Long-standing and leading provider of grouptravel and destination management services totour operators and travel agencies globally
► Sources and coordinates destination servicesincluding accommodation, transportation, toursand activities, venues and event management(MICE)2)
► #1 player in the growing Asian group travelmarket with 80% of turnover generated fromAsia/Pacific source markets
− ~50 000 leisure tours per year
− ~3.1 million room nights booked
− 25 sales offices
► Among top 3 destination managementcompanies in respective destinations
GLOBAL TRAVEL SERVICES (GTS)
BUSINESS OVERVIEW
1) Aggregated without turnover elimination between segments; 2) MICE=Meetings, Incentives, Conferences & Events

33 KUONI GROUP – INVESTORS PRESENTATION FULL YEAR RESULTS 2014 – 17 MARCH 2015
205
244271
2012 2013 2014
CHF million
TURNOVER
► Pioneer and world’s leading visa servicesprovider for governments and public institutions
− ~18 million applications processed in 2014
− ~ 6million biometric data sets recorded in2014
− ~50% global market share
− ~70% turnover generated from travellersfrom Asia/Pacific
− 1 486 application centres in 120 countries for45 governments
► Differentiated market position with leadingtechnologies, infrastructure and capabilities
► Long-term customer relationships and contracts
► Introduction of the first Front Office Services(in-country public citizen services)
BUSINESS OVERVIEW
VFS GLOBAL

Group Travel DM Specialists
NEW CORE BUSINESS GENERATES 43% IN ASIAAND HAS EUROPE AS A MAIN DESTINATION
KUONI GROUP – INVESTORS PRESENTATION FULL YEAR RESULTS 2014 – 17 MARCH 201534
GEOGRAPHICAL SPREAD OF TURNOVER 2014 IN THE FUTURE CORE BUSINESS (IN %)
Europe
37%
MEA
9%
APAC43%
Americas
11%
58%
MEA
Europe
10%
APAC 18%
Americas
14%
New Group
CHF 3’436m CHF 1’933m
15%
Europe
43%
13%
MEA
APAC 29%
Americas
19%
Europe
MEA
51%
APAC10%
20%
Americas
Americas
81%
7%
Europe
12%
APAC
3%
MEA
93%
APAC
1%
Americas
3%
Europe
CHF 873m
GTS
GTS
VFSGTD
Americas 15%
Europe
69%
MEA
6%APAC10%
MEA37%
APAC
46%
Americas
17%
CHF 271m
Europe
15%
MEA
15%
APAC 67%
Americas3%
Europe
56%
MEA
12%APAC
14%
Americas
18%
CHF 365m
By s
ourc
e M
arke
tBy
des
tina
tion

FINANCIALS ON THE BUSINESS TO BEDISPOSED OFF IN MORE DETAILS
KUONI GROUP – INVESTORS PRESENTATION FULL YEAR RESULTS 2014 – 17 MARCH 201535
07 9
1 38
37
41 0
67 9
844
59661 25
39
402
7 23
982
UKSwitzerlandNordic Sold/closedentities
HongkongIndiaBenelux
0.02.9
-2.0
0.7
9.01 2.2
-7 .6
-3 .0
2.2
-8.8
1 .6
8.08.3
37 .8
Sold/closedentities
HongkongIndiaBeneluxUKSwitzerlandNordic
01 2
25
8
7 8
1 50
1 26
81 022
8
7 4
1 57
1 88
SwitzerlandNordic Sold/closedentities
HongkongIndiaBeneluxUK
2014 = dark2013 = light
TURNOVER GOP
EBITA
(CHF million)
excl Swiss pension impact

36
KUONI GROUP ORGANISATIONAL STRUCTUREAS OF 14 JANUARY 2015
Member of Executive Board
KUONI GROUP – INVESTORS PRESENTATION FULL YEAR RESULTS 2014 – 17 MARCH 2015
Peter Meier
Chief ExecutiveOfficer
Exit of Tour OperatingActivities
Ivan Walter
Global TravelDistribution
Rolf Schafroth
Global TravelServices
Zubin Karkaria
VFS Global
Rolf Schafroth
Outbound
Thomas Peyer
Finance1)Human Resources
IT
Strategy &Communication2)
1) Including Risk, Legal & Compliance; 2) Including Investor Relations

REPORTS ON BUSINESS PERFORMANCE ON THE FOLLOWING DATES:
Annual Results 2014 17 March
General Meeting of Shareholders 20 April in Zurich
Capital Markets Day 2015 11 June in London
Half-Year Results 2015 21 August
Q3/9months Results 2015 5 November
CONTACT DETAILS
Corporate Communications Phone: + 41 44 277 4363 [email protected] Relations Phone: + 41 44 277 4529 [email protected]
www.kuoni.com mailing list: www.kuoni.com/group-news
FINANCIAL CALENDAR 2015
KUONI GROUP – INVESTORS PRESENTATION FULL YEAR RESULTS 2014 – 17 MARCH 201537

DISCLAIMER
KUONI GROUP – INVESTORS PRESENTATION FULL YEAR RESULTS 2014 – 17 MARCH 201538
THIS COMMUNICATION CONTAINS STATEMENTS THAT CONSTITUTE “FORWARD-LOOKING STATEMENTS” INCLUDING, BUT NOT LIMITED TO,
THOSE USING THE WORDS “BELIEVES”, “ASSUMES”, “EXPECTS” OR FORMULATIONS OF A SIMILAR KIND. IN THIS COMMUNICATION, SUCH
FORWARD-LOOKING STATEMENTS INCLUDE, WITHOUT LIMITATION, STATEMENTS RELATING TO OUR FINANCIAL CONDITION, RESULTS OF
OPERATIONS AND BUSINESS AND CERTAIN OF OUR STRATEGIC PLANS AND OBJECTIVES. SUCH FORWARD-LOOKING STATEMENTS ARE MADE
ON THE BASIS OF ASSUMPTIONS AND EXPECTATIONS THAT WE BELIEVE TO BE REASONABLE AT THIS TIME, BUT MAY PROVE TO BE
ERRONEOUS. BECAUSE THESE FORWARD-LOOKING STATEMENTS ARE SUBJECT TO RISKS AND UNCERTAINTIES, ACTUAL FUTURE RESULTS,
THE FINANCIAL CONDITION, THE DEVELOPMENT OR PERFORMANCE OF KUONI TRAVEL HOLDING AND/OR ITS AFFILIATES (REFERRED TO AS
“KUONI”) MAY DIFFER MATERIALLY FROM THOSE EXPRESSED IN OR IMPLIED BY THE STATEMENTS. MANY OF THESE RISKS AND
UNCERTAINTIES RELATE TO FACTORS WHICH ARE BEYOND KUONI'S ABILITY TO CONTROL OR ESTIMATE PRECISELY, SUCH AS FUTURE
MARKET CONDITIONS, CURRENCY FLUCTUATIONS, THE BEHAVIOUR OF OTHER MARKET PARTICIPANTS, THE ACTIONS OF GOVERNMENTAL
REGULATORS AND OTHER RISK FACTORS DETAILED IN KUONI’S PAST AND FUTURE FILINGS AND REPORTS, INCLUDING PRESS RELEASES,
REPORTS AND OTHER INFORMATION POSTED ON KUONI’S WEBSITES OR IN OTHER FORM. READERS ARE CAUTIONED NOT TO PUT UNDUE
RELIANCE ON FORWARD-LOOKING STATEMENTS WHICH SPEAK ONLY OF THE DATE OF THIS COMMUNICATION. KUONI DISCLAIMS ANY
INTENTION OR OBLIGATION TO UPDATE AND REVISE ANY FORWARD-LOOKING STATEMENTS, WHETHER AS A RESULT OF NEW INFORMATION,
FUTURE EVENTS OR OTHERWISE. IT SHOULD BE NOTED THAT PAST PERFORMANCE IS NOT A GUIDE TO FUTURE PERFORMANCE. PLEASE ALSO
NOTE THAT INTERIM RESULTS ARE NOT NECESSARILY INDICATIVE OF THE FULL-YEAR RESULTS. MOREOVER, THE PRO FORMA INFORMATION
PROVIDED IN THIS PRESENTATION SERVES AS AN ILLUSTRATION AND CONTAINS SIMPLIFIED ASSUMPTIONS. ROUNDING EFFECTS MAY OCCUR.
THE REPRESENTATION OF THIS FINANCIAL INFORMATION IS BASED ON HYPOTHETICAL BUSINESS EVENTS AND FACTS AND DOES NOT REFLECT
KUONI'S ACTUAL ASSET, FINANCIAL AND INCOME SITUATION. THE ASSET, FINANCIAL AND INCOME SITUATION OF KUONI IN FUTURE
FINANCIAL STATEMENTS AND REPORTS MAY SUBSTANTIALLY DIFFER FROM THE INFORMATION PROVIDED HEREIN. THE REASON FOR THIS IS A
STRING OF FACTORS, SUCH AS, FOR EXAMPLE, BUSINESS DEVELOPMENTS, CHANGES IN THE MARKET, AND IN THE LEGAL, REGULATORY
AND/OR ECONOMIC FRAMEWORK, AS WELL AS AMENDED ACCOUNTING REGULATIONS. PERSONS REQUIRING ADVICE SHOULD CONSULT AN
INDEPENDENT ADVISER. THIS COMMUNICATION DOES NOT CONSTITUTE AN OFFER OR AN INVITATION FOR THE SALE OR PURCHASE OF
SECURITIES IN ANY JURISDICTION.

THANK YOU FOR YOUR ATTENTION


![6TSCH Webex 05/24/2013. Agenda BoF recap[5min] Webinar announcement[5min] Centralized routing requirements draft [10min + 5min Q&A] updated TSCH draft[5min]](https://img.pdfslide.us/doc/110x75/56649f275503460f94c3fa42/6tsch-webex-05242013-agenda-bof-recap5min-webinar-announcement5min-centralized.jpg)