Embed Size (px)
Citation preview
Recap of heat loads and peak doses from HL-LHC Q1 to Q7
L.S. Esposito, F. Cerutti
HL-LHC WP3 meeting, 22 May 2014
F. Cerutti, HL-LHC WP3 meeting, 22 May 2014
Beam Screen design evolution1
6 m
m
ab
sorb
ers
6 m
m
ab
sorb
ers
old version (BS #1)
new version (BS #2)
1. cooling capillary (tube) size
2. absorber shape3. INERMET 180 4. beam screen
thickness (2⇒1 mm)
2
BS #3
F. Cerutti, HL-LHC WP3 meeting, 22 May 2014
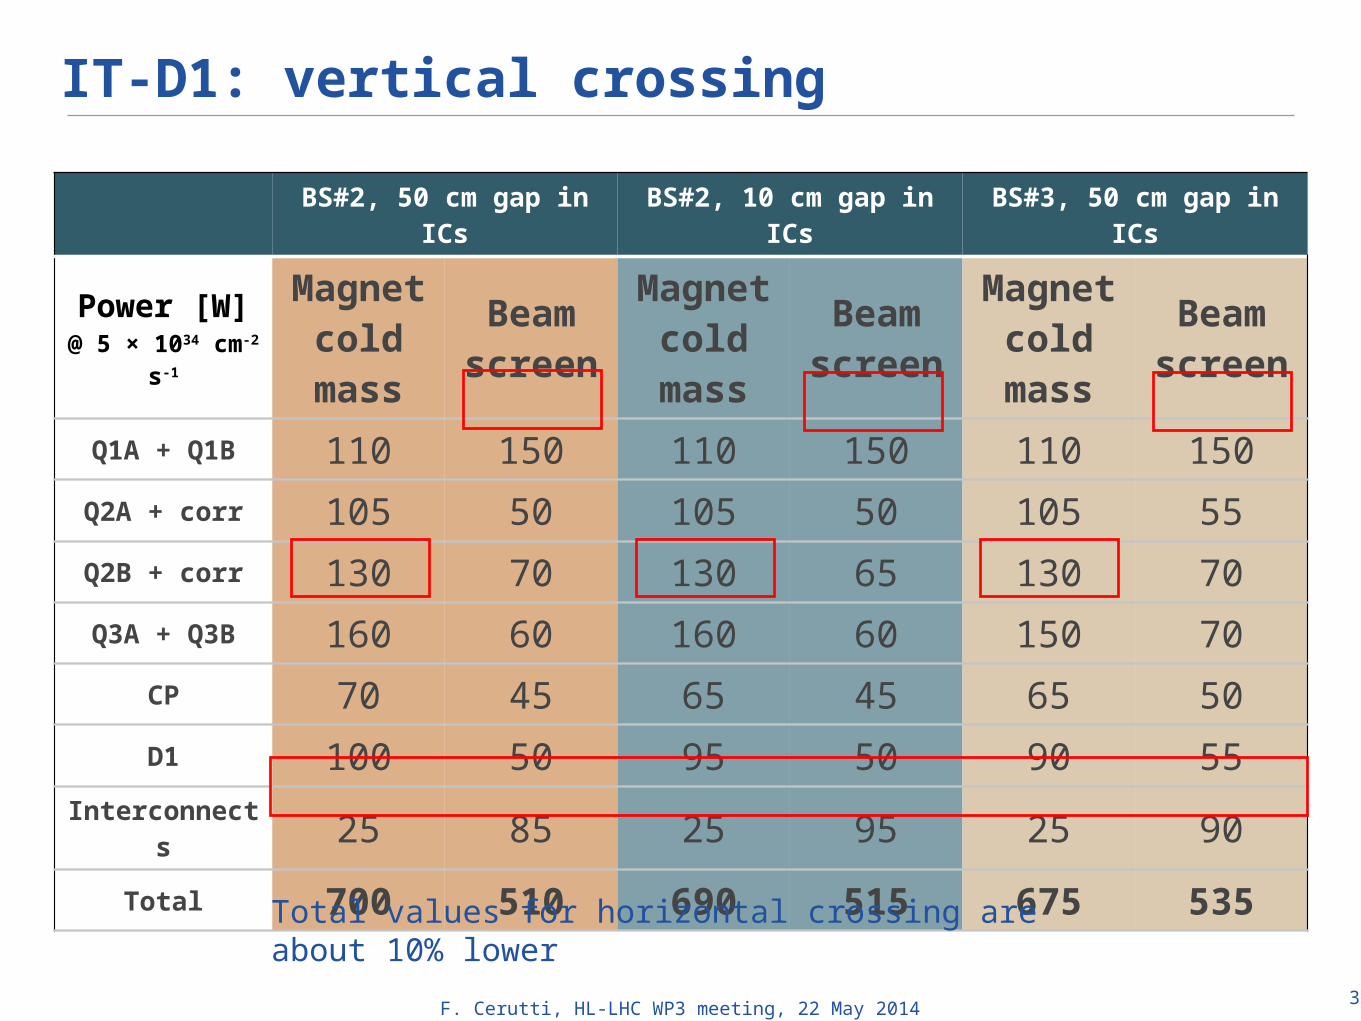
IT-D1: vertical crossing
3
BS#2, 50 cm gap in ICs
BS#2, 10 cm gap in ICs
BS#3, 50 cm gap in ICs
Power [W]@ 5 × 1034 cm-2
s-1
Magnetcold mass
Beamscreen
Magnetcold mass
Beamscreen
Magnetcold mass
Beamscreen
Q1A + Q1B 110 150 110 150 110 150Q2A + corr 105 50 105 50 105 55Q2B + corr 130 70 130 65 130 70Q3A + Q3B 160 60 160 60 150 70
CP 70 45 65 45 65 50D1 100 50 95 50 90 55
Interconnects 25 85 25 95 25 90
Total 700 510 690 515 675 535
Total values for horizontal crossing are about 10% lower
F. Cerutti, HL-LHC WP3 meeting, 22 May 2014
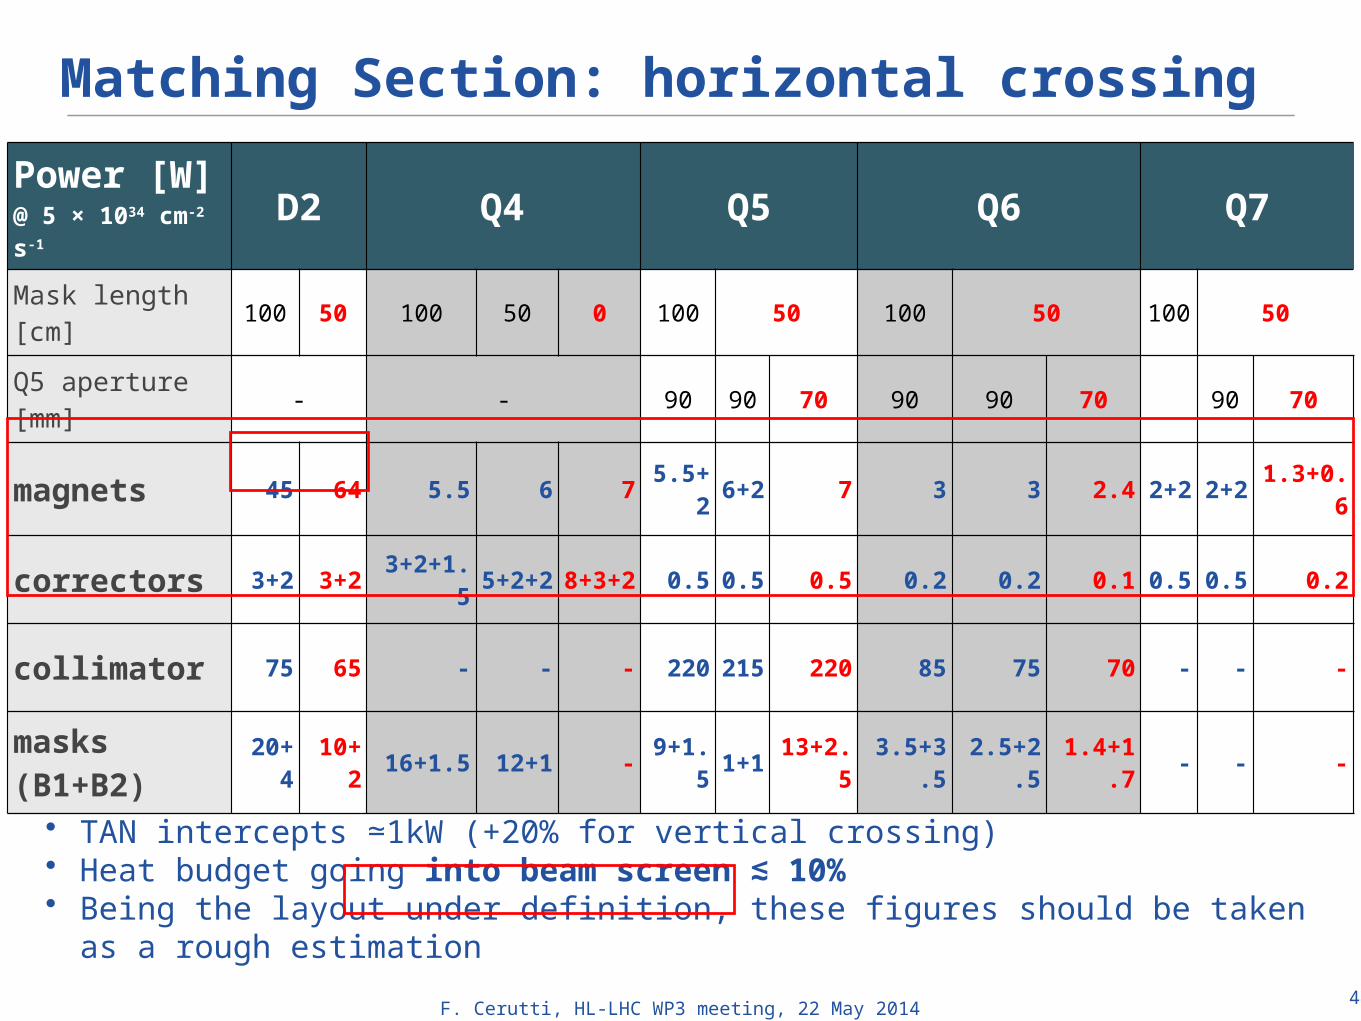
Matching Section: horizontal crossing
4
Power [W]@ 5 × 1034 cm-2 s-1
D2 Q4 Q5 Q6 Q7
Mask length[cm]
100 50 100 50 0 100 50 100 50 100 50
Q5 aperture[mm]
- - 90 90 70 90 90 70 90 70
magnets 45 64 5.5 6 7 5.5+2
6+2 7 3 3 2.4 2+
22+
21.3+0.
6
correctors 3+2 3+2 3+2+1.5
5+2+2
8+3+2 0.5 0.5 0.5 0.2 0.2 0.1 0.5 0.5 0.2
collimator 75 65 - - - 220 215 220 85 75 70 - - -
masks(B1+B2)
20+4
10+2 16+1.5 12+1 - 9+1.
51+
113+2
.53.5+3
.52.5+2
.51.4+1
.7 - - -
• TAN intercepts ≃1kW (+20% for vertical crossing)• Heat budget going into beam screen ≲ 10%• Being the layout under definition, these figures should be taken as a rough
estimation
F. Cerutti, HL-LHC WP3 meeting, 22 May 2014
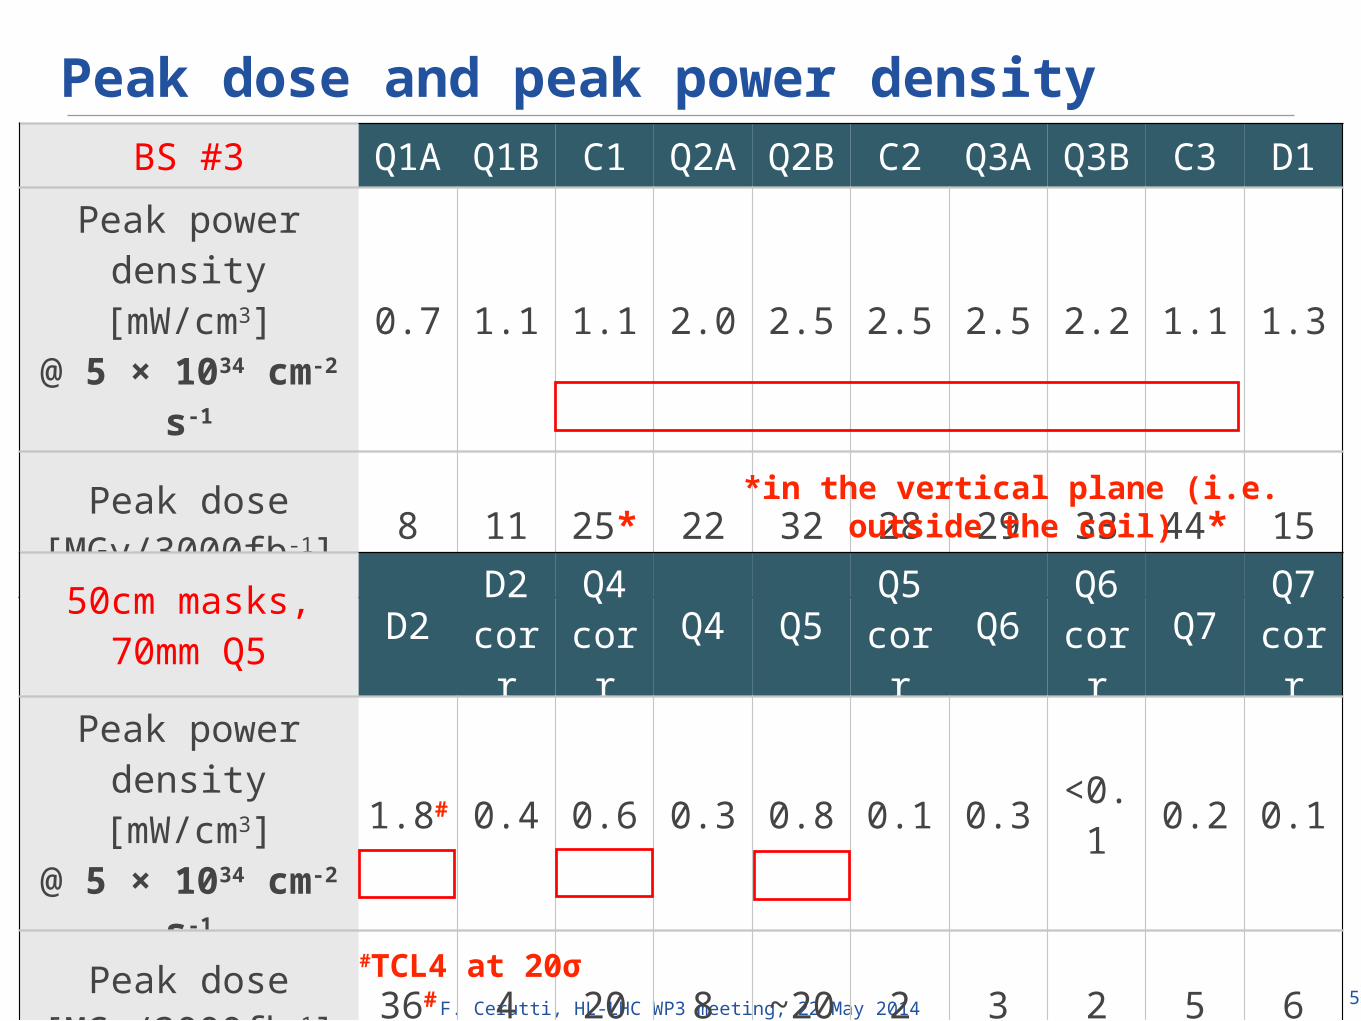
Peak dose and peak power density
5
BS #3 Q1A Q1B C1 Q2A Q2B C2 Q3A Q3B C3 D1
Peak power density
[mW/cm3]@ 5 × 1034 cm-2
s-1
0.7 1.1 1.1 2.0 2.5 2.5 2.5 2.2 1.1 1.3
Peak dose[MGy/3000fb-1] 8 11 25* 22 32 28 29 33 44* 15*in the vertical plane (i.e. outside
the coil)
50cm masks, 70mm Q5 D2 D2
corrQ4corr Q4 Q5 Q5
corr Q6 Q6 corr Q7 Q7
corr
Peak power density
[mW/cm3]@ 5 × 1034 cm-2
s-1
1.8# 0.4 0.6 0.3 0.8 0.1 0.3 <0.1 0.2 0.1
Peak dose[MGy/3000fb-1] 36# 4 20 8 ~20 2 3 2 5 6#TCL4 at 20σ
F. Cerutti, HL-LHC WP3 meeting, 22 May 2014
Intercomparison with MARSN. Mokhov, I. Rakhno, I. Tropin
F. Cerutti, HL-LHC WP3 meeting, 22 May 2014
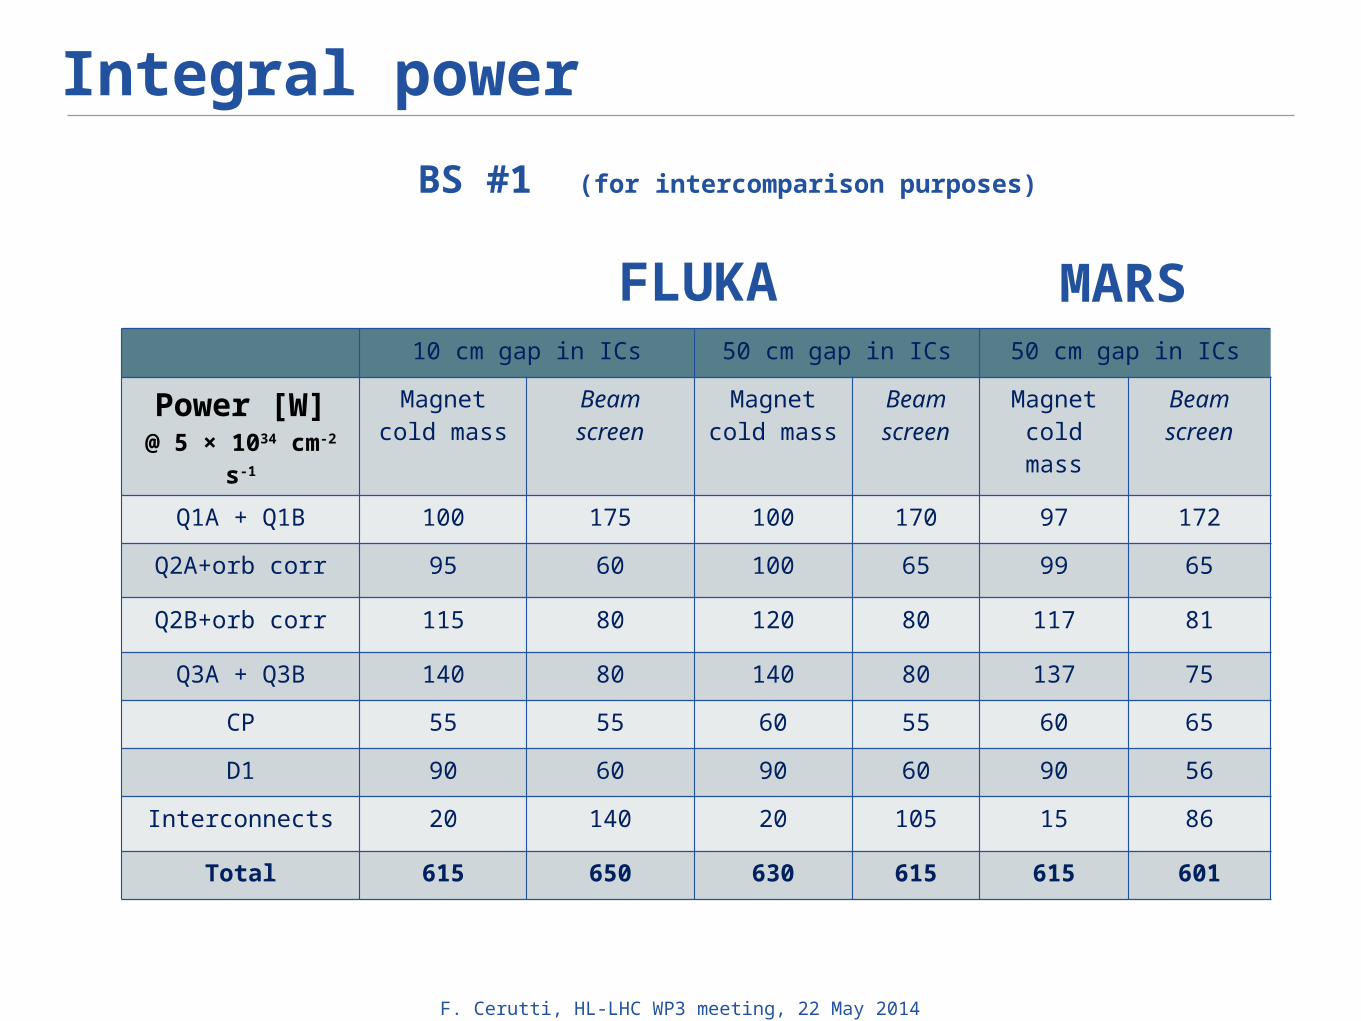
Integral power
10 cm gap in ICs 50 cm gap in ICs 50 cm gap in ICs
Power [W]@ 5 × 1034 cm-2
s-1
Magnetcold mass
Beamscreen
Magnetcold mass
Beamscreen
Magnetcold mass
Beamscreen
Q1A + Q1B 100 175 100 170 97 172
Q2A+orb corr 95 60 100 65 99 65
Q2B+orb corr 115 80 120 80 117 81
Q3A + Q3B 140 80 140 80 137 75
CP 55 55 60 55 60 65
D1 90 60 90 60 90 56
Interconnects 20 140 20 105 15 86
Total 615 650 630 615 615 601
MARSFLUKA
BS #1 (for intercomparison purposes)
F. Cerutti, HL-LHC WP3 meeting, 22 May 2014
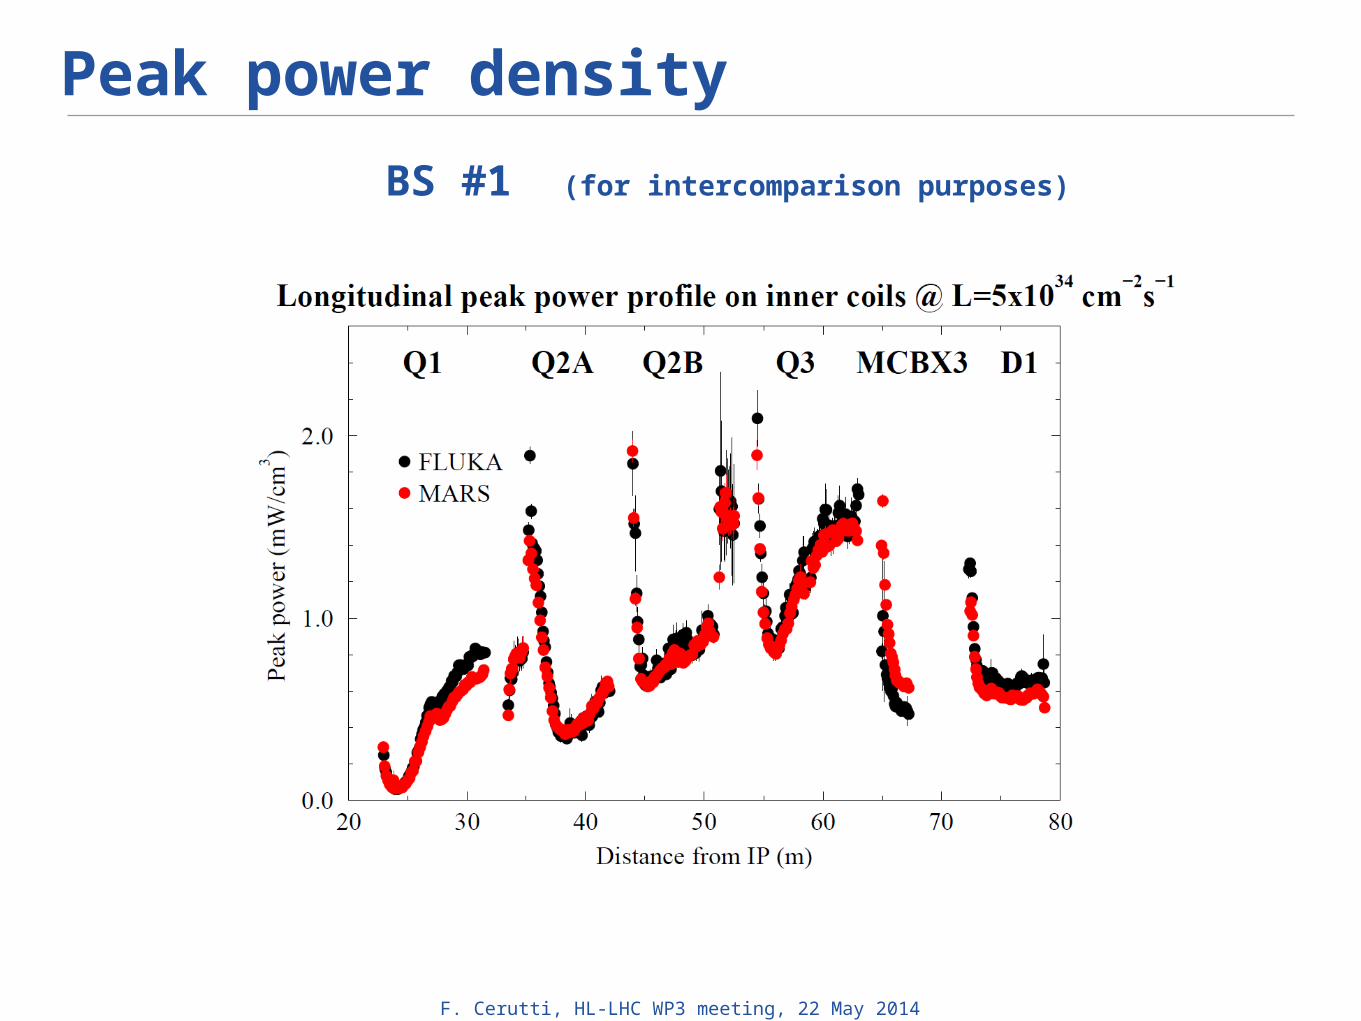
Peak power density
BS #1 (for intercomparison purposes)
F. Cerutti, HL-LHC WP3 meeting, 22 May 2014
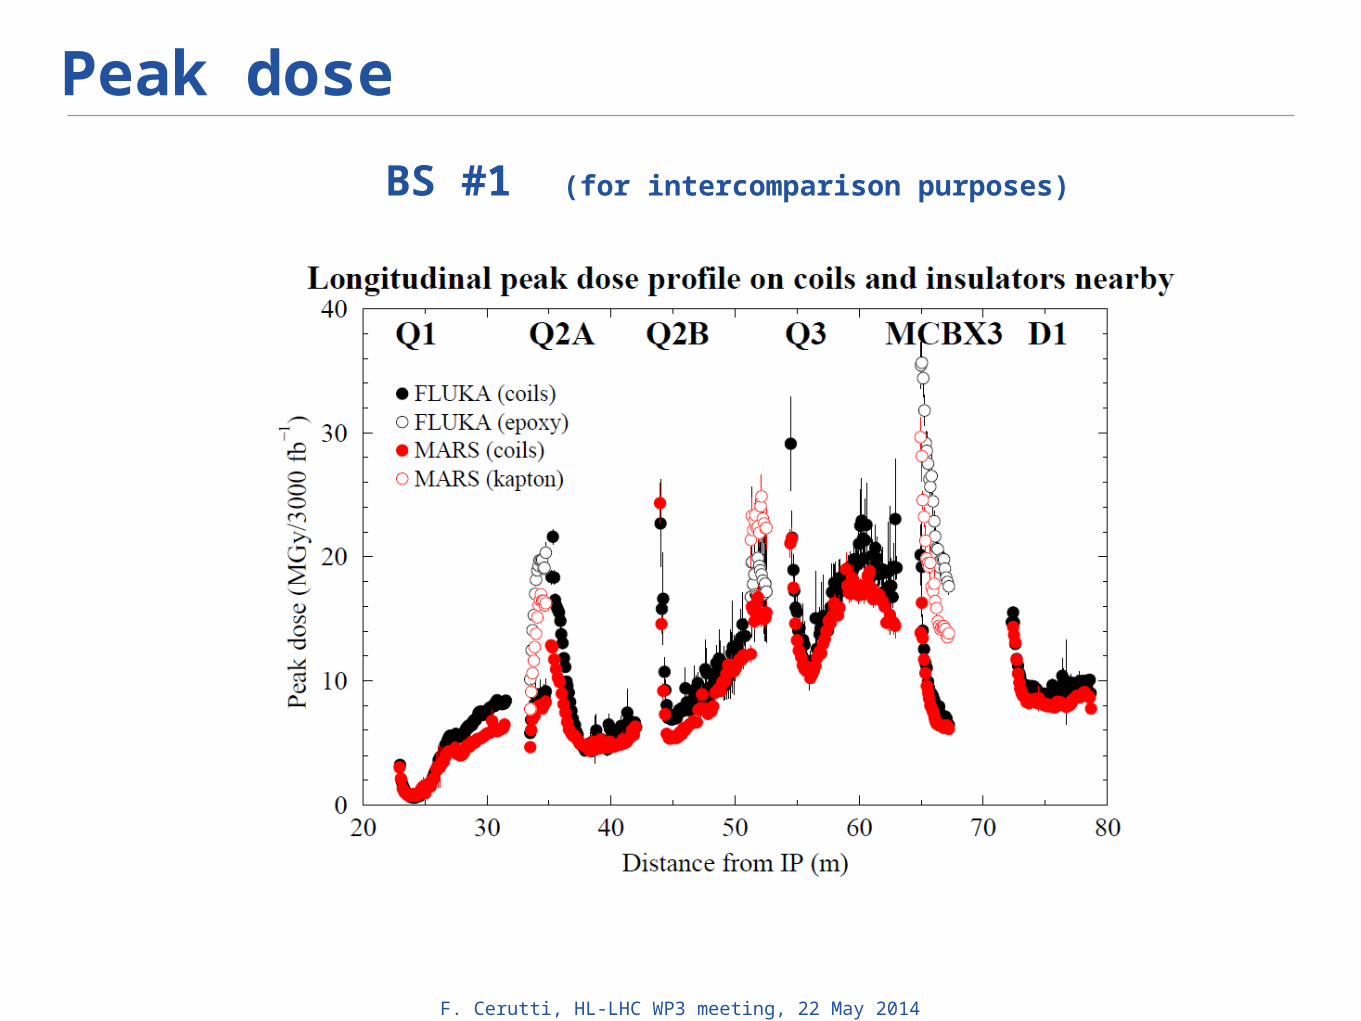
Peak dose
BS #1 (for intercomparison purposes)
F. Cerutti, HL-LHC WP3 meeting, 22 May 2014
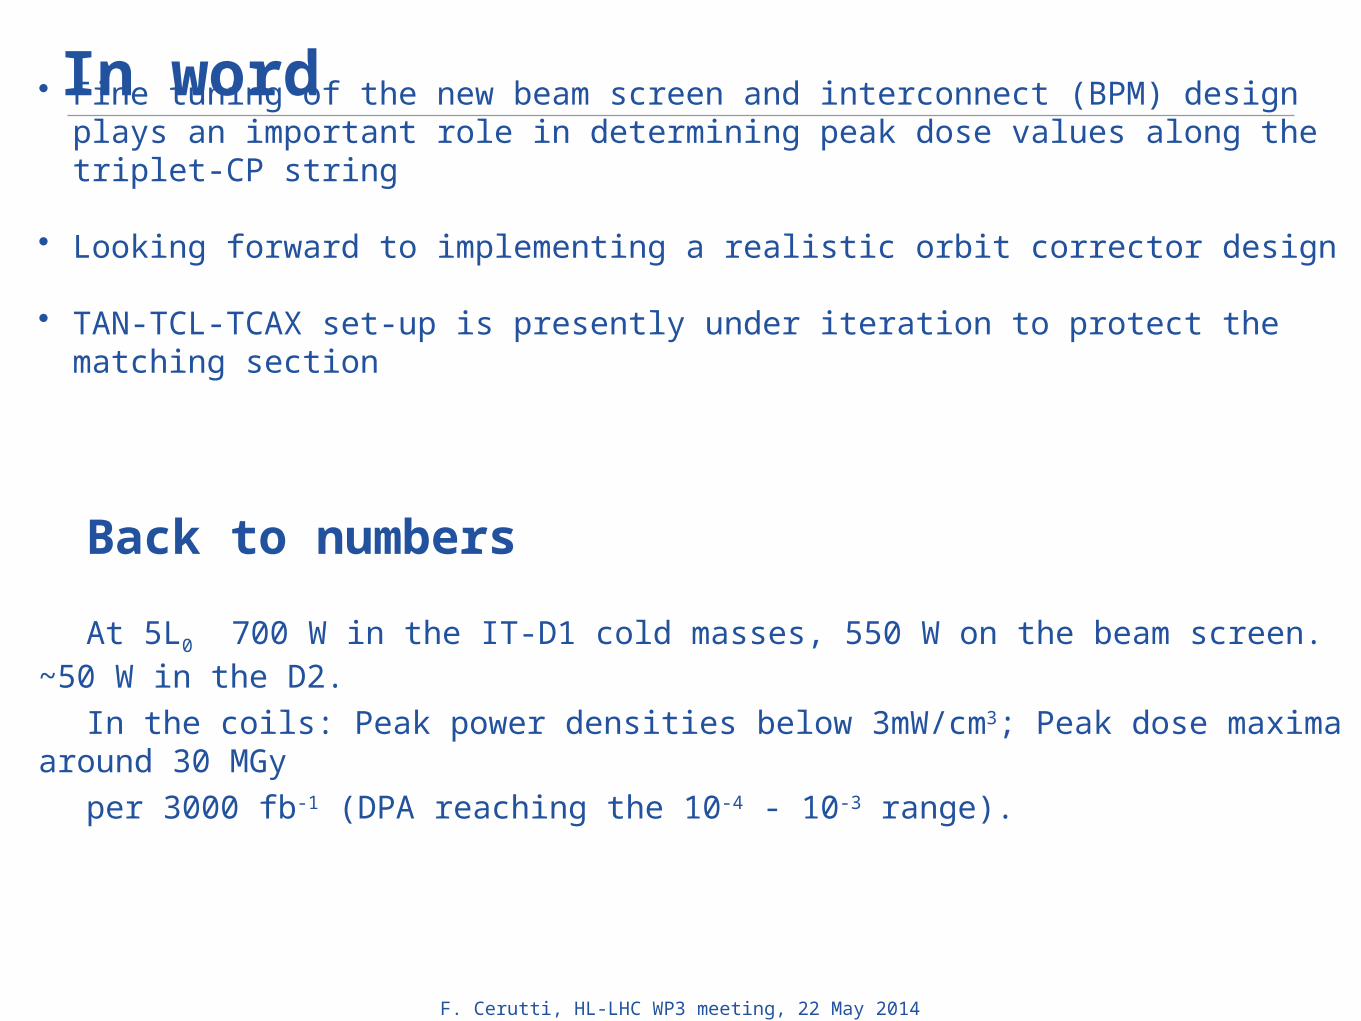
In word• Fine tuning of the new beam screen and interconnect (BPM) design plays an
important role in determining peak dose values along the triplet-CP string
• Looking forward to implementing a realistic orbit corrector design
• TAN-TCL-TCAX set-up is presently under iteration to protect the matching section
Back to numbers
At 5L0 700 W in the IT-D1 cold masses, 550 W on the beam screen. ~50 W in the D2.
In the coils: Peak power densities below 3mW/cm3; Peak dose maxima around 30 MGy
per 3000 fb-1 (DPA reaching the 10-4 - 10-3 range).