Embed Size (px)
Citation preview
Impact Evaluation Report 117
Asim Ijaz KhwajaOsman Haq Adnan Qadir KhanBenjamin OlkenMahvish Shaukat
Public administration
Rebuilding the social compact Urban service delivery and property taxes in Pakistan April 2020
About 3ie
The International Initiative for Impact Evaluation (3ie) promotes evidence-informed, equitable, inclusive and sustainable development. We support the generation and effective use of high-quality evidence to inform decision-making and improve the lives of people living in poverty in low- and middle-income countries. We provide guidance and support to produce, synthesise and quality assure evidence of what works, for whom, how, why and at what cost.
3ie impact evaluations
3ie-supported impact evaluations assess the difference a development intervention has made to social and economic outcomes. 3ie is committed to funding rigorous evaluations that include a theory-based design and that use the most appropriate mix of methods to capture outcomes and are useful in complex development contexts.
About this report
3ie accepted the final version of the report, Rebuilding the social compact: urban service delivery and property taxes in Pakistan, as partial fulfilment of requirements under grant DPW1.1005 awarded through Development Priorities Window 1. The report is technically sound and 3ie is making it available to the public in this final report version as it was received. No further work has been done.
The 3ie technical quality assurance team for this report comprises Francis Rathinam, Neeta Goel, Kanika Jha Kingra and Deeksha Ahuja, an anonymous external impact evaluation design expert reviewer and an anonymous external sector expert reviewer, with overall technical supervision by Marie Gaarder. The 3ie editorial production team for this report comprises Anushruti Ganguly and Akarsh Gupta.
All of the content is the sole responsibility of the authors and does not represent the opinions of 3ie, its donors or its board of commissioners. Any errors and omissions are also the sole responsibility of the authors. All affiliations of the authors listed in the title page are those that were in effect at the time the report was accepted. Please direct any comments or queries to the corresponding author, Asim Ijaz Khwaja at: [email protected].
Funding for this impact evaluation was provided by UK aid through the Department for International Development. A complete listing of all of 3ie’s donors is available on the 3ie website.
Suggested citation: Khwaja, AI, Haq, O, Khan, AQ, Olken, B and Shaukat, M, 2020. Rebuilding the social compact: urban service delivery and property taxes in Pakistan, 3ie Impact Evaluation Report 117. New Delhi: International Initiative for Impact Evaluation (3ie). Available at: https://doi.org/10.23846/DPW1IE117
Cover photo: Rachel Clayton / DFID
© International Initiative for Impact Evaluation (3ie), 2020
Rebuilding the social compact: urban service delivery and property taxes in Pakistan
Asim Ijaz Khwaja Harvard University
Osman Haq Centre for Economic Research in Pakistan
Adnan Qadir Khan London School of Economics
Benjamin Olken Massachusetts Institute of Technology
Mahvish Shaukat World Bank
Impact Evaluation Report 117
April 2020
i
Acknowledgements
This project is the result of collaboration among many people. We thank Ismail Khan, Yanchuan Liu, Guillermo Palacios Diaz, and Fay Terrett for outstanding research assistance in Cambridge and Ali Abbas, Khawaja Hussain, Sardar Abdullah Mahmood, Ahmad Mustafa, Jazib Parvez, Omer Qasim, Nikolai Schaffner, Adeel Shafqat, Mehak Siddiquei, Shahan Shahid and the late Sadaqat Shah for outstanding research assistance in Lahore. We thank all the Secretaries, Director Generals, Directors, the Project Directors from the Punjab Department of Excise and Taxation, the Punjab Finance, Local Government and Community Development, Planning and Development departments and the Chief Secretary and Chief Minister’s offices for their support over the many years of this project.
This RCT was registered in the American Economic Association Registry for randomized control trials under trial number AEARCTR-0003270. Financial support for the project came from 3ie, the IGC, JPAL-GI, JPAL-USI, NSF, and STL. The views expressed here are those of the authors and do not necessarily reflect those of the many individuals or organizations acknowledged here.
ii
Summary
This impact evaluation investigates whether strengthening the link between local taxation and urban services can revitalize the social compact between citizen and state. A significant challenge to the provision of local public services in developing economies is the inability to raise adequate resources, especially through local taxation. In many countries, the social compact, whereby citizens agree to pay taxes to fund their desired services, is broken. A low willingness to pay taxes leads to low revenue collection, and prevents adequate service provision, which in turn reduces willingness to pay and can even lead to citizen disengagement from the state. We investigate whether strengthening the link between local collections and urban services can increase citizens’ willingness to pay for services, improve service delivery, and enhance local politics. We test this in major urban centers in Punjab, Pakistan via several interventions - including eliciting citizen preferences for specific services when taxes are collected, earmarking revenue for specific services, and enabling local politicians - that credibly strengthen the link between tax collection and urban service provision. This paper presents the experimental design and reports first year impacts on tax payments. On the positive side we find that the project succeeded in eliciting citizen preferences and delivering services against them, thereby changing the relationship between tax collectors and citizens. However, we find that despite successful delivery of services and finding (small) treatment effects on being in an intervention, citizens for the most part are unaware of being in a special scheme or of having received greater local goods. Not surprisingly, we therefore find muted effects on attitudes towards the state or increased tax payments. Given these results, we intend to also focus on raising awareness in the ongoing round of service delivery so that we can examine whether doing so will lead to improved attitudes towards to state and greater tax payment.
iii
Contents
Acknowledgements ........................................................................................................ i Summary ........................................................................................................................ ii List of figures and tables ............................................................................................. iv Abbreviations and acronyms ....................................................................................... v 1. Introduction ............................................................................................................... 1 2. Intervention ................................................................................................................ 3
2.1 Description ............................................................................................................ 3 2.2 Theory of Change ............................................................................................... 10
3. Evaluation ................................................................................................................ 13 3.1 Primary and secondary questions ....................................................................... 13 3.2 Design and methods ........................................................................................... 13 3.3 Ethics .................................................................................................................. 14 3.4 Sampling and data collection............................................................................... 15
4. Findings ................................................................................................................... 18 4.1 Monitoring Plan and Intervention implementation fidelity ..................................... 18 4.2 Impact analysis ................................................................................................... 21
5. Cost analysis ........................................................................................................... 35 6. Discussion ............................................................................................................... 38
6.1 Introduction ......................................................................................................... 38 6.2 Policy and programme relevance: evidence update and use ............................... 39 6.3 Challenges and lessons ...................................................................................... 41
7. Conclusion ............................................................................................................... 41 Online appendixes ...................................................................................................... 42 References ................................................................................................................... 43
iv
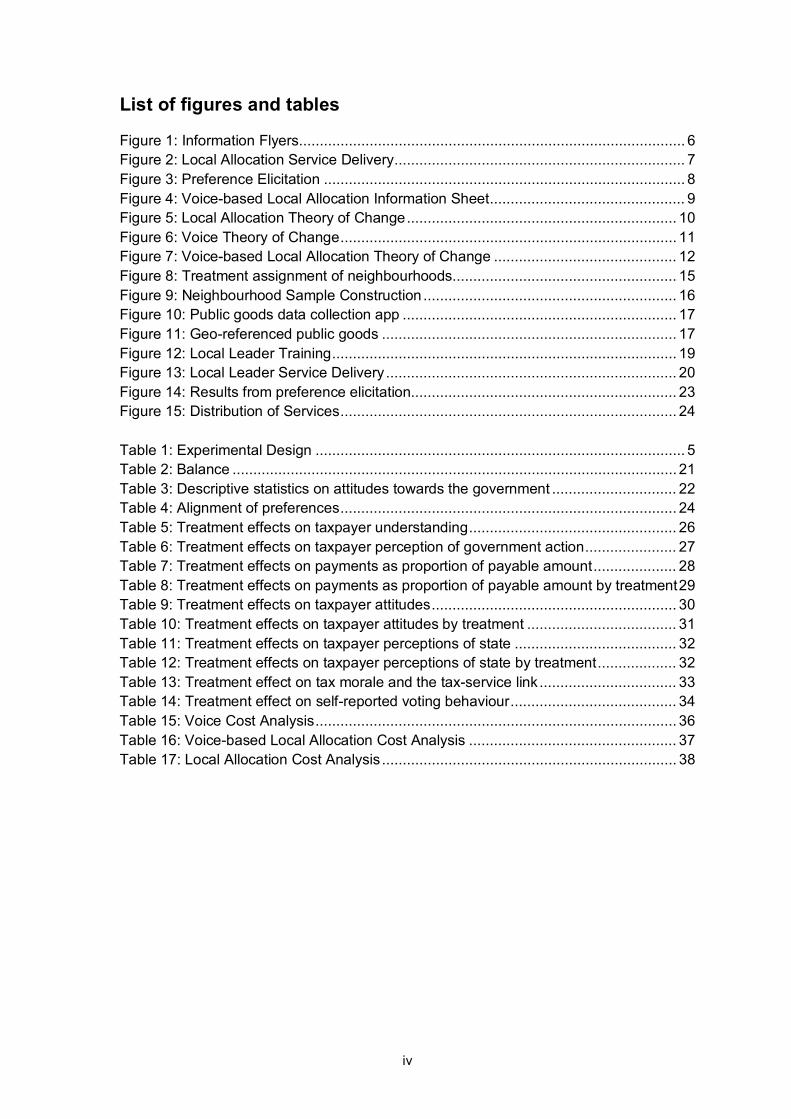
List of figures and tables
Figure 1: Information Flyers ............................................................................................. 6 Figure 2: Local Allocation Service Delivery ...................................................................... 7 Figure 3: Preference Elicitation ....................................................................................... 8 Figure 4: Voice-based Local Allocation Information Sheet ............................................... 9 Figure 5: Local Allocation Theory of Change ................................................................. 10 Figure 6: Voice Theory of Change ................................................................................. 11 Figure 7: Voice-based Local Allocation Theory of Change ............................................ 12 Figure 8: Treatment assignment of neighbourhoods...................................................... 15 Figure 9: Neighbourhood Sample Construction ............................................................. 16 Figure 10: Public goods data collection app .................................................................. 17 Figure 11: Geo-referenced public goods ....................................................................... 17 Figure 12: Local Leader Training ................................................................................... 19 Figure 13: Local Leader Service Delivery ...................................................................... 20 Figure 14: Results from preference elicitation................................................................ 23 Figure 15: Distribution of Services ................................................................................. 24 Table 1: Experimental Design ......................................................................................... 5 Table 2: Balance ........................................................................................................... 21 Table 3: Descriptive statistics on attitudes towards the government .............................. 22 Table 4: Alignment of preferences ................................................................................. 24 Table 5: Treatment effects on taxpayer understanding .................................................. 26 Table 6: Treatment effects on taxpayer perception of government action ...................... 27 Table 7: Treatment effects on payments as proportion of payable amount .................... 28 Table 8: Treatment effects on payments as proportion of payable amount by treatment 29 Table 9: Treatment effects on taxpayer attitudes ........................................................... 30 Table 10: Treatment effects on taxpayer attitudes by treatment .................................... 31 Table 11: Treatment effects on taxpayer perceptions of state ....................................... 32 Table 12: Treatment effects on taxpayer perceptions of state by treatment ................... 32 Table 13: Treatment effect on tax morale and the tax-service link ................................. 33 Table 14: Treatment effect on self-reported voting behaviour ........................................ 34 Table 15: Voice Cost Analysis ....................................................................................... 36 Table 16: Voice-based Local Allocation Cost Analysis .................................................. 37 Table 17: Local Allocation Cost Analysis ....................................................................... 38
v
Abbreviations and acronyms
CERP Center for Economic Research in Pakistan
E&T Punjab Excise and Taxation Department
GDP Gross domestic product
IRB Institutional Review Board
J-PAL Jameel Abdul Latif Poverty Lab
MIT Massachusetts Institute of Technology
RCT Randomized control trial
ROI Return on investment
1
1. Introduction
The social compact between citizen and state - whereby a citizen pays taxes and receives public goods and services - is a critical link in the development process. This link is especially salient in the context of local governments, and a significant metric by which they are judged. However, if citizens perceive little benefit from their tax payments, or if local services are disconnected from local decision-making, the link between citizen and state can be broken. This can create a vicious cycle where citizens do not receive high quality services because resources are limited by low levels of local tax revenue. In turn, the low quality of services leads to a low willingness to pay taxes, and a broader lack of trust in the state.
Though policymakers in developing countries regularly express concern regarding the suboptimal equilibrium of low revenue generation and low public good provision, few studies have examined whether strengthening the link between taxation and service provision can increase citizens' willingness to pay taxes. Simply informing citizens of the tax-benefit link does not seem to increase compliance (Blumenthal, Christian, and Slemrod 2001; Castro and Scartascini 2015). Laboratory experiments show that eliciting and promising to follow taxpayer preferences on government spending, on the other hand, can increase tax compliance (Alm, Jackson, and McKee 1993; Lamberton, De Neve, and Norton 2014). Other studies have found correlations between survey results on tax morale and service provision (OECD 2013), or have linked ex-post tax compliance to public service provision (Gonzalez-Navarro and Quintana-Domeque 2014). But there is still little evidence of the link between taxes paid and services delivered in the real world.
This impact evaluation provides what is to the best of our knowledge the first experimental evidence on this question. We partner with the Punjab, Pakistan provincial government to implement a series of interventions that strengthen the link between property taxes and local services in several ways - from simply eliciting taxpayers' preferences over local services, to earmarking a portion of tax revenues to be allocated to taxpayers' neighbourhoods, to earmarking a portion of tax revenues to be allocated to taxpayers' neighbourhoods according to their preferences. To the extent that citizens are reminded of the link between taxes and services or perceive public goods to more accurately reflect their preferences, they may experience a higher disutility from tax evasion, and tax compliance may increase. If so, these interventions could be a powerful policy reform and have positive implications over and above those on tax compliance by positively impacting citizens' views on and relationship with the state.
We implement the interventions in a large-scale randomized controlled trial in Lahore and Faisalabad, the two largest cities in Punjab. We first construct a sample of 500 neighbourhoods, comprising of 100 to 400 contiguous taxable properties. Each neighbourhood is assigned to one of three interventions for two rounds: Local Allocation, Voice, Voice-based Local Allocation, or Control. In Local Allocation neighbourhoods, the local government commits to allocating a portion (35%) of property tax collected from a neighbourhood to service provision in that same neighbourhood. In the status quo, revenue is collected from larger administrative tax units and distributed at the city-level for services - so citizens currently have no sense of how much of their taxes, if any, is spent on services within their locality, let alone how these services are chosen, or whether these services are the ones they desire. The Local Allocation intervention strengthens the geographic link between taxes paid and services provided.
2
In Voice neighbourhoods, citizens are asked to provide preferences on the types of local goods and services should be prioritized in their neighbourhood. Currently there is no explicit process, aside from constituency politics, through which citizens can express their preferences on what spending should occur in their neighbourhood. In the framework of the 2004 World Development Report, this approach -- influencing policy through elections -- is known as the ``long route" to accountability. While it can be effective for broad policies, more direct approaches - known as the ``short route" - can be more effective for building links between citizens and government. Evidence from other contexts suggests that allowing more direct participation in this process -- i.e. “short route" approaches -- can increase the perceived legitimacy of political decisions (Olken 2010). Citizen preferences in each Voice neighbourhood are aggregated and shared with the local government in an attempt to improve the allocation of services. The intervention tests whether increasing citizen voice in the decision making process affects the type and quality of local public goods provided and, in turn, increases citizen willingness to pay for these services through greater tax compliance and tax morale.
The Voice-based Local Allocation intervention combines preference elicitation and local allocation. Though more than 70% of local property taxes are designated for local goods and services in the status quo, simply eliciting preferences and providing them to the local government may not be sufficient to change taxpayer beliefs and attitudes if trust in the system is low. Similarly, simply earmarking funds for local allocation may be insufficient to change taxpayer behaviour, as taxpayers may be uninformed about these efforts. In Voice-based Local Allocation neighbourhoods, the local government allocates 35% of property tax revenue they receive to the specific goods and services requested by taxpayers. Citizens are informed of this earmarking, and the resultant service expenditures are indeed carried out in their locality.
Since local politicians can play a critical role in building (or hindering) citizen trust, and in monitoring the provision of local services, we also examine how local politicians can facilitate the tax-service linkage and how that in turn affects citizens' attitudes towards the state and politics. We cross-randomize intervention neighbourhoods into a Local Leader treatment, in which we assign a local politician to coordinate taxpayer mobilization efforts in his constituency. These mobilization efforts aim to increase awareness of the scheme, encourage taxpayers to submit tax payments punctually and accurately, and remind taxpayers of the link (established by the scheme) between taxes paid and services delivered.
We evaluate the impact of these interventions by comparing outcomes in intervention neighbourhoods to Control neighbourhoods, where taxes are collected and services are delivered as in the status quo. We estimate impacts on a range of outcomes including tax payments, tax morale, public goods quality, and attitudes towards the state. Throughout the study, we collect monthly property-level tax data on tax assessments, tax payments, and the timing of tax payments. We supplement this data with baseline and endline surveys of a representative sample of properties in our sample, collecting detailed data on tax morale, perceptions of service quality, voting behaviour, and engagement with the state. To gain an objective measure of public goods provision, we measure the extent and quality of street lighting, roads, sanitation, and water in our neighbourhoods before and after the interventions.
3
We have completed the interventions in all neighbourhoods, and are in the process of delivering a second round of services. On the positive side we find that the project succeeded in eliciting citizen preferences and delivering services against them, thereby changing the relationship between tax collectors and citizens. However, we find that despite successful delivery of services and finding (small) treatment effects on being in an intervention, citizens for the most part are unaware of being in a special scheme or of having received greater local goods. Not surprisingly, we therefore find muted effects on attitudes towards the state or tax payments. Given these results, we intend to also focus on raising awareness as we implement the second round of services so that we can examine whether doing so will lead to improved attitudes towards to state and greater tax payment.
2. Intervention
2.1 Description
2.1.1 Empirical Setting The study takes place in Lahore and Faisalabad, the two most populous cities in Punjab with populations of 18 and 4 million, respectively. Like many developing countries, Pakistan has experienced a wave of urbanization over the last few decades with nearly 40% of the population currently residing in cities. Social and urban services, however, have not kept pace. Even compared to other countries in the region, Pakistan is an outlier in public goods quality (ADB 2014).
Part of the reason for low public goods quality is insufficient finances. Public goods are financed by the Punjab Urban Immovable Property Tax (UIPT)1, but revenue from this tax is abysmally low. This property tax accounts for only one tenth of one percent of Punjab's GDP, which is roughly a fifth of the level of countries comparable to Pakistan (Nabi 2011). Many problems contribute to Punjab's low property tax revenue, including a narrow tax base, tax rates that do not reflect properties' true market value, tax evasion, corruption and poorly incentivized tax collectors (Khan et al. 2016). Given that local public goods and services are financed primarily through property tax, increasing property tax revenue would improve the government’s ability to deliver goods and services.
We work with the Punjab Excise and Taxation Department (E& &T), which collects property tax, and the Punjab Local Government Department, which provides services. The E&T department levies property tax based on a formula that takes into account property and neighbourhood characteristics. These include square footage of land and covered area, property use, occupation status, and locality quality ratings. Property tax is collected by tax inspectors, who are responsible for determining a property's tax liability and sending the annual tax bill to the property owner. Prior to 2016, property records were stored manually in separate offices; after a digitization campaign in 2016, the records are now stored in a secure online database that allows all tax inspectors to access historical and current property records for any assessed property in six major cities in Punjab.
1 Supplemental grants from the provincial and federal governments also provide funding for public goods.
4
Though a property's tax liability is formulaic, it is based on the tax inspector's assessment of the property. This assessment is not verified by third parties, leaving considerable discretionary power to the tax inspector in determining the final liability. Collusion between taxpayers and tax inspectors is thought to be widespread, with tax inspectors misreporting property characteristics (or leaving out a property from the tax rolls entirely) to lower liabilities. Taxpayers can also evade taxes by simply paying less than the assessed amount. The difference between the tax liability and payment is added to an arrears account, and carried over to the subsequent fiscal year.
The Local Government Department managed local governments and oversees the process of using property tax revenue to provide local public goods in each city. These services include street lights, road repair, sanitation, waste removal, and water.2 Though more than 70% of property tax revenue is supposed to be allocated for local public goods, our baseline survey shows most residents believe little if any of property tax is ultimately used for this purpose.
Given the low quality of urban services, citizens in both Lahore and Faisalabad are increasingly choosing to “opt-out" of the social compact entirely by relying on non-state actors for service provision. In the last two decades, a significant proportion of the upper middle class and elite have moved to or formed private housing societies that charge residents fees to finance services within their neighbourhoods. Others have chosen to remain where they are, but outsource certain services to private companies. This process hinders voluntary compliance to pay taxes and leads to further erosion of trust in the state. In our surveys, we measure not only citizen perceptions of service quality, but also their reliance on state and non-state actors for service provision.
For those relying on services provided by the Local Government Department, a citizen's first point of contact for municipal concerns is often a local politician. These local politicians are members of Union Councils, which are formally responsible for monitoring delivery of municipal services, maintenance of public areas, community mobilization and dispute resolution. Because these Councils have little to no development funds of their own, their main function is to intermediate between citizens and service providers. Members of the Union Councils were elected in 2016 for a five-year term. While in office, a typical Union Council politician was active in his or her neighbourhood unofficially as a political broker, and well-known in the community.3
2.1.2 Main Interventions Neighbourhoods were randomly allocated to one of three interventions: Local Allocation, Voice, or Voice-based Local Allocation. In addition, we cross-randomized neighbourhoods into Local Leader interventions, where members of the Union Councils were encouraged to mobilize the community to enhance the tax-service link. Randomization was stratified by income and property use (residential or commercial) to
2 In practice, sanitation and waste removal in metropolitan cities like Lahore and Faisalabad are outsourced to separate agencies, known as the Waste Management Company. We work with this agency directly to provide dumpsters and trash removal services in our neighbourhoods. 3 In May 2019, the incumbent government of Punjab decided to replace the structure of local governments and dissolve existing local bodies.
5
allow for the estimation of impact variation across sub-groups. We implemented the randomizations in public lotteries with representatives from the tax staff, local government, and Union councils present. Table 1 presents the experimental design:
Table 1: Experimental Design
350 neighbourhoods were assigned to one of the three main interventions, while the remaining 150 neighbourhoods formed the control group. In each intervention group, we randomly selected half of the neighbourhoods to also receive the Local Leader intervention. The experiment is implemented for two rounds of preference elicitation and service delivery to trace dynamics as citizens see how their preferences are acted upon during the first year.
We describe each intervention in detail below:
Local Allocation: In the status quo, revenue is collected from administrative tax units and transferred to local governments that allocate these to city-level services. However, there is no linkage between taxes paid and services received at a lower and likely more salient geographical unit: the neighbourhood (a contiguous set of typically 100-400 households). To strengthen the link between taxes paid and services provided, local governments commit to allocate a portion (35%) of property tax collected from a Local Allocation neighbourhood to that same neighbourhood.4 This earmarking is large enough to finance local services within neighbourhoods, but small enough to not create externalities on the total budget.5
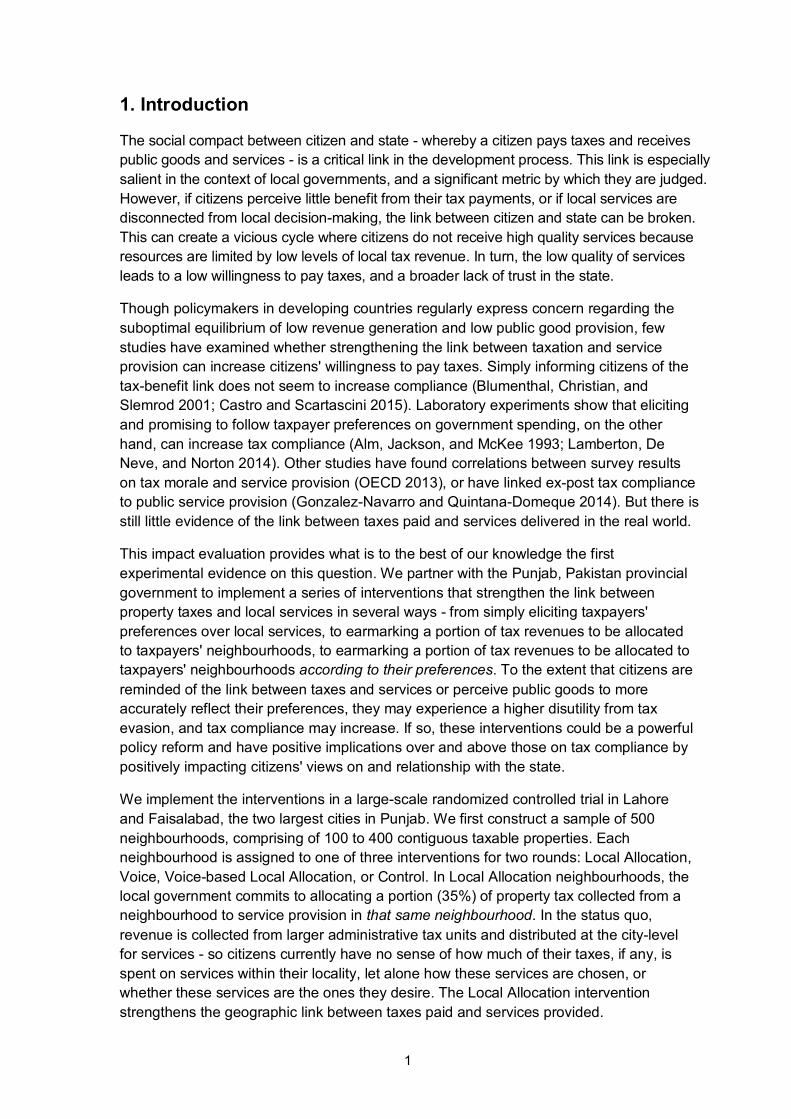
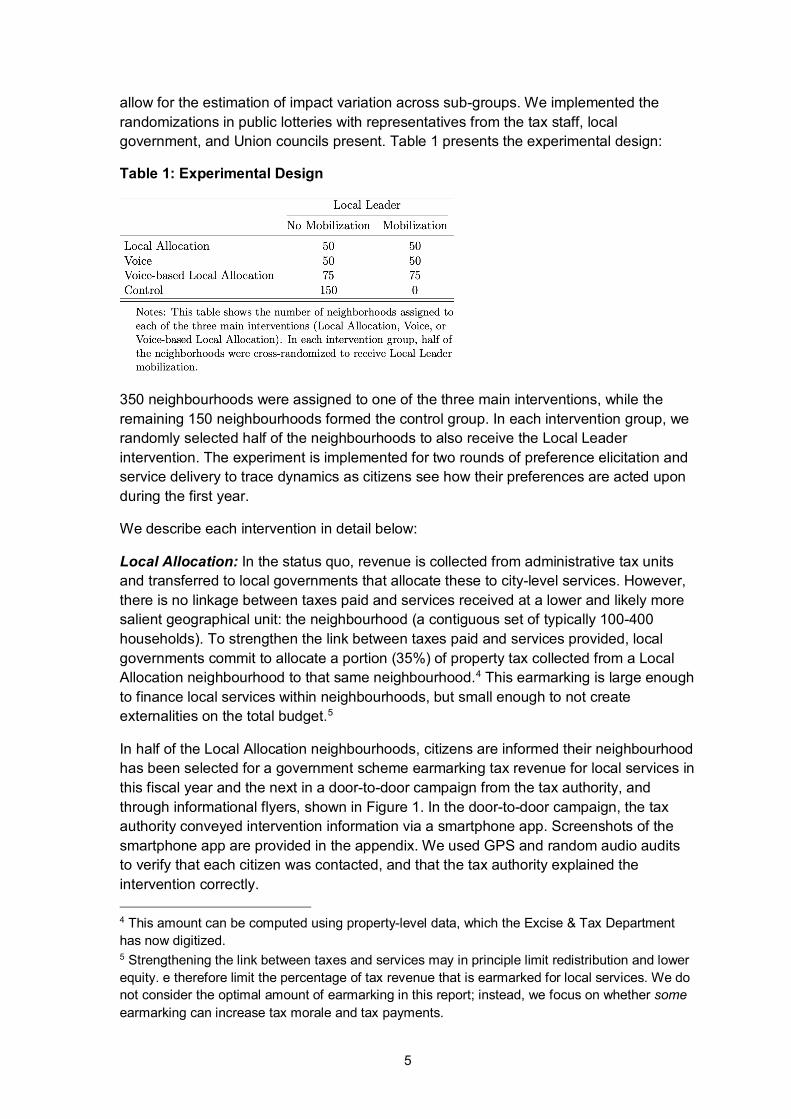
In half of the Local Allocation neighbourhoods, citizens are informed their neighbourhood has been selected for a government scheme earmarking tax revenue for local services in this fiscal year and the next in a door-to-door campaign from the tax authority, and through informational flyers, shown in Figure 1. In the door-to-door campaign, the tax authority conveyed intervention information via a smartphone app. Screenshots of the smartphone app are provided in the appendix. We used GPS and random audio audits to verify that each citizen was contacted, and that the tax authority explained the intervention correctly. 4 This amount can be computed using property-level data, which the Excise & Tax Department has now digitized.
5 Strengthening the link between taxes and services may in principle limit redistribution and lower equity. e therefore limit the percentage of tax revenue that is earmarked for local services. We do not consider the optimal amount of earmarking in this report; instead, we focus on whether some earmarking can increase tax morale and tax payments.
6
Figure 1: Information Flyers
In the other half of the Local Allocation neighbourhoods, tax revenue was earmarked and services delivered – but without informing citizens beforehand in the door-to-door campaign.6
On average, the earmarked amount (35% of neighbourhood-level property tax revenue) corresponds to Rs. 200,000 (approximately $1,500) and is sufficient to finance a range of services in varying quantities. We computed earmarked amounts using administrative property tax data. The local governments could then select any service from a menu of options so long as the costs did not exceed the budgetary constraint. Services on the menu of options satisfy two criteria: (1) the local governments (or its subsidiaries) provides the service; and (2) the service can be financed with 35% of the average tax revenue of a neighbourhood.
Service delivery takes place over a four to five month period. First, engineers survey each neighbourhood to determine the type, quantity, and location of services to be delivered. Cost estimates are prepared to ensure services can be financed by the total amount of funds allocated to each neighbourhood. Proposed services are submitted to the Mayor and relevant government officials of each city for approval, after which contracts for service delivery are tendered. Service delivery is then implemented in each neighbourhood.
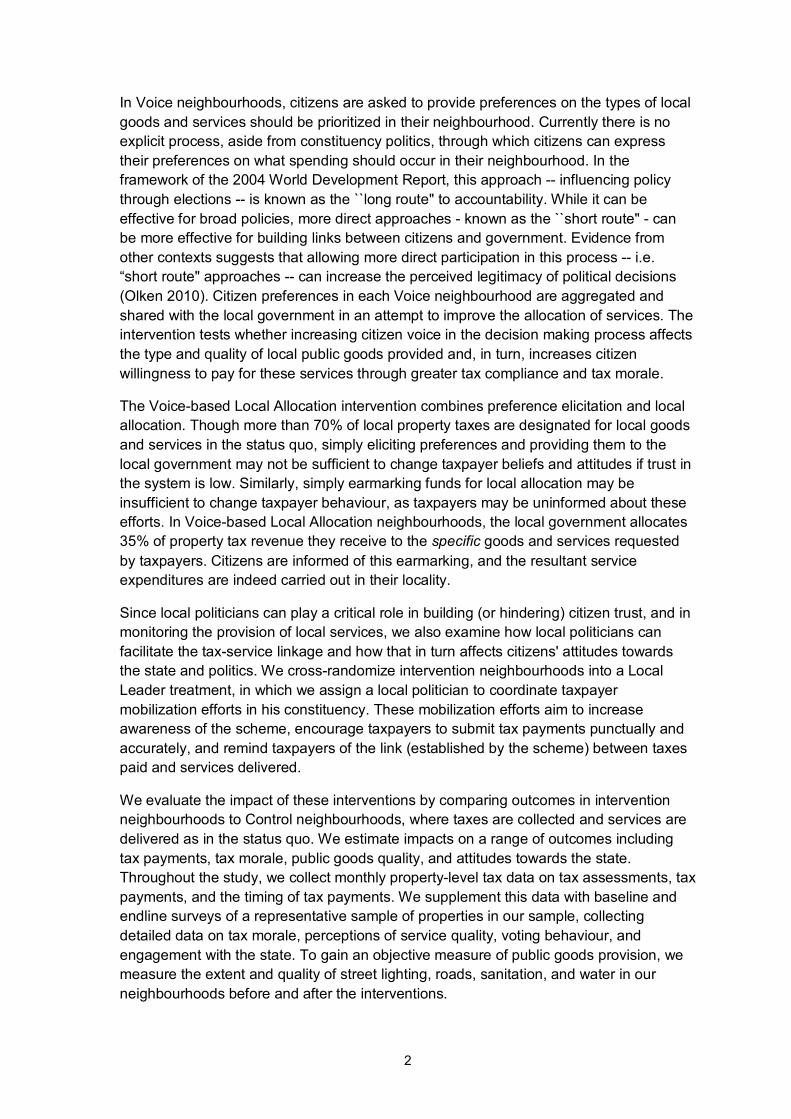
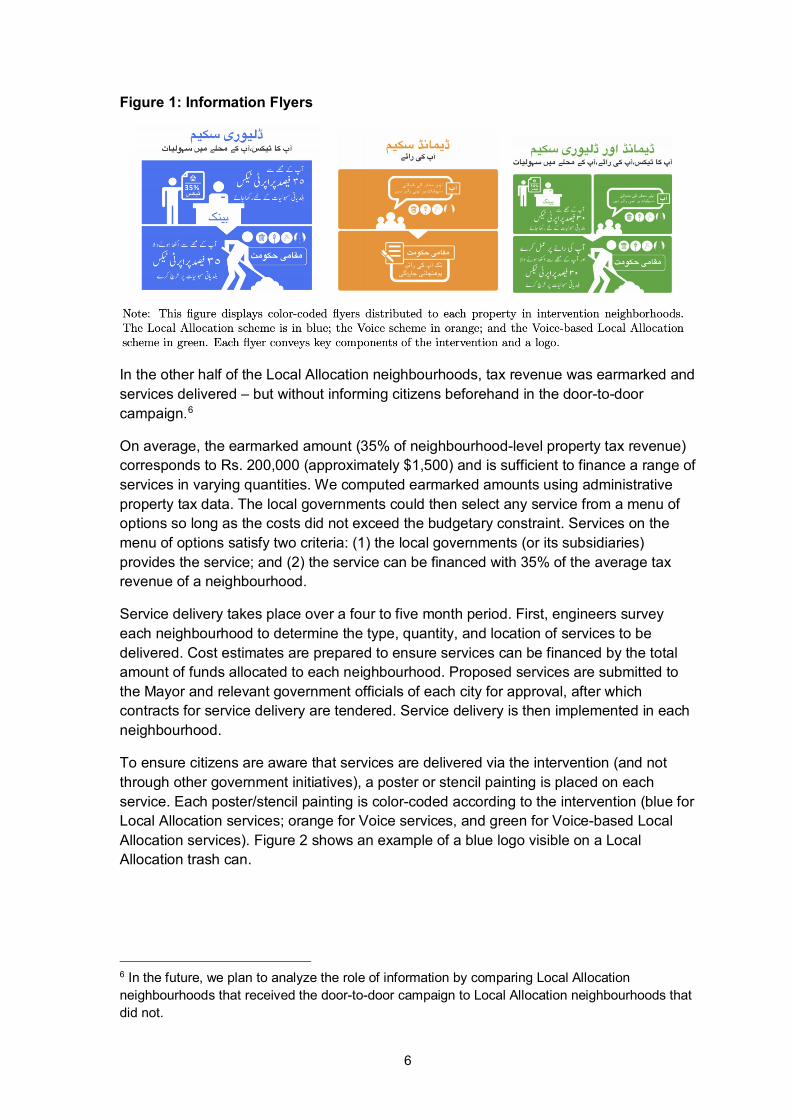
To ensure citizens are aware that services are delivered via the intervention (and not through other government initiatives), a poster or stencil painting is placed on each service. Each poster/stencil painting is color-coded according to the intervention (blue for Local Allocation services; orange for Voice services, and green for Voice-based Local Allocation services). Figure 2 shows an example of a blue logo visible on a Local Allocation trash can.
6 In the future, we plan to analyze the role of information by comparing Local Allocation neighbourhoods that received the door-to-door campaign to Local Allocation neighbourhoods that did not.
7
Figure 2: Local Allocation Service Delivery
Voice: In the Voice intervention, tax staff inform citizens their neighbourhood has been selected for a government scheme to solicit preferences on which types of local goods and services should be prioritized in their neighbourhood. The results of this preference elicitation are shared with the local government in an effort to improve the allocation of services.
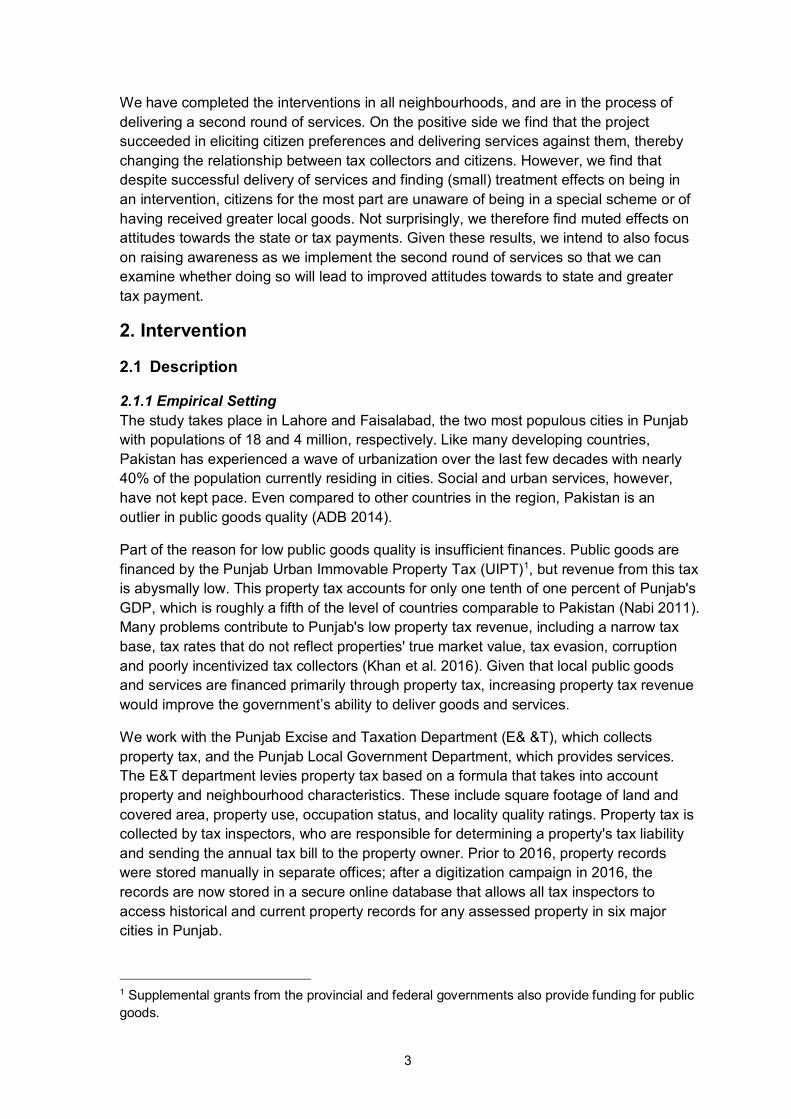
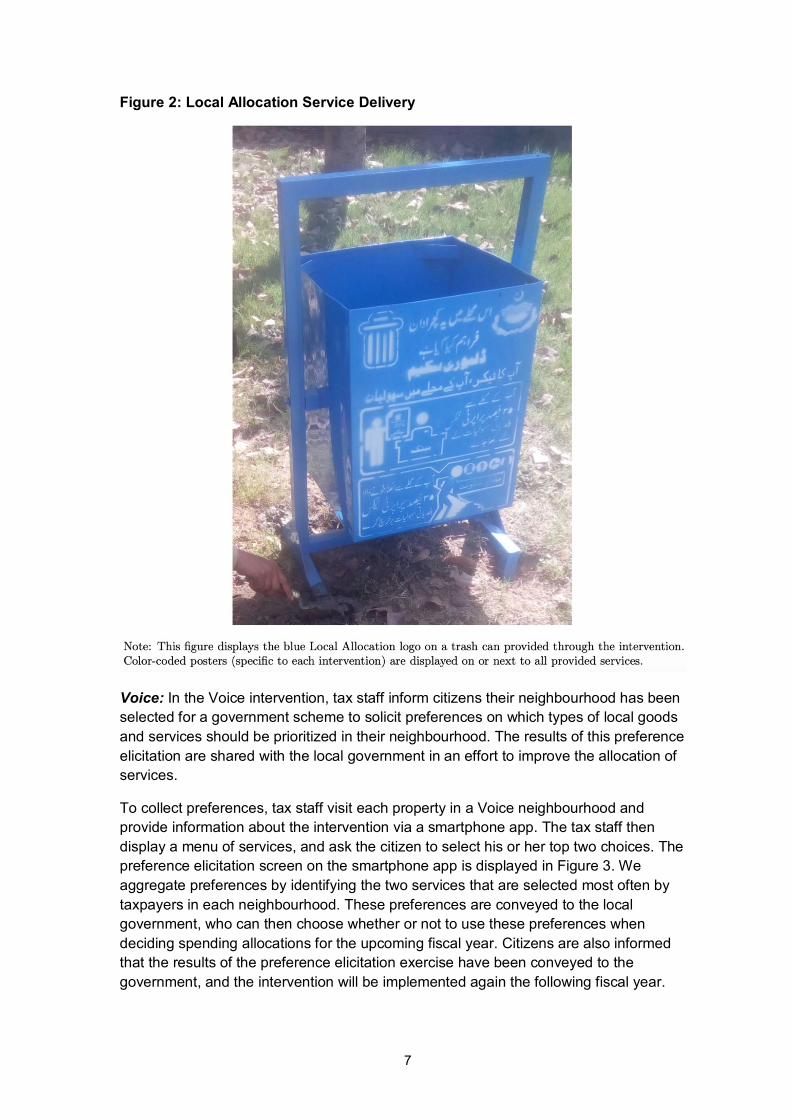
To collect preferences, tax staff visit each property in a Voice neighbourhood and provide information about the intervention via a smartphone app. The tax staff then display a menu of services, and ask the citizen to select his or her top two choices. The preference elicitation screen on the smartphone app is displayed in Figure 3. We aggregate preferences by identifying the two services that are selected most often by taxpayers in each neighbourhood. These preferences are conveyed to the local government, who can then choose whether or not to use these preferences when deciding spending allocations for the upcoming fiscal year. Citizens are also informed that the results of the preference elicitation exercise have been conveyed to the government, and the intervention will be implemented again the following fiscal year.
8
Figure 3: Preference Elicitation
Voice-based Local Allocation: This intervention implements the Local Allocation and Voice interventions in tandem. By both eliciting citizen preferences and requiring local governments to allocate a portion of property tax collected from a neighbourhood to that same neighbourhood in accordance with these preferences, it seeks to make the tax-services link even more salient and credible.
Citizen preferences are collected as in the Voice intervention. The aggregated preferences are conveyed to the local government, but unlike in the Voice intervention, local governments are required to implement desired preferences. We compute the budget constraint for each neighbourhood (35% of neighbourhood-level property tax revenue) and ask the local government to survey each neighbourhood to determine the amounts of each preferred services that can be provided within the constraint. The process for service delivery is the same as in the Local Allocation intervention.
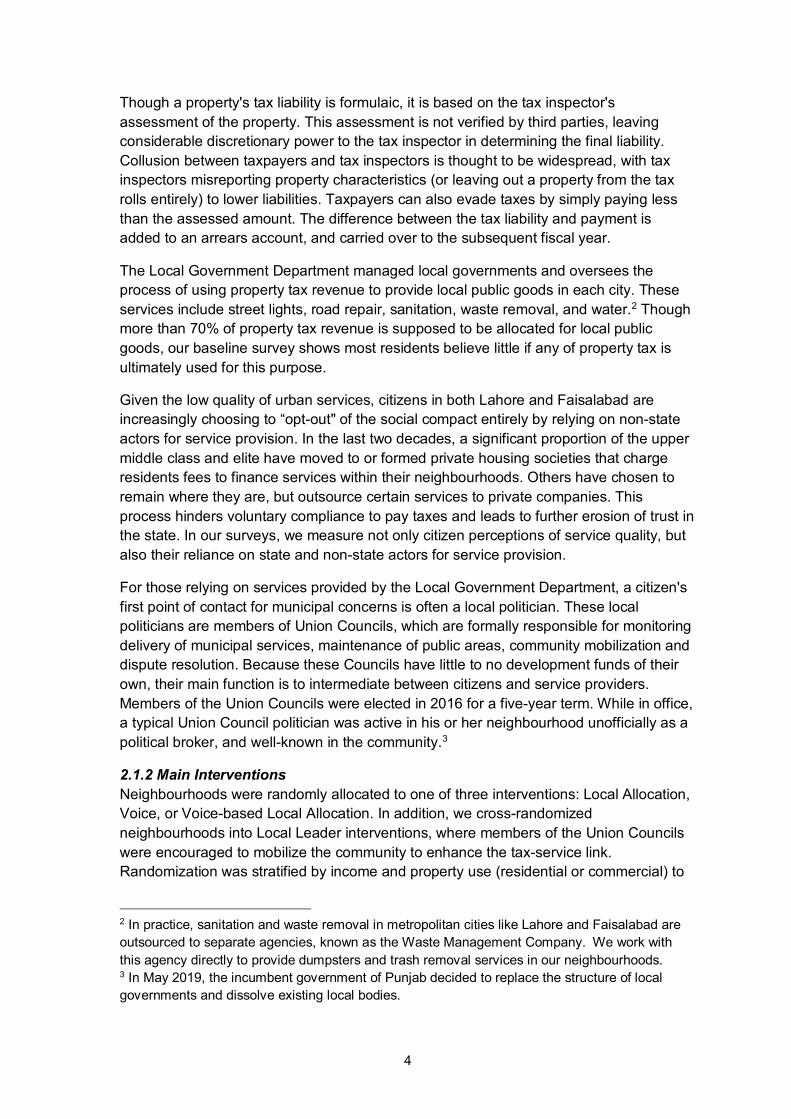
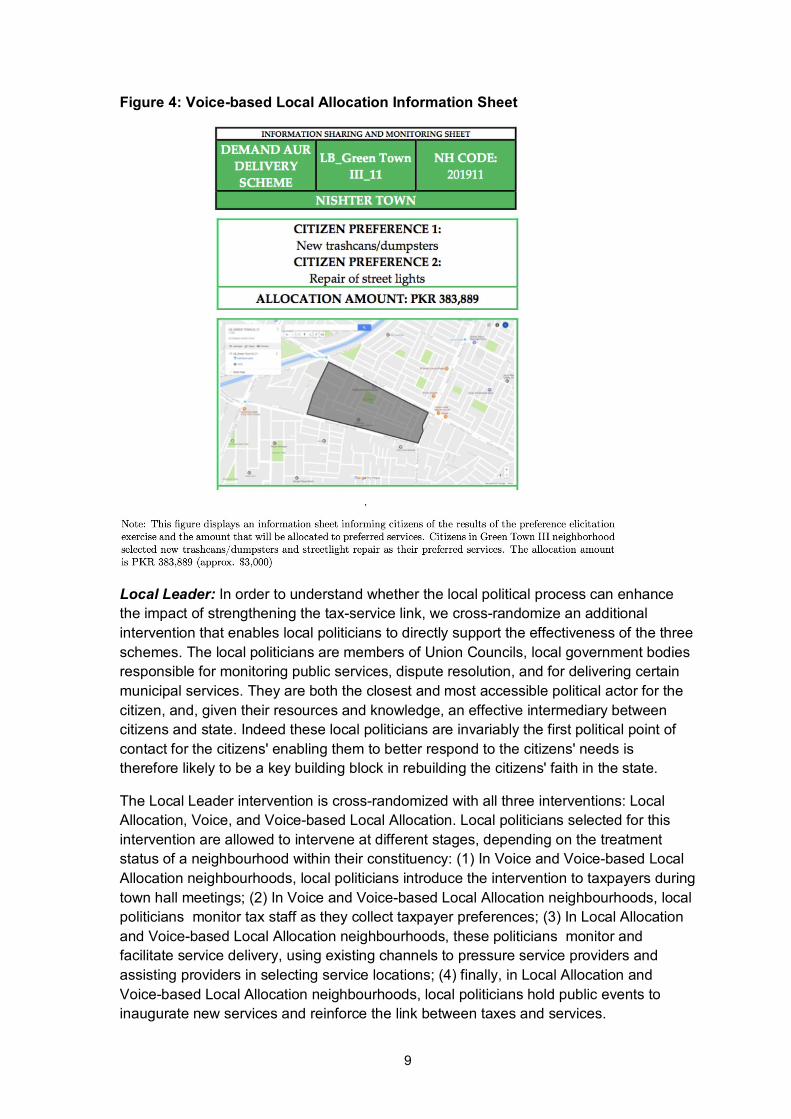
Citizens are informed that the results of the preference elicitation exercise will be implemented and the expected timeline for service delivery. Citizens are also informed the scheme will be implemented in the following fiscal year. Figure 4 shows an information flyer for a neighbourhood assigned to the Voice-based Local Allocation intervention. The flyer shows that citizens in this neighbourhood selected new trashcans/dumpsters and streetlight repair as their preferred services. The allocation amount for these services is PKR 383,889 (approx. $3,000). Once services are delivered, a poster or stencil-painting links the service to the intervention, as in the Local Allocation intervention.
9
Figure 4: Voice-based Local Allocation Information Sheet
Local Leader: In order to understand whether the local political process can enhance the impact of strengthening the tax-service link, we cross-randomize an additional intervention that enables local politicians to directly support the effectiveness of the three schemes. The local politicians are members of Union Councils, local government bodies responsible for monitoring public services, dispute resolution, and for delivering certain municipal services. They are both the closest and most accessible political actor for the citizen, and, given their resources and knowledge, an effective intermediary between citizens and state. Indeed these local politicians are invariably the first political point of contact for the citizens' enabling them to better respond to the citizens' needs is therefore likely to be a key building block in rebuilding the citizens' faith in the state.
The Local Leader intervention is cross-randomized with all three interventions: Local Allocation, Voice, and Voice-based Local Allocation. Local politicians selected for this intervention are allowed to intervene at different stages, depending on the treatment status of a neighbourhood within their constituency: (1) In Voice and Voice-based Local Allocation neighbourhoods, local politicians introduce the intervention to taxpayers during town hall meetings; (2) In Voice and Voice-based Local Allocation neighbourhoods, local politicians monitor tax staff as they collect taxpayer preferences; (3) In Local Allocation and Voice-based Local Allocation neighbourhoods, these politicians monitor and facilitate service delivery, using existing channels to pressure service providers and assisting providers in selecting service locations; (4) finally, in Local Allocation and Voice-based Local Allocation neighbourhoods, local politicians hold public events to inaugurate new services and reinforce the link between taxes and services.
10
2.2 Theory of Change
The primary study goal is to help rebuild the link between tax payments and service provision. The evaluation estimates the effect of the following main interventions: (1) Local Allocation, (2) Voice, and (3) Voice-based Local Allocation. To the extent that citizens are reminded of the link between taxes and services or perceive public goods to reflect their preferences, they may experience a higher disutility from tax evasion, enhancing tax compliance. If so, these interventions could be powerful policy reforms and have positive implications over and above those on tax compliance by positively impacting the citizen’s views and relationships with the state.
The following subsections outline the theory of change for the Local Allocation, Voice, and Voice-based Local Allocation interventions. Since the Local Leader intervention is cross-randomized with each of these three primary interventions, we also discuss how enabling local politicians affects the theory of change.
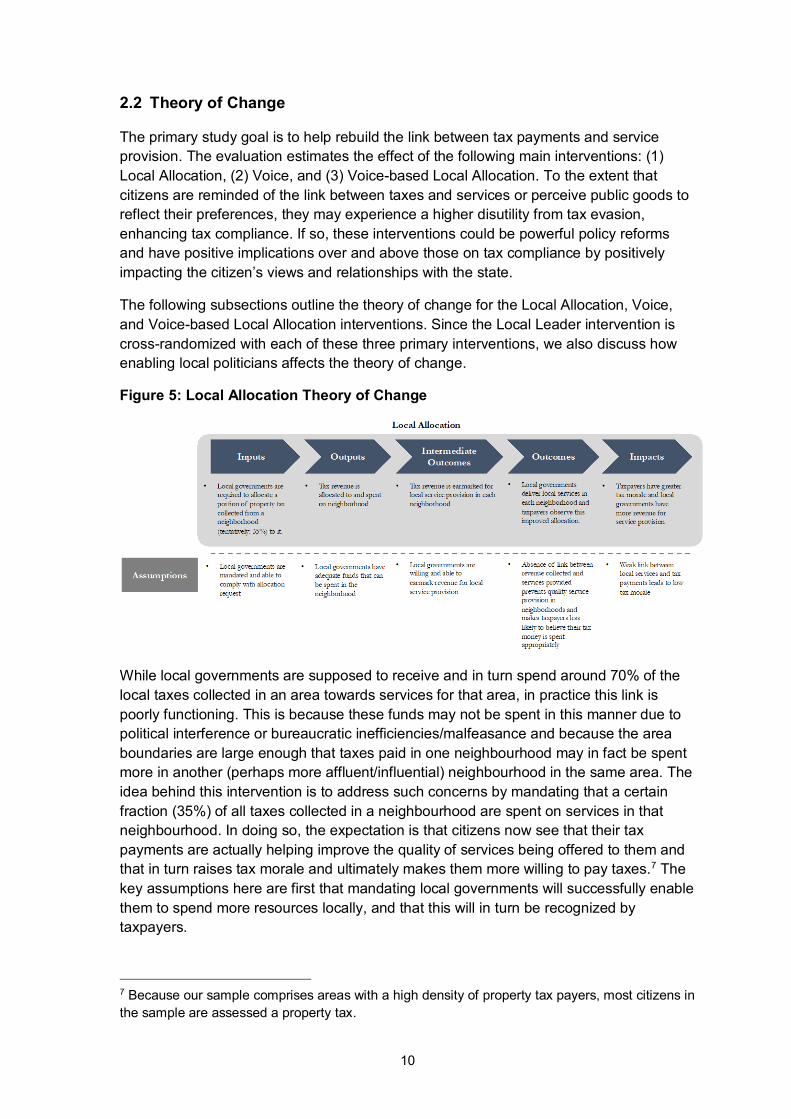
Figure 5: Local Allocation Theory of Change
While local governments are supposed to receive and in turn spend around 70% of the local taxes collected in an area towards services for that area, in practice this link is poorly functioning. This is because these funds may not be spent in this manner due to political interference or bureaucratic inefficiencies/malfeasance and because the area boundaries are large enough that taxes paid in one neighbourhood may in fact be spent more in another (perhaps more affluent/influential) neighbourhood in the same area. The idea behind this intervention is to address such concerns by mandating that a certain fraction (35%) of all taxes collected in a neighbourhood are spent on services in that neighbourhood. In doing so, the expectation is that citizens now see that their tax payments are actually helping improve the quality of services being offered to them and that in turn raises tax morale and ultimately makes them more willing to pay taxes.7 The key assumptions here are first that mandating local governments will successfully enable them to spend more resources locally, and that this will in turn be recognized by taxpayers.
7 Because our sample comprises areas with a high density of property tax payers, most citizens in the sample are assessed a property tax.
11
Local leaders can reinforce critical linkages in this theory of change in two ways. First, local leaders can monitor service providers to ensure services are high quality and delivered in a timely manner. Taxpayers may not be willing to increase tax payments if service quality is poor or delayed. Second, local leaders can increase taxpayer awareness of delivered services by holding public events. If taxpayers do not observe improvements in their neighbourhood, service delivery will have little effect.
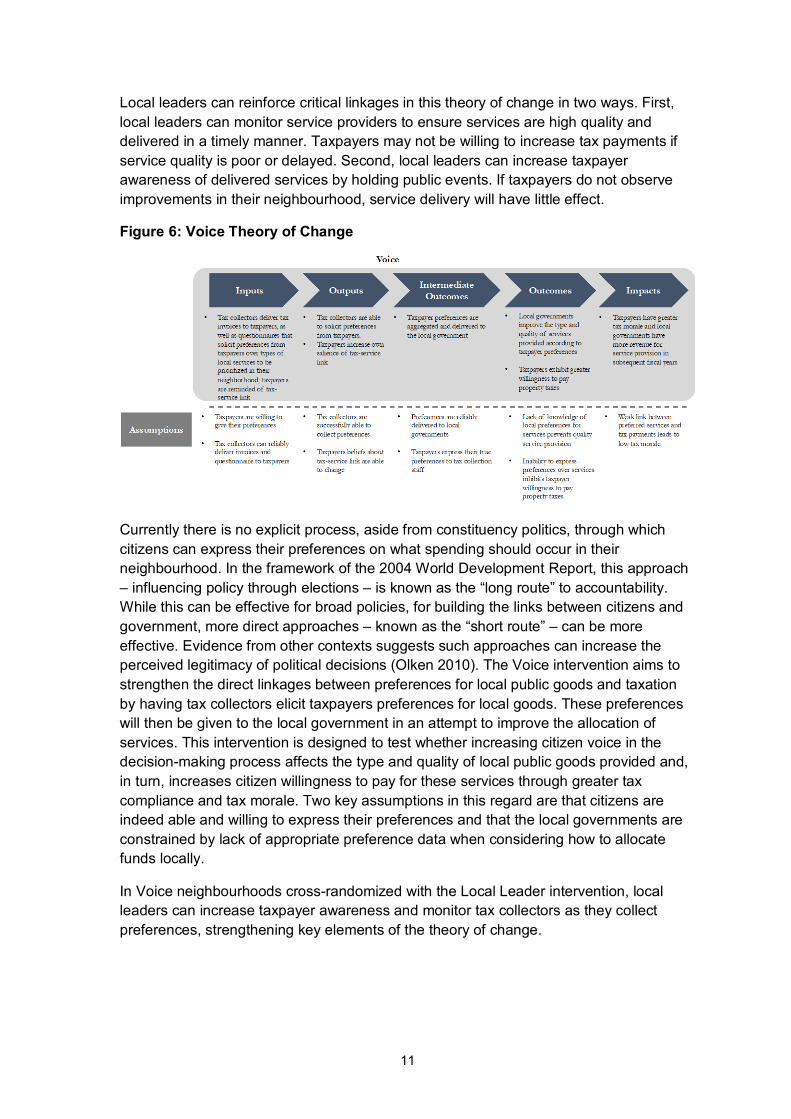
Figure 6: Voice Theory of Change
Currently there is no explicit process, aside from constituency politics, through which citizens can express their preferences on what spending should occur in their neighbourhood. In the framework of the 2004 World Development Report, this approach – influencing policy through elections – is known as the “long route” to accountability. While this can be effective for broad policies, for building the links between citizens and government, more direct approaches – known as the “short route” – can be more effective. Evidence from other contexts suggests such approaches can increase the perceived legitimacy of political decisions (Olken 2010). The Voice intervention aims to strengthen the direct linkages between preferences for local public goods and taxation by having tax collectors elicit taxpayers preferences for local goods. These preferences will then be given to the local government in an attempt to improve the allocation of services. This intervention is designed to test whether increasing citizen voice in the decision-making process affects the type and quality of local public goods provided and, in turn, increases citizen willingness to pay for these services through greater tax compliance and tax morale. Two key assumptions in this regard are that citizens are indeed able and willing to express their preferences and that the local governments are constrained by lack of appropriate preference data when considering how to allocate funds locally.
In Voice neighbourhoods cross-randomized with the Local Leader intervention, local leaders can increase taxpayer awareness and monitor tax collectors as they collect preferences, strengthening key elements of the theory of change.
12
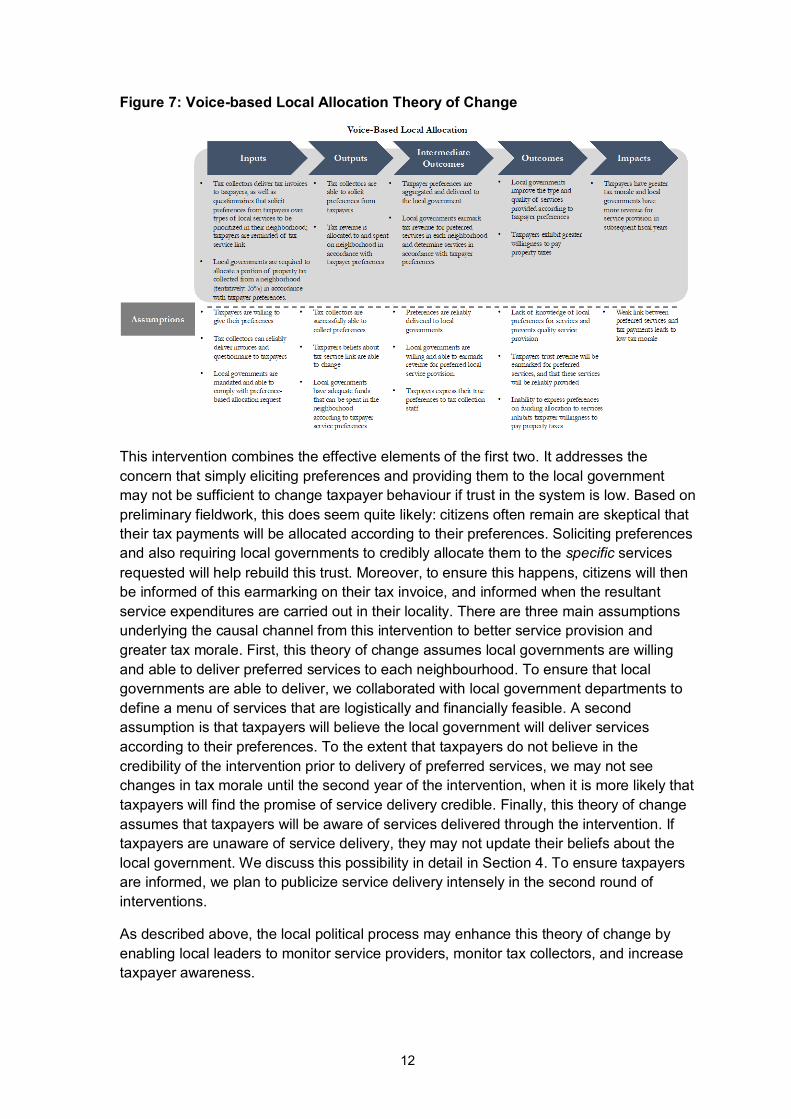
Figure 7: Voice-based Local Allocation Theory of Change
This intervention combines the effective elements of the first two. It addresses the concern that simply eliciting preferences and providing them to the local government may not be sufficient to change taxpayer behaviour if trust in the system is low. Based on preliminary fieldwork, this does seem quite likely: citizens often remain are skeptical that their tax payments will be allocated according to their preferences. Soliciting preferences and also requiring local governments to credibly allocate them to the specific services requested will help rebuild this trust. Moreover, to ensure this happens, citizens will then be informed of this earmarking on their tax invoice, and informed when the resultant service expenditures are carried out in their locality. There are three main assumptions underlying the causal channel from this intervention to better service provision and greater tax morale. First, this theory of change assumes local governments are willing and able to deliver preferred services to each neighbourhood. To ensure that local governments are able to deliver, we collaborated with local government departments to define a menu of services that are logistically and financially feasible. A second assumption is that taxpayers will believe the local government will deliver services according to their preferences. To the extent that taxpayers do not believe in the credibility of the intervention prior to delivery of preferred services, we may not see changes in tax morale until the second year of the intervention, when it is more likely that taxpayers will find the promise of service delivery credible. Finally, this theory of change assumes that taxpayers will be aware of services delivered through the intervention. If taxpayers are unaware of service delivery, they may not update their beliefs about the local government. We discuss this possibility in detail in Section 4. To ensure taxpayers are informed, we plan to publicize service delivery intensely in the second round of interventions.
As described above, the local political process may enhance this theory of change by enabling local leaders to monitor service providers, monitor tax collectors, and increase taxpayer awareness.
13
3. Evaluation
3.1 Primary and secondary questions
The broad aim of this research is to understand if increasing voice and enhancing allocation in local service delivery can help rebuild the link between citizens and the state. To this end, specific research questions include:
(1) Does increasing tax-benefit linkages, by committing to increase the share of local taxes used to deliver services within a small geographic neighbourhood, enhance citizens’ tax morale and their willingness to pay taxes?
(2) Does giving citizens voice by eliciting preferences over service provision and delivering those preferences to local government affect their trust in the state, the type and quality of local public goods provided and, in turn, increase citizen willingness to pay for those services through greater tax payment and tax morale?
(3) Is eliciting preferences sufficient, or is it necessary to mandate that local governments follow elicited preferences and actually deliver goods in accordance with those preferences in order to improve trust in the state and increase tax performance?
(4) Does mobilizing local politicians to strengthen the link between local collections and urban services enhance citizens’ voice, enhance tax morale/payments, improve service provision, and/or impact political attitudes and behaviour of citizens and local politicians?
3.2 Design and methods
The empirical framework relies on the random assignment of neighbourhoods to an intervention or control group. The basic specification for estimating the average treatment effect at the individual property level is given by:
where Yinst is an outcome of interest for property i in neighbourhood n in stratum s at time t. When possible, we include the baseline level of the outcome variable, Yi0. Xinst is a set of baseline property-level characteristics, including the log of government assessed property worth, whether the taxpayer was identified as a defaulter at baseline, property use (residential or commercial), occupation status (owned or rented), location (main or off road), and valuation category (A through G). Since the randomization is stratified by income and property use, we include stratum fixed effects, ⍺s. Standard errors are clustered at the neighbourhood level.
To estimate the impact of separate sub-treatments, we estimate the following equation:
Our primary outcomes of interest are tax payments (assessed tax, paid tax, timing of payment), attitudes towards the government (including tax morale), and voter behaviour. We also measure treatment impacts on (objective and subjective) measures of public goods quality.
14
In our analysis of administrative tax payments, we examine the impact of the treatments for four samples: (1) the full sample of taxpayers; (2) taxpayers who did not pay in full in the baseline year (FY2015 to 2016); (3) taxpayers who did not pay at all in the baseline year; and (4) taxpayers who made a partial payment in the baseline year. We expect the interventions to have the greatest impact on tax payments in the latter three groups, where taxpayers can easily increase tax payments at their baseline assessment.8
3.3 Ethics
This study is under the primary oversight of the Institutional Review Board (IRB) at the Massachusetts Institute of Technology (MIT). Our partner institutions (e.g. Harvard University, CERP) have agreed to cede oversight to MIT for coordination purposes. The relevant ethical issues are randomization and privacy.
In regards to randomization of the local allocation and voice-based local treatment, one risk is that funds earmarked for service provision are diverted from other necessary government operations. Although a possible concern in theory, it is unlikely to matter in our context given that property tax revenues constitute less than 20% of city government revenues and given that our neighbourhoods are a small fraction of the city. Moreover, property taxes are meant to be spent on local services and there is little concern that changing allocations will impact other government operations. Furthermore, although supply constraints can also be a concern in theory, the view of relevant policymakers is that this is not a practical concern in this context given that service providers are operating well below capacity and that contracting out public services is also an option that is increasingly being utilized in Punjab.
In regards to the collection of potentially confidential data from individuals through property surveys and from the tax authorities through property-level tax payments, standard protocols will be used to protect confidentiality:
1. All paper records with identifying information will be stored securely 2. The names and addresses of respondents participating in the study will be taken
out of the electronic version and replaced with anonymous identification numbers; 3. The link file that cross-references the various study identification numbers and
identifying information will be kept in a secure place 4. Access to confidential material will be highly restricted and certainly go no further
than the Principal Investigators and project staff hired to do the study 5. All project and survey staff will be required to sign Confidentiality Agreements
pledging them to honor the confidentiality of the data.
To ensure that all government stakeholders are aware of the risks of the intervention, we asked all implementing partners (tax and local government authorities) to formally approve the intervention prior to its inception. Moreover, taxpayers randomized into treatment neighbourhoods are fully informed of the specifics of the intervention during property visits.
8 Tax payments can also increase via re-assessments. This is more costly, however, since the taxpayer would have to request a re-assessment from the tax authority.
15
3.4 Sampling and data collection
3.4.1 Sample The sample consists of 500 neighbourhoods, comprising over 100,000 taxpayers in Lahore and Faisalabad. These neighbourhoods were identified using geo-referenced property-level administrative data according to several key parameters. Neighbourhoods were constructed to consist of around 100 to 400 contiguous taxable residential or commercial properties. This size ensures each neighbourhood is small enough so that the incentive to free-ride is not too strong, citizen preferences can be aggregated, and the goods or services provided are utilized by most taxpayers in the neighbourhood. However, the neighbourhood size is not so small that the goods or services cannot be financed from local revenue. Neighbourhoods also have a high density of taxable properties so that a large proportion of residents or shopkeepers in the neighbourhood can potentially contribute revenue for service provision.910 Finally, neighbourhoods are defined to be contiguous so there is some sense of social cohesion among taxpayers. This social cohesion may facilitate tax compliance by allowing taxpayers to encourage their neighbors to pay taxes.
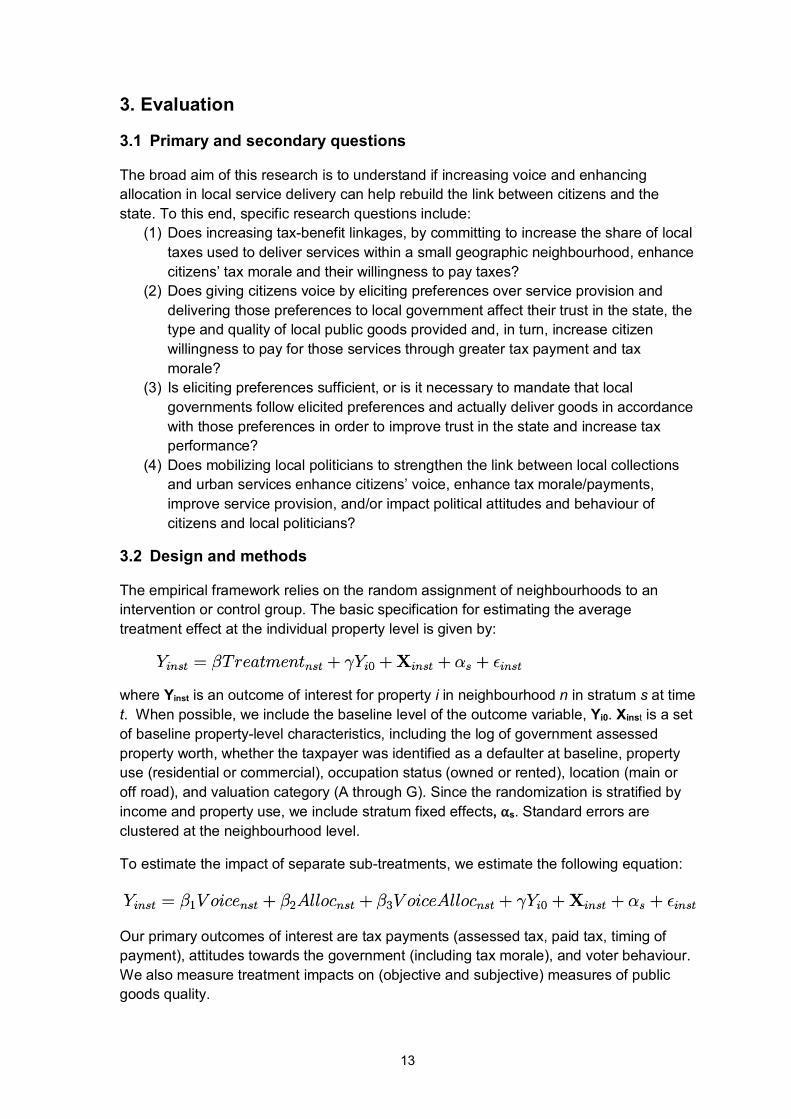
Figure 8 displays neighbourhoods in Lahore and Faisalabad, color-coded by treatment assignment.
Figure 8: Treatment assignment of neighbourhoods
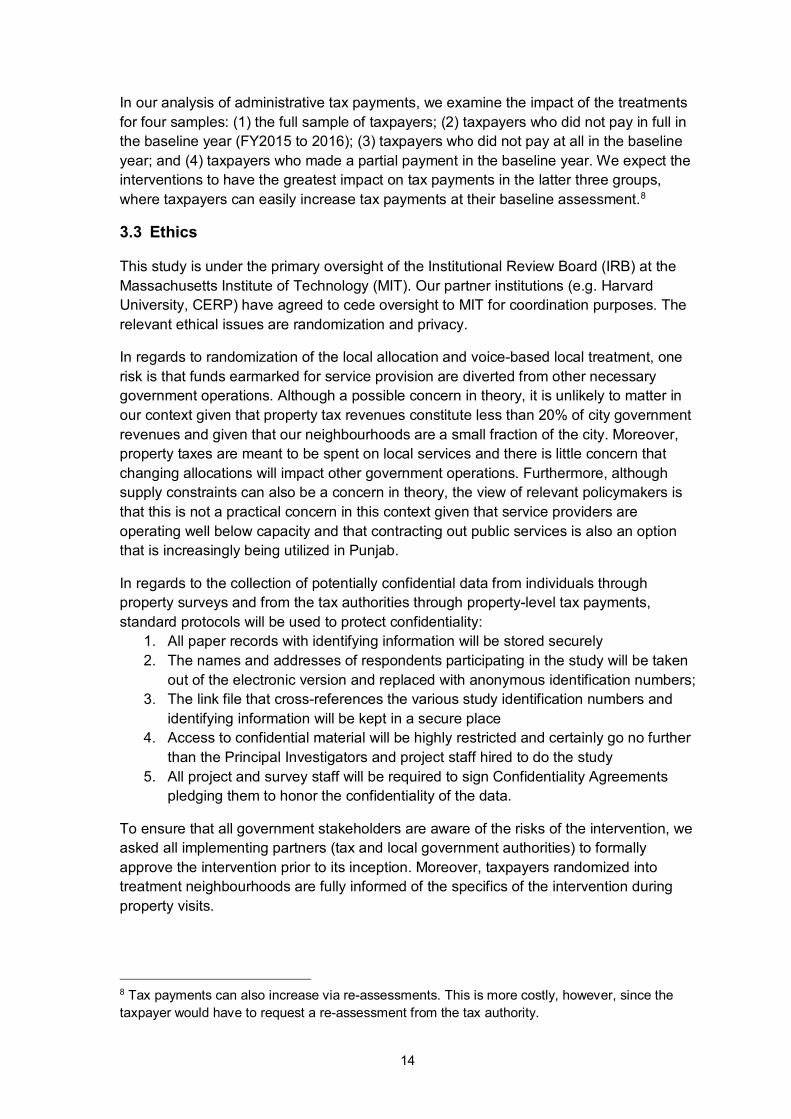
Our sample of neighbourhoods covers areas throughout each city.11 Figure 9 shows how neighbourhoods were identified using administrative, geo-referenced property data. 9 Note that even with this eligibility criteria, there is still large variation in neighbourhood-level revenue in the sample. 10 This eligibility criteria also allows us to focus on residents of taxable properties when eliciting preferences in Voice and Voice-based Local Allocation neighbourhoods to obtain a representative sample of neighbourhood preferences. 11 One exception is the south-east portion of Lahore, which is excluded since this region consists primarily of private housing areas that are exempt from property tax and rely primarily on non-state actors for service provision.
16
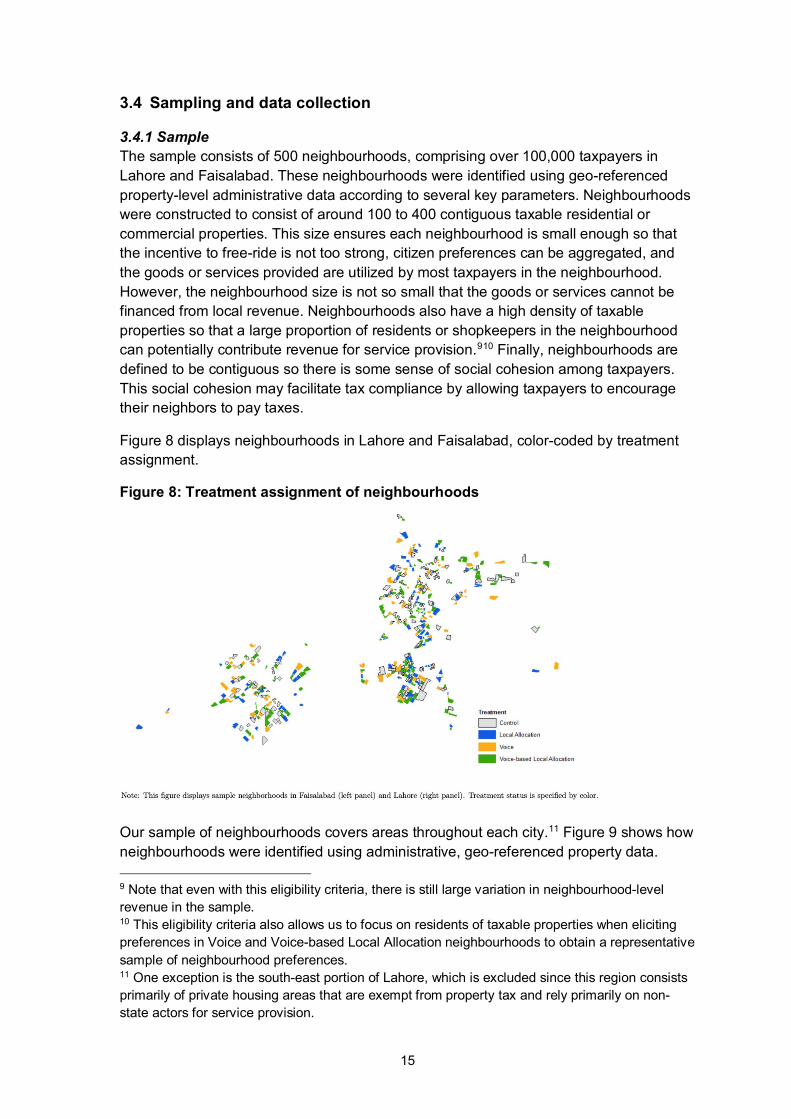
Figure 9: Neighbourhood Sample Construction
3.4.2 Data collection We collect detailed administrative, survey, and qualitative data on tax payments, public goods and services, and attitudes towards the state. Below, we describe key aspects of our data.
Administrative tax data: We collect administrative property-level data on tax assessments and tax payments. This data is available from FY2014 onwards on a monthly basis. For each property in our sample, we construct measures of tax assessed, tax paid, and timing of payment timings.
The administrative data also contains detailed property characteristics such as property use (residential or commercial), ownership status (owned or rented), and property location (main or off road). In addition, we observe the property's valuation category which captures the quality of facilities and infrastructure in the property's locality. Each property is assigned a valuation category ranging from A to G. These property characteristics allow us to construct a rich set of property-level controls that increase the precision of our estimates.
Property survey data: We survey residents in properties in our neighbourhoods at baseline and at the end of the intervention period.12 Since it would be too costly to survey all 100 to 400 taxable properties within each neighbourhood, we use a simple randomization strategy to select properties for the survey sample. In particular, we sample three GPS coordinates within each neighbourhood and then survey three to four randomly chosen properties around that coordinate. This strategy ensures that surveyed properties form a representative picture of the typical property in each neighbourhood. Each property in the baseline sample is surveyed again at endline so as to create a panel and hence improve statistical precision in the analysis. 12 Residents are the current residents of the property, and may be owners or renters of the property. Renters are typically responsible for property tax payments in rented properties, though the renter’s name is not officially listed on the property tax notice.
17
The survey collects detailed data on usage of and perceptions of quality of relevant urban services, such as water, sanitation, waste removal, street maintenance, and lighting. We also obtain information on tax morale, voting behaviour, and attitudes towards the government more generally. We match the property survey data to the administrative data using property identifiers. This allows us to geo-reference each observation in our survey sample.
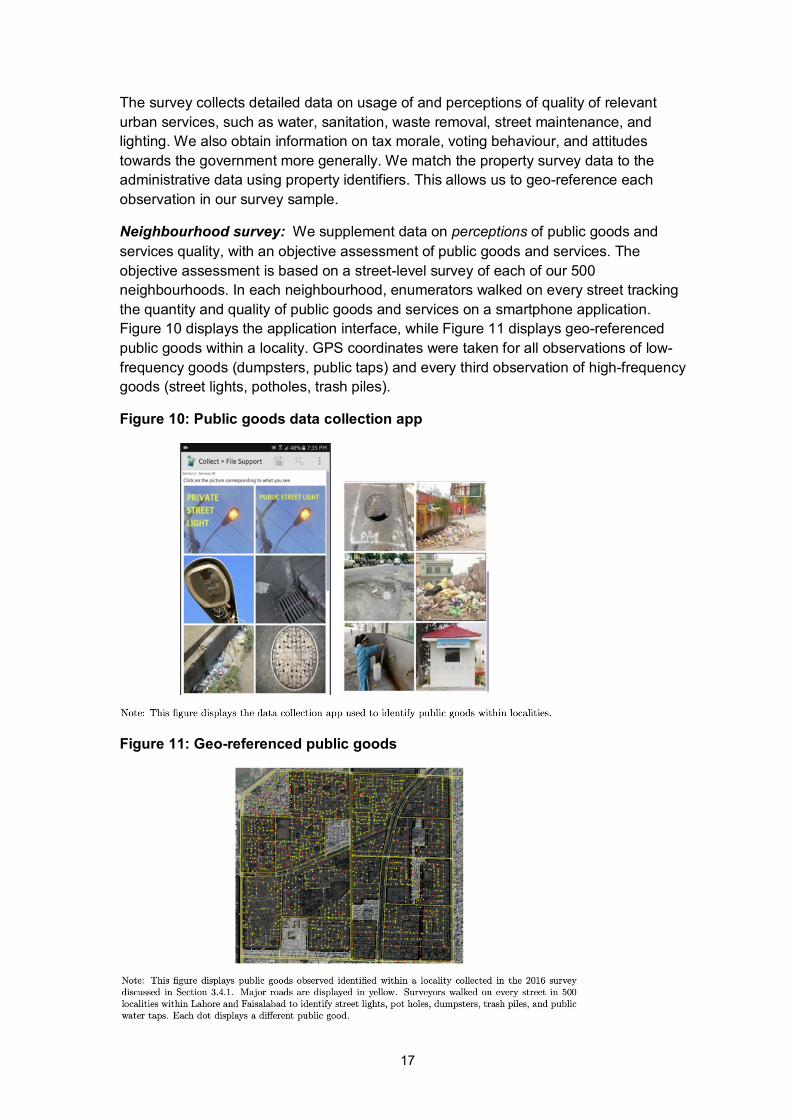
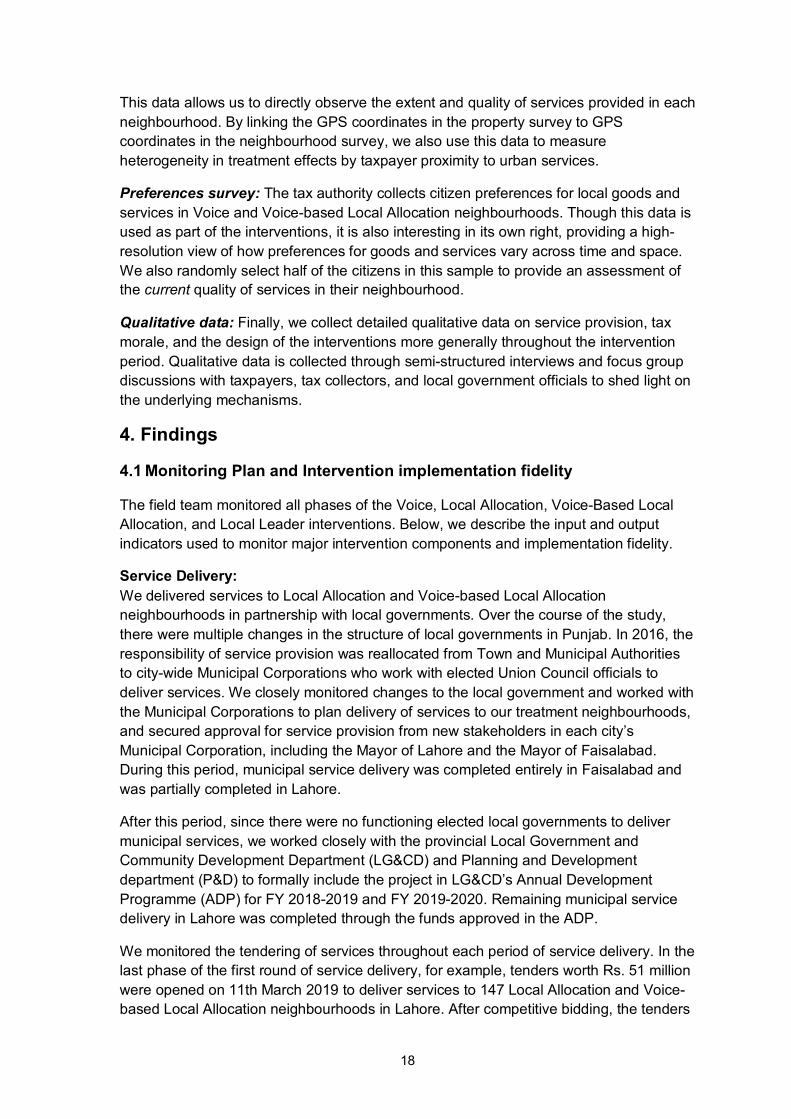
Neighbourhood survey: We supplement data on perceptions of public goods and services quality, with an objective assessment of public goods and services. The objective assessment is based on a street-level survey of each of our 500 neighbourhoods. In each neighbourhood, enumerators walked on every street tracking the quantity and quality of public goods and services on a smartphone application. Figure 10 displays the application interface, while Figure 11 displays geo-referenced public goods within a locality. GPS coordinates were taken for all observations of low-frequency goods (dumpsters, public taps) and every third observation of high-frequency goods (street lights, potholes, trash piles).
Figure 10: Public goods data collection app
Figure 11: Geo-referenced public goods
18
This data allows us to directly observe the extent and quality of services provided in each neighbourhood. By linking the GPS coordinates in the property survey to GPS coordinates in the neighbourhood survey, we also use this data to measure heterogeneity in treatment effects by taxpayer proximity to urban services.
Preferences survey: The tax authority collects citizen preferences for local goods and services in Voice and Voice-based Local Allocation neighbourhoods. Though this data is used as part of the interventions, it is also interesting in its own right, providing a high-resolution view of how preferences for goods and services vary across time and space. We also randomly select half of the citizens in this sample to provide an assessment of the current quality of services in their neighbourhood.
Qualitative data: Finally, we collect detailed qualitative data on service provision, tax morale, and the design of the interventions more generally throughout the intervention period. Qualitative data is collected through semi-structured interviews and focus group discussions with taxpayers, tax collectors, and local government officials to shed light on the underlying mechanisms.
4. Findings
4.1 Monitoring Plan and Intervention implementation fidelity
The field team monitored all phases of the Voice, Local Allocation, Voice-Based Local Allocation, and Local Leader interventions. Below, we describe the input and output indicators used to monitor major intervention components and implementation fidelity.
Service Delivery: We delivered services to Local Allocation and Voice-based Local Allocation neighbourhoods in partnership with local governments. Over the course of the study, there were multiple changes in the structure of local governments in Punjab. In 2016, the responsibility of service provision was reallocated from Town and Municipal Authorities to city-wide Municipal Corporations who work with elected Union Council officials to deliver services. We closely monitored changes to the local government and worked with the Municipal Corporations to plan delivery of services to our treatment neighbourhoods, and secured approval for service provision from new stakeholders in each city’s Municipal Corporation, including the Mayor of Lahore and the Mayor of Faisalabad. During this period, municipal service delivery was completed entirely in Faisalabad and was partially completed in Lahore.
After this period, since there were no functioning elected local governments to deliver municipal services, we worked closely with the provincial Local Government and Community Development Department (LG&CD) and Planning and Development department (P&D) to formally include the project in LG&CD’s Annual Development Programme (ADP) for FY 2018-2019 and FY 2019-2020. Remaining municipal service delivery in Lahore was completed through the funds approved in the ADP.
We monitored the tendering of services throughout each period of service delivery. In the last phase of the first round of service delivery, for example, tenders worth Rs. 51 million were opened on 11th March 2019 to deliver services to 147 Local Allocation and Voice-based Local Allocation neighbourhoods in Lahore. After competitive bidding, the tenders
19
were awarded to the lowest bidder. The contractor provided the services of carpeting of roads, repair of potholes, and the installation and repair of streetlights. The project team worked in collaboration with the contractor and sub-engineers from Local LG&CD to ensure that the services were delivered within neighbourhood boundaries.
We also verified service delivery by conducting independent audits in each Local Allocation and Voice-based Local Allocation neighbourhood. The field team recorded the quantity, quality and location of delivered services. In addition, the field team took a representative picture of the service. A sample of these pictures are provided in the Appendix.
We find that services were delivered successfully in approximately 230 out of the 250 Local Allocation and Voice-based Local Allocation. A handful of neighbourhoods in Faisalabad did not receive services in time due to contracting issues; we plan to provide these services as we implement the second round of service delivery. In addition, some neighbourhoods did not receive services because the neighbourhood was partially or entirely located in a private housing society where the municipal government did not provide services. We are verifying that this was indeed the case. All in all, our audits show that Local Allocation and Voice-based Local Allocation neighbourhoods did in fact receive services according to intervention status. The changes in local government structure therefore did not prevent service delivery, but did create unanticipated delays. These delays may have diluted the salience of the interventions; we discuss this in detail in Section 4.
Preference Elicitation Tax Inspectors from 102 Circles across Lahore and Faisalabad were trained to conduct the Preference Elicitation Survey in sample neighbourhoods across approximately 60,000 properties. Our team developed and piloted the questionnaire on SurveyCTO, which is an ODK-based application. Our team also assisted Tax Inspectors with logistics and conducted regular oversight to ensure survey quality and credibility. This oversight included field checks to verify properties were visited in the field, as well as monitoring of GPS and audio data recorded by SurveyCTO.
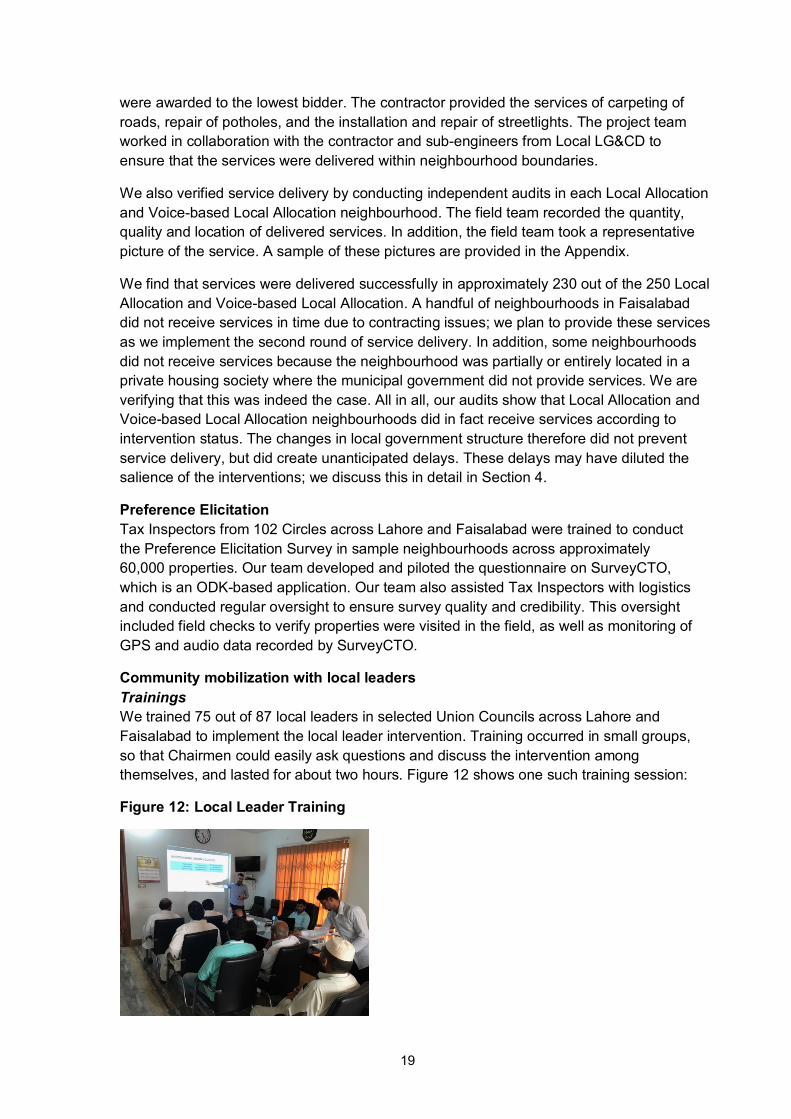
Community mobilization with local leaders Trainings We trained 75 out of 87 local leaders in selected Union Councils across Lahore and Faisalabad to implement the local leader intervention. Training occurred in small groups, so that Chairmen could easily ask questions and discuss the intervention among themselves, and lasted for about two hours. Figure 12 shows one such training session:
Figure 12: Local Leader Training
20
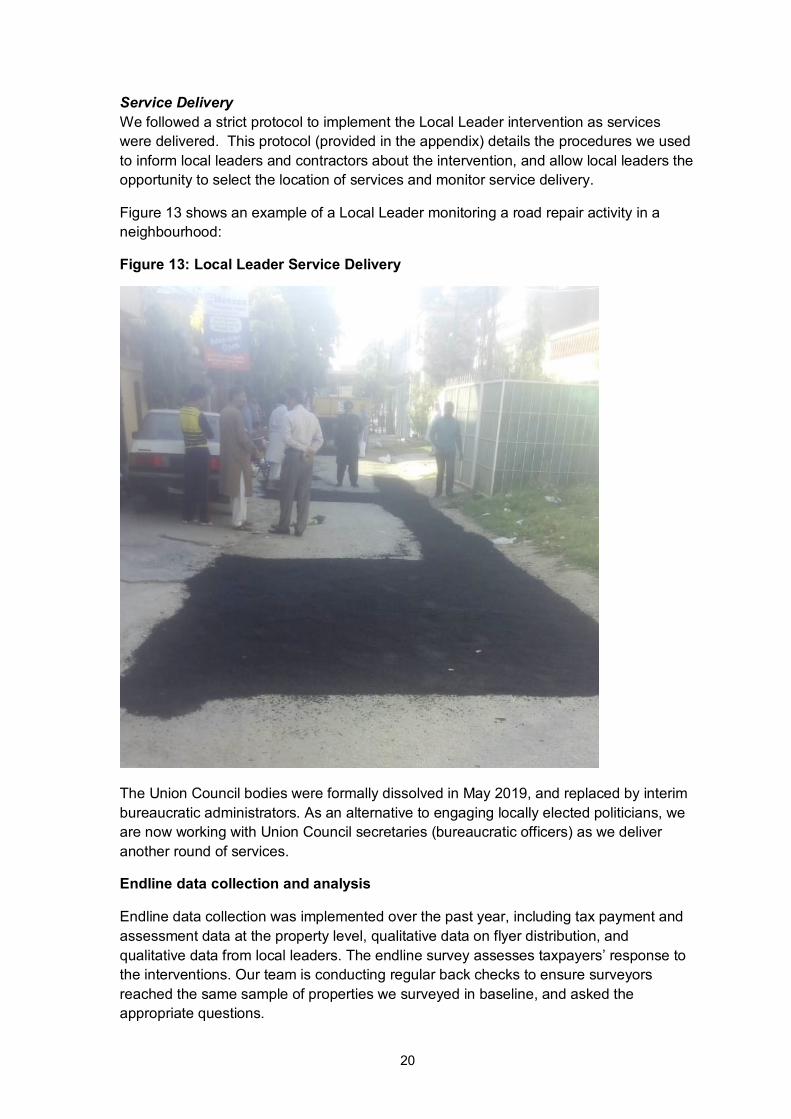
Service Delivery We followed a strict protocol to implement the Local Leader intervention as services were delivered. This protocol (provided in the appendix) details the procedures we used to inform local leaders and contractors about the intervention, and allow local leaders the opportunity to select the location of services and monitor service delivery.
Figure 13 shows an example of a Local Leader monitoring a road repair activity in a neighbourhood:
Figure 13: Local Leader Service Delivery
The Union Council bodies were formally dissolved in May 2019, and replaced by interim bureaucratic administrators. As an alternative to engaging locally elected politicians, we are now working with Union Council secretaries (bureaucratic officers) as we deliver another round of services.
Endline data collection and analysis
Endline data collection was implemented over the past year, including tax payment and assessment data at the property level, qualitative data on flyer distribution, and qualitative data from local leaders. The endline survey assesses taxpayers’ response to the interventions. Our team is conducting regular back checks to ensure surveyors reached the same sample of properties we surveyed in baseline, and asked the appropriate questions.
21
4.2 Impact analysis
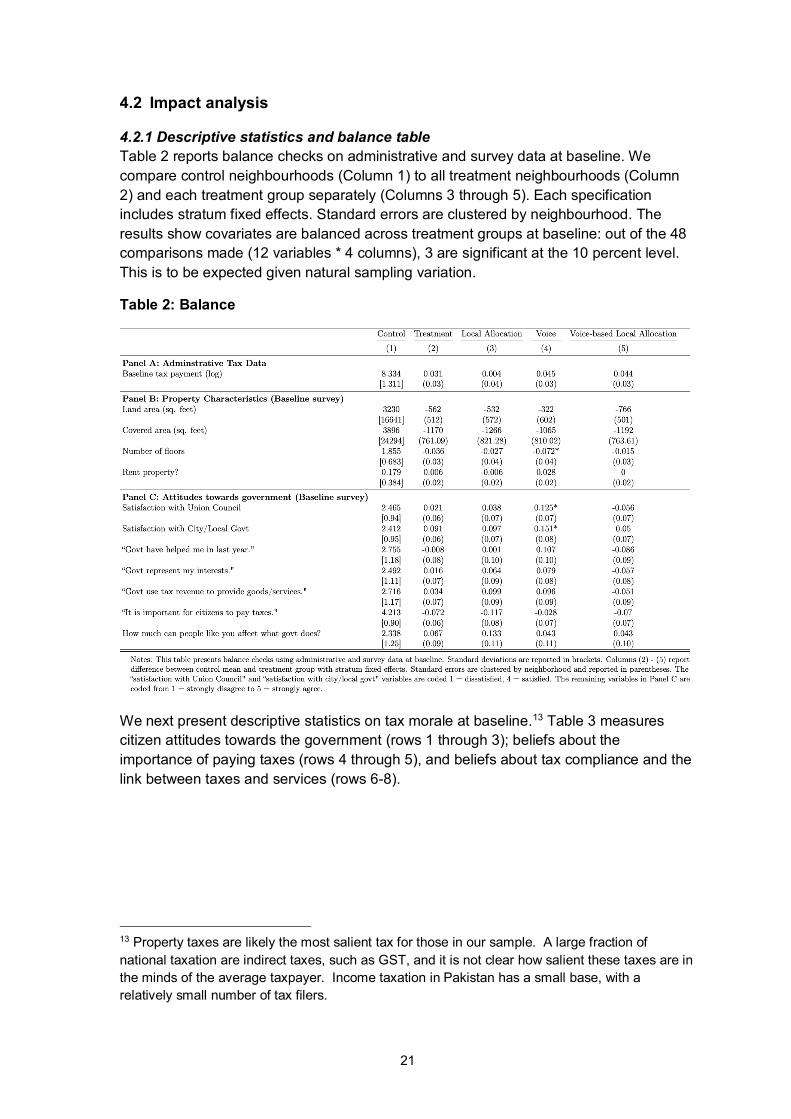
4.2.1 Descriptive statistics and balance table Table 2 reports balance checks on administrative and survey data at baseline. We compare control neighbourhoods (Column 1) to all treatment neighbourhoods (Column 2) and each treatment group separately (Columns 3 through 5). Each specification includes stratum fixed effects. Standard errors are clustered by neighbourhood. The results show covariates are balanced across treatment groups at baseline: out of the 48 comparisons made (12 variables * 4 columns), 3 are significant at the 10 percent level. This is to be expected given natural sampling variation.
Table 2: Balance
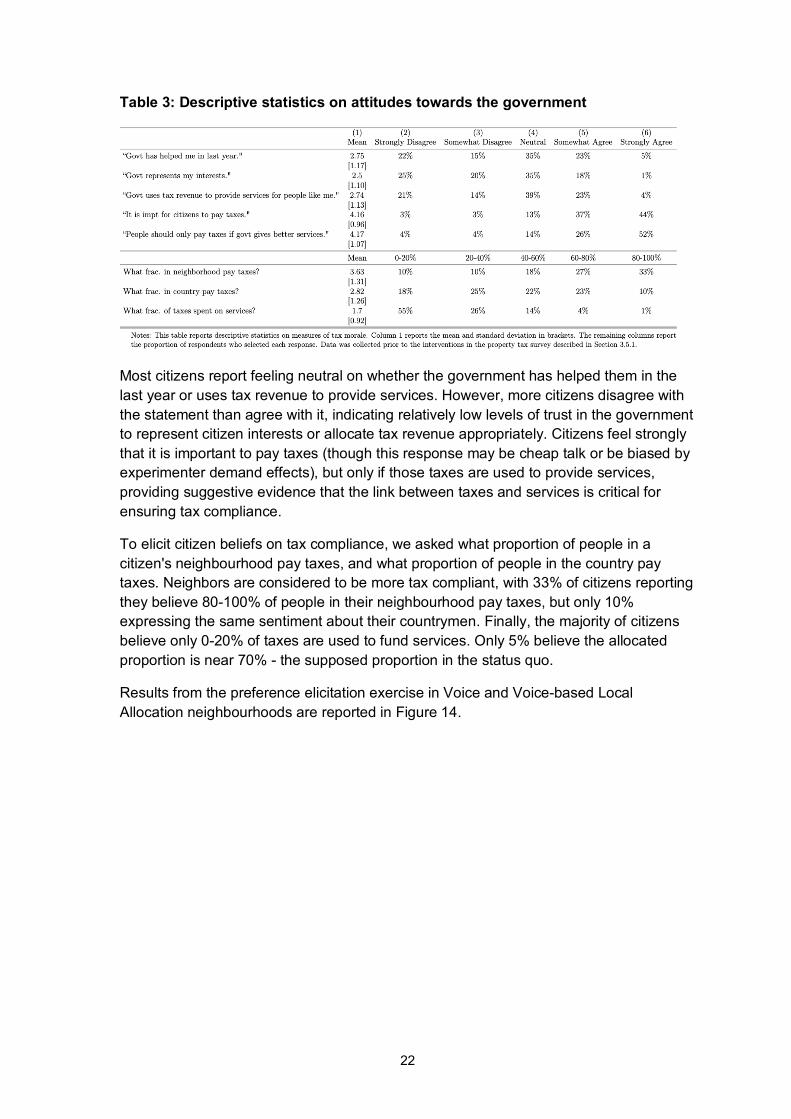
We next present descriptive statistics on tax morale at baseline.13 Table 3 measures citizen attitudes towards the government (rows 1 through 3); beliefs about the importance of paying taxes (rows 4 through 5), and beliefs about tax compliance and the link between taxes and services (rows 6-8).
13 Property taxes are likely the most salient tax for those in our sample. A large fraction of national taxation are indirect taxes, such as GST, and it is not clear how salient these taxes are in the minds of the average taxpayer. Income taxation in Pakistan has a small base, with a relatively small number of tax filers.
22
Table 3: Descriptive statistics on attitudes towards the government
Most citizens report feeling neutral on whether the government has helped them in the last year or uses tax revenue to provide services. However, more citizens disagree with the statement than agree with it, indicating relatively low levels of trust in the government to represent citizen interests or allocate tax revenue appropriately. Citizens feel strongly that it is important to pay taxes (though this response may be cheap talk or be biased by experimenter demand effects), but only if those taxes are used to provide services, providing suggestive evidence that the link between taxes and services is critical for ensuring tax compliance.
To elicit citizen beliefs on tax compliance, we asked what proportion of people in a citizen's neighbourhood pay taxes, and what proportion of people in the country pay taxes. Neighbors are considered to be more tax compliant, with 33% of citizens reporting they believe 80-100% of people in their neighbourhood pay taxes, but only 10% expressing the same sentiment about their countrymen. Finally, the majority of citizens believe only 0-20% of taxes are used to fund services. Only 5% believe the allocated proportion is near 70% - the supposed proportion in the status quo.
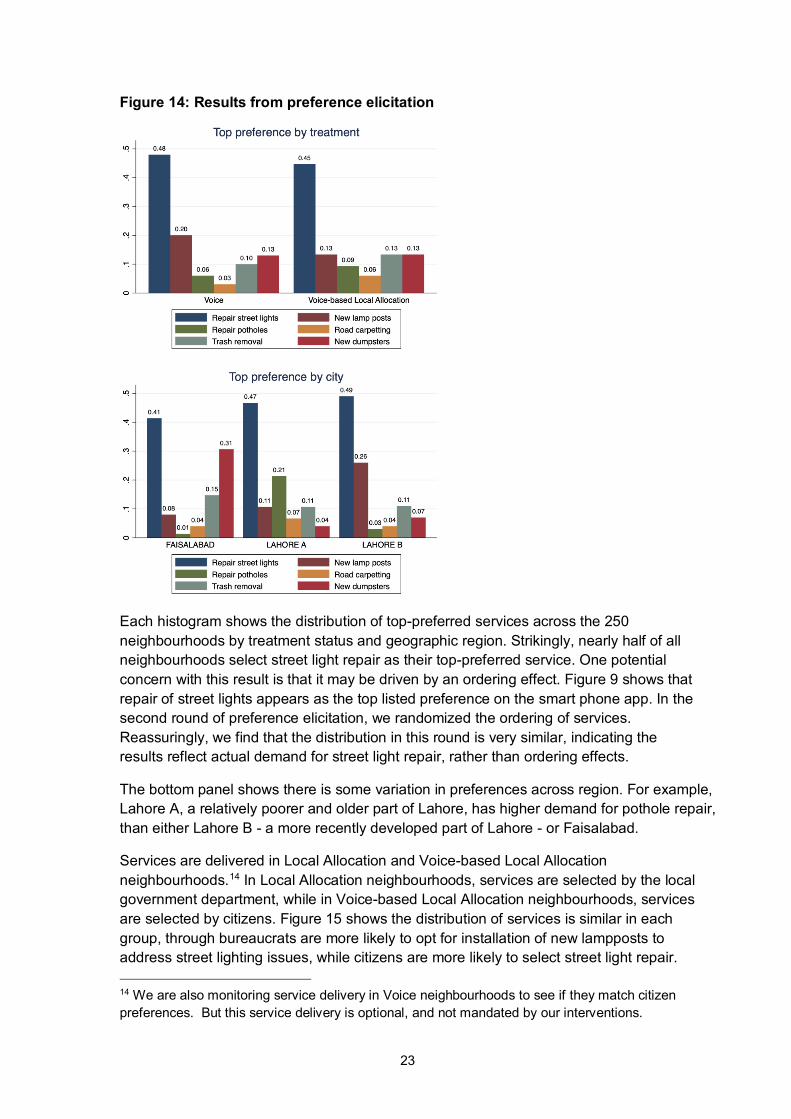
Results from the preference elicitation exercise in Voice and Voice-based Local Allocation neighbourhoods are reported in Figure 14.
23
Figure 14: Results from preference elicitation
Each histogram shows the distribution of top-preferred services across the 250 neighbourhoods by treatment status and geographic region. Strikingly, nearly half of all neighbourhoods select street light repair as their top-preferred service. One potential concern with this result is that it may be driven by an ordering effect. Figure 9 shows that repair of street lights appears as the top listed preference on the smart phone app. In the second round of preference elicitation, we randomized the ordering of services. Reassuringly, we find that the distribution in this round is very similar, indicating the results reflect actual demand for street light repair, rather than ordering effects.
The bottom panel shows there is some variation in preferences across region. For example, Lahore A, a relatively poorer and older part of Lahore, has higher demand for pothole repair, than either Lahore B - a more recently developed part of Lahore - or Faisalabad.
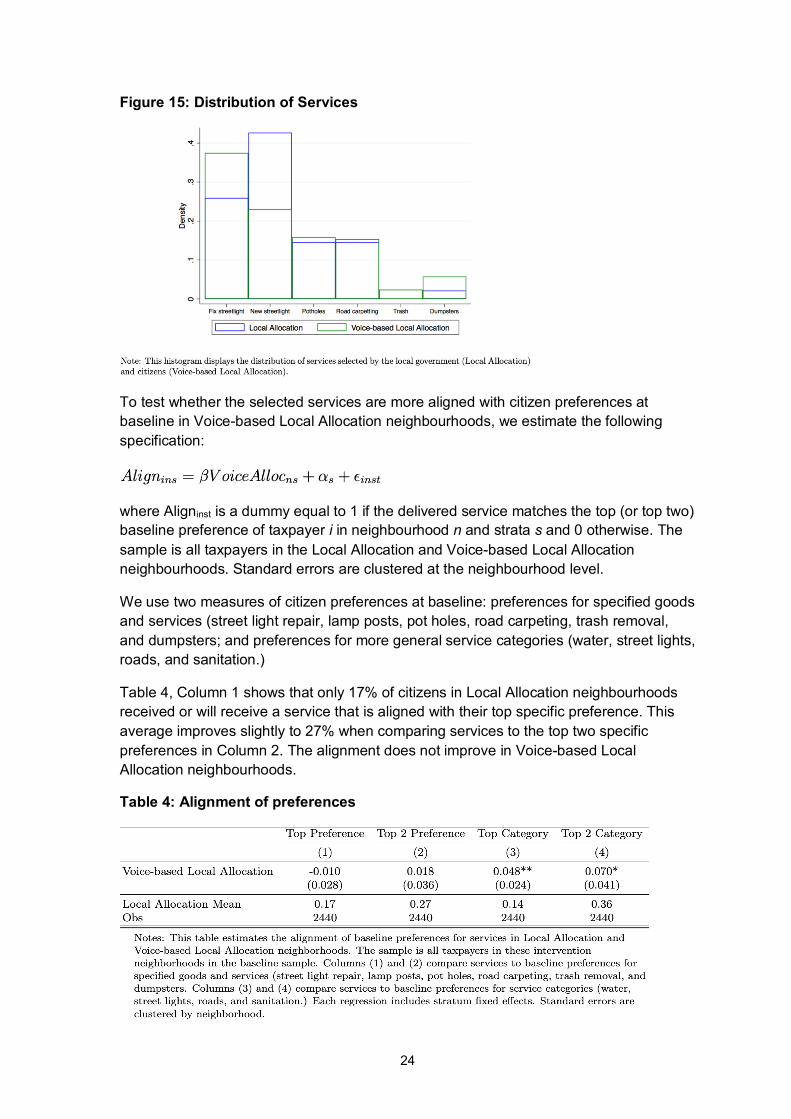
Services are delivered in Local Allocation and Voice-based Local Allocation neighbourhoods.14 In Local Allocation neighbourhoods, services are selected by the local government department, while in Voice-based Local Allocation neighbourhoods, services are selected by citizens. Figure 15 shows the distribution of services is similar in each group, through bureaucrats are more likely to opt for installation of new lampposts to address street lighting issues, while citizens are more likely to select street light repair. 14 We are also monitoring service delivery in Voice neighbourhoods to see if they match citizen preferences. But this service delivery is optional, and not mandated by our interventions.
24
Figure 15: Distribution of Services
To test whether the selected services are more aligned with citizen preferences at baseline in Voice-based Local Allocation neighbourhoods, we estimate the following specification:
where Aligninst is a dummy equal to 1 if the delivered service matches the top (or top two) baseline preference of taxpayer i in neighbourhood n and strata s and 0 otherwise. The sample is all taxpayers in the Local Allocation and Voice-based Local Allocation neighbourhoods. Standard errors are clustered at the neighbourhood level.
We use two measures of citizen preferences at baseline: preferences for specified goods and services (street light repair, lamp posts, pot holes, road carpeting, trash removal, and dumpsters; and preferences for more general service categories (water, street lights, roads, and sanitation.)
Table 4, Column 1 shows that only 17% of citizens in Local Allocation neighbourhoods received or will receive a service that is aligned with their top specific preference. This average improves slightly to 27% when comparing services to the top two specific preferences in Column 2. The alignment does not improve in Voice-based Local Allocation neighbourhoods.
Table 4: Alignment of preferences
25
In Columns 3 and 4, we match services to baseline preferences for general service categories. Here, the alignment of services and preferences is 4.8 percentage points higher in Voice-based Local Allocation neighbourhoods (34% increase.15 This estimate is significant at the 5% level. The differential effect is larger when assessing the alignment of services to the top two general service categories: citizens in Voice-based Local Allocation neighbourhoods are 7 percentage points more likely to receive services aligned with their preferences. We note, however, that the estimated effects for service alignment with the top preferred service category at baseline (Column (3)) and service alignment with the top two preferred service categories at baseline (Column (4)) are not statistically different.
This analysis confirms that alignment between baseline preferences and services is significantly higher in Voice-based Local Allocation neighbourhoods than Local Allocation neighbourhoods. Still, it is surprising that the average is not higher. One possible explanation is that preferences for service provision are not stable, and citizens reported different rankings in the baseline and preference survey. Another possible explanation is differences in the method of preference elicitation. In the baseline survey, we asked citizens to provide a full ranking of seven possible services. In the preference survey, we asked surveys to select their top two preferred services out of seven. It is possible that citizens changed their ranking because of these different prompts.
4.2.2 Research analyses This section presents first year impacts of the interventions. The empirical analysis - including specifications, samples, primary outcomes, and selection of controls - follows a pre-analysis plan uploaded on the AEA RCT registry.16
Treatment effect on taxpayer knowledge and government action We start by examining treatment effects on taxpayer knowledge of the scheme. All specification using survey data use a set of property controls: gender, age category, household size, household income per capita, attitudes towards the government, rental/owner status, property covered area, property use, number of floors, location on main road, and self-reported property worth.17 Where possible, we used the baseline value of the outcome variable as an additional control. In these specifications, we include dummy variables for missing baseline values. In the future, we will use a double-LASSO procedure a la Chernozhukov et al. to refine the control variables.
Table 5 shows taxpayers in intervention areas are 3.4% more likely to report they are in a government scheme (Columns (1) and (2)), and 1.2% more likely to report receiving an information flyer about a scheme (Columns (5) and (6)). These effects are statistically significant. This result holds in all treatment groups, though the treatment effect on taxpayer knowledge in Voice neighbourhoods is insignificant. 15 Note that the local allocation mean is slightly lower (14% vs 17%). This is because the general service categories contain water, which was not offered as a specific service in the interventions. 16 The link for the AEA RCT registry is available here: http://www.socialscienceregistry.org/trials/3270/history/33596. 17 The endline survey is designed to reach all of the approximately 5000 respondents in the baseline sample. We have contacted all properties in the sample, but because sometimes the resident could not be located, we have scheduled follow up appointments to complete the survey. These follow ups are ongoing.
26
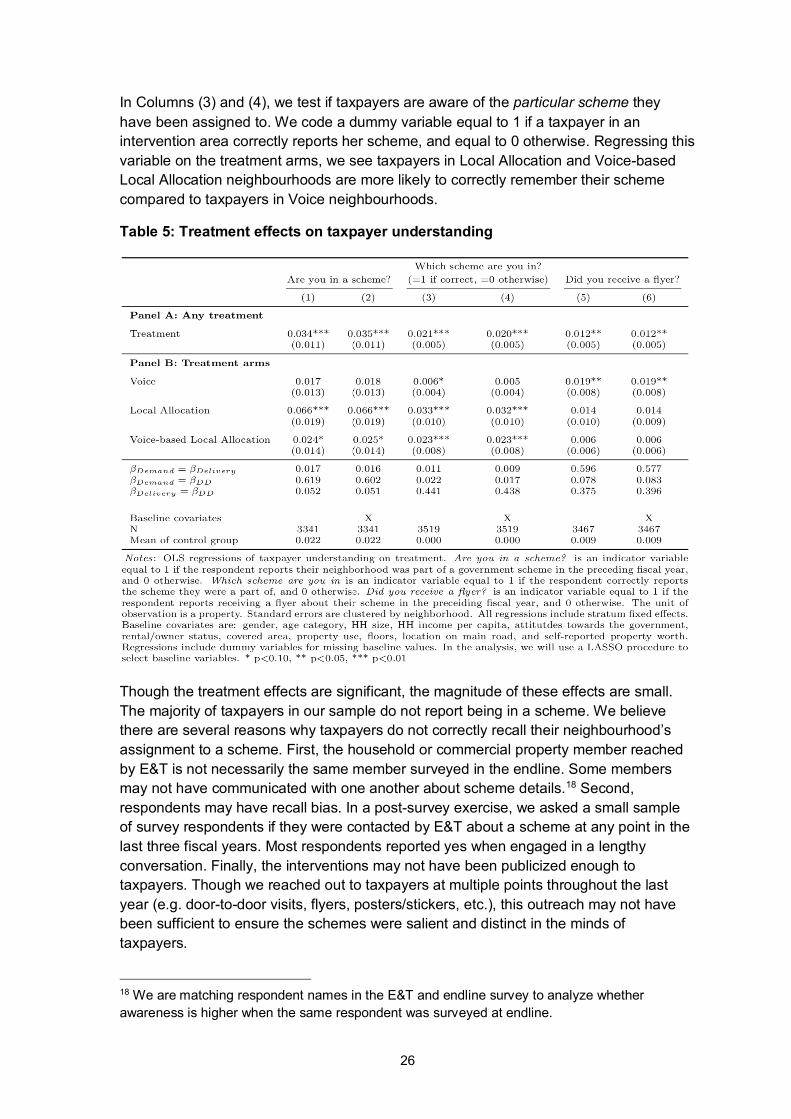
In Columns (3) and (4), we test if taxpayers are aware of the particular scheme they have been assigned to. We code a dummy variable equal to 1 if a taxpayer in an intervention area correctly reports her scheme, and equal to 0 otherwise. Regressing this variable on the treatment arms, we see taxpayers in Local Allocation and Voice-based Local Allocation neighbourhoods are more likely to correctly remember their scheme compared to taxpayers in Voice neighbourhoods.
Table 5: Treatment effects on taxpayer understanding
Though the treatment effects are significant, the magnitude of these effects are small. The majority of taxpayers in our sample do not report being in a scheme. We believe there are several reasons why taxpayers do not correctly recall their neighbourhood’s assignment to a scheme. First, the household or commercial property member reached by E&T is not necessarily the same member surveyed in the endline. Some members may not have communicated with one another about scheme details.18 Second, respondents may have recall bias. In a post-survey exercise, we asked a small sample of survey respondents if they were contacted by E&T about a scheme at any point in the last three fiscal years. Most respondents reported yes when engaged in a lengthy conversation. Finally, the interventions may not have been publicized enough to taxpayers. Though we reached out to taxpayers at multiple points throughout the last year (e.g. door-to-door visits, flyers, posters/stickers, etc.), this outreach may not have been sufficient to ensure the schemes were salient and distinct in the minds of taxpayers.
18 We are matching respondent names in the E&T and endline survey to analyze whether awareness is higher when the same respondent was surveyed at endline.
27
We plan to address all of these issues as we deliver another round of services. To encourage intra-household discussions of the interventions, we will ask taxpayers to talk about the scheme with other members of their household or establishment. We also plan to send text messages to the intervention sample, reminding them about the scheme and informing them about previously delivered services. This sample will include those contacted by E&T, and those surveyed in baseline and endline. This outreach will ensure that multiple members of a property are informed about the scheme.
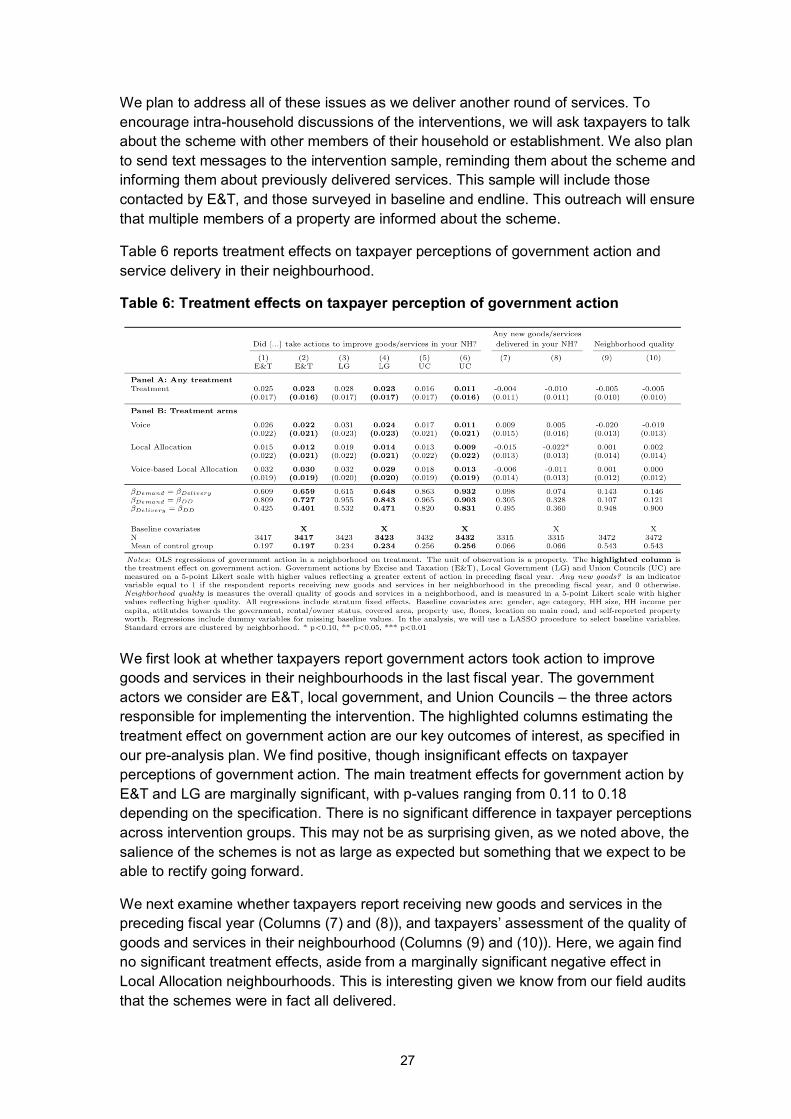
Table 6 reports treatment effects on taxpayer perceptions of government action and service delivery in their neighbourhood.
Table 6: Treatment effects on taxpayer perception of government action
We first look at whether taxpayers report government actors took action to improve goods and services in their neighbourhoods in the last fiscal year. The government actors we consider are E&T, local government, and Union Councils – the three actors responsible for implementing the intervention. The highlighted columns estimating the treatment effect on government action are our key outcomes of interest, as specified in our pre-analysis plan. We find positive, though insignificant effects on taxpayer perceptions of government action. The main treatment effects for government action by E&T and LG are marginally significant, with p-values ranging from 0.11 to 0.18 depending on the specification. There is no significant difference in taxpayer perceptions across intervention groups. This may not be as surprising given, as we noted above, the salience of the schemes is not as large as expected but something that we expect to be able to rectify going forward.
We next examine whether taxpayers report receiving new goods and services in the preceding fiscal year (Columns (7) and (8)), and taxpayers’ assessment of the quality of goods and services in their neighbourhood (Columns (9) and (10)). Here, we again find no significant treatment effects, aside from a marginally significant negative effect in Local Allocation neighbourhoods. This is interesting given we know from our field audits that the schemes were in fact all delivered.
28
These results are therefore consistent with our previous interpretation that the interventions are not being publicized enough to taxpayers. Though services were delivered in Local Allocation and Voice-based Local Allocation neighbourhoods, these services may not have been salient enough for taxpayers to have noticed on their own. Given these results, moving forward, we plan to publicize service delivery much more intensely via text messages and door-to-door outreach so that taxpayers are aware of new services in their neighbourhoods delivered via the interventions.
Treatment effect on tax payments We examine first year impacts of the interventions using administrative property tax data in FY2016-2017 and FY2017-2018. While we have obtained tax payment data for FY2018-2019, we are still in the process of cleaning it for analysis with our government partners. Data includes tax payments and assessments for each month of the study and for all taxpayers in the sample.
The tax payment data is total payments, which include current year tax payments and payments for arrears. We anticipate obtaining data separating current year payments and arrears; when we do so, we will conduct the analysis for current year payments and arrears separately. The current year tax payments are primary outcomes.
All specifications use a set of property controls: the log of government assessed property worth, log of total covered area, whether the taxpayer defaulted on payments in the baseline year (FY2015-2016), whether the property is located on a main street, whether the property is rented or owned, the tax valuation category, and whether the property is residential or commercial. In the future, we may use a double-LASSO procedure a la Chernozhukov et al. to refine the control variables.
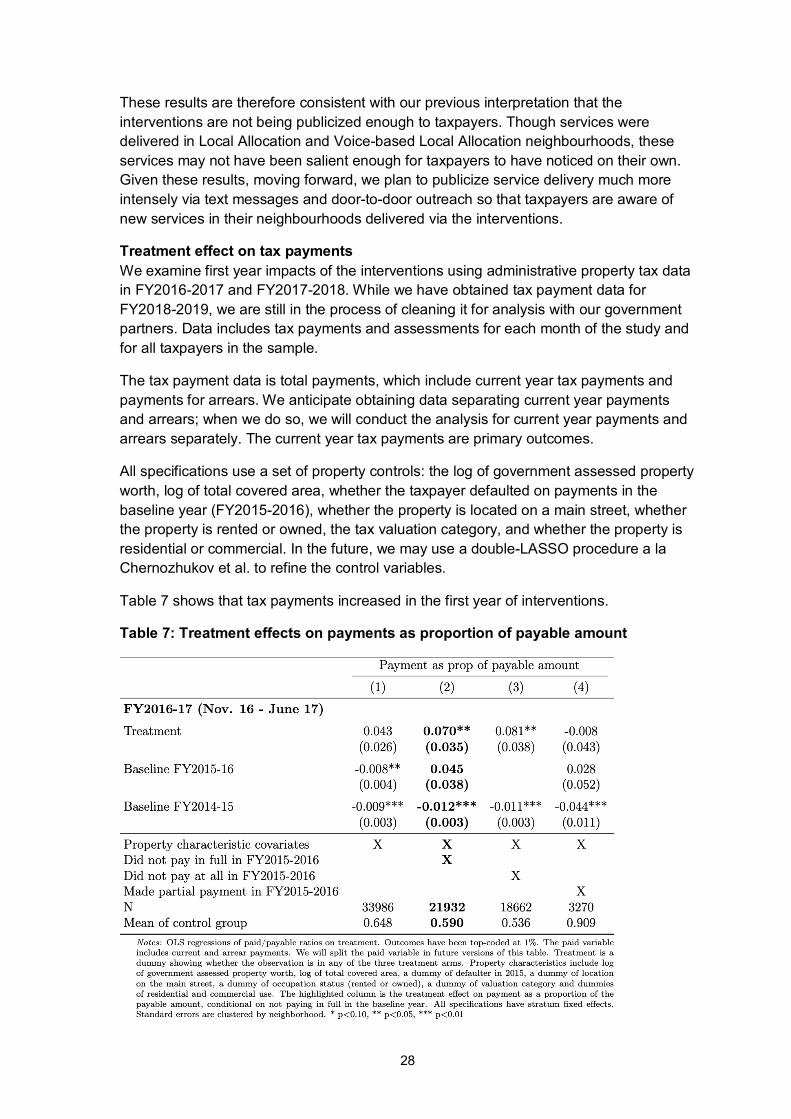
Table 7 shows that tax payments increased in the first year of interventions.
Table 7: Treatment effects on payments as proportion of payable amount
29
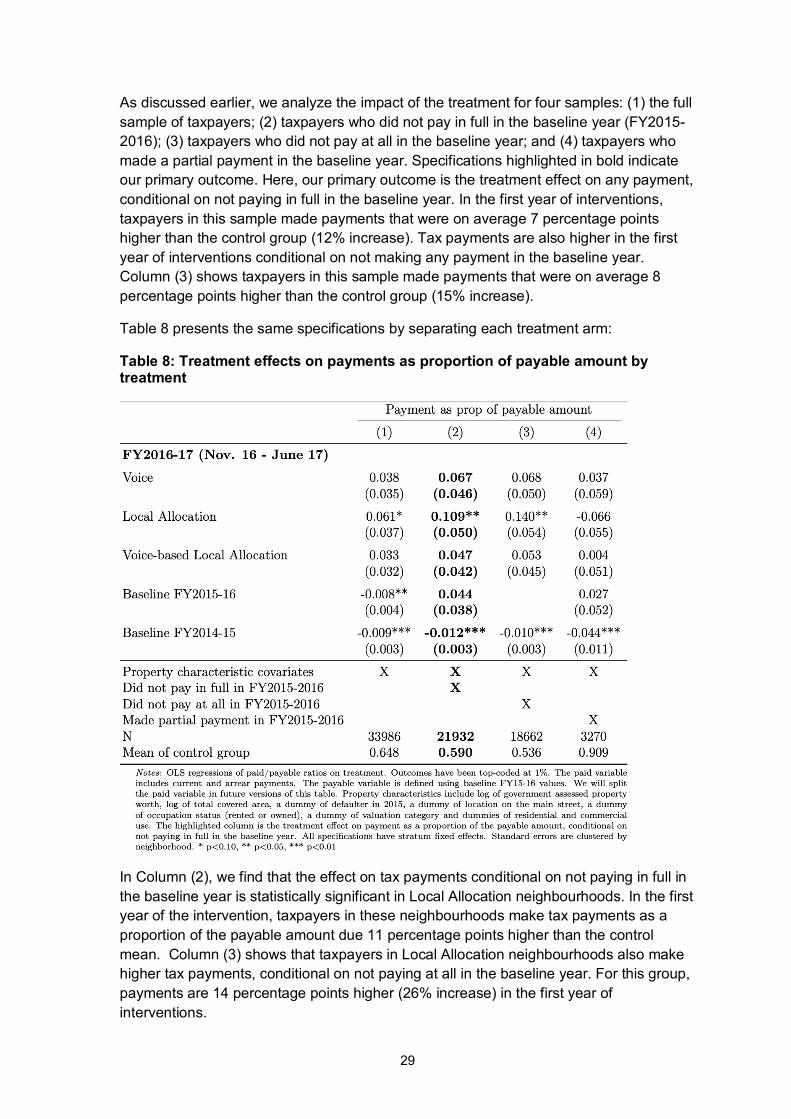
As discussed earlier, we analyze the impact of the treatment for four samples: (1) the full sample of taxpayers; (2) taxpayers who did not pay in full in the baseline year (FY2015-2016); (3) taxpayers who did not pay at all in the baseline year; and (4) taxpayers who made a partial payment in the baseline year. Specifications highlighted in bold indicate our primary outcome. Here, our primary outcome is the treatment effect on any payment, conditional on not paying in full in the baseline year. In the first year of interventions, taxpayers in this sample made payments that were on average 7 percentage points higher than the control group (12% increase). Tax payments are also higher in the first year of interventions conditional on not making any payment in the baseline year. Column (3) shows taxpayers in this sample made payments that were on average 8 percentage points higher than the control group (15% increase).
Table 8 presents the same specifications by separating each treatment arm:
Table 8: Treatment effects on payments as proportion of payable amount by treatment
In Column (2), we find that the effect on tax payments conditional on not paying in full in the baseline year is statistically significant in Local Allocation neighbourhoods. In the first year of the intervention, taxpayers in these neighbourhoods make tax payments as a proportion of the payable amount due 11 percentage points higher than the control mean. Column (3) shows that taxpayers in Local Allocation neighbourhoods also make higher tax payments, conditional on not paying at all in the baseline year. For this group, payments are 14 percentage points higher (26% increase) in the first year of interventions.
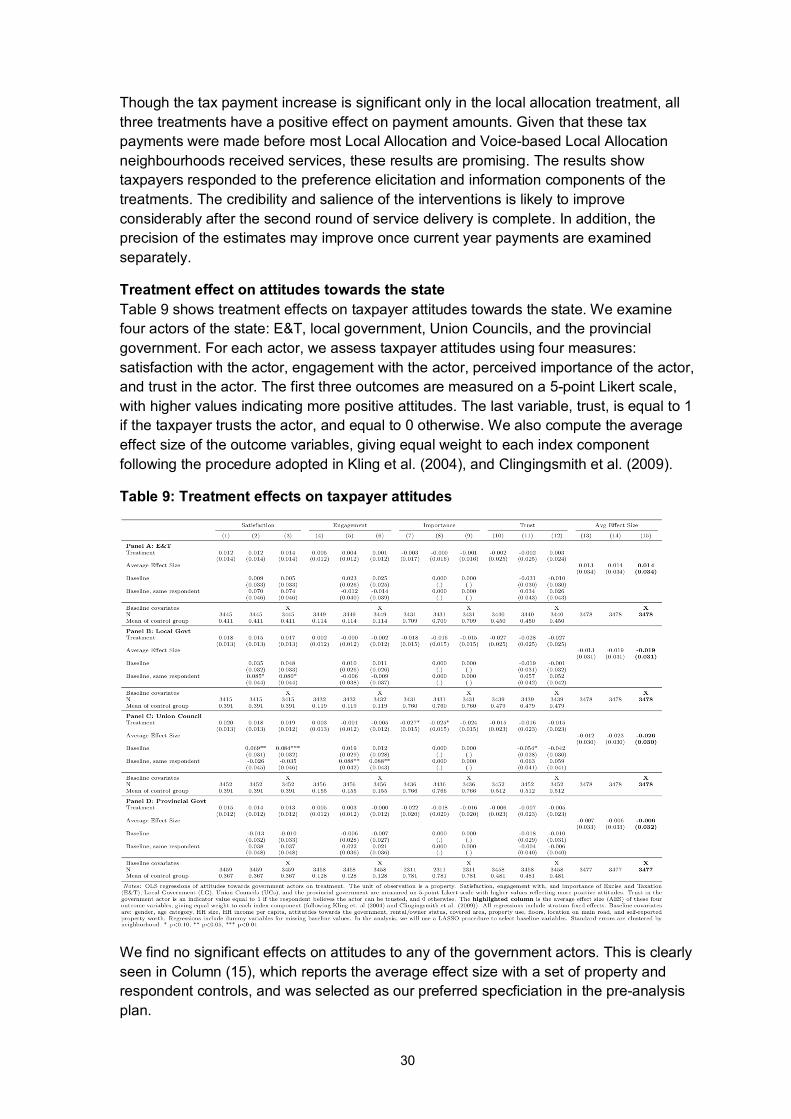
30
Though the tax payment increase is significant only in the local allocation treatment, all three treatments have a positive effect on payment amounts. Given that these tax payments were made before most Local Allocation and Voice-based Local Allocation neighbourhoods received services, these results are promising. The results show taxpayers responded to the preference elicitation and information components of the treatments. The credibility and salience of the interventions is likely to improve considerably after the second round of service delivery is complete. In addition, the precision of the estimates may improve once current year payments are examined separately.
Treatment effect on attitudes towards the state Table 9 shows treatment effects on taxpayer attitudes towards the state. We examine four actors of the state: E&T, local government, Union Councils, and the provincial government. For each actor, we assess taxpayer attitudes using four measures: satisfaction with the actor, engagement with the actor, perceived importance of the actor, and trust in the actor. The first three outcomes are measured on a 5-point Likert scale, with higher values indicating more positive attitudes. The last variable, trust, is equal to 1 if the taxpayer trusts the actor, and equal to 0 otherwise. We also compute the average effect size of the outcome variables, giving equal weight to each index component following the procedure adopted in Kling et al. (2004), and Clingingsmith et al. (2009).
Table 9: Treatment effects on taxpayer attitudes
We find no significant effects on attitudes to any of the government actors. This is clearly seen in Column (15), which reports the average effect size with a set of property and respondent controls, and was selected as our preferred specficiation in the pre-analysis plan.
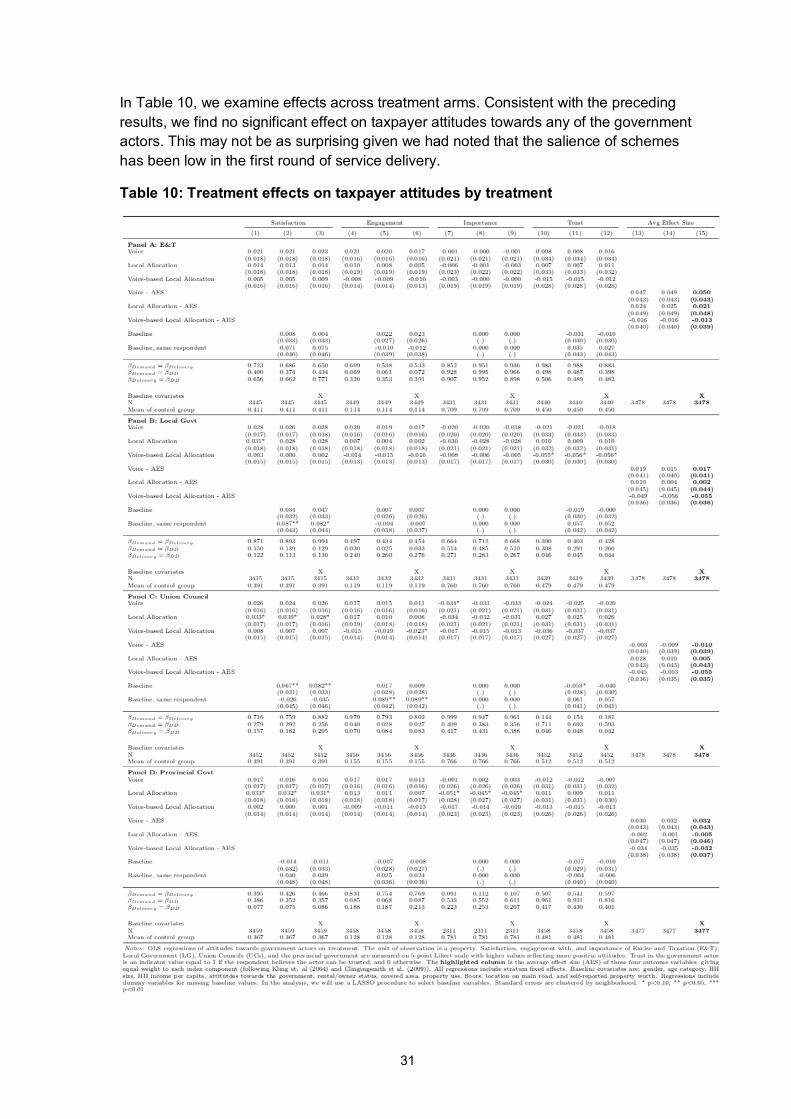
31
In Table 10, we examine effects across treatment arms. Consistent with the preceding results, we find no significant effect on taxpayer attitudes towards any of the government actors. This may not be as surprising given we had noted that the salience of schemes has been low in the first round of service delivery.
Table 10: Treatment effects on taxpayer attitudes by treatment
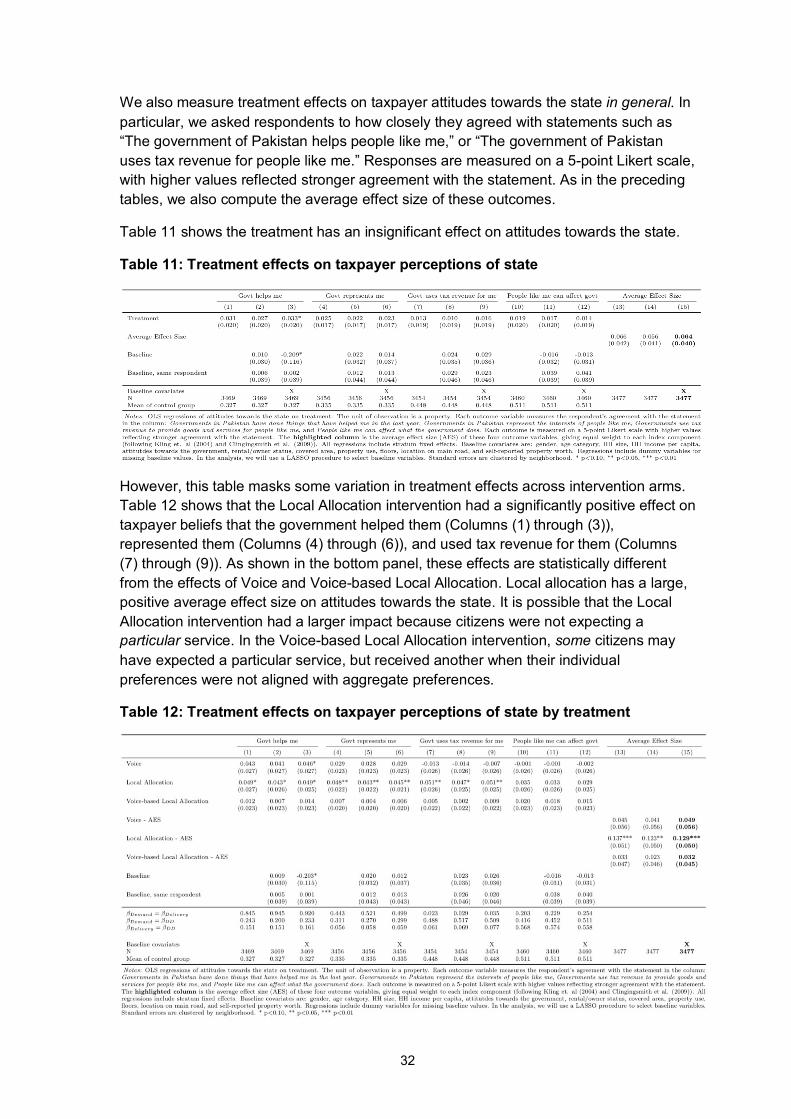
32
We also measure treatment effects on taxpayer attitudes towards the state in general. In particular, we asked respondents to how closely they agreed with statements such as “The government of Pakistan helps people like me,” or “The government of Pakistan uses tax revenue for people like me.” Responses are measured on a 5-point Likert scale, with higher values reflected stronger agreement with the statement. As in the preceding tables, we also compute the average effect size of these outcomes.
Table 11 shows the treatment has an insignificant effect on attitudes towards the state.
Table 11: Treatment effects on taxpayer perceptions of state
However, this table masks some variation in treatment effects across intervention arms. Table 12 shows that the Local Allocation intervention had a significantly positive effect on taxpayer beliefs that the government helped them (Columns (1) through (3)), represented them (Columns (4) through (6)), and used tax revenue for them (Columns (7) through (9)). As shown in the bottom panel, these effects are statistically different from the effects of Voice and Voice-based Local Allocation. Local allocation has a large, positive average effect size on attitudes towards the state. It is possible that the Local Allocation intervention had a larger impact because citizens were not expecting a particular service. In the Voice-based Local Allocation intervention, some citizens may have expected a particular service, but received another when their individual preferences were not aligned with aggregate preferences.
Table 12: Treatment effects on taxpayer perceptions of state by treatment
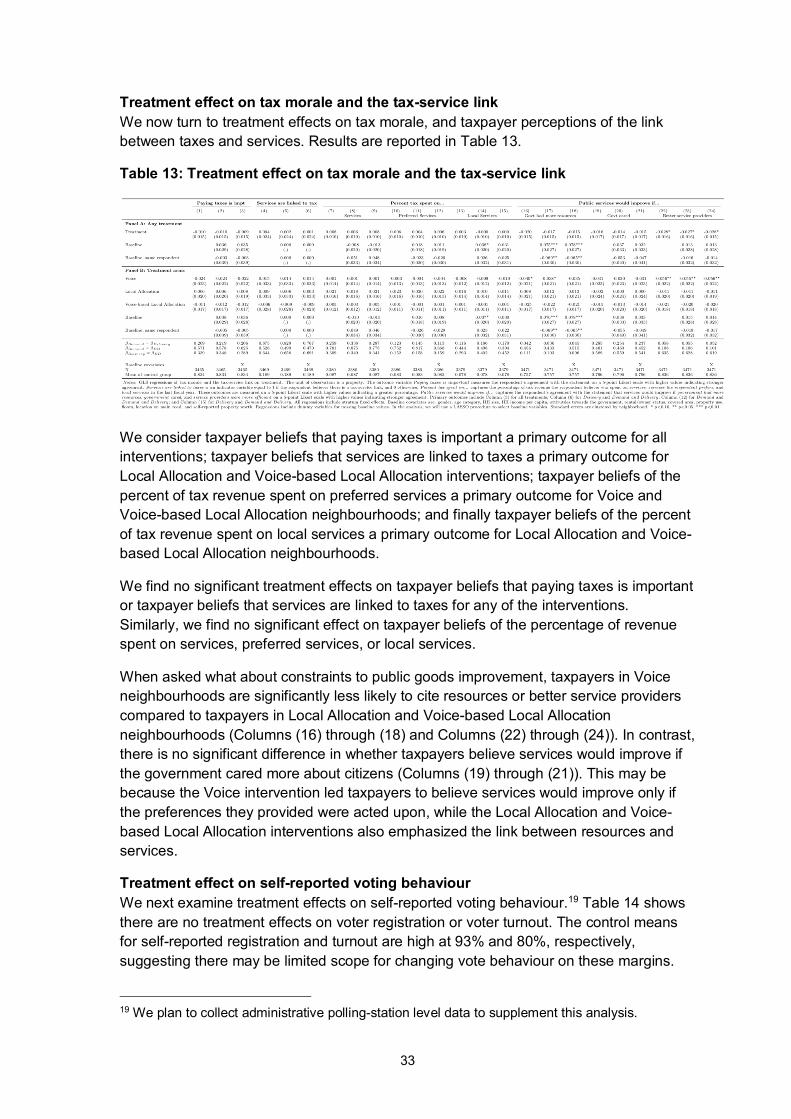
33
Treatment effect on tax morale and the tax-service link We now turn to treatment effects on tax morale, and taxpayer perceptions of the link between taxes and services. Results are reported in Table 13.
Table 13: Treatment effect on tax morale and the tax-service link
We consider taxpayer beliefs that paying taxes is important a primary outcome for all interventions; taxpayer beliefs that services are linked to taxes a primary outcome for Local Allocation and Voice-based Local Allocation interventions; taxpayer beliefs of the percent of tax revenue spent on preferred services a primary outcome for Voice and Voice-based Local Allocation neighbourhoods; and finally taxpayer beliefs of the percent of tax revenue spent on local services a primary outcome for Local Allocation and Voice-based Local Allocation neighbourhoods.
We find no significant treatment effects on taxpayer beliefs that paying taxes is important or taxpayer beliefs that services are linked to taxes for any of the interventions. Similarly, we find no significant effect on taxpayer beliefs of the percentage of revenue spent on services, preferred services, or local services.
When asked what about constraints to public goods improvement, taxpayers in Voice neighbourhoods are significantly less likely to cite resources or better service providers compared to taxpayers in Local Allocation and Voice-based Local Allocation neighbourhoods (Columns (16) through (18) and Columns (22) through (24)). In contrast, there is no significant difference in whether taxpayers believe services would improve if the government cared more about citizens (Columns (19) through (21)). This may be because the Voice intervention led taxpayers to believe services would improve only if the preferences they provided were acted upon, while the Local Allocation and Voice-based Local Allocation interventions also emphasized the link between resources and services.
Treatment effect on self-reported voting behaviour We next examine treatment effects on self-reported voting behaviour.19 Table 14 shows there are no treatment effects on voter registration or voter turnout. The control means for self-reported registration and turnout are high at 93% and 80%, respectively, suggesting there may be limited scope for changing vote behaviour on these margins.
19 We plan to collect administrative polling-station level data to supplement this analysis.
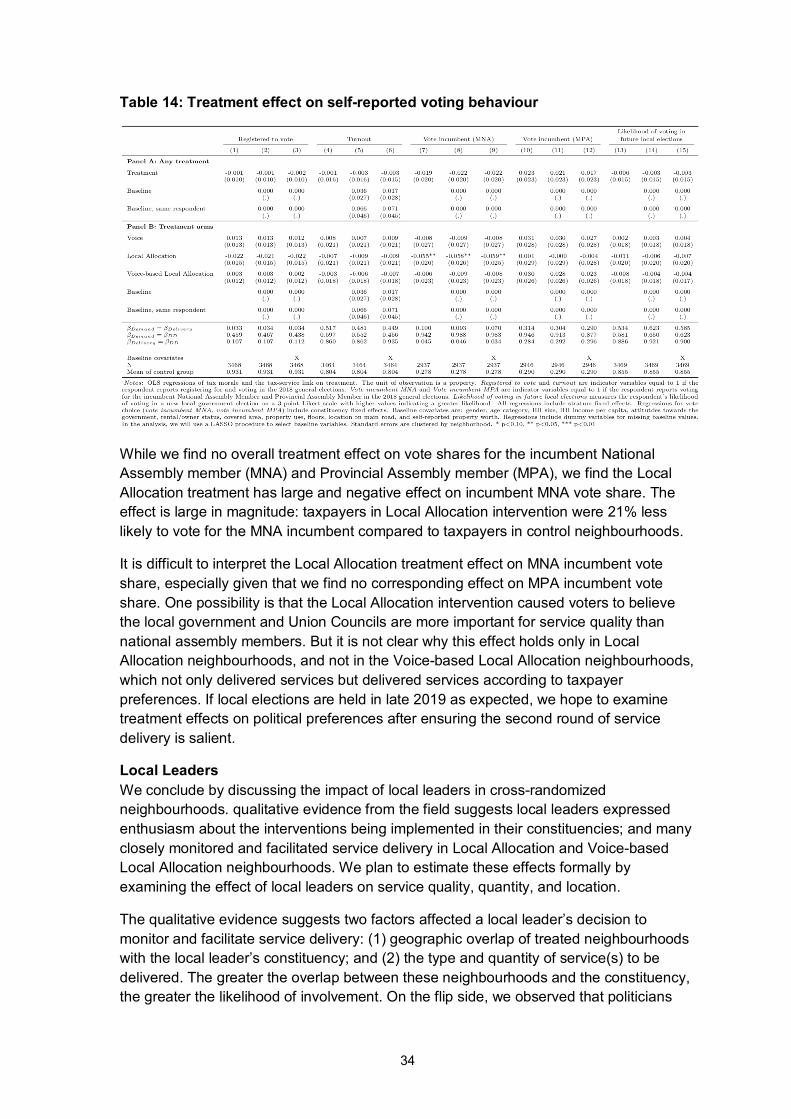
34
Table 14: Treatment effect on self-reported voting behaviour
While we find no overall treatment effect on vote shares for the incumbent National Assembly member (MNA) and Provincial Assembly member (MPA), we find the Local Allocation treatment has large and negative effect on incumbent MNA vote share. The effect is large in magnitude: taxpayers in Local Allocation intervention were 21% less likely to vote for the MNA incumbent compared to taxpayers in control neighbourhoods.
It is difficult to interpret the Local Allocation treatment effect on MNA incumbent vote share, especially given that we find no corresponding effect on MPA incumbent vote share. One possibility is that the Local Allocation intervention caused voters to believe the local government and Union Councils are more important for service quality than national assembly members. But it is not clear why this effect holds only in Local Allocation neighbourhoods, and not in the Voice-based Local Allocation neighbourhoods, which not only delivered services but delivered services according to taxpayer preferences. If local elections are held in late 2019 as expected, we hope to examine treatment effects on political preferences after ensuring the second round of service delivery is salient.
Local Leaders We conclude by discussing the impact of local leaders in cross-randomized neighbourhoods. qualitative evidence from the field suggests local leaders expressed enthusiasm about the interventions being implemented in their constituencies; and many closely monitored and facilitated service delivery in Local Allocation and Voice-based Local Allocation neighbourhoods. We plan to estimate these effects formally by examining the effect of local leaders on service quality, quantity, and location.
The qualitative evidence suggests two factors affected a local leader’s decision to monitor and facilitate service delivery: (1) geographic overlap of treated neighbourhoods with the local leader’s constituency; and (2) the type and quantity of service(s) to be delivered. The greater the overlap between these neighbourhoods and the constituency, the greater the likelihood of involvement. On the flip side, we observed that politicians
35
who had just one neighbourhood within their constituency slated for service delivery did not believe there to be any substantial reward for engagement in service provision and hence did not take part in active decision-making as services were delivered. Local leaders also tended to prefer highly visible services such as new streetlights rather than less visible services such as trash removal. Visible services reduced the costs of publicizing and made it easier for the politician to take political credit.
4.2.3 Heterogeneity of impacts We examine heterogeneous treatment effects by respondent gender and age.20 These results suggest that there may be some modest variation in who knows about the scheme and who observes government action in their neighbourhood. We find, for example, that women in Voice neighbourhoods are less likely to believe the government took any action to improve goods and services. We also find that older respondents (>65) assigned to Voice-based Local Allocation are more likely to report the local government took action to improve goods and services. This variation suggests that some respondents responded more strongly to the scheme, either because they were more likely to engage with the government actors who informed them about and implemented the scheme (e.g. E&T, local government, and Union Councils) or because they were more cognizant of changes (or in the case of Voice neighbourhoods, the absence of changes) in service quality in their neighbourhoods. We plan on exploring this further in future work.
5. Cost analysis
In the tables below, we provide a breakdown of costs associated with implementing one full round of interventions – specifically, one round of service delivery and one round of preference elicitation. These include implementation costs incurred by both government and our project team. It does not include any costs related to the evaluation or research side of the project.
Given that our data analysis is ongoing, we are not able to provide a comprehensive cost-effectiveness analysis using impact estimates at this stage. In the meantime, we provide the cost per unit (at the property level) to implement the intervention for each of the three treatments, Voice, Voice-based Local Allocation, and Local Allocation. As these calculations do not account for any potential recuperated costs from an increase in tax revenue, we would therefore anticipate these underestimate the true cost-effectiveness of each intervention, if we see a positive impact on tax revenue in our future analysis.
20 We also intend to examine heterogeneous treatment effects by the following property and respondent characteristics, as specified in our pre-analysis plan: renter/owner (for the sample of residential properties); residential/commercial (for the sample of owner respondents); respondent trust in state at baseline; neighbourhood service quality at baseline (measured by an index formed using objective measures from a neighbourhood public goods survey and subjective measures from baseline); and respondent tax-paying habits at baseline (e.g. partial payer, late payer, etc.).
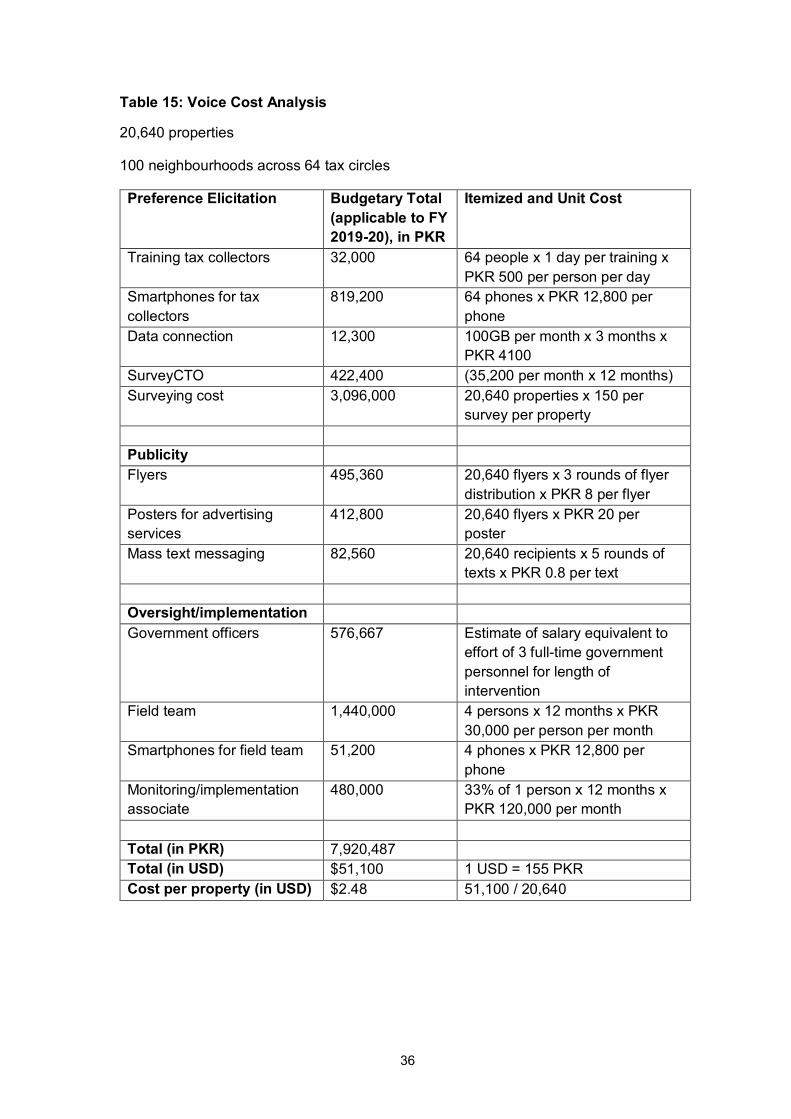
36
Table 15: Voice Cost Analysis
20,640 properties
100 neighbourhoods across 64 tax circles
Preference Elicitation Budgetary Total (applicable to FY 2019-20), in PKR
Itemized and Unit Cost
Training tax collectors 32,000 64 people x 1 day per training x PKR 500 per person per day
Smartphones for tax collectors
819,200 64 phones x PKR 12,800 per phone
Data connection 12,300 100GB per month x 3 months x PKR 4100
SurveyCTO 422,400 (35,200 per month x 12 months) Surveying cost 3,096,000 20,640 properties x 150 per
survey per property Publicity Flyers 495,360 20,640 flyers x 3 rounds of flyer
distribution x PKR 8 per flyer Posters for advertising services
412,800 20,640 flyers x PKR 20 per poster
Mass text messaging 82,560 20,640 recipients x 5 rounds of texts x PKR 0.8 per text
Oversight/implementation Government officers 576,667 Estimate of salary equivalent to
effort of 3 full-time government personnel for length of intervention
Field team 1,440,000 4 persons x 12 months x PKR 30,000 per person per month
Smartphones for field team 51,200 4 phones x PKR 12,800 per phone
Monitoring/implementation associate
480,000 33% of 1 person x 12 months x PKR 120,000 per month
Total (in PKR) 7,920,487 Total (in USD) $51,100 1 USD = 155 PKR Cost per property (in USD) $2.48 51,100 / 20,640
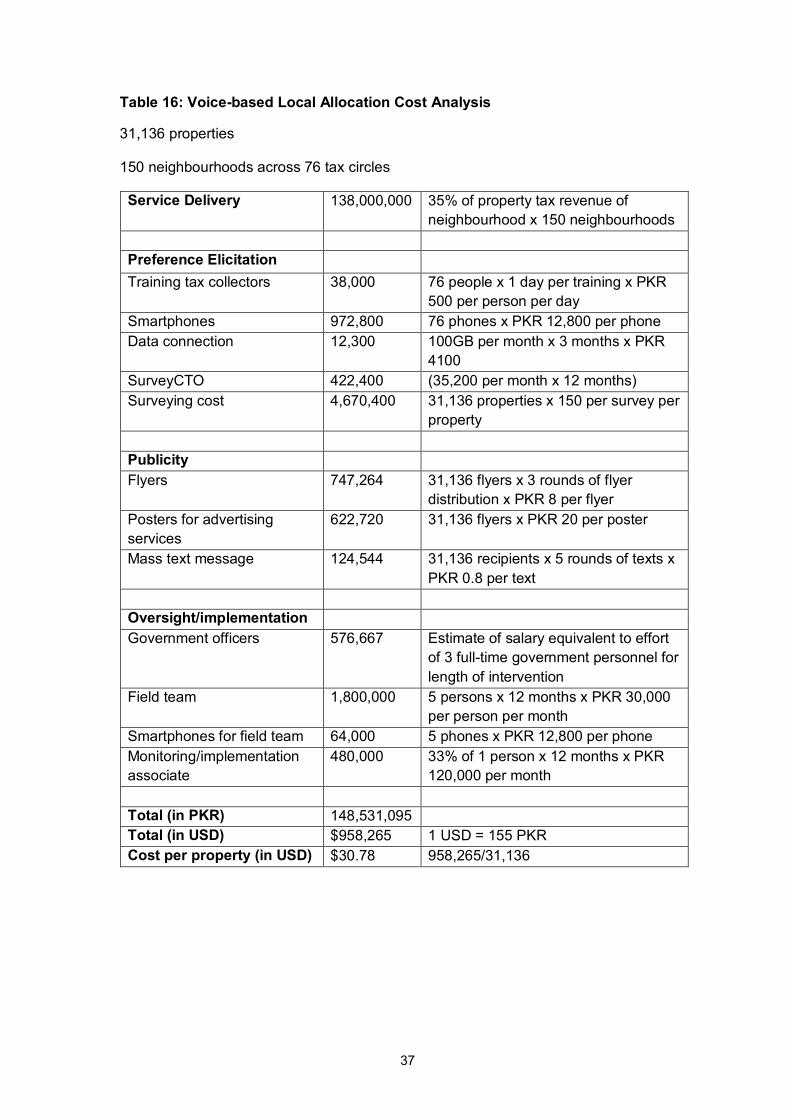
37
Table 16: Voice-based Local Allocation Cost Analysis
31,136 properties
150 neighbourhoods across 76 tax circles
Service Delivery 138,000,000 35% of property tax revenue of neighbourhood x 150 neighbourhoods
Preference Elicitation Training tax collectors 38,000 76 people x 1 day per training x PKR
500 per person per day Smartphones 972,800 76 phones x PKR 12,800 per phone Data connection 12,300 100GB per month x 3 months x PKR
4100 SurveyCTO 422,400 (35,200 per month x 12 months) Surveying cost 4,670,400 31,136 properties x 150 per survey per
property Publicity Flyers 747,264 31,136 flyers x 3 rounds of flyer
distribution x PKR 8 per flyer Posters for advertising services
622,720 31,136 flyers x PKR 20 per poster
Mass text message 124,544 31,136 recipients x 5 rounds of texts x PKR 0.8 per text
Oversight/implementation Government officers 576,667 Estimate of salary equivalent to effort
of 3 full-time government personnel for length of intervention
Field team 1,800,000 5 persons x 12 months x PKR 30,000 per person per month
Smartphones for field team 64,000 5 phones x PKR 12,800 per phone Monitoring/implementation associate
480,000 33% of 1 person x 12 months x PKR 120,000 per month
Total (in PKR) 148,531,095 Total (in USD) $958,265 1 USD = 155 PKR Cost per property (in USD) $30.78 958,265/31,136
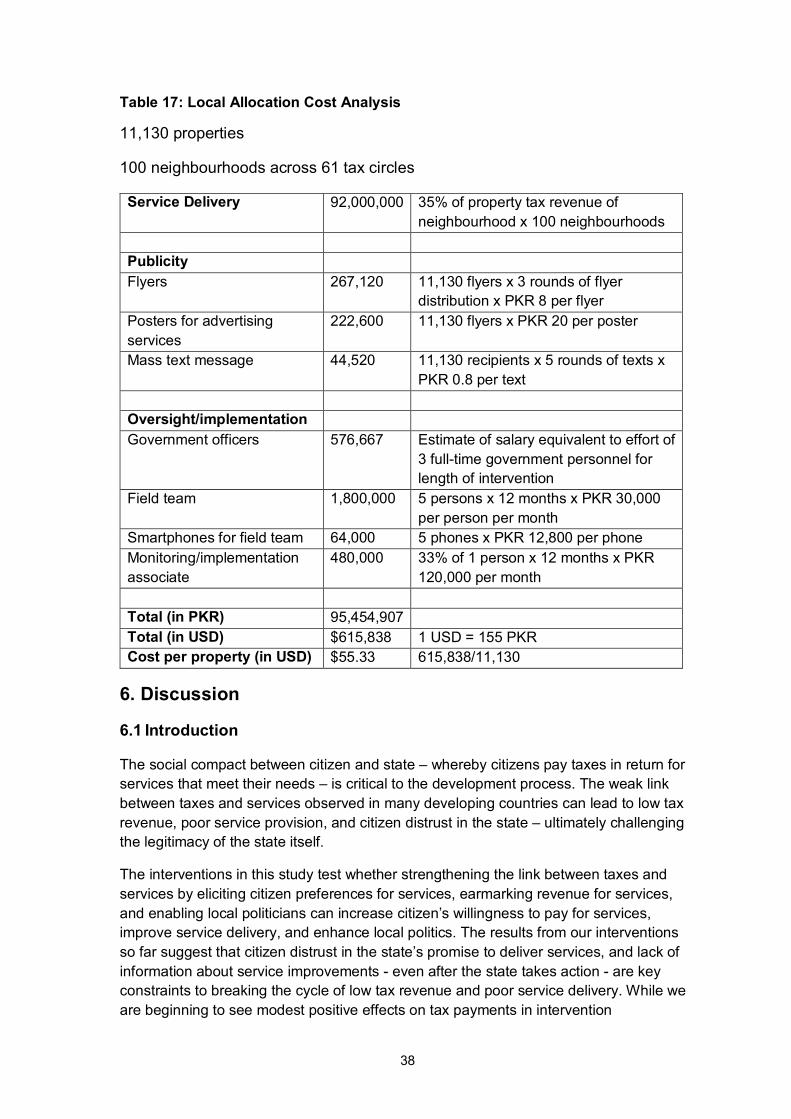
38
Table 17: Local Allocation Cost Analysis
11,130 properties
100 neighbourhoods across 61 tax circles
Service Delivery 92,000,000 35% of property tax revenue of neighbourhood x 100 neighbourhoods
Publicity Flyers 267,120 11,130 flyers x 3 rounds of flyer
distribution x PKR 8 per flyer Posters for advertising services
222,600 11,130 flyers x PKR 20 per poster
Mass text message 44,520 11,130 recipients x 5 rounds of texts x PKR 0.8 per text
Oversight/implementation Government officers 576,667 Estimate of salary equivalent to effort of
3 full-time government personnel for length of intervention
Field team 1,800,000 5 persons x 12 months x PKR 30,000 per person per month
Smartphones for field team 64,000 5 phones x PKR 12,800 per phone Monitoring/implementation associate
480,000 33% of 1 person x 12 months x PKR 120,000 per month
Total (in PKR) 95,454,907 Total (in USD) $615,838 1 USD = 155 PKR Cost per property (in USD) $55.33 615,838/11,130
6. Discussion
6.1 Introduction
The social compact between citizen and state – whereby citizens pay taxes in return for services that meet their needs – is critical to the development process. The weak link between taxes and services observed in many developing countries can lead to low tax revenue, poor service provision, and citizen distrust in the state – ultimately challenging the legitimacy of the state itself.
The interventions in this study test whether strengthening the link between taxes and services by eliciting citizen preferences for services, earmarking revenue for services, and enabling local politicians can increase citizen’s willingness to pay for services, improve service delivery, and enhance local politics. The results from our interventions so far suggest that citizen distrust in the state’s promise to deliver services, and lack of information about service improvements - even after the state takes action - are key constraints to breaking the cycle of low tax revenue and poor service delivery. While we are beginning to see modest positive effects on tax payments in intervention
39
neighbourhoods, many taxpayers in our sample are unaware of the services delivered via the interventions, suggesting these effects may be underestimates.
Our first year results are consistent with existing literature on citizen-state interaction. Specifically, in an lab-in-field experimental setting, Acemoglu et. al. (2019) show that not only do citizens display low trust towards the state, they are relatively poorly informed of improvements carried out by the state. Our results also show that news in fact does not travel fast or widely and even when the state is improving, citizens may not be aware of this. Reassuringly, Acemoglu et. al. show, however, that when the citizen is made aware of the state’s improvement, they are willing to update more positively towards the state and increase real-stakes giving to the state. This suggests that while our results so far are not showing substantial increases in (positive) attitudes towards the state of taxes paid, the problem could be more due to the fact that the state’s provision of goods has not been made as salient and were one to do so, these other impacts would be better realized. It is in this regard we are going to complement our continued provision in the second year with a far greater focus on drawing the citizen’s attention to these improvements.
6.2 Policy and programme relevance: evidence update and use
This study was designed in collaboration with relevant policy stakeholders by employing a Smart Policy Design and Implementation paradigm (see http://epod.cid.harvard.edu/policy-research-engagements) – a problem-driven, collaborative approach, where policymakers and researchers came together, employing their collective expertise to design, test and refine solutions to a policy problem posed by the Government. Key stages in this process were individual discussions with policy actors culminating in a brainstorming workshop prior to the evaluation that developed an initial proposal to more structured conversations on design and implementation that resulted in a formal proposal that was then approved by the Government including the Chief Minister. We detail the different collaborators throughout the interventions below.
The major policy stakeholder for this project is the Government of Punjab, which has endorsed this project at all levels. This includes the Chief Minister Punjab who has formally approved this project and who set up a Steering Committee to oversee the project implementation.
One of the primary actors in our study is the Punjab E&T Department. The E&T department, through regular meetings with senior officials, was closely involved in the design of the intervention, and a key partner in ensuring appropriate approvals were obtained for the proposed interventions.
Moreover, the E&T department is closely involved in implementing the interventions – specifically, E&T employees inform taxpayers about the intervention and elicit taxpayer preferences for services on a smartphone app. To conduct this activity, E&T employees have been trained on how to use technology to interface with taxpayers – a skill the department can leverage for its own activities in the future.21
21 The smartphone app were in fact developed with the E&T employees. Initial version of the app relied on videos, which sometimes did not run properly in the field. E&T employees offered

40
The interventions have also expanded the role of E&T employees from (potentially extortionary) tax collector to liaison between citizen and state in the social compact. E&T employees no longer simply collect taxes, but also inform taxpayers about the tax-service link to encourage voluntary tax compliance. This has generated considerable excitement in the department. In the status quo, tax collectors frequently complain of taxpayer apathy or even resistance, and having to make repeated visits to properties to remind taxpayers to pay. The interventions offer the possibility of reframing a conventionally transactional engagement into a long-term, sustainable relationship based on mutual respect and voluntary compliance. In one visit, for example, a tax collector was invited into the home of a taxpayer (almost unheard of) to show appreciation to the tax collector for taking the time to collect citizen preferences. The E&T department hopes to use the interventions to improve tax collection rates, and to strengthen citizen faith in the government’s ability to deliver services.
The Local Government Department and local municipal authorities are also key actors closely involved in the implementation of the project. Specifically, it is through local municipal authorities that urban services promised to taxpayers are delivered. We have worked closely with service providers to assess service needs in neighbourhoods, ensure services are delivered, and assess the quality of delivered services.
In the process, we developed a number of smartphone apps in close collaboration with the Local Government that can be used by the department to monitor services. These apps streamline the compilation of official documentation needed to deliver services, which in the status quo is a fairly complicated procedure done on paper. The ability to record required data in a format that is tailored according to the regulatory regime can shorten the turnaround time from estimation of services to actual delivery. The apps also enable regular monitoring of service delivery at the municipality-level through GIS software, and can help identify identifying problematic locations e.g. areas with under-provision or installation of subpar equipment. Perhaps most importantly, the apps offer Local Government an opportunity to ensure that only those services are paid for that have actually been delivered by comparing actual delivery data against planned services.
The interventions also empowered the Union Councils by allowing them to take ownership and credit for improvements in service delivery in their constituencies. Local politicians in selected Union Councils were provided details about the interventions in their respective constituencies and trained on how they could support the intervention at various stages. Most politicians left these trainings with a positive impression of the project and excited about their roles.
Though the elected representatives of the Union Councils were dismissed from office midway through the interventions, qualitative evidence from the field indicates that before they were dismissed, the politicians took an active interest in service delivery, engaging with service providers in determining the location and quality of services.
suggestions on how to instead convey material using a short set of slides on the app, and supplement the app with flyers.
41
Finally, taxpayers are also key actors, as they stand to benefit from improved urban services, and the success of the project hinges on their responsiveness to the intervention. Though one of the key lessons learned in the first year of the intervention is that additional effort must be taken to inform taxpayers about service delivery, to the extent that taxpayers are informed about the project, many have expressed their optimism and support.
The project has also been presented at several global policy forums: these include the IMF/World Bank Annual Meetings, the Annual Bank Conference on Africa, and several events and meetings with policymakers, especially tax authorities, in Africa and Asia. The project was also presented at a workshop on financing Punjab’s cities on 1st September, 2019 in Lahore with the Finance Minister and Secretaries to all relevant government departments.
6.3 Challenges and lessons
The results from the first year of interventions suggest that citizens’ lack of credibility and information may weaken the potential impact of strengthening the link between taxes and services. Moving forward, we plan to address these issues by engaging much more intensely with taxpayers in intervention neighbourhoods. In the ongoing round of service delivery, we plan to reach out aggressively to taxpayers after preferences have been collected and aggregated and after services have been delivered. In particular, we plan to send text messages and distribute flyers that will inform taxpayers about service delivery and offer URL links to pictures and maps that show where services have been delivered in their neighbourhoods. To ensure that all members of a property are aware of the scheme, we also plan to reach out to members who engaged with E&T staff and members who were surveyed in our baseline and endline.
7. Conclusion
This report presents the experimental design and reports first round impacts on tax payments, tax morale, and attitudes towards the state. Our findings show that the project was successful in collecting citizen preferences, changing the relationship between tax collectors and citizens, deploying technology to improve government efficiency through the preference elicitation via smartphone devices, and delivering actual services in the designated localities. However, the results also suggest that for such a scheme to be the most effective, the government must ensure service delivery happens at a faster pace and accompany delivery with better messaging to increase salience amongst citizens so they are aware of what is happening and see the clear link between the interactions they have with the government and the services that they receive. Given these results, we intend to focus on raising awareness in the ongoing round of service delivery. We anticipate that if we are indeed able to increase awareness of the interventions, the interventions will have a larger impact on attitudes towards the state and tax payments given that we already find small positive effects despite low awareness.
42
Online appendixes
Online appendix A1: Local Politician Field Procedures
https://www.3ieimpact.org/sites/default/files/2020-04/DPW1.1005-Online-appendix-A1-Local-Politician-Treatment-Field-Procedures.pdf
Online appendix A2: Local Politician Sample Field Notes
https://www.3ieimpact.org/sites/default/files/2020-04/DPW1.1005-Online-appendix-A2-Local-Politician-Treatment-Sample-Field-Notes.pdf
Online appendix A3: Sanitation Services Delivery Verification Sample Field Notes
https://www.3ieimpact.org/sites/default/files/2020-04/DPW1.1005-Online-appendix-A3-Sanitation-Services-Delivery-Verification-Sample-Field-Notes.pdf
Online appendix B: Survey Instrument
https://www.3ieimpact.org/sites/default/files/2020-04/DPW1.1005-Online-appendix-B-Survey-Instrument.pdf
Online appendix C: Pre-analysis Plan
https://www.3ieimpact.org/sites/default/files/2020-04/DPW1.1005-Online-appendix-C-PreAnalysisPlan.pdf
Online appendix D: Supplemental Figures
https://www.3ieimpact.org/sites/default/files/2020-04/DPW1.1005-Online-appendix-D-Supplemental-Figures.pdf
Online appendix E: Smartphone app for preference elicitation
https://www.3ieimpact.org/sites/default/files/2020-04/DPW1.1005-Online-appendix-E-SmartphoneApp.pdf
Online appendix F: Focus Group Discussion Invitation https://www.3ieimpact.org/sites/default/files/2020-04/DPW1.1005-Online-appendix-F-FocusGroupInvitation.pdf
43
References
Acemoglu, Daron, Ali Cheema, Asim I. Khwaja, and James A. Robinson, (2019). ``Trust in State and Non-State Actors: Evidence From Dispute Resolution in Pakistan.”
Alm, James, Betty R. Jackson, and Michael McKee, (1993). ``Fiscal Exchange, Collective Decision Institutions, and Tax
Compliance." Journal of Economic Behaviour and Organization, 22(3): 285-303.
Asian Development Bank, (2014). Key Indicators for Asia and the Pacific 2014. Manila: Asian Development Bank.
Blumenthal, Marsha, Charles Christian, and Joel Slemrod (2001). ``Do Normative Appeals Affect Tax Compliance? Evidence From a Controlled Experiment in Minnesota” National Tax Journal 54(1), 125-138.
Castro, Lucio and Carlos Scartascini (2015). ``Tax Compliance and Enforcement in the Pampas: Evidence from a Field Experiment.” Journal of Economic Behavior and Organization, 116: 65-82.
Chetty, Sylvie, and Cecilia Pahlberg, (2014). ``Networks and social capital." The Routledge Companion to International
Entrepreneurship 117.
Gonzalez-Navarro, Marco, and Climent Quintana-Domeque (2014). ``Local Public Goods and Property Tax Compliance:
Evidence from Residential Street Pavement," Working paper, Economics Department, University of Toronto.
Nabi, Ijaz. (2011). ``Reforming the Urban Property Tax in Pakistan’s Punjab.” IGC Policy Brief. https://www.theigc.org/wp-content/uploads/2014/09/Nabi-2011-Policy-Brief.pdf
Khan, A. Q., A. I. Khwaja, and B. A. Olken, (2016). ``Tax Farming Redux: Experimental
Evidence on Performance Pay for Tax Collectors." The Quarterly Journal of Economics, 131(1): 219-271.
Khan, Adnan Q., Asim Ijaz Khwaja, and Benjamin A. Olken, (2019). ``Making Moves Matter: Experimental Evidence on Incentivizing Bureaucrats through Performance-Based Postings." American Economic Review, 109 (1): 237-70.
Kleven, Henrik Jacobsen, Martin B. Knudsen, Claus Thustrup Kreiner, Søren Pedersen, and Emmanuel Saez, (2011).
``Unwilling or Unable to Cheat? Evidence from a Tax Audit Experiment in Denmark." Econometrica, 79(3): 651-692.
Lamberton, Cait Poynor, J. Emmanuel De Neve, and Michael I. Norton, (2014). ``Eliciting Taxpayer Preferences

44
Increases Tax Compliance." Working Paper 14-106, Harvard Business School.
OECD (2013), ``What Drives Tax Morale?”, http://www.oecd.org/ctp/tax-global/what-drives-tax-morale.pdf.
Olken, Benjamin, (2010). `` Direct Democracy and Local Public Goods: Evidence from a Field Experiment in Indonesia.” American Political Science Review, 104(2): 243-267.
45
Other publications in the 3ie Impact Evaluation Report Series The following reports are available from http://3ieimpact.org/evidence-hub/publications/impact-evaluations
Rural institutional innovation: can village courts in Bangladesh accelerate access to justice and improve socio-economic outcomes? 3ie Impact Evaluation Report 116. Mattsson, M and Mobarak, AM, 2020.
Using big data to evaluate the impacts of transportation infrastructure investment: the case of subway systems in Beijing, 3ie Impact Evaluation Report 115. Li, S and Liu, Y, 2020.
Community toilet use in Indian slums: willingness-to-pay and the role of informational and supply side constraints, 3ie Impact Evaluation Report 113. Armand, A, Augsburg, B, Bancalari A and Trivedi B, 2020.
Impacts, maintenance and sustainability of irrigation in Rwanda, 3ie Impact Evaluation Report 112. Byiringo, E, Jones M, Kondylis F, Loeser J, Magruder, J and Ndahimana, C, 2020.
Continuous Emissions Monitoring Systems (CEMS) in India, 3ie Impact Evaluation Report 111. Greenstone, M, Pande, R, Ryan, N and Sudarshan A, 2020.
Evaluating the impacts of the Dar es Salaam Bus Rapid Transit System, 3ie Impact Evaluation Report 110. Morten, M, Bryan, G, Siddiqi, B, Balboni, C, 2020.
Access to safe drinking water: experimental evidence from new water sources in Bangladesh, 3ie Impact Evaluation Report 109. Cocciolo, S, Ghisolfi, S, Habib, A, Rashid, SMA and Tompsett, A, 2020.
Impact of alternate wetting and drying on farm incomes and water savings in Bangladesh, 3ie Impact Evaluation Report 108. Chakravorty, U, Dar, MH, Emerick, K, 2020.
The effects of vouchers for essential household items on child health, mental health, resilience and social cohesion among internally displaced persons in the Democratic Republic of Congo, 3ie Impact Evaluation Report 107. Quattrochi, J, Bisimwa, G, Thompson, T, van der Windt, P and Voors, M, 2020.
Measuring impacts of conservation interventions on human well-being and the environment in Northern Cambodia, 3ie Impact Evaluation Report 106. Clements, T, Neang, M, Milner-Gulland, EJ and Travers, H, 2020.
The 5 Star Toilet Campaign: improving toilet use in rural Gujarat, 3ie Impact Evaluation Report 105. Chauhan, K, Schmidt, WP, Aunger, R, Gopalan, B, Saxena, D, Yashobant, S, Patwardhan, V, Bhavsar, P, Mavalankar, D and Curtis, V, 2020.
How education about maternal health risk can change the gender gap in the demand for family planning in Zambia, 3ie Impact Evaluation Report 104. Ashraf, N, Field, E, Voena, A and Ziparo, R, 2019.
46
In search of the holy grail: can unconditional cash transfers graduate households out of poverty in Zambia?, Impact Evaluation Report 103. Handa, S, Tembo, G, Natali, L, Angeles, G and Spektor, G, 2019.
Increasing HIV self-testing and linkage to care for partners of women in antenatal care in Uganda, Impact Evaluation Report 102. Wanyenze, R, Buregyeya, E, Matovu, J, Kisa, R, Kagaayi, J, Vrana-Diaz, C, Malek, A, Musoke, W, Chemusto, H, Mukama, S and Korte, J, 2019.
Improving the quality of care for children with acute malnutrition in Uganda, 3ie Impact Evaluation Report 101. Marzia, L, Wanzira, H, Lochoro, P and Putoto, G, 2019.
Impacts of increasing community resilience through humanitarian aid in Pakistan, 3ie Impact Evaluation Report 100. Avdeenko, A and Frölich, M, 2019.
Impacts of community monitoring of socio-environmental liabilities in the Ecuadorian and Peruvian Amazon, 3ie Impact Evaluation Report 99. Pellegrini, L, 2019.
Increasing HIV testing demand among Kenyan truck drivers and female sex workers, 3ie Impact Evaluation Report 98. Kelvin, E, George, G, Mwai, E, Kinyanjui, S, Inoti, S, Chetty, T, Strauss, M, Romo, M, Oruko, F, Odhiambo J, Nyaga, E, Mantell, J and Govender, K, 2019.
Impacts of community stakeholder engagement interventions in Ugandan oil extractives, 3ie Impact Evaluation Report 97. Parker, R, Coleman, E, Manyindo, J, Schultz, B and Mukuru, E, 2019.
The impacts of formal registration of businesses in Malawi, 3ie Impact Evaluation Report 96. Campos, F, Goldstein, M and McKenzie, D, 2019.
Unpacking the determinants of entrepreneurship development and economic empowerment for women in Kenya, 3ie Impact Evaluation Report 95. McKenzie, D, Puerto, S and Odhiambo, F, 2019.
Impacts of key provisions in Ghana’s Petroleum Revenue Management Act, 3ie Impact Evaluation Report 94. Edjekumhene, I, Voors, M, Lujala, P, Brunnschweiler, C, Owusu, CK and Nyamekye, A, 2019.
Using information to break the political resource curse in natural gas management in Mozambique, 3ie Impact Evaluation Report 93. Armand, A, Costa, AI, Coutts, A, Vicente, P and Vilela, I, 2019.
Harnessing transparency initiatives to improve India's environmental clearance process for the mineral mining sector, 3ie Impact Evaluation Report 92. Pande, R and Sudarshan, A, 2019.
Impacts of removing user fees for maternal health services on universal health coverage in Kenya, 3ie Impact Evaluation Report 91. Abuya, T, Dennis, M, Matanda, D, Obare, F and Bellows, B, 2018.
47
Impact of voice reminders to reinforce harvest aggregation services training for farmers in Mali, 3ie Impact Evaluation Report 90. Osei, RD, Dzanku, FM, Osei-Akoto, I, Asante, F, Hodey, LS, Adu, PN, Adu-Ababio, K and Coulibaly, M, 2018.
Impacts of Breakthrough’s school-based gender attitude change programme in Haryana, India, 3ie Impact Evaluation Report 89. Jayachandran, S, Jain, T and Dhar, D, 2018.
Hotspot interventions at scale: the effects of policing and city services on crime in Bogotá, Colombia, 3ie Impact Evaluation Report 88. Blattman, C, Green, D, Ortega, D and Tobón, S, 2018.
Impact evaluation of the Philippine Special Program for Employment of Students, 3ie Impact Evaluation Report 87. Beam, E, Linden, L, Quimbo, S and Richmond, H, 2018.
Community-based distribution of oral HIV self-testing kits: experimental evidence from Zambia, 3ie Impact Evaluation Report 86. Hensen, B, Ayles, H, Mulubwa, C, Floyd, S, Schaap, A, Chiti, B, Phiri, M, Mwenge, L, Simwinga, M, Fidler S, Hayes, R, Bond, V and Mwinga, A, 2018.
Evaluating the economic impacts of rural banking: experimental evidence from southern India, 3ie Impact Evaluation Report 85. Field, E and Pande, R, 2018.
Direct provision versus facility collection of HIV tests: impacts of self-testing among female sex workers in Uganda. 3ie Impact Evaluation Report 84. Ortblad, K, Musoke, DK, Ngabirano, T, Oldenburg, C and Bärnighausen, T, 2018.
Increasing female sex worker HIV testing: effects of peer educators and HIV self-tests in Zambia, 3ie Impact Evaluation Report 83. Chanda, MM, Ortblad, KF, Mwale, M, Chongo, S, Kanchele, C, Kamungoma, N, Fullem, A, Bärnighausen, T and Oldenburg, CE, 2018.
Community delivery of antiretroviral drugs: a non-inferiority matched-pair pragmatic cluster-randomized trial in Dar es Salaam, Tanzania, 3ie Impact Evaluation Report 82. Francis, JM, Geldsetzer, P, Asmus, G, Ulenga, N, Ambikapathi, R, Sando, D, Fawzi, W and Bärnighausen, T, 2018.
Nourishing the future: targeting infants and their caregivers to reduce undernutrition in rural China, 3ie Impact Evaluation Report 81. Cai, J, Luo, R, Li, H, Lien, J, Medina, A, Zhou, H and Zhang, L, 2018.
Impacts of the World Food Programme’s interventions to treat malnutrition in Niger. 3ie Impact Evaluation Report 80. Brück, T, Ferguson, NTN, Ouédraogo, J and Ziegelhöfer, Z, 2018.
Impact evaluation of the World Food Programme’s moderate acute malnutrition treatment and prevention programmes in Sudan. 3ie Impact Evaluation Report 79. Guevarra, E, Mandalazi, E, Balegamire, S, Albrektsen, K, Sadler, K, Abdelsalam, K, Urrea, G and Alawad, S, 2018.
Impact evaluation of WFP’s programs targeting moderate acute malnutrition in humanitarian situations in Chad. 3ie Impact Evaluation Report 78. Saboya, M, Rudiger, J, Frize, J, Ruegenberg, D, Rodríguez Seco, A and McMillon, C, 2018.
48
Improving midday meal delivery and encouraging micronutrient fortification among children in India, 3ie Impact Evaluation Report 77. Shastry, GK, Berry, J, Mukherjee, P, Mehta, S and Ruebeck, H, 2018.
Evaluation of infant development centres: an early years intervention in Colombia, 3ie Impact Evaluation Report 76. Andrew, A, Attanasio, O, Bernal, R, Cordona, L, Krutikova, S, Heredia, DM, Medina, C, Peña, X, Rubio-Codina, M and Vera-Hernandez, M, 2018.
Can the wounds of war be healed? Experimental evidence on reconciliation in Sierra Leone. 3ie Impact Evaluation Report 75. Cilliers, J, Dube, O and Siddiqi, B, 2018.
Impact evaluation of the Menabe and Melaky development programme in Madagascar, 3ie Impact Evaluation Report 74. Ring, H, Morey, M, Kavanagh, E, Kamto, K, McCarthy, N, Brubaker, J and Rakotondrafara, C, 2018.
Impact evaluation of the Smallholder Dairy Commercialization Programme in Kenya, 3ie Impact Evaluation Report 73. Bonilla, J, McCarthy, N, Mugatha, S, Rai, N, Coombes, A and Brubaker, J, 2018.
Impact and adoption of risk-reducing drought-tolerant rice in India, 3ie Impact Evaluation Report 72. Yamano, T, Dar, MH, Panda, A, Gupta, I, Malabayabas, ML and Kelly, E, 2018.
Poverty and empowerment impacts of the Bihar Rural Livelihoods Project in India, 3ie Impact Evaluation Report 71. Hoffmann, V, Rao, V, Datta, U, Sanyal, P, Surendra, V and Majumdar, S 2018.
How should Tanzania use its natural gas? Citizens’ views from a nationwide Deliberative Poll, 3ie Impact Evaluation Report 70. Birdsall, N, Fishkin, J, Haqqi, F, Kinyondo, A, Moyo, M, Richmond, J and Sandefur, J, 2018.
Impact evaluation of the conditional cash transfer program for secondary school attendance in Macedonia, 3ie Impact Evaluation Report 69. Armand, A and Carneiro, P, 2018.
Age at marriage, women’s education, and mother and child outcomes in Bangladesh, 3ie Impact Evaluation Report 68. Field, E, Glennerster, R, Nazneen, S, Pimkina, S, Sen, I and Buchmann, N, 2018.
Evaluating agricultural information dissemination in western Kenya, 3ie Impact Evaluation Report 67. Fabregas, R, Kremer, M, Robinson, J and Schilbach, F, 2017.
General equilibrium impact assessment of the Productive Safety Net Program in Ethiopia, 3ie Impact Evaluation Report 66. Filipski, M, Taylor, JE, Abegaz, GA, Ferede, T, Taffesse, AS and Diao, X, 2017.
Impact of the Uddeepan programme on child health and nutrition in India, 3ie Impact Evaluation Report 65. Kochar, A, Sharma, A and Sharma, A, 2017.
Evaluating oral HIV self-testing to increase HIV testing uptake among truck drivers in Kenya, 3ie Impact Evaluation Report 64. Kelvin, EA, Mwai, E, Romo, ML, George, G, Govender, K, Mantell, JE, Strauss, M, Nyaga, EN and Odhiambo, JO, 2017.
49
Integration of EPI and paediatric HIV services for improved ART initiation in Zimbabwe, 3ie Impact Evaluation Report 63. Prescott, M, Boeke, C, Gotora, T, Mafaune, HW, Motsi, W, Graves, J, Mangwiro, A and McCarthy, E, 2017.
Increasing male partner HIV testing using self-test kits in Kenya, 3ie Impact Evaluation Report 62. Gichangi, A, Korte, JE, Wambua, J, Vrana, C and Stevens, D, 2017.
Evaluating the impact of community health worker integration into prevention of mother-to-child transmission of HIV services in Tanzania, 3ie Impact Evaluation Report 61. Nance, N, McCoy, S, Ngilangwa, D, Masanja, J, Njau, P and Noronha, R, 2017.
Using HIV self-testing to promote male partner and couples testing in Kenya, 3ie Impact Evaluation Report 60. Thirumurthy, H, Omanga, E, Obonyo, B, Masters, S and Agot, K, 2017.
Increasing male partner HIV self-testing at antenatal care clinics in Kenya, 3ie Impact Evaluation Report 59. Gichangi, A, Korte, JE, Wambua, J, Vrana, C and Stevens, D, 2017.
Impact of free availability of public childcare on labour supply and child development in Brazil, 3ie Impact Evaluation Report 58. Attanasio, O, Paes de Barros, R, Carneiro, P, Evans, D, Lima, L, Olinto, P and Schady, N, 2017.
Estimating the effects of a low-cost early stimulation and parenting education programme in Mexico, 3ie Impact Evaluation Report 57. Cardenas, S, Evans, D and Holland, P, 2017.
The Better Obstetrics in Rural Nigeria study: an impact evaluation of the Nigerian Midwives Service Scheme, 3ie Impact Evaluation Report 56. Okeke, E, Glick, P, Abubakar, IS, Chari, AV, Pitchforth, E, Exley, J, Bashir, U, Setodji, C, Gu, K and Onwujekwe, O, 2017.
The Productive Safety Net Programme in Ethiopia: impacts on children’s schooling, labour and nutritional status, 3ie Impact Evaluation Report 55. Berhane, G, Hoddinott, J, Kumar, N and Margolies, A, 2016.
The impact of youth skills training on the financial behaviour, employability and educational choice in Morocco, 3ie Impact Evaluation Report 54. Bausch, J, Dyer, P, Gardiner, D, Kluve, J and Mizrokhi, E, 2016.
Using advertisements to create demand for voluntary medical male circumcision in South Africa, 3ie Impact Evaluation Report 53. Frade, S, Friedman, W, Rech, D and Wilson, N, 2016.
The use of peer referral incentives to increase demand for voluntary medical male circumcision in Zambia, 3ie Impact Evaluation Report 52. Zanolini, A, Bolton, C, Lyabola, LL, Phiri, G, Samona, A, Kaonga, A and Harsha Thirumurthy, H, 2016.
Using smartphone raffles to increase demand for voluntary medical male circumcision in Tanzania, 3ie Impact Evaluation Report 51. Mahler, H and Bazant, E, 2016.
50
Voluntary medical male circumcision uptake through soccer in Zimbabwe, 3ie Impact Evaluation Report 50. DeCelles, J, Kaufman, Z, Bhauti, K, Hershow, R, Weiss, H, Chaibva, C, Moyo, N, Braunschweig, E, Mantula, F, Hatzold, K and Ross, D, 2016.
Measuring the impact of SMS-based interventions on uptake of voluntary medical male circumcision in Zambia, 3ie Impact Evaluation Report 49. Leiby, K, Connor, A, Tsague, L, Sapele, C, Koanga, A, Kakaire, J and Wang, P, 2016.
Assessing the impact of delivering messages through intimate partners to create demand for voluntary medical male circumcision in Uganda, 3ie Impact Evaluation Report 48. Semeere, AS, Bbaale, DS, Castelnuovo, B, Kiragga, A, Kigozi, J, Muganzi, A, Kambugu, A and Coutinho, AG, 2016.
Optimising the use of economic interventions to increase demand for voluntary medical male circumcision in Kenya, 3ie Impact Evaluation Report 47. Thirumurthy, H, Omanga, E, Rao, SO, Murray, K, Masters, S and Agot, K, 2016.
The impact of earned and windfall cash transfers on livelihoods and conservation in Sierra Leone, 3ie Impact Evaluation Report 46. Bulte, E, Conteh, B, Kontoleon, A, List, J, Mokuwa, E, Richards, P, Turley, T and Voors, M, 2016.
Property tax experiment in Pakistan: Incentivising tax collection and improving performance, 3ie Impact Evaluation Report 45. Khan, A, Khwaja, A and Olken, B, 2016.
Impact of mobile message reminders on tuberculosis treatment outcomes in Pakistan, 3ie Impact Evaluation Report 44. Mohammed, S, Glennerster, R and Khan, A, 2016.
Making networks work for policy: Evidence from agricultural technology adoption in Malawi, 3ie Impact Evaluation Report 43. Beaman, L, BenYishay, A, Fatch, P, Magruder, J and Mobarak, AM, 2016.
Estimating the impact and cost-effectiveness of expanding access to secondary education in Ghana, 3ie Impact Evaluation Report 42. Dupas, P, Duflo, E and Kremer, M, 2016.
Evaluating the effectiveness of computers as tutors in China, 3ie Impact Evaluation Report 41. Mo, D, Bai, Y, Boswell, M and Rozelle, S, 2016.
Micro entrepreneurship support programme in Chile, 3ie Impact Evaluation Report 40. Martínez, CA, Puentes, EE and Ruiz-Tagle, JV, 2016.
Thirty-five years later: evaluating the impacts of a child health and family planning programme in Bangladesh, 3ie Impact Evaluation Report 39. Barham, T, Kuhn, R, Menken, J and Razzaque, A, 2016.
Effectiveness of a rural sanitation programme on diarrhoea, soil-transmitted helminth infection and malnutrition in India, 3ie Impact Evaluation Report 38. Clasen, T, Boisson, S, Routray, P, Torondel, B, Bell, M, Cumming, O, Ensink, J, Freeman, M and Jenkins, M, 2016.
Evaluating the impact of vocational education vouchers on out-of-school youth in Kenya, 3ie Impact Evaluation Report 37. Hicks, JH, Kremer, M, Mbiti, I and Miguel, E, 2016.
51
Removing barriers to higher education in Chile: evaluation of peer effects and scholarships for test preparation, 3ie Impact Evaluation Report 36. Banerjee, A, Duflo E and Gallego, F, 2016.
Sustainability of impact: dimensions of decline and persistence in adopting a biofortified crop in Uganda, 3ie Impact Evaluation Report 35. McNiven, S, Gilligan, DO and Hotz, C 2016.
A triple win? The impact of Tanzania’s Joint Forest Management programme on livelihoods, governance and forests, 3ie Impact Evaluation Report 34. Persha, L and Meshack, C, 2016.
The effect of conditional transfers on intimate partner violence: evidence from Northern Ecuador, 3ie Impact Evaluation Report 33. Hidrobo, M, Peterman, A and Heise, L, 2016.
The effect of transfers and preschool on children’s cognitive development in Uganda, 3ie Impact Evaluation Report 32. Gillian, DO and Roy, S, 2016.
Can egovernance reduce capture of public programmes? Experimental evidence from India’s employment guarantee, 3ie Impact Evaluation Report 31. Banerjee, A, Duflo, E, Imbert, C, Mathew, S and Pande, R, 2015.
Improving maternal and child health in India: evaluating demand and supply strategies, 3ie Impact Evaluation Report 30. Mohanan, M, Miller, G, Forgia, GL, Shekhar, S and Singh, K, 2016.
Smallholder access to weather securities in India: demand and impact on production decisions, 3ie Impact Evaluation Report 28. Ceballos, F, Manuel, I, Robles, M and Butler, A, 2015.
What happens once the intervention ends? The medium-term impacts of a cash transfer programme in Malawi, 3ie Impact Evaluation Report 27. Baird, S, Chirwa, E, McIntosh, C and Özler, B, 2015.
Validation of hearing screening procedures in Ecuadorian schools, 3ie Impact Evaluation Report 26. Muñoz, K, White, K, Callow-Heusser, C and Ortiz, E, 2015.
Assessing the impact of farmer field schools on fertilizer use in China, 3ie Impact Evaluation Report 25. Burger, N, Fu, M, Gu, K, Jia, X, Kumar, KB and Mingliang, G, 2015.
The SASA! study: a cluster randomised trial to assess the impact of a violence and HIV prevention programme in Kampala, Uganda, 3ie Impact Evaluation Report 24. Watts, C, Devries, K, Kiss, L, Abramsky, T, Kyegombe, N and Michau, L, 2014.
Enhancing food production and food security through improved inputs: an evaluation of Tanzania’s National Agricultural Input Voucher Scheme with a focus on gender impacts, 3ie Impact Evaluation Report 23. Gine, X, Patel, S, Cuellar-Martinez, C, McCoy, S and Lauren, R, 2015.
A wide angle view of learning: evaluation of the CCE and LEP programmes in Haryana, 3ie Impact Evaluation Report 22. Duflo, E, Berry, J, Mukerji, S and Shotland, M, 2015.
52
Shelter from the storm: upgrading housing infrastructure in Latin American slums, 3ie Impact Evaluation Report 21. Galiani, S, Gertler, P, Cooper, R, Martinez, S, Ross, A and Undurraga, R, 2015.
Environmental and socioeconomic impacts of Mexico’s payments for ecosystem services programme, 3ie Impact Evaluation Report 20. Alix-Garcia, J, Aronson, G, Radeloff, V, Ramirez-Reyes, C, Shapiro, E, Sims, K and Yañez-Pagans, P, 2015.
A randomised evaluation of the effects of an agricultural insurance programme on rural households’ behaviour: evidence from China, 3ie Impact Evaluation Report 19. Cai, J, de Janvry, A and Sadoulet, E, 2014.
Impact of malaria control and enhanced literacy instruction on educational outcomes among school children in Kenya: a multi-sectoral, prospective, randomised evaluation, 3ie Impact Evaluation Report 18. Brooker, S and Halliday, K, 2015.
Assessing long-term impacts of conditional cash transfers on children and young adults in rural Nicaragua, 3ie Impact Evaluation Report 17. Barham, T, Macours, K, Maluccio, JA, Regalia, F, Aguilera, V and Moncada, ME, 2014.
The impact of mother literacy and participation programmes on child learning: evidence from a randomised evaluation in India, 3ie Impact Evaluation Report 16. Banerji, R, Berry, J and Shortland, M, 2014.
A youth wage subsidy experiment for South Africa, 3ie Impact Evaluation Report 15. Levinsohn, J, Rankin, N, Roberts, G and Schöer, V, 2014.
Providing collateral and improving product market access for smallholder farmers: a randomised evaluation of inventory credit in Sierra Leone, 3ie Impact Evaluation Report 14. Casaburi, L, Glennerster, R, Suri, T and Kamara, S, 2014.
Scaling up male circumcision service provision: results from a randomised evaluation in Malawi, 3ie Impact Evaluation Report 13. Thornton, R, Chinkhumba, J, Godlonton, S and Pierotti, R, 2014.
Targeting the poor: evidence from a field experiment in Indonesia, 3ie Impact Evaluation Report 12. Atlas, V, Banerjee, A, Hanna, R, Olken, B, Wai-poi, M and Purnamasari, R, 2014.
An impact evaluation of information disclosure on elected representatives’ performance: evidence from rural and urban India, 3ie Impact Evaluation Report 11. Banerjee, A, Duflo, E, Imbert, C, Pande, R, Walton, M and Mahapatra, B, 2014.
Truth-telling by third-party audits and the response of polluting firms: Experimental evidence from India, 3ie Impact Evaluation Report 10. Duflo, E, Greenstone, M, Pande, R and Ryan, N, 2013.
No margin, no mission? Evaluating the role of incentives in the distribution of public goods in Zambia, 3ie Impact Evaluation Report 9. Ashraf, N, Bandiera, O and Jack, K, 2013.
53
Paying for performance in China’s battle against anaemia, 3ie Impact Evaluation Report 8. Zhang, L, Rozelle, S and Shi, Y, 2013.
Social and economic impacts of Tuungane: final report on the effects of a community-driven reconstruction programme in the Democratic Republic of Congo, 3ie Impact Evaluation Report 7. Humphreys, M, Sanchez de la Sierra, R and van der Windt, P, 2013.
The impact of daycare on maternal labour supply and child development in Mexico, 3ie Impact Evaluation Report 6. Angeles, G, Gadsden, P, Galiani, S, Gertler, P, Herrera, A, Kariger, P and Seira, E, 2014.
Impact evaluation of the non-contributory social pension programme 70 y más in Mexico, 3ie Impact Evaluation Report 5. Rodríguez, A, Espinoza, B, Tamayo, K, Pereda, P, Góngora, V, Tagliaferro, G and Solís, M, 2014.
Does marginal cost pricing of electricity affect groundwater pumping behaviour of farmers? Evidence from India, 3ie Impact Evaluation Report 4. Meenakshi, JV, Banerji, A, Mukherji, A and Gupta, A, 2013.
The GoBifo project evaluation report: Assessing the impacts of community-driven development in Sierra Leone, 3ie Impact Evaluation Report 3. Casey, K, Glennerster, R and Miguel, E, 2013.
A rapid assessment randomised-controlled trial of improved cookstoves in rural Ghana, 3ie Impact Evaluation Report 2. Burwen, J and Levine, DI, 2012.
The promise of preschool in Africa: A randomised impact evaluation of early childhood development in rural Mozambique, 3ie Impact Evaluation Report 1. Martinez, S, Naudeau, S and Pereira, V, 2012.

In Pakistan, one of the key challenges to delivering public services is the inability of the local governments to raise adequate resources, especially through taxation. The social compact between citizen and state, whereby citizens pay taxes in return for services, seems to be broken. Authors of this impact evaluation examine if strengthening the link between local tax collection and urban services can increase citizens’ willingness to pay for services, improve service delivery, and enhance local politics.
Impact Evaluation Series
International Initiative for Impact Evaluation 202-203, Rectangle One D-4, Saket District Centre New Delhi – 110017 India
[email protected] Tel: +91 11 4989 4444
www.3ieimpact.org