Embed Size (px)
Citation preview
International Review of Economics and Finance 16 (2007) 255–271
www.elsevier.com/locate/iref
Reassessing the evidence of an emerging yen block in
North and Southeast AsiaB
Colm Kearney a,T, Cal Muckley b
a School of Business Studies and Institute for International Integration Studies, Trinity College Dublin, Irelandb School of Business Studies, Trinity College Dublin, Ireland
Received 13 March 2003; received in revised form 13 September 2004; accepted 12 November 2004
Available online 2 May 2005
Abstract
Using weekly observations on 9 Asian currencies from November 1976 to December 2003, we re-examine the
evidence of an emerging yen block in North and Southeast Asia. In contrast to previous research that assumes
instantaneous adjustment of exchange rates by the region’s Central Banks to variations in the world’s main global
currencies, we use a dynamic general-to-specific Newey–West estimation strategy that allows gradual adjustment
and calculation of both short and long run equilibrium responses. We find that there is no de facto yen block, but
although the US dollar remains dominant throughout the region, the yen’s influence is rising amongst a subset of
the currencies since the early 1990s.
D 2005 Elsevier Inc. All rights reserved.
JEL classification: 110203; 110211
Keywords: Exchange rates; Exchange rate systems; Yen block
1. Introduction
The Asian financial crisis of the late 1990s raised many questions about the appropriateness of the
region’s exchange rate systems. Economic and financial researchers have argued that a more coordinated
1059-0560/$ -
doi:10.1016/j.i
B Previous v
Annual Confe
Banking and F
T Correspond
E-mail add
see front matter D 2005 Elsevier Inc. All rights reserved.
ref.2004.11.007
ersions of this paper were presented at seminars in Trinity College Dublin, the Multinational Finance Society
rence in Turin, 2001, the Irish Economic Association Annual Conference in Derry, 2002, and the Australasian
inance Conference in Sydney, December 2003.
ing author. Tel.: + 353 1 6082688; fax: + 353 1 6799503.
ress: [email protected] (C. Kearney ).

C. Kearney, C. Muckley / International Review of Economics and Finance 16 (2007) 255–271256
system of regional exchange rates might have mitigated or even prevented the crisis, and that such a
system could benefit the region in the future. Spurred on by the success of the European Monetary
System (EMS) prior to the introduction of the euro in January 1999, it is interesting to ask whether
Europe’s EMS might have implications for the design of an Asian exchange rate system. In examining
this possibility, it is important to consider whether the Japanese yen could perform a central role in a
more coordinated Asian exchange rate system like that played by the German mark in the EMS. Previous
research on the role of the yen in Asian exchange rate determination includes the work of Frankel
(1991a, 1991b, 1993), Aggarwal and Mougoue (1993, 1996), Frankel and Wei (1994), Kwan (1994), Tse
and Ng (1997), Zhou (1998), Ohno (1999), Gan (2000), McKinnon (2000), Hernandez and Montiel
(2002), and Bowman (2005). These studies employ standard least squares regression and cointegration
techniques alongside a variety of model specifications to determine the extent to which the region’s
currencies tend to follow the yen rather than other global currencies such as the euro (or the German
mark prior to the euro), the UK pound sterling and the US dollar. The researchers have included in their
datasets an extensive list of countries over different time periods, varying degrees of time aggregation
(including daily, weekly, monthly and quarterly data), and different numeraires to overcome the dn�1Tproblem in exchange rate modelling (including the inverse of the consumer price index, the European
currency unit (ECU), the Swiss franc and the US dollar). The more recent studies have also compared the
post-crisis and the pre-crisis periods to examine whether there has been any discernible shift in exchange
rate setting practices in the region. Overall, the literature suggests that although the yen is a significant
currency in the region, the US dollar continues to be the most influential currency, and there is limited
evidence of an emerging yen block over time.
In this paper, we re-examine the evidence of an emerging yen block in North and Southeast Asia. Our
motivation stems from shortcomings in the model specification and parameter estimation procedures that
have been employed in the literature to date that have the potential to lead to incorrect inferences. By
excluding any dynamic adjustment in their models, previous researchers have implicitly assumed that the
monetary authorities in North and Southeast Asia instantaneously align their exchange rates to their
preferred levels in relation to the world’s main currencies. This assumption is questionable, especially in
studies that use low time-aggregated data that is observed either daily or weekly. Central bankers
throughout the world meet at discrete intervals of at least a week to discuss and implement their foreign
exchange policies. They are always concerned to achieve smooth exchange rate movements, and they
consequently tend to adjust their exchange rates gradually to their preferred levels. By failing to
differentiate between short- and long-run multipliers, the existing models are mis-specified with possibly
non-spherical errors. We overcome this by specifying a set of dynamic models that differentiate between
the short- and long-run equilibrium responses of the monetary authorities. We model time variations in 9
Asian currencies (the Chinese yuan, the Hong Kong dollar, the Indonesian rupiah, the Korean won, the
Malaysian ringgit, the Philippine peso, the Singapore dollar, the Taiwan dollar and the Thai baht) in
response to the German mark, the Japanese yen, the UK pound and the US dollar. All our exchange rates
are expressed in terms of the Swiss franc. We estimate our models using a general-to-specific estimation
strategy (see Hendry & Krolzig, 2001) with Newey–West heteroscedastic- and autocorrelation-consistent
significance tests (see Newey & West, 1987). In addition to estimating our models over the whole period
from November 1976 to December 2003, we also present estimates for two contiguous sub-periods, the
first prior to and including 25th May 1990, and the second thereafter to the end of the period.
Our models acquit themselves well in providing a high degree of explanatory power together with
clear results about the responsiveness of the region’s exchange rates to variations in the world’s leading
C. Kearney, C. Muckley / International Review of Economics and Finance 16 (2007) 255–271 257
currencies over the 27 years of our data period. Amongst our main findings are that the US dollar has
been, and continues to be the most important and influential currency in the region throughout our
sample period. This is consistent with most previous researchers, a notable exception being Aggarwal
and Mougue (1996) who use cointegration techniques to conclude that the yen’s influence exceeded that
of the US dollar during the late 1980s and early 1990s.
Importantly, however, we also find that the Japanese yen is increasing its influence on a sub-set of the
currencies considered. This is consistent with the findings of Frankel and Wei (1994), Kwan (1994),
Zhou (1998), and Bowman (2005) among others who note an emerging and significant yen influence as
early as the late 1980s. Subsequent to the Asian crisis Gan (2000), Hernandez and Montiel (2002), and
Bowman (2005) find that the yen has gained influence on some of the region’s currencies, with the
notable exceptions of the Chinese yuan, the Hong Kong dollar and the Malaysian ringgit. The results of
this study corroborate this finding with respect to an increasing (albeit small) yen influence upon the
Korean won, the Philippine peso and the Singapore dollar in the second sub-period investigated. Second,
we find that there has been a noticeable and significant rise in the influence of the US dollar on some of
the region’s currencies, combined with a decline in its influence on only two currencies, namely the
Indonesian rupiah and the Taiwan dollar. This finding is at odds with Bowman (2005) who describes a
declining US dollar influence in the region, more generally, since the Asian crisis in 1997. Third, we find
that the influence of the German mark on the Korean won, the Malaysian ringgit and the Taiwan dollar
has grown significantly over time, which is not surprising in light of the growing trade linkages between
Asia and Europe, while the influence of the UK sterling has diminished to almost zero from a low base.
Overall, therefore, we find that the region continues to behave more like a US dollar block than a yen
block, but that the US dollar influence in the region since the 1990s has been complemented by a
growing influence of the German mark and the Japanese yen.
The remainder of our paper is organised as follows. In Section 2, we describe our dataset, present the
model to be estimated, and establish a number of hypotheses to be tested. Section 3 presents our results.
The final section brings together our main findings and draws together our conclusion that if these trends
continue into the future, the region will begin to look more like a euro–yen–US dollar block rather than a
yen block.
2. Data, model specification and hypothesis tests
Our North and Southeast Asian currencies includes the Chinese yuan, the Hong Kong dollar, the
Indonesian rupiah, the Korean won, the Malaysian ringgit, the Philippine peso, the Singapore dollar, the
Taiwan dollar and the Thai baht. Our world currencies comprises the German mark (the euro since 1st
January 1999), the Japanese yen, the UK pound and the US dollar. All data is obtained from Datastream
International Ltd., and all exchange rates are expressed as units of domestic currency in 1 Swiss franc.
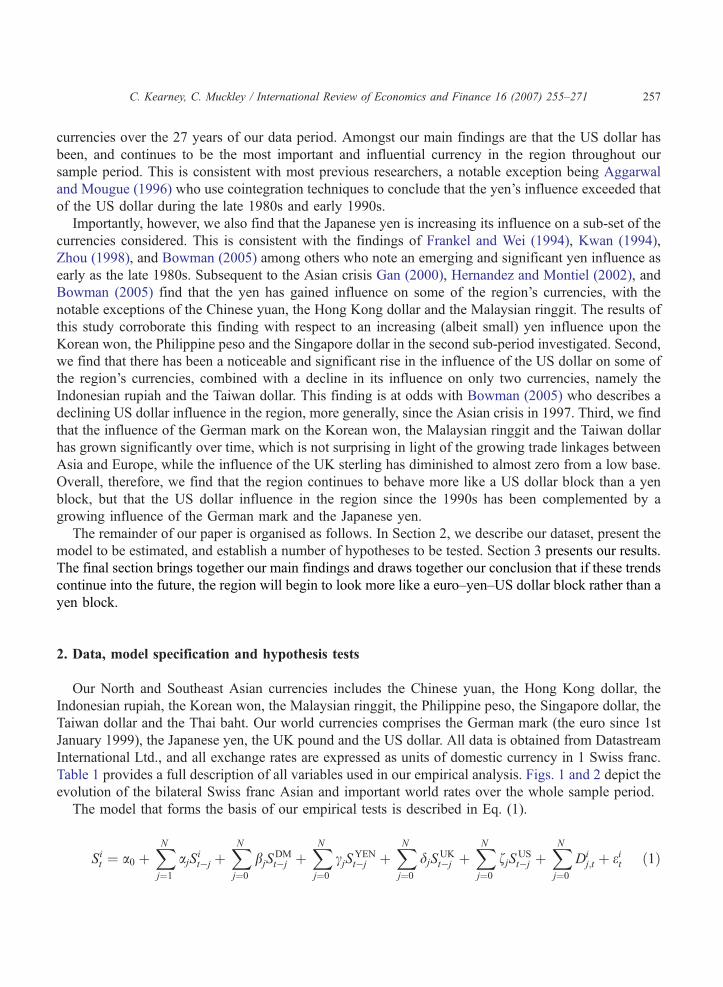
Table 1 provides a full description of all variables used in our empirical analysis. Figs. 1 and 2 depict the
evolution of the bilateral Swiss franc Asian and important world rates over the whole sample period.
The model that forms the basis of our empirical tests is described in Eq. (1).
Sit ¼ a0 þXNj¼1
ajSit�j þ
XNj¼0
bjSDMt�j þ
XNj¼0
cjSYENt�j þ
XNj¼0
djSUKt�j þ
XNj¼0
fjSUSt�j þ
XNj¼0
Dij;t þ eit ð1Þ
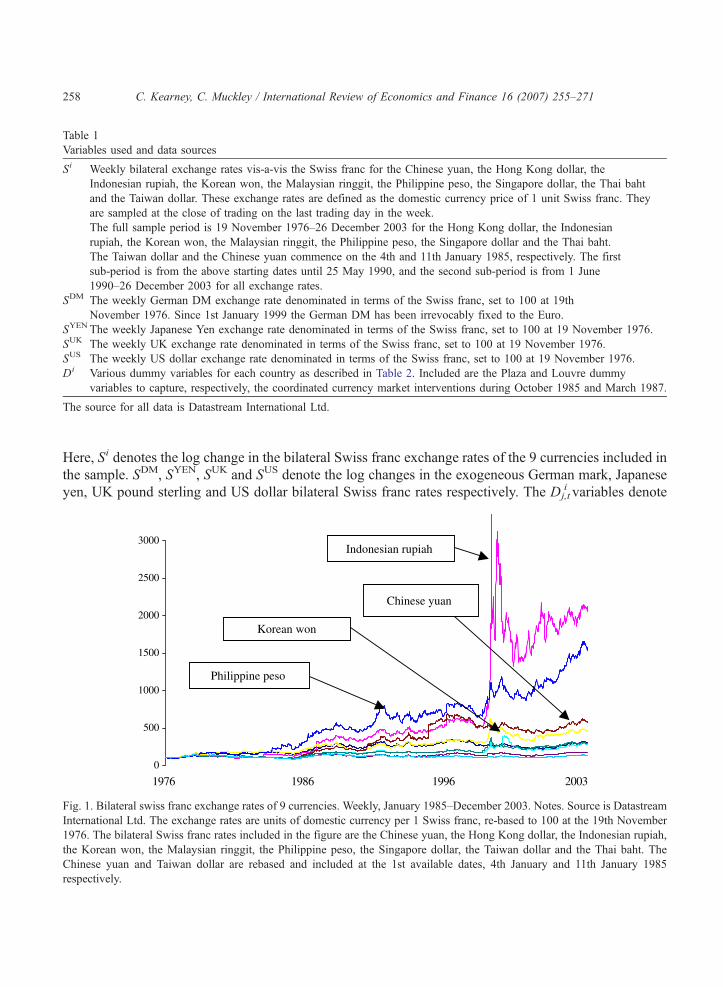
Table 1
Variables used and data sources
Si Weekly bilateral exchange rates vis-a-vis the Swiss franc for the Chinese yuan, the Hong Kong dollar, the
Indonesian rupiah, the Korean won, the Malaysian ringgit, the Philippine peso, the Singapore dollar, the Thai baht
and the Taiwan dollar. These exchange rates are defined as the domestic currency price of 1 unit Swiss franc. They
are sampled at the close of trading on the last trading day in the week.
The full sample period is 19 November 1976–26 December 2003 for the Hong Kong dollar, the Indonesian
rupiah, the Korean won, the Malaysian ringgit, the Philippine peso, the Singapore dollar and the Thai baht.
The Taiwan dollar and the Chinese yuan commence on the 4th and 11th January 1985, respectively. The first
sub-period is from the above starting dates until 25 May 1990, and the second sub-period is from 1 June
1990–26 December 2003 for all exchange rates.
SDM The weekly German DM exchange rate denominated in terms of the Swiss franc, set to 100 at 19th
November 1976. Since 1st January 1999 the German DM has been irrevocably fixed to the Euro.
SYEN The weekly Japanese Yen exchange rate denominated in terms of the Swiss franc, set to 100 at 19 November 1976.
SUK The weekly UK exchange rate denominated in terms of the Swiss franc, set to 100 at 19 November 1976.
SUS The weekly US dollar exchange rate denominated in terms of the Swiss franc, set to 100 at 19 November 1976.
Di Various dummy variables for each country as described in Table 2. Included are the Plaza and Louvre dummy
variables to capture, respectively, the coordinated currency market interventions during October 1985 and March 1987.
The source for all data is Datastream International Ltd.
C. Kearney, C. Muckley / International Review of Economics and Finance 16 (2007) 255–271258
Here, Si denotes the log change in the bilateral Swiss franc exchange rates of the 9 currencies included in
the sample. SDM, SYEN, SUK and SUS denote the log changes in the exogeneous German mark, Japanese
yen, UK pound sterling and US dollar bilateral Swiss franc rates respectively. The Dj,ti variables denote
0
500
1000
1500
2000
2500
3000
1976 1986 1996 2003
Indonesian rupiah
Korean won
Chinese yuan
Philippine peso
Fig. 1. Bilateral swiss franc exchange rates of 9 currencies. Weekly, January 1985–December 2003. Notes. Source is Datastream
International Ltd. The exchange rates are units of domestic currency per 1 Swiss franc, re-based to 100 at the 19th November
1976. The bilateral Swiss franc rates included in the figure are the Chinese yuan, the Hong Kong dollar, the Indonesian rupiah,
the Korean won, the Malaysian ringgit, the Philippine peso, the Singapore dollar, the Taiwan dollar and the Thai baht. The
Chinese yuan and Taiwan dollar are rebased and included at the 1st available dates, 4th January and 11th January 1985
respectively.
0
100
200
300
1976 1980 1985 1990 1995 2003
German mark
US dollar
Pound sterling
Japanese yen
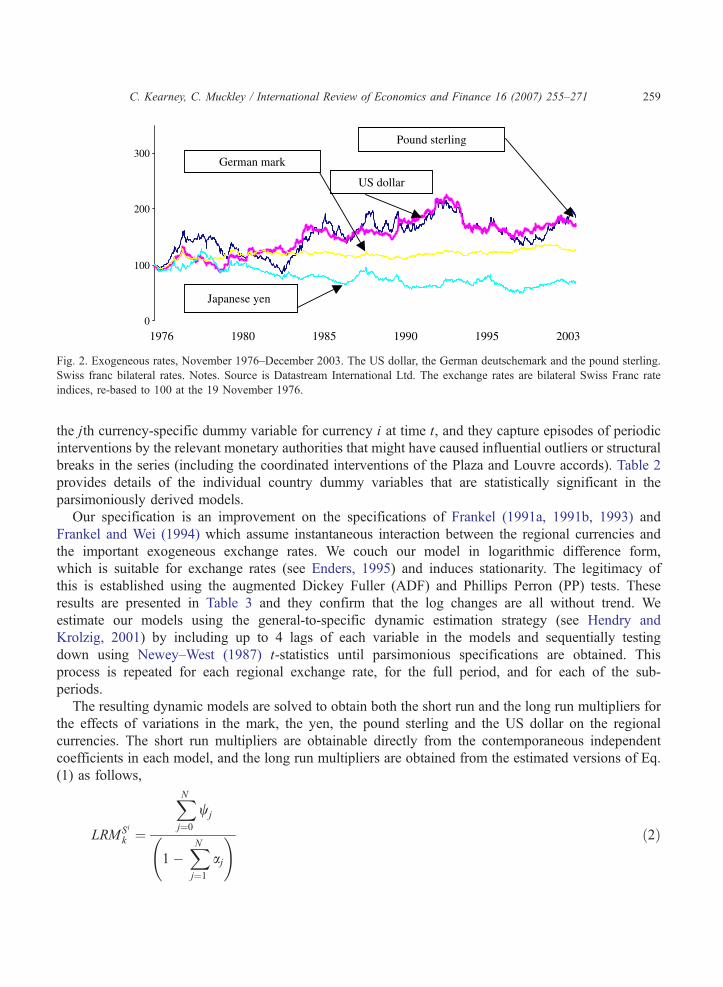
Fig. 2. Exogeneous rates, November 1976–December 2003. The US dollar, the German deutschemark and the pound sterling.
Swiss franc bilateral rates. Notes. Source is Datastream International Ltd. The exchange rates are bilateral Swiss Franc rate
indices, re-based to 100 at the 19 November 1976.
C. Kearney, C. Muckley / International Review of Economics and Finance 16 (2007) 255–271 259
the jth currency-specific dummy variable for currency i at time t, and they capture episodes of periodic
interventions by the relevant monetary authorities that might have caused influential outliers or structural
breaks in the series (including the coordinated interventions of the Plaza and Louvre accords). Table 2
provides details of the individual country dummy variables that are statistically significant in the
parsimoniously derived models.
Our specification is an improvement on the specifications of Frankel (1991a, 1991b, 1993) and
Frankel and Wei (1994) which assume instantaneous interaction between the regional currencies and
the important exogeneous exchange rates. We couch our model in logarithmic difference form,
which is suitable for exchange rates (see Enders, 1995) and induces stationarity. The legitimacy of
this is established using the augmented Dickey Fuller (ADF) and Phillips Perron (PP) tests. These
results are presented in Table 3 and they confirm that the log changes are all without trend. We
estimate our models using the general-to-specific dynamic estimation strategy (see Hendry and
Krolzig, 2001) by including up to 4 lags of each variable in the models and sequentially testing
down using Newey–West (1987) t-statistics until parsimonious specifications are obtained. This
process is repeated for each regional exchange rate, for the full period, and for each of the sub-
periods.
The resulting dynamic models are solved to obtain both the short run and the long run multipliers for
the effects of variations in the mark, the yen, the pound sterling and the US dollar on the regional
currencies. The short run multipliers are obtainable directly from the contemporaneous independent
coefficients in each model, and the long run multipliers are obtained from the estimated versions of Eq.
(1) as follows,
LRMSi
k ¼
XNj¼0
wj
1�XNj¼1
aj
! ð2Þ

Table 2
Dummy variables used in the exchange rate models
D1 D2 D3 D4 D5 D6 Plaza Louvre
Panel A: Full sample period
China 05/03/85 07/18/86 12/22/89 01/07/94 03/06/87
Hong Kong 09/23/83 05/12/95 09/22/95 10/04/85 03/06/87
Indonesia 04/08/83 09/19/86 01/30/98 01/23/98 01/09/98 10/04/85 03/06/87
Korea 02/01/80 03/29/85 08/02/85 10/04/85 03/06/87
Malaysia 02/20/81 10/10/97 01/09/98 01/23/98 01/30/98 10/30/98 03/06/87
Philippines 01/12/79 10/14/83 06/15/84 02/28/86 07/11/97 10/04/85 03/06/87
Singapore 02/20/81 06/19/98 03/06/87
Taiwan 05/03/85 09/13/85 09/27/85 04/28/89 05/12/95 11/07/97 10/04/85
Thailand 11/09/84 09/27/85 10/31/97 01/09/98 03/13/98 10/04/85 03/06/87
Panel B: Sample period 1
China 05/03/85 10/04/85 07/18/86 12/22/89
Hong Kong 09/23/83 10/04/85 03/06/87
Indonesia 04/08/83 09/19/86 10/04/85
Korea 02/01/80 03/29/85 08/02/85 10/04/85 03/06/87
Malaysia 02/20/81 10/04/85
Philippines 01/12/79 10/14/83 06/15/84 02/28/86 10/04/85 03/06/87
Singapore 02/20/81 03/06/87
Taiwan 09/13/85 09/27/85 04/28/89 10/04/85 03/06/87
Thailand 11/09/84 09/27/85 10/04/85 03/06/87
Panel C: Sample period 2
China 01/07/94
Hong Kong 05/12/95
Indonesia 01/30/98 01/23/98 01/09/98
Korea 12/12/97 01/09/98 01/30/98
Malaysia 10/10/97 01/09/98 01/23/98 01/30/98 10/30/98
Philippines 07/11/97
Singapore 06/19/98
Taiwan 05/12/95
Thailand 10/31/97 01/09/98 03/13/98
The Plaza dummy variable takes account of the Plaza Accord on the 4th October 1985 aimed at halting the rise of the US dollar.
The Louvre dummy takes account of the Louvre Accord on 6th March 1987 and is aimed at stablishing the foreign exchange
value of the US dollar. Significant dummies are also included in the Malaysian dollar equations for the 2nd April, the 28th May
and the 3rd September 1999. All printed dummies are statistically significant at the 5% level.
C. Kearney, C. Muckley / International Review of Economics and Finance 16 (2007) 255–271260
where k=DM, YEN, UK and US, and w=b, c, d and f in Eq. (1). Eq. (2) tells us the equilibrium
responses of each regional exchange rate to variations in the exogeneous rates. We test eight hypotheses
about the coefficients of the model for each regional exchange rate.
Hypothesis 1.
H01: LRMDM
Si
=0, which implies that changes in the value of the German mark exchange rate do not
impact significantly upon the regional exchange rate;
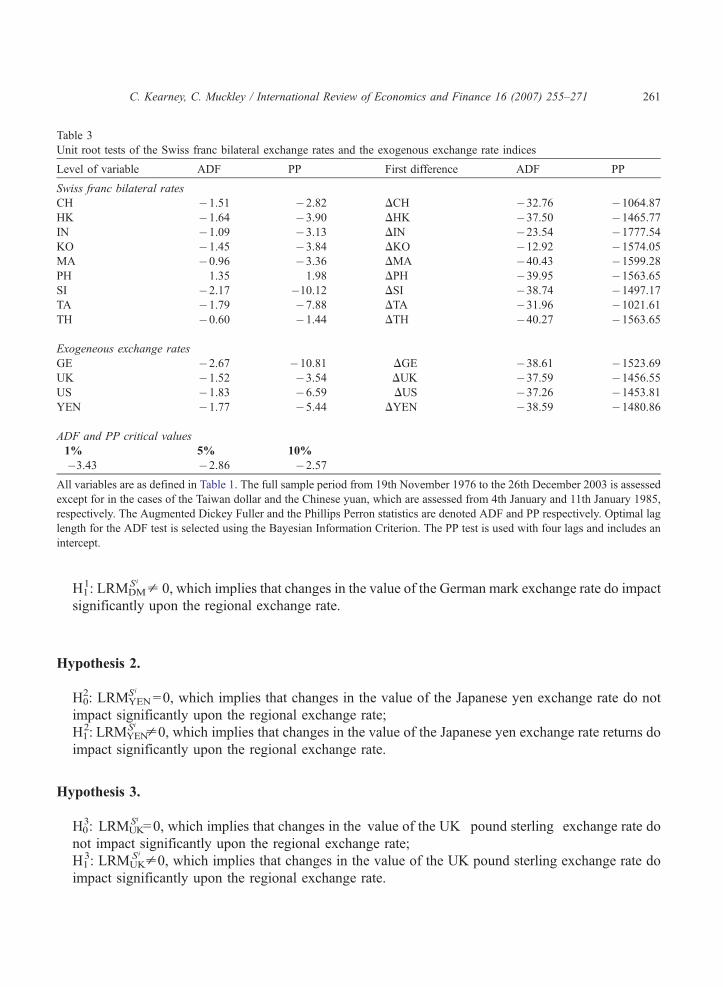
Table 3
Unit root tests of the Swiss franc bilateral exchange rates and the exogenous exchange rate indices
Level of variable ADF PP First difference ADF PP
Swiss franc bilateral rates
CH �1.51 �2.82 DCH �32.76 �1064.87
HK �1.64 �3.90 DHK �37.50 �1465.77
IN �1.09 �3.13 DIN �23.54 �1777.54
KO �1.45 �3.84 DKO �12.92 �1574.05
MA �0.96 �3.36 DMA �40.43 �1599.28
PH 1.35 1.98 DPH �39.95 �1563.65
SI �2.17 �10.12 DSI �38.74 �1497.17
TA �1.79 �7.88 DTA �31.96 �1021.61
TH �0.60 �1.44 DTH �40.27 �1563.65
Exogeneous exchange rates
GE �2.67 �10.81 DGE �38.61 �1523.69
UK �1.52 �3.54 DUK �37.59 �1456.55
US �1.83 �6.59 DUS �37.26 �1453.81
YEN �1.77 �5.44 DYEN �38.59 �1480.86
ADF and PP critical values
1% 5% 10%
�3.43 �2.86 �2.57
All variables are as defined in Table 1. The full sample period from 19th November 1976 to the 26th December 2003 is assessed
except for in the cases of the Taiwan dollar and the Chinese yuan, which are assessed from 4th January and 11th January 1985,
respectively. The Augmented Dickey Fuller and the Phillips Perron statistics are denoted ADF and PP respectively. Optimal lag
length for the ADF test is selected using the Bayesian Information Criterion. The PP test is used with four lags and includes an
intercept.
C. Kearney, C. Muckley / International Review of Economics and Finance 16 (2007) 255–271 261
H11: LRMDM
Si
p 0, which implies that changes in the value of the German mark exchange rate do impact
significantly upon the regional exchange rate.
Hypothesis 2.
H02: LRMYEN
Si
=0, which implies that changes in the value of the Japanese yen exchange rate do not
impact significantly upon the regional exchange rate;
H12: LRMYEN
Si p 0, which implies that changes in the value of the Japanese yen exchange rate returns do
impact significantly upon the regional exchange rate.
Hypothesis 3.
H03: LRMUK
Si =0, which implies that changes in the value of the UK pound sterling exchange rate do
not impact significantly upon the regional exchange rate;
H13: LRMUK
Si
p 0, which implies that changes in the value of the UK pound sterling exchange rate do
impact significantly upon the regional exchange rate.
C. Kearney, C. Muckley / International Review of Economics and Finance 16 (2007) 255–271262
Hypothesis 4.
H04: LRMUS
Si
=0, which implies that changes in the value of the US dollar exchange rate do not impact
significantly upon the regional exchange rate;
H14: LRMUS
Si
p 0, which implies that changes in the value of the US dollar exchange rate do impact
significantly upon the regional exchange rate.
Hypothesis 5.
H05: The LRMDM
Si
which is estimated from the second sub-period is less than that which is estimated
from the first sub-period, which implies that changes in the value of the German mark exchange rate
are impacting less over time on the regional exchange rate;
H15: The LRMDM
Si
which is estimated from the second sub-period is equal to or greater than that
estimated
from the first sub-period, which implies that changes in the value of the German mark exchange rate
are impacting the same or greater over time on the regional exchange rate.
Hypothesis 6.
H06: The LRMYEN
Si
which is estimated from the second sub-period is less than that which is estimated
from the first sub-period, which implies that changes in the value of the Japanese yen exchange rate
are impacting less over time on the regional exchange rate;
H16: The LRMYEN
Si
which is estimated from the second sub-period is equal to or greater than that
estimated from the first sub-period, which implies that changes in the value of the Japanese yen
exchange rate are impacting the same or greater over time on the regional exchange rate.
Hypothesis 7.
H07: The LRMUK
Si
which is estimated from the second sub-period is less than that which is estimated
from the first sub-period, which implies that changes in the value of the pound sterling exchange rate
are impacting less over time on the regional exchange rate;
H17:TheLRMUK
Si
which is estimated from the second sub-period is equal to or greater than that estimated
from the first sub-period, which implies that changes in the value of the pound sterling exchange rate
are impacting the same or greater over time on the regional exchange rate.
Hypothesis 8.
H08: The LRMUS
Si
which is estimated from the second sub-period is less than that which is estimated
from the first sub-period, which implies that changes in the value of the US dollar exchange rate are
impacting less over time on the regional exchange rate;
H18: The LRMUS
S i
which is estimated from the second sub-period is equal to or greater than that
estimated from the first sub-period, which implies that changes in the value of the US dollar exchange
rate are impacting the same or greater over time on the regional exchange rate.

C. Kearney, C. Muckley / International Review of Economics and Finance 16 (2007) 255–271 263
These hypotheses are sequenced logically and performed across all 9 regional currencies to examine the
extent to which there exists evidence of an emerging yen block. All our hypotheses are couched in terms of
the equilibrium responses, rather than the instantaneous responses that have been used in past studies. By
allowing for dynamic adjustment over time of each regional currency to variations in the world’s leading
currencies, our tests provide a richer investigation of the extent to which the region’s currencies tend to
follow the yen rather than the other global currencies. If H01 is upheld, it implies that variations in the
German mark do not impact upon the regional bilateral Swiss franc exchange rates under consideration.
This constitutes evidence that is consistent with a possible de facto yen block amongst the currencies in the
region. The same applies to H03 and H0
4 which concern the responses of the regional exchange rates to
variations in the pound sterling and the US dollar. If H02 is upheld, however, it implies that the regional
currencies do not respond to variations in the yen, and this would be inconsistent with a de facto yen block.
The nulls of the last four hypotheses, H05, H0
6, H07 and H0
8 repeat the first four hypotheses on the sub-
samples, and are designed to shed light on whether there is evidence of an emerging yen block over time.
The long run multiplier estimates must be significantly distinguishable from zero in at least one of the sub-
periods for the corresponding hypothesis to contribute to the analysis. If hypotheses 5, 7 and 8 are upheld
and hypothesis 6 is rejected, we conclude that there does exist evidence of an emerging de facto yen block
in the region. Otherwise, we conclude that there is not evidence of the emergence of such a block.
Following Hernandez and Monteil (2002), we acknowledge that regression estimates of currency
basket weights may increase due to (a) a higher weight in the underlying basket the central bank is
targeting, or (b) tighter economic links and a consequently greater coincidence of economic shocks. For
example, in the case where the estimated weights are increasing over time, we do not imply that it is self-
evident that (a) is responsible but rather that either (a) or (b) is responsible, or both. We note, however,
that an increased incidence of common shocks is in itself evidence suggestive of economic integration,
and the latter is requisite to the construction of a sustainable currency block.
3. Results
Table 4 presents our results for the full sample period, and Tables 5 and 6 do likewise for the first and
second sub-periods, respectively. The top part of the tables present the short-run coefficient estimates
together with the long run multipliers (LRM) with their heteroscedastic- and autocorrelation-consistent t-
statistics in brackets, and the bottom part of the tables present the equation diagnostics. All printed
coefficients are statistically significant at the 5% level or better. The diagnostics include the R2 statistics,
the standard errors of the estimates (SEE), the Chow test for structural stability, the Durbin Watson (DW)
statistics which test for first order autocorrelation, the Kolmogorov statistic (KS) which is a general test for
whether an empirical distribution comes from an hypothesized distribution—in this case the normal
distribution, the LM statistic which tests for higher order autocorrelation, and the ARCH test for
heteroscedasticity.
3.1. Full sample period
Looking firstly at the results for the full sample period in Table 4, the explanatory power of the
models is quite good, given that we are modelling the log differences of exchange rates. The R2 statistics
indicate that the models explain at least half the variation in the exchange rates of all 9 countries, and
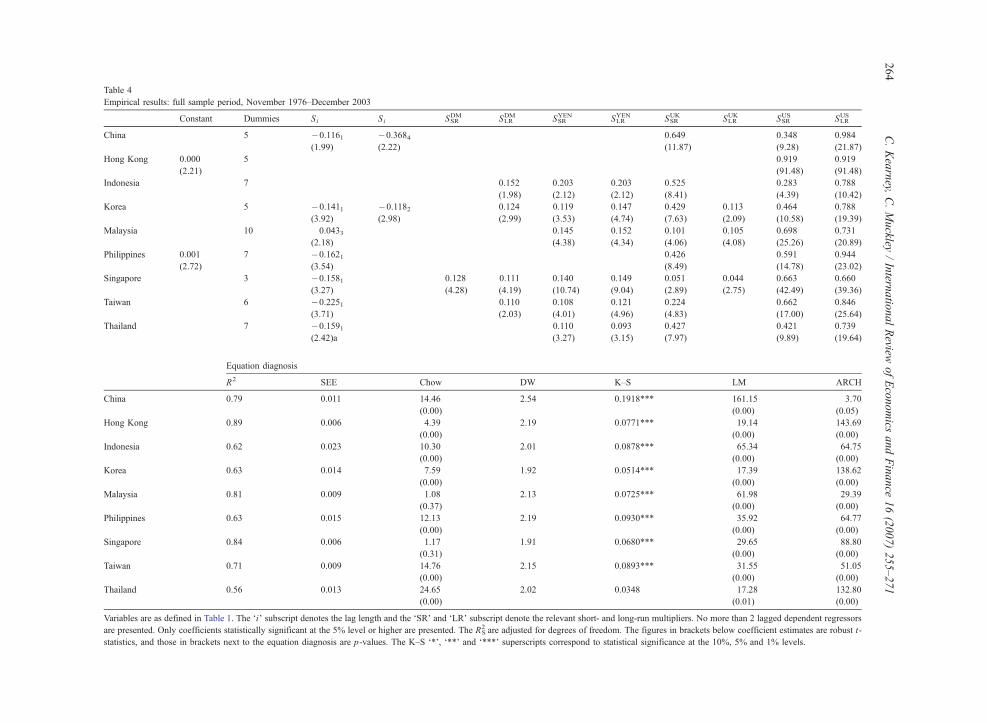
Table 4
Empirical results: full sample period, November 1976–December 2003
Constant Dummies Si Si SDMSR SDMLR SYENSR SYENLR SUKSR SUKLR SUSSR SUSLR
China 5 �0.1161(1.99)
�0.3684(2.22)
0.649
(11.87)
0.348
(9.28)
0.984
(21.87)
Hong Kong 0.000
(2.21)
5 0.919
(91.48)
0.919
(91.48)
Indonesia 7 0.152
(1.98)
0.203
(2.12)
0.203
(2.12)
0.525
(8.41)
0.283
(4.39)
0.788
(10.42)
Korea 5 �0.1411(3.92)
�0.1182(2.98)
0.124
(2.99)
0.119
(3.53)
0.147
(4.74)
0.429
(7.63)
0.113
(2.09)
0.464
(10.58)
0.788
(19.39)
Malaysia 10 0.0433(2.18)
0.145
(4.38)
0.152
(4.34)
0.101
(4.06)
0.105
(4.08)
0.698
(25.26)
0.731
(20.89)
Philippines 0.001
(2.72)
7 �0.1621(3.54)
0.426
(8.49)
0.591
(14.78)
0.944
(23.02)
Singapore 3 �0.1581(3.27)
0.128
(4.28)
0.111
(4.19)
0.140
(10.74)
0.149
(9.04)
0.051
(2.89)
0.044
(2.75)
0.663
(42.49)
0.660
(39.36)
Taiwan 6 �0.2251(3.71)
0.110
(2.03)
0.108
(4.01)
0.121
(4.96)
0.224
(4.83)
0.662
(17.00)
0.846
(25.64)
Thailand 7 �0.1591(2.42)a
0.110
(3.27)
0.093
(3.15)
0.427
(7.97)
0.421
(9.89)
0.739
(19.64)
Equation diagnosis
R2 SEE Chow DW K–S LM ARCH
China 0.79 0.011 14.46
(0.00)
2.54 0.1918*** 161.15
(0.00)
3.70
(0.05)
Hong Kong 0.89 0.006 4.39
(0.00)
2.19 0.0771*** 19.14
(0.00)
143.69
(0.00)
Indonesia 0.62 0.023 10.30
(0.00)
2.01 0.0878*** 65.34
(0.00)
64.75
(0.00)
Korea 0.63 0.014 7.59
(0.00)
1.92 0.0514*** 17.39
(0.00)
138.62
(0.00)
Malaysia 0.81 0.009 1.08
(0.37)
2.13 0.0725*** 61.98
(0.00)
29.39
(0.00)
Philippines 0.63 0.015 12.13
(0.00)
2.19 0.0930*** 35.92
(0.00)
64.77
(0.00)
Singapore 0.84 0.006 1.17
(0.31)
1.91 0.0680*** 29.65
(0.00)
88.80
(0.00)
Taiwan 0.71 0.009 14.76
(0.00)
2.15 0.0893*** 31.55
(0.00)
51.05
(0.00)
Thailand 0.56 0.013 24.65
(0.00)
2.02 0.0348 17.28
(0.01)
132.80
(0.00)
Variables are as defined in Table 1. The diT subscript denotes the lag length and the dSRT and dLRT subscript denote the relevant short- and long-run multipliers. No more than 2 lagged dependent regressors
are presented. Only coefficients statistically significant at the 5% level or higher are presented. The RS2 are adjusted for degrees of freedom. The figures in brackets below coefficient estimates are robust t-
statistics, and those in brackets next to the equation diagnosis are p-values. The K–S d*T, d**T and d***T superscripts correspond to statistical significance at the 10%, 5% and 1% levels.
C.Kearney,
C.Muckley
/Intern
atio
nalReview
ofEconomics
andFinance
16(2007)255–271
264
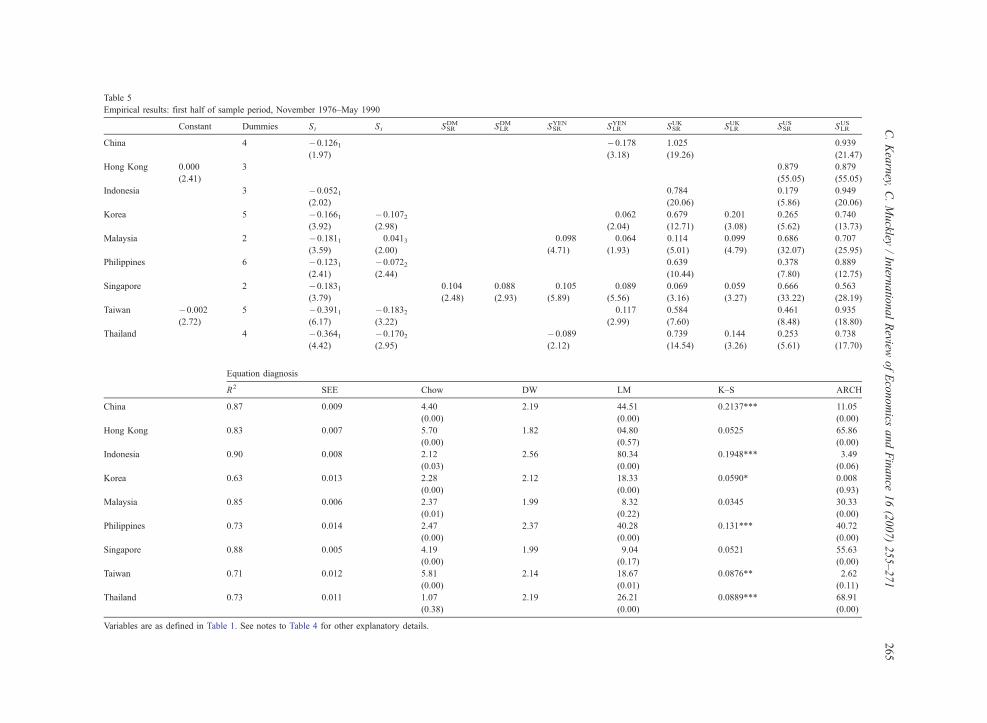
Table 5
Empirical results: first half of sample period, November 1976–May 1990
Constant Dummies Si Si SDMSR SDMLR SYENSR SYENLR SUKSR SUKLR SUSSR SUSLR
China 4 �0.1261(1.97)
�0.178
(3.18)
1.025
(19.26)
0.939
(21.47)
Hong Kong 0.000
(2.41)
3 0.879
(55.05)
0.879
(55.05)
Indonesia 3 �0.0521(2.02)
0.784
(20.06)
0.179
(5.86)
0.949
(20.06)
Korea 5 �0.1661(3.92)
�0.1072(2.98)
0.062
(2.04)
0.679
(12.71)
0.201
(3.08)
0.265
(5.62)
0.740
(13.73)
Malaysia 2 �0.1811(3.59)
0.0413(2.00)
0.098
(4.71)
0.064
(1.93)
0.114
(5.01)
0.099
(4.79)
0.686
(32.07)
0.707
(25.95)
Philippines 6 �0.1231(2.41)
�0.0722(2.44)
0.639
(10.44)
0.378
(7.80)
0.889
(12.75)
Singapore 2 �0.1831(3.79)
0.104
(2.48)
0.088
(2.93)
0.105
(5.89)
0.089
(5.56)
0.069
(3.16)
0.059
(3.27)
0.666
(33.22)
0.563
(28.19)
Taiwan �0.002(2.72)
5 �0.3911(6.17)
�0.1832(3.22)
0.117
(2.99)
0.584
(7.60)
0.461
(8.48)
0.935
(18.80)
Thailand 4 �0.3641(4.42)
�0.1702(2.95)
�0.089
(2.12)
0.739
(14.54)
0.144
(3.26)
0.253
(5.61)
0.738
(17.70)
Equation diagnosis
R2 SEE Chow DW LM K–S ARCH
China 0.87 0.009 4.40
(0.00)
2.19 44.51
(0.00)
0.2137*** 11.05
(0.00)
Hong Kong 0.83 0.007 5.70
(0.00)
1.82 04.80
(0.57)
0.0525 65.86
(0.00)
Indonesia 0.90 0.008 2.12
(0.03)
2.56 80.34
(0.00)
0.1948*** 3.49
(0.06)
Korea 0.63 0.013 2.28
(0.00)
2.12 18.33
(0.00)
0.0590* 0.008
(0.93)
Malaysia 0.85 0.006 2.37
(0.01)
1.99 8.32
(0.22)
0.0345 30.33
(0.00)
Philippines 0.73 0.014 2.47
(0.00)
2.37 40.28
(0.00)
0.131*** 40.72
(0.00)
Singapore 0.88 0.005 4.19
(0.00)
1.99 9.04
(0.17)
0.0521 55.63
(0.00)
Taiwan 0.71 0.012 5.81
(0.00)
2.14 18.67
(0.01)
0.0876** 2.62
(0.11)
Thailand 0.73 0.011 1.07
(0.38)
2.19 26.21
(0.00)
0.0889*** 68.91
(0.00)
Variables are as defined in Table 1. See notes to Table 4 for other explanatory details.
C.Kearney,
C.Muckley
/Intern
atio
nalReview
ofEconomics
andFinance
16(2007)255–271
265
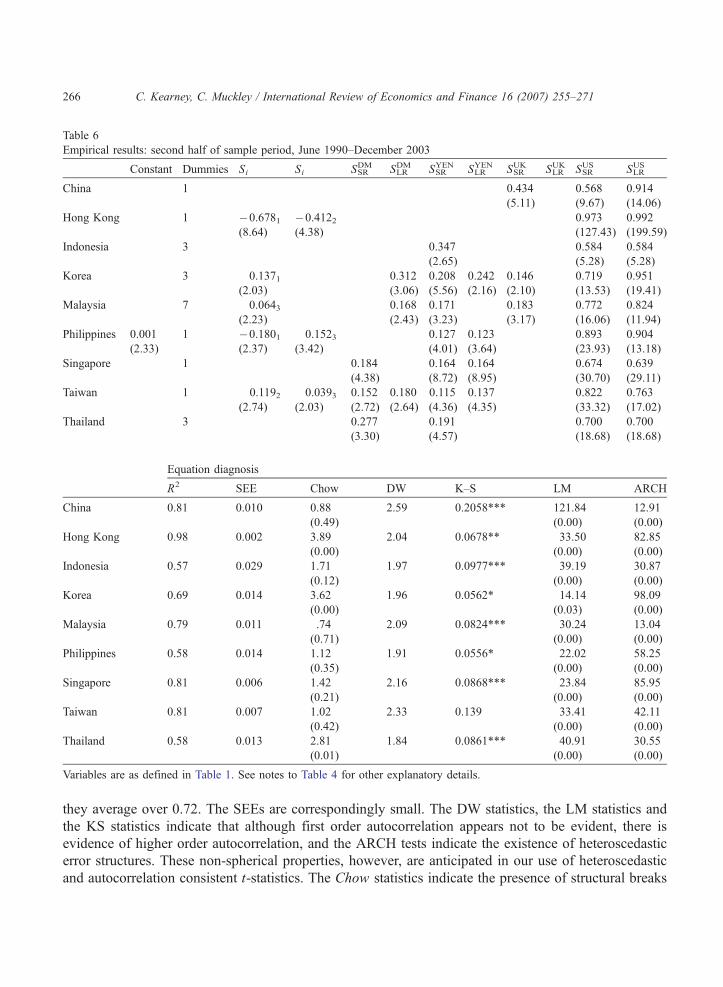
Table 6
Empirical results: second half of sample period, June 1990–December 2003
Constant Dummies Si Si SDMSR SDMLR SYENSR SYENLR SUKSR SUKLR SUSSR SUSLR
China 1 0.434
(5.11)
0.568
(9.67)
0.914
(14.06)
Hong Kong 1 �0.6781(8.64)
�0.4122(4.38)
0.973
(127.43)
0.992
(199.59)
Indonesia 3 0.347
(2.65)
0.584
(5.28)
0.584
(5.28)
Korea 3 0.1371(2.03)
0.312
(3.06)
0.208
(5.56)
0.242
(2.16)
0.146
(2.10)
0.719
(13.53)
0.951
(19.41)
Malaysia 7 0.0643(2.23)
0.168
(2.43)
0.171
(3.23)
0.183
(3.17)
0.772
(16.06)
0.824
(11.94)
Philippines 0.001
(2.33)
1 �0.1801(2.37)
0.1523(3.42)
0.127
(4.01)
0.123
(3.64)
0.893
(23.93)
0.904
(13.18)
Singapore 1 0.184
(4.38)
0.164
(8.72)
0.164
(8.95)
0.674
(30.70)
0.639
(29.11)
Taiwan 1 0.1192(2.74)
0.0393(2.03)
0.152
(2.72)
0.180
(2.64)
0.115
(4.36)
0.137
(4.35)
0.822
(33.32)
0.763
(17.02)
Thailand 3 0.277
(3.30)
0.191
(4.57)
0.700
(18.68)
0.700
(18.68)
Equation diagnosis
R2 SEE Chow DW K–S LM ARCH
China 0.81 0.010 0.88
(0.49)
2.59 0.2058*** 121.84
(0.00)
12.91
(0.00)
Hong Kong 0.98 0.002 3.89
(0.00)
2.04 0.0678** 33.50
(0.00)
82.85
(0.00)
Indonesia 0.57 0.029 1.71
(0.12)
1.97 0.0977*** 39.19
(0.00)
30.87
(0.00)
Korea 0.69 0.014 3.62
(0.00)
1.96 0.0562* 14.14
(0.03)
98.09
(0.00)
Malaysia 0.79 0.011 .74
(0.71)
2.09 0.0824*** 30.24
(0.00)
13.04
(0.00)
Philippines 0.58 0.014 1.12
(0.35)
1.91 0.0556* 22.02
(0.00)
58.25
(0.00)
Singapore 0.81 0.006 1.42
(0.21)
2.16 0.0868*** 23.84
(0.00)
85.95
(0.00)
Taiwan 0.81 0.007 1.02
(0.42)
2.33 0.139 33.41
(0.00)
42.11
(0.00)
Thailand 0.58 0.013 2.81
(0.01)
1.84 0.0861*** 40.91
(0.00)
30.55
(0.00)
Variables are as defined in Table 1. See notes to Table 4 for other explanatory details.
C. Kearney, C. Muckley / International Review of Economics and Finance 16 (2007) 255–271266
they average over 0.72. The SEEs are correspondingly small. The DW statistics, the LM statistics and
the KS statistics indicate that although first order autocorrelation appears not to be evident, there is
evidence of higher order autocorrelation, and the ARCH tests indicate the existence of heteroscedastic
error structures. These non-spherical properties, however, are anticipated in our use of heteroscedastic
and autocorrelation consistent t-statistics. The Chow statistics indicate the presence of structural breaks
C. Kearney, C. Muckley / International Review of Economics and Finance 16 (2007) 255–271 267
in most models, and this motivates our re-estimation of the models in the two sub-periods. Looking next
at the individual coefficient estimates, the constant terms in all but two models (the Hong Kong dollar
and the Philippine peso) are insignificantly different to zero, confirming that the Swiss franc exhibits no
systematic trends vis-a-vis the majority of the regional currencies in our sample. The statistically
significant lagged dependant coefficients in each model are negatively signed which contributes stability,
but the presence of two or more lags in some currencies indicates complex adjustment dynamics in
response to variations in the leading global currencies.
The responses of the Asian currencies to variations in the German mark in Table 4 shows that only the
Singapore dollar exhibits a significant short run coefficient, while the Indonesian rupiah, the Korean won,
the Singapore dollar and the Taiwan dollar exhibit significantly positive long runmultipliers with amean of
0.12. This tells us that for each 1% appreciation in the German mark, the mean equilibrium response of
these currencies is an appreciation of 0.12%.We therefore reject H01 and accept H1
1 for 4 of our 9 currencies.
Looking next at the yen, we see that 6 of the regional currencies’ short run coefficients are positive and
significant with a mean value of 0.14, and the same number of long run multipliers is also positive and
significant with the same mean value. This leads us to reject H02 and accept H1
2 for 6 of the regional rates.
Although the UK pound sterling looks to be influential from an inspection of its short run coefficients (of
which all but the Hong Kong dollar are positive and significant), allowing for lagged adjustment reveals
that only 3 currencies (the Korean won, the Malaysian ringgit and the Singapore dollar) exhibit significant
long run coefficients with a mean value of 0.09. We therefore reject H03 and accept H1
3 for 3 of our 9
currencies. The influence of the UK pound sterling in the region is relatively weak. Looking finally at the
US dollar, all the short run coefficients are positively signed and statistically significant with a mean value
of 0.56, varying from a low of 0.28 for the Indonesian rupiah to a high of 0.92 for the Hong Kong dollar.
The long run coefficients are also all positively signed and significant with a mean value of 0.82, and they
vary from a low of 0.66 for the Singapore dollar to a high of 0.98 for the Chinese yuan. This indicates that
for each 1% appreciation in the US dollar exchange rate, the mean equilibrium response of the regional
currencies is an appreciation of 0.82%. We therefore reject H04 and accept H1
4 for all 9 currencies. In
summary, it appears from our full sample estimates that the region’s currencies form a US dollar block
rather than a yen block, with the Chinese yuan, the Philippine peso, and the Hong Kong dollar all having
long run multipliers above 0.90, followed by Taiwan with a long run multiplier of 0.85. The Malaysian
ringgit, the Singapore dollar and the Thai baht are most independent from the US dollar insofar as they all
have long run multipliers less than 0.75. Interestingly, these same three currencies all have statistically
significant long run multipliers in response to the yen, the first two have statistically significant long run
multipliers in response to the pound sterling, while the Singapore dollar also has a significant long run
response to the mark.
3.2. Sub-periods
Our results for the sub-periods, obtained by dividing our full sample in half, are presented in Tables 5
and 6. We use heteroscedastic consistent t-statistics to test the significance of the difference between the
long-run multipliers between the sub-periods. The first point to note from these tables is that the overall
behaviour of the models as measured by their diagnostic statistics remains comparable to the full sample
behaviour. The explanatory power of the models remains similar over the sub-periods, ranging from a
mean R2 of 79% in the first sub-period to 74% in the second sub-period. There is, however, a
preponderance of dummy variables in the first sub-period (34) in contrast to the second (21), and the

C. Kearney, C. Muckley / International Review of Economics and Finance 16 (2007) 255–271268
Chow tests indicate that structural breaks are apparent in all currencies except the Thai baht in the first
sub-period while in the second sub-period structural breaks are found only in the Thai baht, the Hong
Kong dollar and the Korean won rates. Taken together, the dummy variables and structural break tests
point to smoother currency adjustments in the region since May 1990, and this may indicate the
emergence of a more sophisticated set of exchange rate policies in the region. This is despite the Asian
financial crisis in the latter period.
As before, we first examine the influence of the German mark. Only the Singapore dollar has a
significant short-run coefficient in the first sub-period, and in the second sub-period, the Singapore
dollar, the Taiwan dollar and the Thai baht are significant. The mean of the long run multipliers is 0.09 in
the first sub-period (with only the Singapore dollar being significant) and 0.22 in the second sub-period
(with the Korean won, the Malaysian ringgit and the Taiwan dollar being significant). This implies a rise
in both the extent and the magnitude of the German mark’s influence in the region, and we reject H05 and
accept H15 for 3 currencies, the Korean won, the Malaysian ringgit and the Taiwan dollar. The Japanese
yen has 3 significant short run coefficients in the first sub-period (the Malaysian ringgit, the Singapore
dollar and the Thai baht which is negatively signed), but it has 7 significant short run coefficients in the
second sub-period (all currencies except the Chinese yuan and the Hong Kong dollar). The mean of the
long run multipliers is 0.10 in the first sub-period (ignoring the negative sign on the Chinese yuan) and
0.16 in the second sub-period, and the increases are significant for the Korean won, the Philippine peso
and the Singapore dollar. In the cases of the Chinese yuan and the Malaysian ringgit, the declines in the
mean equilibrium responses are also significant. We therefore reject the null hypothesis, H06, and accept
the alternate hypothesis, H16, for 4 currencies, the Korean won, the Philippine peso, the Singapore dollar
and the Taiwan dollar. Looking next at the UK pound sterling, all short run coefficients except the Hong
Kong dollar are significant in the first sub-period, but only the Chinese yuan, the Korean won and the
Malaysian ringgit are significant in the second sub-period. The mean of the short run coefficients in the
first sub-period is 0.58, and this falls to less than half its value to 0.26 during the second sub-period. The
mean of the 4 statistically significant long run multipliers in the first sub-period is 0.13, and no long run
multipliers are significant in the second sub-period. We therefore reject H07 and accept H1
7 for all
currencies in our sample.
Looking finally at the sub-period responsiveness of the regional bilateral rates to variations in the US
dollar, all short run coefficients are positively signed and statistically significant in both the first and
second sub-periods, except for the Chinese yuan in the first sub-period. The mean of the short run
coefficients is 0.47 during the first sub-period, varying from a low of 0.18 for the Indonesian rupiah to a
high of 0.88 for the Hong Kong dollar. This rises to a mean of 0.75 during the later sub-period, varying
from a low of 0.57 for the Chinese yuan to a high of 0.97 for the Hong Kong dollar. It is noticeable that
while the average of the estimated short run coefficients on the impact of the US dollar on the regional
bilateral rates rises by 60% between the sub-periods, the short run coefficients also rise for each
individual exchange rate. Interestingly, all the long-run multipliers are also positive and statistically
significant in both sub-periods, with a mean of 0.81 in the first period and 0.86 in the second period. The
long run multipliers rise significantly for the Hong Kong dollar, the Korean won, the Singapore dollar
and the Malaysian ringgit, and they decline significantly for the Indonesian rupiah and the Taiwan dollar.
We therefore reject H08 and accept H1
8 for 7 currencies.
We can summarise the findings of our sub-period investigations as showing an increase in the
influence of the mark, the yen and the US dollar, combined with the virtual ending of any influence
from the pound sterling. The mark is gaining influence on the Korean won, the Taiwan dollar and the

C. Kearney, C. Muckley / International Review of Economics and Finance 16 (2007) 255–271 269
Malaysian ringgit. The yen is gaining influence on the Korean won, the Philippine peso and the
Singapore dollar. Noticeably, however, the yen does not influence the Chinese yuan (ignoring the
negative multiplier in the first sub-period) or the Hong Kong dollar in the full sample or in either sub-
sample, and it does not influence the Indonesian rupiah or the Thai baht in either sub-sample. The US
dollar continues to be the most influential global currency in the region, with long run multipliers
above 0.90 in the second sub-period for the Chinese yuan, the Hong Kong dollar and the Philippine
peso, with increasing influence on the Korean won and the Malaysian ringgit, and with declining
influence on the Indonesian rupiah and the Taiwan dollar. Our results demonstrate the unequivocal
nature of the exchange rate policies followed by the monetary authorities of China and Hong Kong in
closely following the US dollar. These currencies, along with the Korean won and the Philippine peso
continue to form a strong US dollar block, with the other currencies following the US dollar to a
lesser extent. Although there is some evidence of a growing influence of the yen on a minority of the
currencies in our sample, there is no hard evidence of an emerging yen block. We can demonstrate
the force of this result by comparing some of the long run multipliers for the Yen and the US dollar in
the most recent sub-period of our analysis. The US dollar’s smallest long run multiplier (0.58 on the
Indonesian rupiah) is almost 2.5 times the size of the yen’s largest multiplier (of 0.24 on the Korean
won), and the average of the US dollar’s 4 smallest long run multipliers (0.67) is over 4 times the
average of the yen’s 4 largest multipliers (0.17).
4. Conclusions
A significant body of literature has emerged over the past decade that investigates the extent to which
the more important regional currencies in North and Southeast Asia tend to follow the Japanese yen
rather than the other important global currencies such as the German mark (more recently the euro), the
UK pound sterling and the US dollar. Researchers have investigated different datasets for different
currencies, and understandably, they have obtained different results. Overall, however, this literature
suggests that the yen is a significant currency in the region, that the US dollar continues to be the most
influential currency, and that there is limited evidence of an emerging yen block over time. In this paper,
we have re-examined the evidence of an emerging yen block in North and Southeast Asia, allowing for a
more dynamic adjustment process through which the region’s Central Banks adjust their exchange rates
in response to movements in the important global currencies. We estimated a set of dynamic models that
differentiate between the short- and long-run equilibrium responses of the region’s 9 most important
currencies (the Chinese yuan, the Hong Kong dollar, the Indonesian rupiah, the Korean won, the
Malaysian ringgit, the Philippine peso, the Singapore dollar, the Taiwan dollar and the Thai baht) to
movements in the German mark, the Japanese yen, the UK pound and the US dollar. We estimated our
models using a general-to-specific estimation strategy with Newey–West heteroscedastic- and
autocorrelation-consistent significance tests. In addition to estimating our models over the whole
period from November 1976 to December 2003, we also presented estimates for two contiguous sub-
periods, the first prior to and including 25th May 1990, and the second thereafter to the end of the period.
Our results point to a pervasive and dominant influence of the US dollar throughout the region,
particularly regarding the Chinese yuan, the Hong Kong dollar and the Malaysian ringgit, but also with
respect to the other currencies in our sample. This is accompanied by an emerging role for the mark, and a
marked decline in the influence of the pound sterling. We find that the yen remains an influential currency
C. Kearney, C. Muckley / International Review of Economics and Finance 16 (2007) 255–271270
in the region, with the long runmultipliers of the Koreanwon, the Philippine peso, the Singapore dollar and
the Taiwan dollar all suggesting a significant yen influence in the latter sub-period. It is interesting to note
how the results of our analysis incorporating lagged adjustment of the region’s exchange rates to variations
in the world’s leading currencies differs from the existing literature that assumes instantaneous adjustment
of the region’s currencies to movements in the important global currencies. Considering only the short-run
multipliers tends to underestimate the importance of the German mark and the US dollar in the region,
because the short run effects are often augmented by the long run multipliers. In contrast to this, however,
considering only the short-run multipliers tends to overestimate the influence of the UK pound sterling
because the lagged effects tend to erode the short run influence.
So is there an emerging yen block in North and Southeast Asia? Our evidence suggests clearly not.
Rather, this region continues to follow the US dollar much closer than any other currency. Although
there is some evidence of a greater influence of the yen on a minority of the region’s currencies, the
magnitude of this influence remains very small relative to that of the US dollar.
Acknowledgements
Many helpful comments are appreciated. Colm Kearney acknowledges financial assistance from the
Irish Research Council for the Humanities and Social Sciences, and Cal Muckley acknowledges
financial assistance from Anglo Irish Bank.
References
Aggarwal, R., & Mougoue, M. (1993). Cointegration among Southeast Asian currencies—preliminary evidence of a yen block?
Economics Letters, 41, 161–166.
Aggarwal, R., & Mougoue, M. (1996). Cointegration among Asian currencies: Evidence of the increasing influence of the
Japanese yen. Japan and the World Economy, 8, 291–308.
Bowman, C. (2005). Yen block or Koala block? Currency relationships after the East Asian crisis. Japan and the World
Economy.
Enders, W. (1995). Applied econometric time-series. John Wiley & Sons.
Frankel, J. A. (1991a). Japanese finance in the 1980’s: A survey. In P. R. Krugman (Ed.), Trade with Japan: Has the door
opened wider? University of Chicago Press.
Frankel, J. A. (1991b). Is a yen block forming in Pacific Asia? AMEX Bank Review, Finance and the International Economy 5:
The AMEX Bank Review Prize, Essays in Memory of Robert Marjolin. Oxford University Press.
Frankel, J. A. (1993). Is Japan creating a yen block in East Asia and the Pacific? In J. A. Frankel, & M. Kahler (Eds.),
Regionalism and rivalry: Japan and the United States in Pacific Asia (pp. 53–85). Chicago7 University of Chicago
Press.
Frankel, J., & Wei, S. (1994). Yen block or dollar block? Exchange rate policies of the East Asian economies. In T. Ito, & A. O.
Krueger (Eds.), Macroeconomic linkages: Savings, exchange rates and capital flows (pp. 295–329). Chicago7 University of
Chicago Press.
Gan, W. B. (2000). Exchange-rate policy in East Asia after the fall: How much have things changed? Journal of Asian
Economics, 11(4), 403–430.
Hendry, D., & Krolzig, H. (2001). Computer automation of general-to-specific model selection procedures. Journal of
Economic Dynamics and Control, 25, 831–866.
Hernandez, L. & Montiel, P. (2002). Post-crisis exchange rate policy in five Asian countries: Filling in the dhollow middleT?IMF Working Paper, code: WP/01/170.
C. Kearney, C. Muckley / International Review of Economics and Finance 16 (2007) 255–271 271
Kwan, C. H. (1994). Economic independence in the Asia-Pacific region. New York7 Routledge.
McKinnon, Ronald I. (2000). The East Asian dollar standard: Life after death? Economic Notes, 29(1), 31–82.
Newey, W. K., & West, K. D. (1987). A simple, positive semi-definite, heteroscedasticity and autocorrelation consistent
covariance matrix. Econometrica, 55(3), 703–708.
Ohno, K. (1999). Exchange rate management in developing Asia: A reassessment of the pre-crisis soft dollar zone. ADBI
Working Paper, vol. 1. Tokyo7 Asian Development Bank.
Tse, Y. K., & Ng, L. K. (1997). The cointegration of Asian currencies revisited. Japan and the World Economy, 9, 109–114.
Zhou, S. (1998). Exchange rate systems and linkages in the Pacific Basin. Atlantic Economic Journal, 26(1), 66–84.