Embed Size (px)
Citation preview
Jotmud of EXlmrimental Psychology: General Copyright 2000 by the American Psychological Association, Inc. 2000,VoL 129,No. 2, 193-219 0096-3445/00/$5.00 IX)I: 10.1037//0096-3445.129.2.193
Reasoning About Geography
Alinda Friedman and Norman R. Brown University of Alberta
To understand the nature and etiology of biases in geographical judgments, the authors asked people to estimate latitudes (Experiments 1 and 2) and longitudes (Experiments 3 and 4) of cities throughout the Old and New Worlds. They also examined how people's biased geographical judgments change after they receive accurate information ( "seeds" ) about actual locations. Location profiles constructed from the pre- and postseeding location estimates conveyed detailed information about the representations underlying geography knowledge, including the subjective positioning and subregionalization of regions within continents; differential seeding effects revealed between-region dependencies. The findings implicate an important role for conceptual knowledge and plausible-reasoning processes in tasks that use subjective geographical information.
Geographical units like cities, provinces, countries, and continents are almost always irregular in shape and area; in their orientation relative to the cardinal points of the compass; and in their alignment relative to adjacent geo- graphical units. Yet they also fit into a simple hierarchical scheme in which towns and cities are nested within prov- inces, provinces within countries, and countries within continents. It is obvious that people know about the spatial aspects of world geography as well as the hierarchical relations among geopolitical entities, and it is equally obvious that their knowledge is imperfect. What is less clear is how imperfect geographical knowledge is represented and how it is coordinated and weighed when used in making judgments.
The tendency to normalize irregular shapes, combined with the tendency to develop a conceptual understanding of the hierarchical relations between geographical units, im- plies that geographical intuitions can be biased. In this article, we focus on understanding what geographical biases imply about how people encode, store, and use geographical knowledge in making judgments about locations. We take the position that most geographical biases result from plausible-reasoning processes that operate on complex be- liefs about global geography and that few biases result from distortions of perceptually based representations. We con- clude that the "mental map" metaphor is a misleading analogy for the representation of geographical knowledge and that the plausible-reasoning framework can account for much of the data in the subjective geography literature.
We explored the nature of geographical biases by asking
This research was supported by grants from the Natural Sciences and Engineering Research Council of Canada. We thank Ed Comell and Peter Dixon for thorough and thoughtful reading of a draft. We also thank Javier Movellan for suggesting that the seeding method could be used to study subjective geography.
Correspondence concerning this article should be addressed to Alinda Friedman or Norman R. Brown, Department of Psychology, University of Alberta, Edmonton, Alberta, Canada T6G 2E9. Electronic mail may be sent to [email protected] or norman. [email protected].
people to estimate the absolute latitudes (Experiments 1 and 2) or longitudes (Experiments 3 and 4) of cities within different regions. We then determined the extent to which the biases are mutable by "seeding the knowledge base" (Brown & Siegler, 1993, 1996) with accurate information about specific cities at conceptually strategic locations. Finally, we show that by combining the absolute estimation task with the seeding procedure, we can examine the nature of the representation used to generate location estimates and pinpoint which aspects of it are responsible for geographical biases.
In addition to informing us about how people represent and reason about geography, the use of absolute location judgments contributes to the literature on quantitative estima- tion in general. Other domains that have been studied in this literature include dates (W. Friedman, 1993), populations (Brown & Siegler, 1993), and behavioral frequency judg- ments (Blair & Burton, 1987; Conrad, Brown, & Cashman, 1998; Menon, 1993). Each of these domains has made a unique contribution to understanding how real-world esti- mates are made. For example, date estimation has been seminal in providing evidence for the use of reconstructive and plausible-reasoning processes in real-world estimation. Population estimates have been used to demonstrate how availability- or familiarity-based intuitions are integrated with plansible-reasoning processes in a knowledge-rich domain. Behavioral frequency judgments have demon- strated the richness of estimation strategies and the depen- dence of strategy selection on the task-relevant contents of memory. Absolute location judgments add to this set. In particular, the experiments described below uniquely demon- strate that quantitative estimates can be used to obtain detailed information about underlying representations and that the seeding paradigm is capable of revealing the logical codependencies among functional units of knowledge.
In addition to their relevance to the literature on quantita- tive estimation, judgments about geography can be used as a test bed for a range of issues in real-world decision making. They can play this role because decisions about complex domains are often made on the basis of limited information
193
194 FRIEDMAN AND BROWN
from a variety of sources, and geography is an ideal example of such a domain. Moreover, these decisions certainly may be influenced, and thus biased, by how the domain knowl- edge is represented. The general issues addressed here--the nature of the representation of geographical knowledge, the source of bias in geographical judgments, and how different kinds of information are coordinated and weighed--thus apply to a variety of areas, including social cognition, consumer behavior, and risk taking. Consequently, although we think understanding geographical reasoning is important in its own right, the processes underlying geographical decisions may serve as a template for understanding judg- ments and decisions made within other complex domains.
Biases in Geographical Judgments
Traditionally, two sources of bias have been identified for geographical knowledge: perceptually based biases and conceptually based biases. Perceptually based biases have their genesis in the Gestalt principles of good figure (pragnantz), grouping, symmetry, and so on (Pomerantz & Kubovy, 1986; Rock, 1973). The primary cause of geographi- cal illusions has often been attributed to the operation of these Gestalt principles, either at encoding (Carmichael, Hogan, & Walter, 1932; B. Tversky, 1981, 1997; B. Tversky & Schiano, 1989) or in later retrieval processes (Bartlett, 1932; Moar & Bower, 1983) or judgment (B. Tversky, 1997). Operation of Gestalt principals at encoding typically leads to the development of representations in which spatial irregularities between regions or features within regions are simplified (Milgram & Jodelet, 1976), aligned (Glicksohn, 1994; Stevens & Coupe, 1978; B. Tversky, 1981), or made symmetric (Palmer, 1975). Furthermore, items that are a constant distance apart are judged to be closer together when they are perceived to belong to the same region than when they are perceived to belong to different regions (Coren & Girgus, 1980; Hirtle & Mascolo, 1986).
The Alignment Hypothesis
B. Tversky (1981) found evidence for two biases in geographical judgments that we refer to, respectively, as the Miami-Lima illusion and the Chicago--Rome illusion. The Miami-Lima illusion reflects North Americans' erroneous belief that cities on the east coast of the United States, like Miami, are located to the east of cities on the west coast of South America, like Lima, Peru (Miami is actually 3 ° west of Lima). The Chicago-Rome illusion reflects the tendency to believe that some European and northern African cities are located far to the south of their actual locations, when in fact, Chicago and Rome are at the same latitude (42°), as are Philadelphia and Madrid (40°), and so on.
B. Tversky's (1981, 1997) discussion of the Miami-Lima and Chicago-Rome illusions provides an important example of a perceptually based interpretation of biased performance on a geographical judgment task. Specifically, she argued that the illusions result from the use of both an alignment heuristic and a rotation heuristic at encoding. The alignment heuristic produces a "tendency for t h e . . , figures in an array
to line up relative to one another" (1981, p. 409), and the rotation heuristic produces a tendency for a figure to be aligned within a reference frame (see also Glicksohn, 1994; Lloyd, 1989; B. Tversky, 1997). We refer to both of these heuristics as the alignment hypothesis, because, although their precise mechanisms may differ, the effect and its cause are presumed to be the same in both cases: The representa- tion is misaligned with respect to its actual location in the world because it has been "straightened out" with respect to some other reference frame, such as a canonical coordinate system, during one or more encoding episodes.
B. Tversky (1981) proposed that North Americans align (and rotate) South America with respect to North America in the vertical dimension and that they align North America with Europe and South America with Africa in the horizontal dimension. Given the actual locations of these continents, use of these heuristics should produce a seriously distorted representation of the Old and New Worlds. In turn, spatial judgments based on this representation should be strongly biased, with South American locations displaced to the west and European and African locations displaced to the south. Empirical support for this position was provided by a compass-bearing task in which American university students were presented with pairs of city names and were required to draw a line indicating the direction from one city to the other. Five pairs of North American and European cities provided the major evidence for the Chicago--Rome illusion, and three city pairs (as well as a map-placement task) provided evidence for the Miami-Lima illusion. More recently, Glicksohn (1994) used a compass-bearing task to provide evidence for use of the rotation heuristic, by showing that Israeli students tended to misalign cities in the northern part of Israel toward the west by 15 ° , which resulted in the cities' being placed along a north-south axis. In general, then, it seems fair to say that the alignment hypothesis presumes that the sources of geographical illu- sions are perceptually based representations that have been distorted through normalization and that are inspected during the process of making a geographical judgment.
The alignment hypothesis thus incorporates three impor- tant assumptions that have never been directly tested. The most important of these is that perceptually based normaliza- tion mechanisms are responsible for inaccurate beliefs about the relative location of the continents. The second assump- tion follows from the first: Each continent is assumed to be represented in memory as a single unit; biased direction judgments occur because people incorrectly encode the relative locations of whole continents (i.e., they are mis- aligned). Third, the absolute displacement of cities relative to their actual locations should be a direct function of the absolute displacement, in distance and direction, of their superordinate continents (Lloyd, 1989).1
The alignment hypothesis, in itself, does not presume the use of imagery in making geographical judgments, and the most current and comprehensive theory of imagery and its use in processing (Kosslyn, 1994) does not address the alignment hypothesis per s e .
However, images are assumed to carry no explicit meaning, so they must be interpreted, and the interpretation of images uses "exactly
GEOGRAPHICAL REASONING 195
The Plausible-Reasoning Framework
We propose an alternative framework for representing geographical knowledge, in which conceptual factors are the primary source of geographical biases. This approach has its genesis in the notion that not all geographical knowledge is spatial in nature (Hirtle & Jonides, 1985; Hirtle & Mascolo, 1986; McNamara, 1986, 1991; McNamara, Hardy, & Hirtle, 1989; McNamara, Ratcliff, & McKoon, 1984; Montello, 1989; Steven & Coupe, 1978). Instead, the plausible reason- ing approach acknowledges that people have multiple types of task-relevant knowledge (e.g., Collins & Michalski, 1989), that this knowledge is often represented abstractly (e.g., in propositions or networks), and that conceptual, nonspatial knowledge is often used when people reason about world geography. Indeed, there is an abundance of evidence that nonspatial factors influence memory for spatial location. The evidence has been used to argue that even if there is a Euclidean-like representation at the local level, there is also (necessarily) a global level which is by its very nature categorical and non-Euclidean (Hirtle & Hei- dorn, 1993; Hirtle & Jonides, 1985; Hirtle & Mascolo, 1986; Kosslyn, 1994; McNamara et al., 1989; Stevens & Coupe, 1978).
The plausible-reasoning framework is based on the idea that decision making in knowledge-rich domains relies on plausible inferences based on partial knowledge (Brown, 1990; Brown & Siegler, 1993; Collins & Michalski, 1989). On this view, people have various beliefs about a given knowledge domain, and they may retrieve some or all of them to draw inferences about the target dimension. The inferences that are drawn and their plausibility depend on the knowledge that is available. Thus, the available knowl- edge has different affordanees; it allows some inferences to be drawn but not others. Currently, the plausible-reasoning framework is considered to be the primary way in which people estimate dates of real-world events (W. Friedman, 1993). Here, we propose to extend the framework to reasoning about large-scale geography. We assume that the particular aspects of geographical information that are accessed during a judgment form the basis for, and veracity of, the inferences that can be made for that task. Further- more, the particular information that is activated may change as a function of prior knowledge, new knowledge, prior responses, and the task itself, among other things.
The information available to be used for a task restricts the strategy or approach that is taken, and thus, the character and quality of the performance (Brown, 1997). That is, certain kinds of information afford certain types of opera- tions to be conducted and certain types of performance to be observed. For example, if the latitude or longitude of a city happens to be known, then direct retrieval can be used to
the same mechanisms that are used to interpret objects during perception" (Kosslyn, 1994, p. 336). It is presumably through these mechanisms that an image representation could become distorted relative to its referent. Furthermore, categorical spatial relations, such as those between regions, are assumed to be represented as propositions (Kosslyn, 1994, p. 194).
"estimate" its location. In this case, reaction time would be relatively quick and accuracy perfect. However, if the geographical coordinates are unavailable, direct retrieval is ruled out and some other strategy must be used, such as retrieving information about the region to which the city belongs (e.g., Stevens & Coupe, 1978). Similarly, a priori, an imagery- or perceptually based strategy could be used to make a numerical location estimate if that information is available, if it is credible, and if it can be used to generate a numerical estimate. On the other hand, just as with direct retrieval, if the image-based information is unavailable, sparse, or not credible, or if it cannot be readily transformed into a numerical estimate, then some other strategy must be used.
Plausible reasoning certainly can be used to generate location estimates. For example, a person attempting to estimate the latitude of Athens, Greece might know that Greece has a warm climate and that countries with warm climates tend to be close to the equator. This implies that Greece, and hence Athens, is relatively close to the equator. Moreover, because Greece is in Europe and Europe is north of the equator, Athens must also be north of the equator. However, because Greece has a warm climate, it cannot be too far north. Thus, an estimate of 15 ° north might seem reasonable, although it is incorrect (the actual latitude of Athens is 38 ° north). This example illustrates two important points: First, it is possible to generate a location judgment without reference to a spatial representation. Second, it is possible for valid conceptual knowledge to yield systemati- cally biased location estimates.
Now, consider the situation in which knowledge is more sparse, for example, a person attempting to locate Khar- toum, in the Sudan. This individual might know only that the Sudan is in Africa and believe that Africa is in the Southern Hemisphere. These facts, combined with a belief that Africa is generally hot and that hot regions are near the equator, could yield an estimate of, say, 20 ° south latitude (the actual latitude of Khartoum is 16 ° north). A similar lack of knowledge and line of reasoning would lead the person to make similar estimates for many other African cities. The point of this example is that estimates are likely to regress toward some central point when the relevant domain- specific knowledge is sparse. Note that this type of reasoning can yield prototype effects in the absence of a prestored prototype (Posner & Keele, 1968). In other words, it is possible that estimates are biased toward the central value for a region and that this tendency is increasingly strong as item-specific knowledge decreases.
The plausible-reasoning perspective is compatible with the literature on prototype formation and the structure of hierarchical knowledge in both visual and semantic memory (Huttenlocher, Hedges, & Duncan, 1991; Marr, 1981; Ull- man, 1996) and shares some important similarities to a model recently proposed by Huttenlocher and her colleagues (Huttenlocher et al., 1991; Huttenlocher, Hedges, & Pro- haska, 1988). They examined the implications of their model in both a spatial and a nonspatial domain and concluded that biases in spatial judgments reveal when and how people categorize space, rather than revealing how perceptually
196 FRIEDMAN AND BROWN
based representations are distorted. This is because the biases are generated during the process of combining item-level and category-level information in making judgments.
In some earlier work that reached a similar conclusion, Munro and Hirtle (1989) used a connectionist architecture to model the spatial priming results obtained by McNamara (1986; McNamara et al., 1984). In the McNamara studies, observers were faster to respond to locations preceded by locations that were either close in distance or were in the same region, and the two effects were additive. In Munro and Hirfle's (1989) model of these data, the observed bias was attributable to a propositional structure (category nodes) interacting with a Euclidean space (grid nodes). Similarly, Holyoak and Mah (1982) found that intercity distances are overestimated when they are near a reference point (e.g., a coast), compared to when they are not. To explain their data, Holyoak and Mah invoked a categorical level of information in addition to the Euclidean level. In general, because images are assumed to be uninterpreted, effects of categori- cal or hierarchical information must be attributed to a different type of representation. Thus, evidence for the role of categorical information in judgments is typically taken as evidence that the representation used for the judgments is hierarchical (e.g., Stevens & Coupe, 1978).
We are here taking a slightly different tack, in that we do not propose to provide evidence that the representation of geographical knowledge is necessarily hierarchical. Rather, we argue that the information used to make geographical judgments, guesses, and inferences through plausible reason- ing is often nonspatial in nature and that much of the data in the literature can be explained by these processes. Although we argue that the information underlying the judgments is often categorical, inherently nonspatial, and even nongeo- graphical, we remain agnostic as to whether this means that the representation itself is hierarchical (e.g., it could be a feature-based network, wherein category membership is treated like any other feature). McNamara (1991) took a similar point of view when he discussed the possibility of partial hierarchies, in which regions can overlap as well as nest. The important point is that we assume that geographi- cal judgments are, in principle, no different in kind from other types of judgments in knowledge-rich domains, in that a large variety of information from a large number of sources is available to make plausible inferences.
Absolute Locat ion Judgments
To examine how people represent and use geographical knowledge, we asked them to estimate, to the nearest degree, the absolute latitude or longitude of individual cities in the Old and New Worlds. They were reminded of the metric in each case; for example, that latitudes begin at 0 ° at the equator and go to +90 ° at the North Pole and - 9 0 ° at the South Pole. We chose this task because it has several advantages over other tasks that have been used to investi- gate geographical knowledge, including map reproductions (Hirtle & Jonides, 1985; B. Tversky, 1981), bearing esti- mates (Glicksohn, 1994; B. Tversky, 1981), distance judg-
ments (Holyoak & Mall, 1982; Thomdyke, 1981), compara- tive location estimates (Lloyd, 1989; Maki, 1981), and travel time estimates (Montello, 1989). First, absolute location estimates render moot the competence-performance issues inherent in asking people to draw. Second, unlike distance judgments, comparative location estimates, beating esti- mates, and travel time estimates, absolute location judg- ments do not require people either to have or to use knowledge about two different places to make a judgment.
Third, although the absolute location task is novel, it is similar in principle to other quantitative estimation tasks that have been used in both perceptual and conceptual domains; for example, tasks that require people to judge line lengths and other physical dimensions (Welford, 1960), dot loca- tions (Huttenlocher et al., 1991), dates (Brown, 1990), and populations (Brown & Siegler, 1993). In all of these tasks, an observer estimates the value possessed by a single entity on some continuous scale. Consequently, like other quantita- tive estimation tasks, latitude and longitude estimates should reveal biases, context effects, and the like. Moreover, when regions are sampled densely, latitude and longitude esti- mates are capable of conveying detailed information about people's geographical beliefs. This should help determine whether people have an accurate or biased understanding of the general location of a region, whether they divide the region into subregions, whether knowledge about the loca- tion of cities within regions is accurate or is biased by regional knowledge, and what people do when item knowl- edge is sparse.
Fourth, making latitude and longitude estimates is an inherently numerical task. Consequently, to explain perfor- mance on this task, it is necessary to explain how people arrive at their numerical estimates. It might be argued that having people make quantitative estimates forces them to use propositional information. However, a priori, an image- based representation could certainly be used to make a numerical estimate. Indeed, Holyoak and Mah (1982) re- quired observers to make numerical distance estimates and still concluded that an image-based representation was used. Thus, models that rely heavily on spatial representations must then explain how those representations are mapped onto and integrated with a numerical scale to make an estimate, and how and why such estimates become biased.
Plausible Reasoning About Geography
We assumed that absolute location judgments may be biased to the extent that information about a particular city must be reconciled with knowledge about the region to which the city belongs. We focused on cities as the geographical units to be estimated because the location of cities has no spatial extent at the global level, and in this sense, estimating the location of a city is similar to estimating (remembering) the location of a dot in a circle (e.g., Huttenlocher et al., 1991). We assumed that many factors contribute to geographical knowledge and that any or all of them may contribute to a geographical judgment. Consequently, a range of estimation strategies are possible. We assumed that relatively few of these involve reading or
GEOGRAPHICAL REASONING 197
computing locations directly from mental maps or other perceptually based representations.
Most of the assumptions we made about the geographical knowledge people bring to the laboratory are based on simple logic. First, it is clear that people can have knowledge about the hierarchical organization of geographical units without ever looking at a map: In principal, a city is nested within a given geopolitical region. Thus, most North Ameri- cans know that Toronto is in Canada, San Francisco is in the United States, and Marseille is in France. As these examples illustrate, it seems obvious that people also know the continents to which these countries belong, and that they may, in addition, have accurate knowledge about intermedi- ate levels of the hierarchy, such as provinces and states. Moreover, although containment (of cities within states; countries within continents) is an inherently spatial relation, its representation does not have to be. Second, people know that regions are mutually exclusive, although there may be some fuzziness about specific regions (e.g., whether the Middle East belongs to Asia or Africa). Third, geography is a numerically sparse domain for most people; they do not generally know the absolute location of cities or regional boundaries. This implies that they cannot make a location estimate, or for that matter, a comparative location judg- ment, by direct fact retrieval. Nevertheless, people have beliefs about the relative location of some regions with respect to global reference points, such as oceans, the equator, and the Poles, and with respect to other adjacent regions. Fourth, people also have beliefs about the range or size of some regions, and often, those beliefs may be inferred from nonspatial geographical knowledge (e.g., people might derive range assumptions from knowledge that the continental United States has four time zones).
Though we expected people to have little, if any, absolute geographical knowledge about cities, it seemed reasonable to assume that for familiar regions, people would know the relative location of some cities with respect to other cities, their intermediate superordinates, and/or the boundaries of the region. It also seemed reasonable to assume that even within a familiar region, the relative location of some cities is more precisely known than the relative location of others, and that between regions, there are likely to be large discrepancies in the accuracy and precision of the subjective location of some cities with respect to other cities and regional boundaries (Holyoak & Mah, 1982; Maki, 1981). Again, though the information about relative location is spatial in principle, its representational format need not be.
Given these assumptions, there are two general types of situations we should encounter when we ask people to estimate absolute locations: In some cases, we are asking about the location of cities in familiar regions, where information about relative locations is reasonably good (e.g., asking North Americans about locations of cities in North America, and perhaps Western Europe), and in other cases, we are asking about the location of cities in less familiar regions, where information about relative locations is either sparse or nonexistent. In both cases, the objective and subjective adjacencies between regions should influence the
estimates: Boundaries associated with one region have implications for the ranges of the adjacent regions, which then have implications for values assigned to items within those regions. For instance, if a person believes that Mexico is south of the United States, and estimates that Miami, Florida has a latitude of 25 ° north, then necessarily, any estimate for a Mexican City will be less than 25 ° north, even if the person has no specific locational knowledge about any Mexican cities.
When knowledge about the relative locations of cities within a region is good, the absolute estimate task can be performed by defining a numerical range (i.e., an upper and lower bound) for the region, perhaps using global landmarks such as the equator and the oceans, as well as other knowledge, such as the number of time zones in the region or its climate. Then, the items within the region must be placed where they are believed to belong within the range, using the numerical scale implied by the range. The mapping step might involve carving up the range, based on subre- gions or climatic factors; dividing the range in half; or breaking it up based on known or inferred middle levels of the hierarchy, such as states and provinces. So within a known region, we should observe evidence for subregions, as well as boundary effects in the estimated locations of the cities.
When relative knowledge about the location of cities within a region is poor or nonexistent, there is little more than the hierarchical knowledge of the city and its continent, perhaps inferred from things like phonetic properties of names (e.g., North Americans may believe that Sierra Leone is in South America). Nevertheless, to make estimates in less familiar regions, a priori, it is still necessary to select a numerical range, which necessarily implies a numerical central value. However, in this case, the range might be truncated, and the location of cities around the central value should be unrelated to their actual locations and thus highly inaccurate.
The location estimate task thus allows us to examine the nature of the biases that people have in their representations of geographical regions. In Experiment 1, we used absolute latitude estimates of cities in North America, Europe, and northern Africa to examine the Chicago-Rome illusion and to establish the nature of the representation underlying it. In Experiments 2 through 4 we added the seeding task to the procedure, to evaluate what people do when presented with accurate geographical knowledge that is either consistent or inconsistent with their prior beliefs and to provide further evidence for the conceptual nature of the knowledge influenc- ing location estimates and geographical biases. In all four experiments, we analyzed data from only the Canadian-born participants, because geographical knowledge and perspec- tive are related to national origin (Saarinen, 1987).
Exper iment 1
The present experiment was designed to document the existence of within-region, as well as between-region, biases
198 FRIEDMAN AND BROWN
in latitude estimates of cities in the Old and New Worlds. Because we collected data on many cities, we also expected to be able to determine the generali ty of the Ch icago-Rome illusion. For example, i f people maintain the incorrect bel ief that North Amer ica is al igned with Europe, then estimates of the absolute latitudes of most European cities should be biased to the south; i f the location of the whole continent is biased, as a straightforward alignment hypothesis would suggest, then all the estimates for individual cities in Europe should be biased by a similar amount. On the other hand, i f the source of these illusions is conceptual in nature, then we should see patterns in the estimates that reveal, for example, subregional biases, truncation of the range at category boundaries, prototype effects, and the like (McNamara & Diwadkar, 1997), Because a large number of patterns are possible, rather than providing a complete taxonomy of these possibil i t ies here, we focus on those patterns that emerge from the experiment and test hypotheses derived from them in Experiment 2.
M e ~ o d
Participants and design. Data were collected from 60 Univer- sity of Alberta undergraduates who were fulfilling a course requirement. Each individual performed a knowledge rating task and then the latitude estimate task. For each of the tasks, each of the 68 cities, along with its country, appeared one at a time, in a random order, centered on a computer screen.
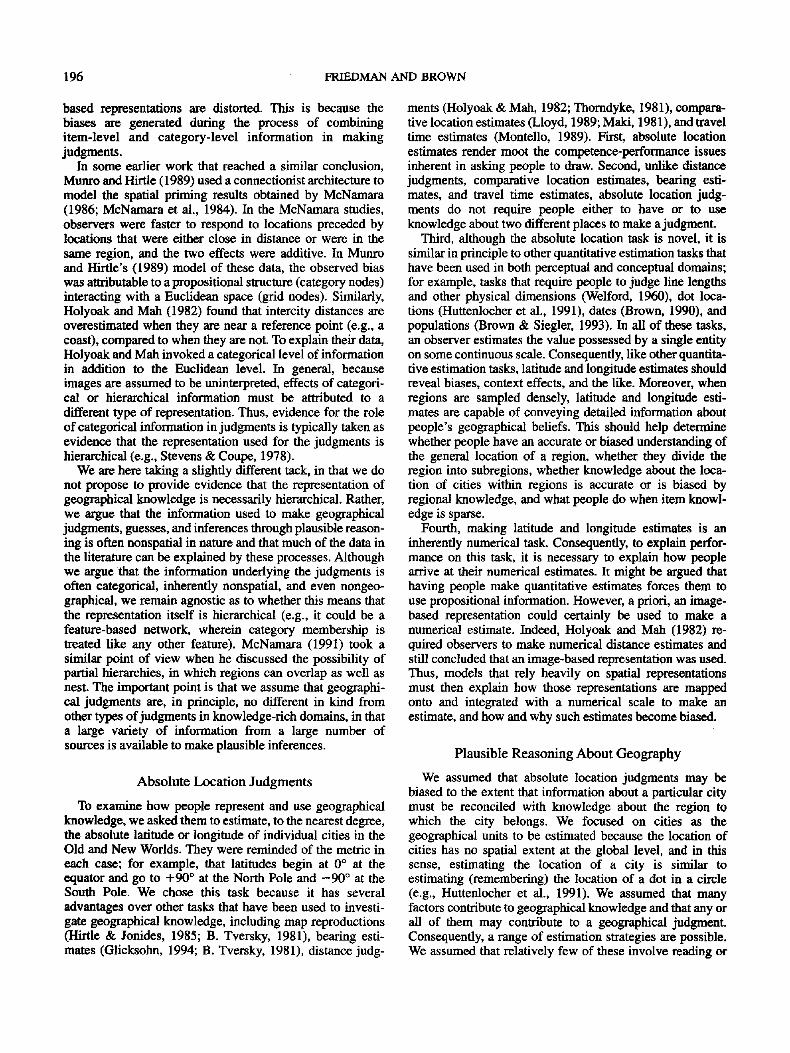
Stimuli. Thirty-four cities from North America (mean lati- tude = 41.3 °) and 34 from Europe and North Africa (mean latitude = 45.8 °) were selected as stimuli. We selected cities that we thought would be relatively well known and cover as full a range of latitudes as possible. The names and latitudes of the stimulus cities are presented in Figure 1.
Procedure. To familiarize the participants with the set of cities they would be estimating and the computer keyboard, we had them rate their knowledge of each city on a scale from 0 (no knowledge) to 9 (a great deal of knowledge). Before they began the latitude estimate task, participants were told that latitudes run from 0 ° at the Equator to +90 ° at the North Pole and - 9 0 ° at the South Pole. They were required to respond to each city with an estimate of its
60
55
50
45
,---- 40 "O
35 tO
, - I
30
25
20
Edmonton
Victoria
~...Oslo
Seattle
Denver
Actual Latitude
Estimated Latitude
~=--- Atlanta Milan
Nice
Lisbon
Tijuana // ]: ~r,,, \ Miami
Athens
J Cairo
Figure 1. Objective location profile of Old and New World cities from Experiment 1. Data are ordered according to the actual latitude of the cities (listed on the abscissa), separately for each hemisphere, from the most northerly at the left to the most southerly at the right.
60
55
50
45
40
35
30
25
20
GEOGRAPHICAL REASONING 199
actual latitude by typing it on the keypad. They indicated whether they believed a given city was north or south of the equator by typing "N" or "S" with each numerical estimate.
Results and Discussion
We computed the average knowledge rating and the average latitude estimate, as well as several accuracy measures, separately for each participant and city. In addi- tion, means were taken for each participant for each measure over all the cities in each region. The average absolute error was computed by taking the absolute value of the difference between the actual and estimated latitude. This measure reflects the overall degree to which judgments for a region are accurate, with more accurate estimates yielding smaller absolute errors. Similarly, the average signed error is the difference in degrees between the estimated latitude of a city and its actual latitude, once again averaged across cities within a given region for each participant, but now keeping the sign of the estimated difference. The degree to which the signed error differs from zero indicates the degree to which the estimates are biased, and the sign indicates the direction of the bias (e.g., positive values indicate that people are biased to place cities to the north of their actual latitude, and negative values mean that the estimates are biased to the south).
In addition to absolute and signed errors, we computed the Spearman rank-order correlation between actual and esti- mated latitudes for each participant and region. These correlations indicate whether people had an accurate under- standing of the relative latitudes of the test cities. Before being subjected to analysis of variance (ANOVA), the rank-order correlations were transformed to z scores; those that are reported in the text and tables are back-transformed from the means of the analyses.
The mean knowledge ratings and accuracy measures for each region across the 60 participants are shown in Table 1. As these data suggest, participants felt they knew more about cities in the New World than cities in the Old World. They were also moderately accurate at locating the cities in both regions, although their absolute and signed errors were smaller for cities in the New World. There was no difference in the rank-order correlations between estimated and actual
Table 1 Knowledge Ratings, Estimated Latitudes, and Accuracy Measures for Experiment 1: New and OM World Cities
New World Old World
Measure M SE M SE t(59)
Knowledge ratings 3.76 0.20 2.14 0.15 9.67*** Latitude (in degrees)
Actual 41.32 45.82 Estimated 41.62 1 .05 43.27 1.09 ns
Error (in degrees) Absolute 8.47 0 . 6 1 11.77 0.53 6.19"** Signed 0.30 1 .05 -2.56 1 .09 2.75**
Rank-order r .81 .04 .79 .05 ns
**p < .01. ***p < .001.
latitudes, indicating that accuracy of relative latitudes was the same for both regions.
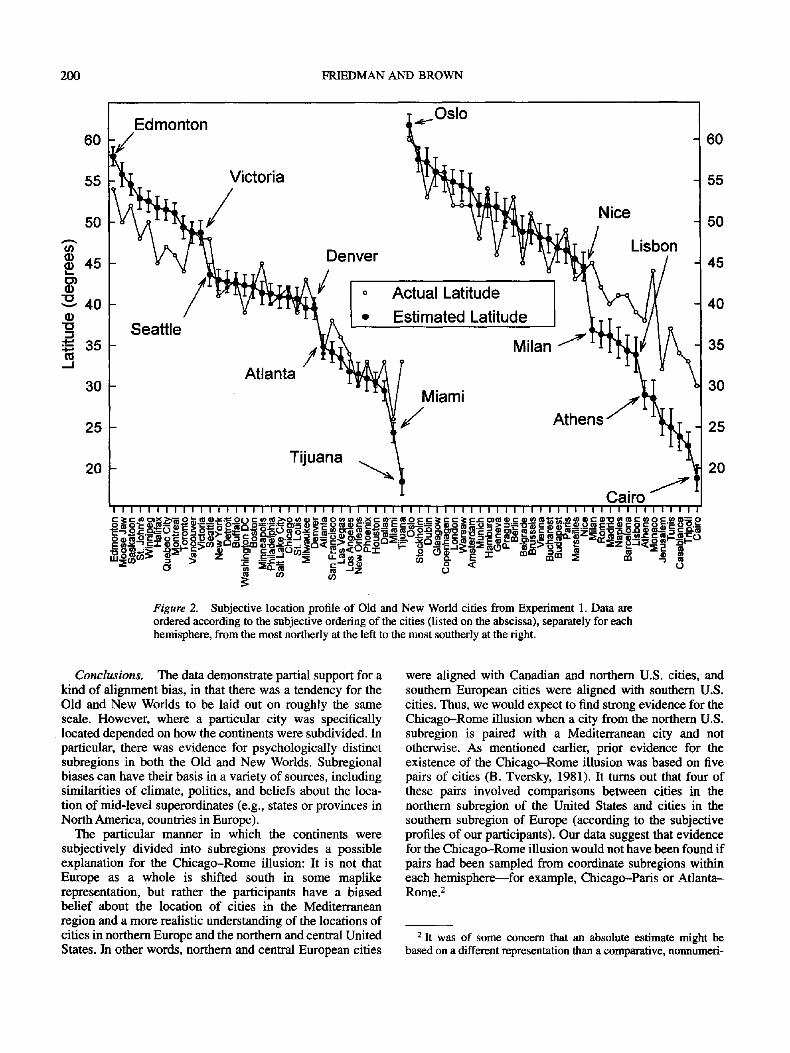
Location profiles. That the average latitude estimates for the New and Old Worlds were virtually identical (41.9 ° vs. 43.1 ° , respectively) might be taken as evidence for the alignment hypothesis, but a more detailed analysis of the data for individual cities indicated otherwise. The mean estimated latitudes computed for each of the 68 cities across the 60 participants are displayed in Figures 1 and 2. In these graphs, latitude is represented on the ordinate, and the particular cities that were estimated are represented on the abscissa. The left panel in each graph shows the data for North American cities, and the fight panel shows the data for cities from the Old World.
We refer to these graphs as location profiles, and they are the main means by which we examine the representations used to make the latitude estimates. Figure 1 shows the objective location profiles for the two hemispheres: The average estimates across observers for the cities within each hemisphere (represented by the black circles) are plotted in order of their actual latitudes (represented by the white circles), from the most northern city (on the left) to the most southern (on the fight). It is clear that participants had reasonably good knowledge of the relative locations of cities in both hemispheres, although some estimates are way off.
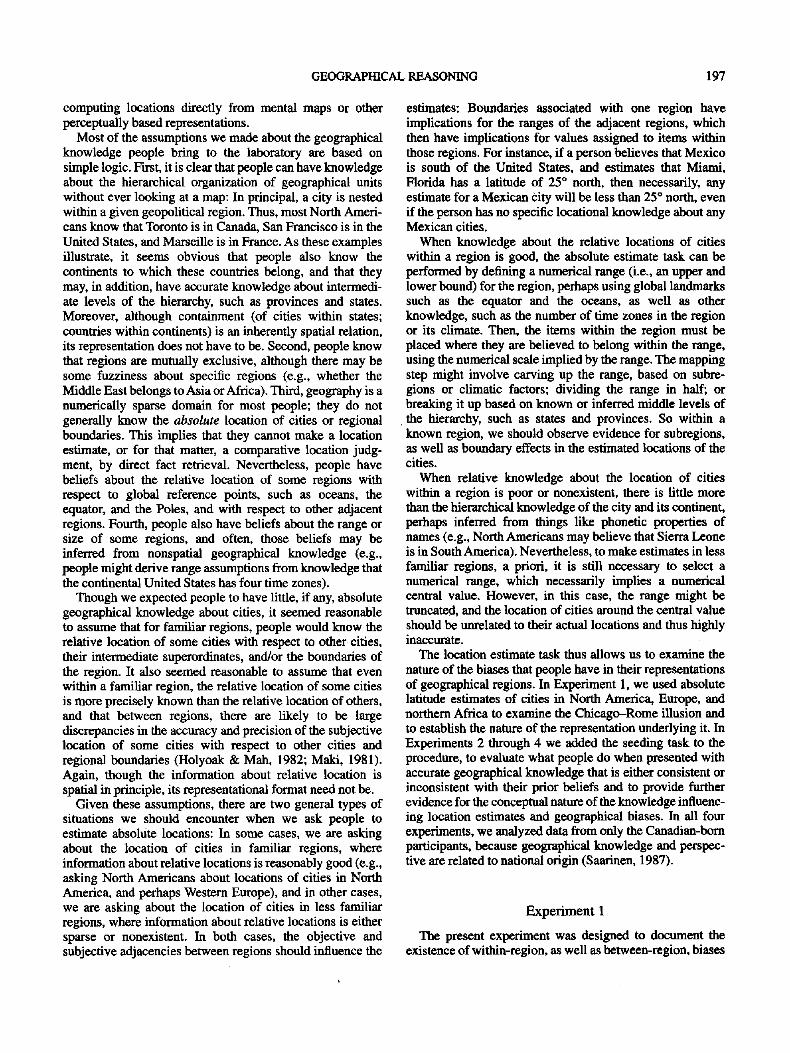
A more revealing way to generate location profiles, and to demonstrate the locus of the biases in the estimates, is to sort the data by subjective latitude, as we have done in Figure 2. In these subjective location profiles, the cities within each hemisphere are plotted, left to fight, from the subjectively most northern to the subjectively most southern.
In Figure 2, it is easy to see that there was a tendency for North America (Canada through northern Mexico) to be laid out on the same scale as Europe and North Africa (to Cairo), which is partial support for the alignment hypothesis. However, it is also easy to see, from the sharp discontinuities in the curves, that participants clearly have subjective geographical categories, subcategories, and regional biases. For example, in North America, there was an obvious break observed between Canada and the United States and be- tween the United States and Mexico. Moreover, within the United States, there were two large subregions: one com- prised of northern cities and one comprised of southern cities. Moreover, almost all the Canadian cities were overes- timated, whereas the single Mexican city sampled was estimated as being much too far south.
In the Old World, there was a sharp break between north-central Europe and the Mediterranean region and another one between southern Europe and northern Africa. Furthermore, latitudes of cities in both southern Europe and northern Africa were very much underestimated. The Euro- pean cities that were particularly underestimated were all Mediterranean: Milan, Rome, Madrid, Naples, Barcelona, Lisbon, and Athens. Interestingly, neither Marseille nor Nice were grouped with the other Mediterranean cities; partici- pants instead grouped them with Paris, presumably reflect- ing the beliefs that Marseille, Nice, and Pads are in France, and France is a country in northern Europe.
200 FRIEDMAN AND BROWN
60
55
50
45
"1o --4 40
35 ,_1
30
25
20
Edmonton O s l o
V i c to r i a
./ Denver
Nice
. / Lisbon,
Seattle
o Actual Latitude • Estimated Latitude
Milan ' ~ '
Miami / Athens " ~
! Atlanta
Tijuana
Cairo 7
~, | ~ ~ ] ~ =.=-figaro ~ = _ - ~ ~ ~,~ oo ~, = ~.t o= ~ =%_E.__= ~ ~ ~, ~ _E~ ~,- =~-~ =-]~.=- r, 8,= =*~ = =- g =- 8 ~.~ ~..o " ~ o r - a , ~ u ,- ~, 5 o m~ ~a : : ' ' "~ N~.. U ~ o -~ ~ m ~a ~ ~ e " ~ ~ ¢ ~ o ~ mca~ ~ - ~ ' ~ m_ ~ , m ~ ,- ~- ~ _os=~.-~ o -O~.o .~ ~ m.~ -~ c ~
Figure 2. Subjective location profile of Old and New World cities from Experiment 1. Data are ordered according to the subjective ordering of the cities (listed on the abscissa), separately for each hemisphere, from the most northerly at the left to the most southerly at the fight.
60
55
50
45
40
35
30
25
20
Conclusions. The data demonstrate partial support for a kind of alignment bias, in that there was a tendency for the Old and New Worlds to be laid out on roughly the same scale. However, where a particular city was specifically located depended on how the continents were subdivided. In particular, there was evidence for psychologically distinct subregions in both the Old and New Worlds. Subregional biases can have their basis in a variety of sources, including similarities of climate, politics, and beliefs about the loca- tion of mid-level superordinates (e.g., states or provinces in North America, countries in Europe).
The particular manner in which the continents were subjectively divided into subregions provides a possible explanation for the Chicago-Rome illusion: It is not that Europe as a whole is shifted south in some maplike representation, but rather the participants have a biased belief about the location of cities in the Mediterranean region and a more realistic understanding of the locations of cities in northern Europe and the northern and central United States. In other words, northern and central European cities
were aligned with Canadian and northern U.S. cities, and southern European cities were aligned with southern U.S. cities. Thus, we would expect to find strong evidence for the Chicago-Rome illusion when a city from the northern U.S. subregion is paired with a Mediterranean city and not otherwise. As mentioned earlier, prior evidence for the existence of the Chicago-Rome illusion was based on five pairs of cities (B. Tversky, 1981). It turns out that four of these pairs involved comparisons between cities in the northern subregion of the United States and cities in the southern subregion of Europe (according to the subjective profiles of our participants). Our data suggest that evidence for the Chicago--Rome illusion would not have been found if pairs had been sampled from coordinate subregions within each hemisphere--for example, Chicago-Paris or Atlanta- Rome. 2
2 It was of some concern that an absolute estimate might be based on a different representation than a comparative, nonnumefi-
GEOGRAPHICAL REASONING 201
In general, then, the data suggest that there is not an alignment bias per se, but rather, a bias to underestimate the latitudes of southern cities in both Europe and North America. It is likely that the basis of this particular bias is due to similarities of climate. The existence of subregions implies further that the representations of both the United States and Europe are nonunitary. Subregionalization owing to nonspatial factors such as climate, is perfectly compatible with a plausible-reasoning approach, but it is difficult to reconcile with a view based on distortions of a maplike representation. It is not that maplike representations cannot be distorted (indeed, they are assumed to be), but the distortions must be due to perceptual causes and not to other kinds of knowledge. Thus, the data from Experiment 1 disconfirm both the second and third assumptions of the alignment hypothesis--that the continents are represented as a unit and that the absolute displacement of cities should be a direct function of the absolute displacement of their superor- dinate continents (Lloyd, 1989). By implication, the data also disconfirm the first assumption--that perceptually based normalization mechanisms are responsible for the distor- tions in the representation.
The existence of subregions may be used as evidence for the kind of categorization effects discussed by Huttenlocher and her colleagues (Huttenlocher et al., 1991; Huttenlocher et al., 1988). If this suggestion is correct, then by judiciously seeding the knowledge base we should be able to shift the estimates for some regions and subregions while leaving the estimates of other regions and subregions intact. Testing this possibility was our main goal in the next experiment.
Exper iment 2
Experiment 1 indicated that the European continent is divided psychologically into at least two regions: north- central Europe and the Mediterranean. The main goal of the second experiment was to provide converging evidence for the psychological validity of these subregions by demonstrat- ing that they can be differentially influenced by new information. That is, we wanted to demonstrate that regional and subregional knowledge play a functional role in geo- graphical judgments. To do so, we explored how the spatial relation between regions was affected by new information about conceptually strategic locations, such as cities located at adjacent borders. We focused on the division between Mediterranean and north-central Europe because we hypoth- esized that the bias to underestimate Mediterranean cities implies that these cities form a functional psychological subregion.
cal judgment. However, we conducted an experiment using a bearing estimate task like B. Tversky's (1981), and replicated Tversky's data with cities from the northern subregion of the United States and the Mediterranean region of Europe, but not with cities from either the two subjectively southern regions or the two subjectively northern regions. Thus, although there are other ways in which the tasks might differ, performance in both tasks is likely to be based on the same representation (A. Friedman, Brown, & McGaffey, 2000).
We first had people estimate the latitudes of 22 European cities and 22 African cities. We then provided the actual latitude of sets of seed cities that were all located at roughly the same latitude but were drawn from different regions. Finally, the participants gave us estimates of all the cities a second time. Before outlining the predictions for the experi- ment, we briefly review the general effect on quantitative estimates of giving people seed facts.
The Logic of Seeding
Prior research using the seeding procedure has demon- strated that exposing people to the actual populations of a few countries greatly improved the accuracy with which they estimated the population of other countries (Brown & Siegler, 1993). Typically, seeding decreased the absolute error of the population estimates. In addition, under some conditions, it also improved the correlation between esti- mated and actual population. Brown and Siegler argued that seeds provide feedback about the accuracy of people's metric beliefs (i.e., their knowledge of the statistical proper- ties of the target dimension--its range, variance, central tendencies, etc.) and that they can also provide the grounds for revising these beliefs.
The location judgment task differs in interesting ways from the population estimate task. One important contrast is that actual populations differ by multiple orders of magni- tude, whereas latitudes and longitudes do not. Thus, Experi- ments 2--4 enabled us to determine whether seeds improve performance even when a priori restrictions limit the magni- tude of metric inaccuracies.
A more important difference between the population and location estimation tasks arises from the logical constraints that hierarchical knowledge places on the target dimensions. Regional knowledge has different implications for the kinds of inferences that can be made in different target domains. On the one hand, regional knowledge is not strongly predictive for populations: Both Asia and Europe have countries with large and small populations. On the other hand, regional knowledge is highly predictive of locations: The hierarchical relations between regions allow people to infer location from category membership. For example, if all of France is believed to be north of all of Italy, then necessarily, all French cities are north of all Italian cities. Inferences based on category membership are inheritance- based inferences. There are at least three ways inheritance- based inferences can be influenced by seed facts. First, the regional midpoint might be redefined. Second, the upper and/or lower boundary of the region, and thus, the range, might be redefined if the seeds are known to be at the border of the region. Third, both of these factors might work together to influence inferences (e.g., new boundary informa- tion might cause the range to be redefined, which propagates to the regional midpoint, or psychological prototype, which in turn propagates to the items).
In addition to inheritance-based inferences, adjacency- based inferences should play a role in reasoning about locations. For example, when two regions are considered to be adjacent (e.g., Europe and Africa), then changes in beliefs

202 FRIEDMAN AND BROWN
about the location of one may propagate to beliefs about the location of the other. In particular, seeds that provide information about regional boundaries may affect estimates in adjacent regions, because the spatial relations between the regions must remain coherent. For example, if people learn that a particular city in North Africa is further north than their previously held belief about the location of the northern boundary of Africa, they may move not only the northern boundary of Africa but also (depending on the magnitude of the original error) the southern boundary of Europe. Clearly, geographical adjacencies are unlikely to be an important factor in the generation of population estimates. Most important for the present case, seeds might influence regions independently. In the context of geography, then, evidence for inheritance-based and adjacency-based inferences form the main evidence that participants were using plausible- reasoning processes to make their judgments. We elaborate this possibility below.
Predictions
Experiment 2 was designed to investigate the role of inheritance- and adjacency-based inferences on location judgments and to provide further support for the conceptual underpinnings of geographical biases. To do this, after participants estimated the latitudes of cities in Europe and Africa, one group learned that Lisbon and Athens are located at 39 ° and 38 ° north, respectively, and another group learned that Tunis and Algiers are both located at 37 ° north. Note that all four seed cities have similar latitudes. Consequently, both groups were given virtually identical numerical infor- mation at the item level.
By inheritance, the seed cities should convey information that affects estimates of the other cities within their own regions: Southern European seeds should increase (i.e., move northward) the estimates for all the southern European cities, and African seeds should increase the estimates for all the African cities. Furthermore, learning a set of facts for a given region should shift all the cities in that region by a similar amount, rather than (for example) shifting only the cities close to the border of the region.
In the present context, the interesting question is how southern European seeds affect African estimates and how African seeds affect southern Europe. Because the items given to each group were from different regions, and because of the initial underestimation of cities in Mediterra- nean Europe, the different regional membership of the seeds sets the stage for a potentially interesting asymmetry in the reasoning processes used for the second estimates.
In principle, southern European seeds provide a northern boundary for Africa and northern African seeds provide a southern boundary for Europe. However, providing observ- ers with category boundaries for southern Europe or north- ern Africa has different logical implications for the spatial relation between the regions. To illustrate, for the Tunis and Algiers group, the new North African boundary is north of the original southern European boundary, and consequently, the locations of both regions must be reconciled. For the Athens and Lisbon group, however, the new southern
European boundary is still north of the original north African boundary. If the regions are subjectively connected by the relation that "Europe is north of Africa," then the southern European seeds allow this adjacency relation to remain true, but the North African seeds do not. On this view, African seeds should affect estimates in both regions, whereas southern European seeds should affect only the European estimates. If we find evidence for this sort of asymmetry, it would suggest that seed facts affect location knowledge at the regional level and that consistencies or inconsistencies between regional locations are evaluated before being inherited by the item level.
Method
The procedure for the first part of the experiment was identical to that used in Experiment 1. After the participants made their knowledge estimates and their first set of latitude estimates, they were shown the seed facts for their particular group (Algiers and Tunis for the African seed fact group, and Athens and Lisbon for the European group). They were then asked to make a second set of estimates, using the same procedure as was used for the first set and a different order of cities.
Thirty volunteers from the University of Alberta participated in each of the conditions. Based on the results of Experiment 1, we chose 22 European cities. Seventeen of these represented north- central Europe (Oslo, St. Petersburg, Moscow, Stockholm, Copen- hagen, Glasgow, Kiev, London, Dublin, Amsterdam, Prague, Berlin, Hamburg, Brussels, Pads, Vienna, and Marseille), and 5 represented the (putative) southern European region (Madrid, Barcelona, Naples, Milan, and Rome). We tried to choose cities in Africa that would be familiar, at least by name, hut this was difficult to achieve. More important, we chose both the European and African cities to span the range of actual latitudes in each continent.
Results and Discussion
We analyzed the average first and second estimates (and their associated accuracy measures) separately. We also analyzed both sets of estimates together to examine the effects of seeding the knowledge base.
The mean knowledge ratings, estimated latitudes, and accuracy data for the European and African cities are shown in Table 2, and the European data are broken out separately for the northern and southern European cities in Table 3. Preliminary analyses indicated that participants in each seed group did not differ from each other in their knowledge ratings of Europe or of Africa. Across seed groups, partici- pants rated their knowledge of European cities higher overall than their knowledge of African cities by a factor of about five (2.41 vs. 0.50). In addition, participants rated their knowledge of northern European cities higher than that of southern European cities (2.48 vs. 2.20) and their knowledge of southern European cities higher than their knowledge of African cities (2.20 vs. 0.50), t(59) = 10.30.
Initial estimates. For the initial latitude estimates, the accuracy measures also revealed differences between the three regions. The signed errors revealed a tendency to underestimate cities in all three regions, but much more so in southern Europe (M = -27 .4 °) and Africa (M = -21.5 °) than in northern Europe (M = -8.2°), F(2, 116) = 37.91,
GEOGRAPHICAL REASONING
Table 2 Knowledge Ratings, Estimated (JEst) Latitudes, and Accuracy Measures for Experiment 2: European and African Cities
Europe Africa
Measure M SE M SE t a
Knowledge ratings (across seed fact groups) 2.41 0.22 0.50 0.08 Actual latitude (in degrees) 50.45 2.09 Est latitude (in degrees)
First est (across seed fact groups) 37.91 1.33 - 19.43 1.88 Second est (European seed facts) 45.67 1.52 - 15.64 3.01 Second est (African seed facts) 47.44 2.26 -5.88 3.66
Absolute error (in degrees) First est (across seed fact groups) 17.04 1.16 26.46 1.50 Second est (European seed facts) 10.68 1.23 26.58 2.17 Second est (African seed facts) 12.45 1.28 23.88 1.92
Rank-order r First est (across seed fact groups) .74 .04 .51 .05 Second est (European seed facts) .73 .07 .50 .07 Second est (African seed facts) .77 .06 .58 .07
11.80"**
32.35*** 18.20"** 15.70"**
7.08*** 8.12"** 6.80***
6.79*** 4.51"** 3.92***
"t(59) for all knowledge ratings and for all first estimates; t(29) for all second estimates. ***p < .001.
203
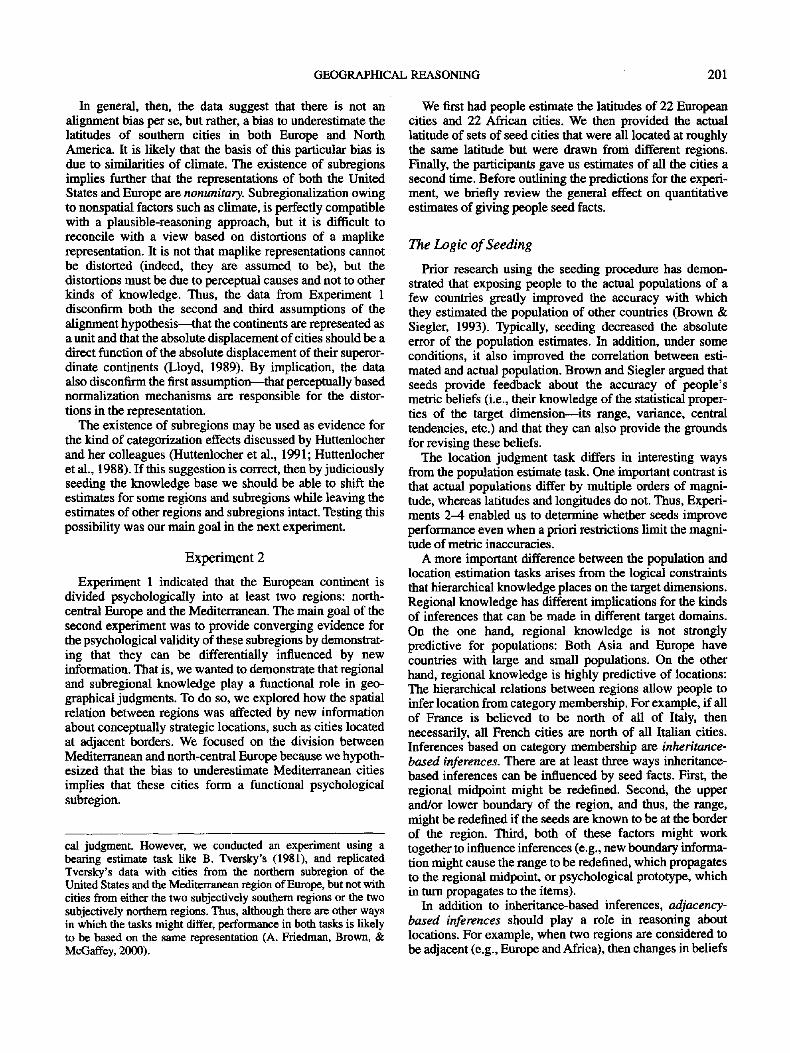
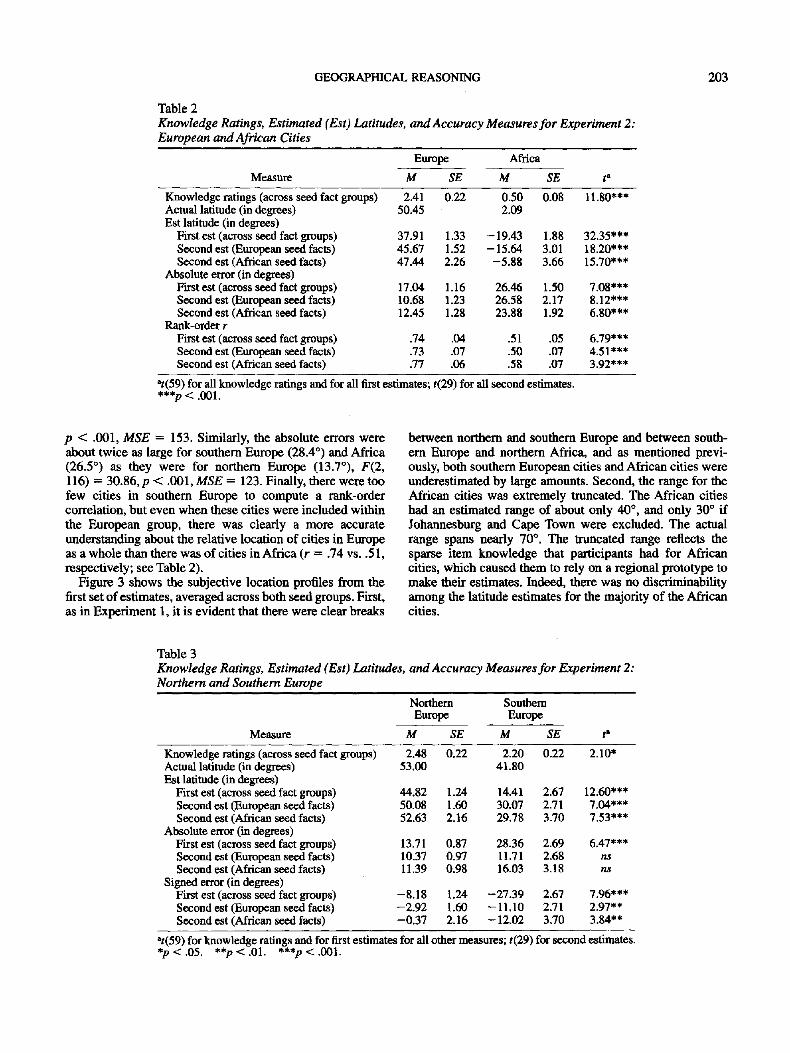
p < .001, MSE = 153. Similarly, the absolute errors were about twice as large for southern Europe (28.4 ° ) and Africa (26.5 °) as they were for northern Europe (13.7°), F(2, 116) = 30.86,p < .001, MSE = 123. Finally, there were too few cities in southern Europe to compute a rank-order correlation, but even when these cities were included within the European group, there was clearly a more accurate understanding about the relative location of cities in Europe as a whole than there was of cities in Africa (r = .74 vs..51, respectively; see Table 2).
Figure 3 shows the subjective location profiles from the first set of estimates, averaged across both seed groups. First, as in Experiment 1, it is evident that there were clear breaks
between northern and southern Europe and between south- ern Europe and northern Africa, and as mentioned previ- ously, both southern European cities and African cities were underestimated by large amounts. Second, the range for the African cities was extremely truncated. The African cities had an estimated range of about only 40 ° , and only 30 ° if Johannesburg and Cape Town were excluded. The actual range spans nearly 70 ° . The truncated range reflects the sparse item knowledge that participants had for African cities, which caused them to rely on a regional prototype to make their estimates. Indeed, there was no discriminability among the latitude estimates for the majority of the African cities.
Table 3 Knowledge Ratings, Estimated (Est) Latitudes, and Accuracy Measures for Experiment 2: Northern and Southern Europe
Northern Southern Europe Europe
Measure M SE M SE t a
Knowledge ratings (across seed fact groups) 2.48 0.22 2.20 0.22 2.10" Actual latitude (in degrees) 53.00 41.80 Est latitude (in degrees)
First est (across seed fact groups) 44.82 1.24 14.41 2.67 12.60"** Second est (European seed facts) 50.08 1.60 30.07 2.71 7.04*** Second est (African seed facts) 52.63 2.16 29.78 3.70 7.53***
Absolute error (in degrees) First est (across seed fact groups) 13.71 0.87 28.36 2.69 6.47*** Second est (European seed facts) 10.37 0.97 11.71 2.68 ns Second est (African seed facts) 11.39 0.98 16.03 3.18 ns
Signed error (in degrees) First est (across seed fact groups) -8.18 1.24 -27.39 2.67 7.96*** Second est (European seed facts) -2.92 1.60 - 11.10 2.71 2.97** Second est (African seed facts) -0.37 2.16 - 12.02 3.70 3.84**
"t(59) for knowledge ratings and for first estimates for all other measures; t(29) for second estimates. *p < .05. **p < .01. ***p < .001.
204 FRIEDMAN AND BROWN
Figure 3. Average first latitude estimates in Experiment 2, averaged across the two seed fact groups. Data are ordered from the subjectively most northern to the most southern city.
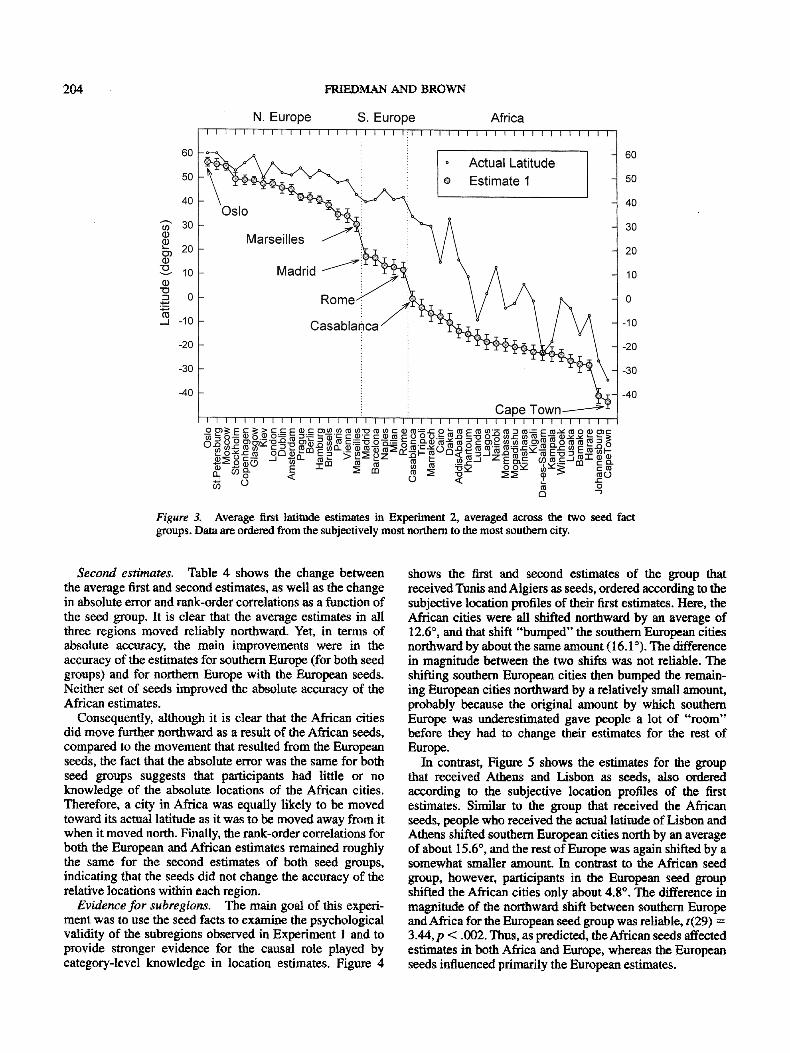
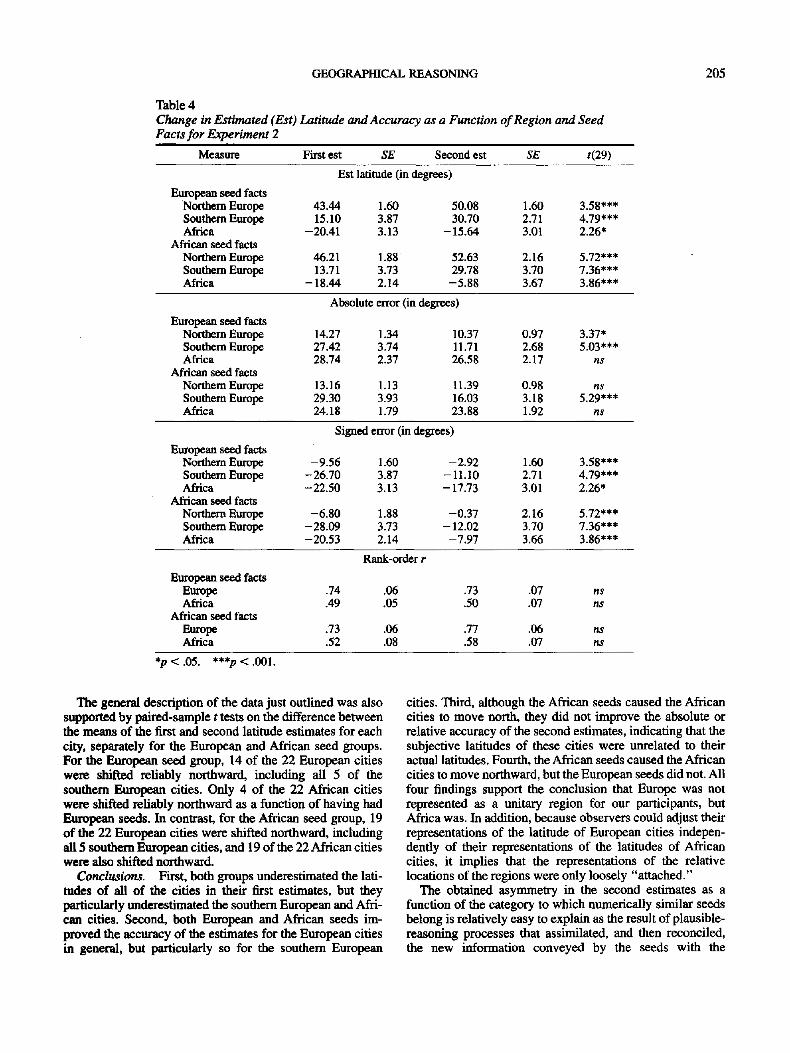
Second estimates. Table 4 shows the change between the average first and second estimates, as well as the change in absolute error and rank-order correlations as a function of the seed group. It is clear that the average estimates in all three regions moved reliably northward. Yet, in terms of absolute accuracy, the main improvements were in the accuracy of the estimates for southern Europe (for both seed groups) and for northern Europe with the European seeds. Neither set of seeds improved the absolute accuracy of the African estimates.
Consequently, although it is clear that the African cities did move further northward as a result of the African seeds, compared to the movement that resulted from the European seeds, the fact that the absolute error was the same for both seed groups suggests that participants had little or no knowledge of the absolute locations of the African cities. Therefore, a city in Africa was equally likely to be moved toward its actual latitude as it was to be moved away from it when it moved north. Finally, the rank-order correlations for both the European and African estimates remained roughly the same for the second estimates of both seed groups, indicating that the seeds did not change the accuracy of the relative locations within each region.
Evidence for subregions. The main goal of this experi- ment was to use the seed facts to examine the psychological validity of the subregions observed in Experiment 1 and to provide stronger evidence for the causal role played by category-level knowledge in location estimates. Figure 4
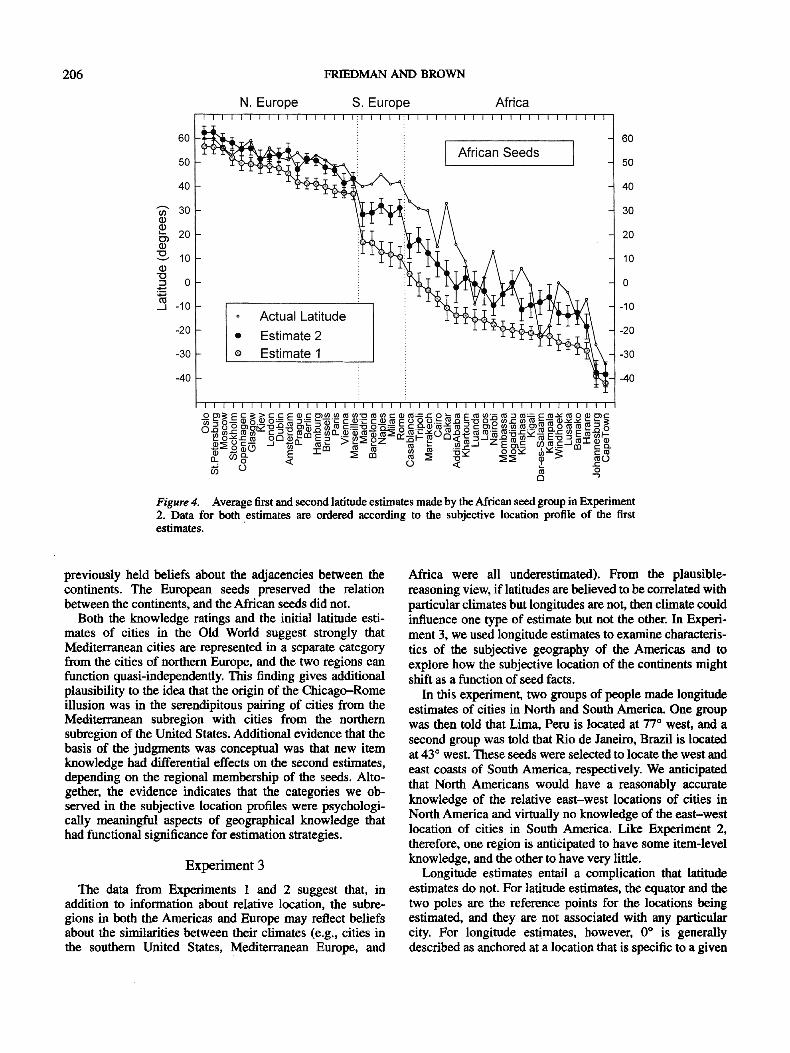
shows the first and second estimates of the group that received Tunis and Algiers as seeds, ordered according to the subjective location profiles of their first estimates. Here, the African cities were all shifted northward by an average of 12.6 ° , and that shift "bumped" the southern European cities northward by about the same amount (16.1°). The difference in magnitude between the two shifts was not reliable. The shifting southern European cities then bumped the remain- ing European cities northward by a relatively small amount, probably because the original amount by which southern Europe was underestimated gave people a lot of "room" before they had to change their estimates for the rest of Europe.
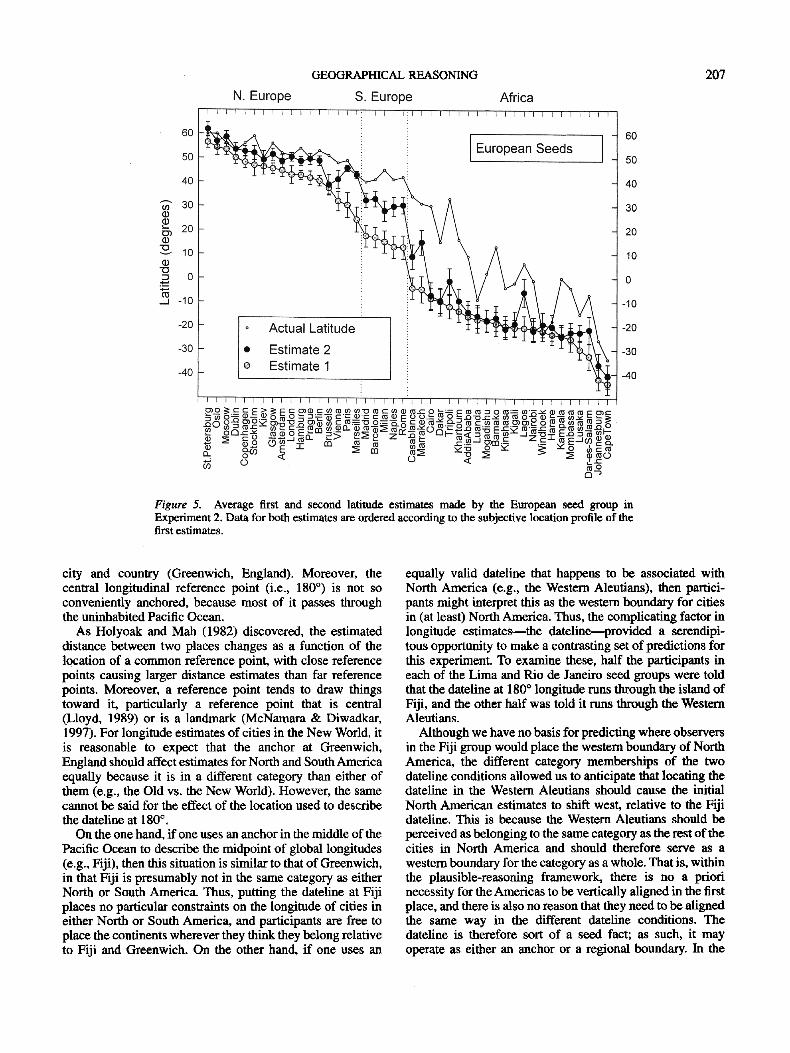
In contrast, Figure 5 shows the estimates for the group that received Athens and Lisbon as seeds, also ordered according to the subjective location profiles of the first estimates. Similar to the group that received the African seeds, people who received the actual latitude of Lisbon and Athens shifted southern European cities north by an average of about 15.6 °, and the rest of Europe was again shifted by a somewhat smaller amount. In contrast to the African seed group, however, participants in the European seed group shifted the African cities only about 4.8 ° . The difference in magnitude of the northward shift between southern Europe and Africa for the European seed group was reliable, t(29) = 3.44, p < .002. Thus, as predicted, the African seeds affected estimates in both Africa and Europe, whereas the European seeds influenced primarily the European estimates.
GEOGRAPHICAL REASONING 205
Table 4 Change in Estimated (Est) Latitude and Accuracy as a Function o f Region and Seed Facts f o r Experiment 2
Measure First est SE Second est SE t(29)
Est latitude (in degrees)
European seed facts Northern Europe 43.44 1.60 50.08 1 . 6 0 3.58*** Southern Europe 15.10 3.87 30.70 2 . 7 1 4.79*** Africa -20.41 3.13 -15.64 3.01 2.26*
African seed facts Northern Europe 46.21 1.88 52.63 2.16 5.72*** Southern Europe 13.71 3.73 29.78 3.70 7.36*** Africa - 18.44 2.14 -5.88 3.67 3.86***
Absolute error (in degrees)
European seed facts Northern Europe 14.27 1.34 10.37 0.97 3.37* Southern Europe 27.42 3.74 11.71 2.68 5.03*** Africa 28.74 2.37 26.58 2.17 ns
African seed facts Northern Europe 13.16 1.13 11.39 0.98 ns Southern Europe 29.30 3.93 16.03 3.18 5.29*** Africa 24.18 1.79 23.88 1.92 ns
Signed error (in degrees)
European seed facts Northern Europe -9.56 1.60 -2.92 1 . 6 0 3.58*** Southern Europe -26.70 3.87 -11.10 2 . 7 1 4.79*** Africa -22.50 3.13 -17.73 3.01 2.26*
African seed facts Northern Europe -6.80 1.88 -0.37 2.16 5.72*** Southern Europe -28.09 3.73 - 12.02 3.70 7.36*** Africa -20.53 2.14 -7.97 3.66 3.86***
Rank-order r
European seed facts Europe .74 .06 .73 .07 ns Africa .49 .05 .50 .07 ns
African seed facts Europe .73 .06 .77 .06 ns Africa .52 .08 .58 .07 ns
*p < .05. ***p < .001.
The general description of the data just outlined was also supported by paired-sample t tests on the difference between the means of the first and second latitude estimates for each city, separately for the European and African seed groups. For the European seed group, 14 of the 22 European cities were shifted reliably northward, including all 5 of the southern European cities. Only 4 of the 22 African cities were shifted reliably northward as a function of having had European seeds. In contrast, for the African seed group, 19 of the 22 European cities were shifted northward, including all 5 southern European cities, and 19 of the 22 African cities were also shifted northward.
Conclusions. First, both groups underestimated the lati- tudes of all of the cities in their first estimates, but they particularly underestimated the southern European and Afri- can cities. Second, both European and African seeds im- proved the accuracy of the estimates for the European cities in general, but particularly so for the southern European
cities. Third, although the African seeds caused the African cities to move north, they did not improve the absolute or relative accuracy of the second estimates, indicating that the subjective latitudes of these cities were unrelated to their actual latitudes. Fourth, the African seeds caused the African cities to move northward, but the European seeds did not. All four findings support the conclusion that Europe was not represented as a unitary region for our participants, but Africa was. In addition, because observers could adjust their representations of the latitude of European cities indepen- dently of their representations of the latitudes of African cities, it implies that the representations of the relative locations of the regions were only loosely "attached."
The obtained asymmetry in the second estimates as a function of the category to which numerically similar seeds belong is relatively easy to explain as the result of plausible- reasoning processes that assimilated, and then reconciled, the new information conveyed by the seeds with the
206 FRIEDMAN AND BROWN
Figure 4. Average first and second latitude estimates made by the African seed group in Experiment 2. Data for both estimates are ordered according to the subjective location profile of the first estimates.
previously held beliefs about the adjacencies between the continents. The European seeds preserved the relation between the continents, and the African seeds did not.
Both the knowledge ratings and the initial latitude esti- mates of cities in the Old World suggest strongly that Mediterranean cities are represented in a separate category from the cities of northern Europe, and the two regions can function quasi-independently. This finding gives additional plausibility to the idea that the origin of the Chicago-Rome illusion was in the serendipitous pairing of cities from the Mediterranean subregion with cities from the northern subregion of the United States. Additional evidence that the basis of the judgments was conceptual was that new item knowledge had differential effects on the second estimates, depending on the regional membership of the seeds. Alto- gether, the evidence indicates that the categories we ob- served in the subjective location profiles were psychologi- cally meaningful aspects of geographical knowledge that had functional significance for estimation strategies.
Experiment 3
The data from Experiments 1 and 2 suggest that, in addition to information about relative location, the subre- gions in both the Americas and Europe may reflect beliefs about the similarities between their climates (e.g., cities in the southern United States, Mediterranean Europe, and
Africa were all underestimated). From the plausible- reasoning view, if latitudes are believed to be correlated with particular climates but longitudes are not, then climate could influence one type of estimate but not the other. In Experi- ment 3, we used longitude estimates to examine characteris- tics of the subjective geography of the Americas and to explore how the subjective location of the continents might shift as a function of seed facts.
In this experiment, two groups of people made longitude estimates of cities in North and South America. One group was then told that Lima, Peru is located at 77 ° west, and a second group was told that Rio de Janeiro, Brazil is located at 43 ° west. These seeds were selected to locate the west and east coasts of South America, respectively. We anticipated that North Americans would have a reasonably accurate knowledge of the relative east-west locations of cities in North America and virtually no knowledge of the east-west location of cities in South America. Like Experiment 2, therefore, one region is anticipated to have some item-level knowledge, and the other to have very little.
Longitude estimates entail a complication that latitude estimates do not. For latitude estimates, the equator and the two poles are the reference points for the locations being estimated, and they are not associated with any particular city. For longitude estimates, however, 0 ° is generally described as anchored at a location that is specific to a given
GEOGRAPHICAL REASONING 207
Figure 5. Average first and second latitude estimates made by the European seed group in Experiment 2. Data for both estimates are ordered according to the subjective location profile of the first estimates.
city and country (Greenwich, England). Moreover, the central longitudinal reference point (i.e., 180 ° ) is not so conveniently anchored, because most of it passes through the uninhabited Pacific Ocean.
As Holyoak and Mah (1982) discovered, the estimated distance between two places changes as a function of the location of a common reference point, with close reference points causing larger distance estimates than far reference points. Moreover, a reference point tends to draw things toward it, particularly a reference point that is central (Lloyd, 1989) or is a landmark (McNamara & Diwadkar, 1997). For longitude estimates of cities in the New World, it is reasonable to expect that the anchor at Greenwich, England should affect estimates for North and South America equally because it is in a different category than either of them (e.g., the Old vs. the New World). However, the same cannot be said for the effect of the location used to describe the dateline at 180 °.
On the one hand, if one uses an anchor in the middle of the Pacific Ocean to describe the midpoint of global longitudes (e.g., Fiji), then this situation is similar to that of Greenwich, in that Fiji is presumably not in the same category as either North or South America. Thus, putting the dateline at Fiji places no particular constraints on the longitude of cities in either North or South America, and participants are free to place the continents wherever they think they belong relative to Fiji and Greenwich. On the other hand, if one uses an
equally valid dateline that happens to be associated with North America (e.g., the Western Aleutians), then partici- pants might interpret this as the western boundary for cities in (at least) North America. Thus, the complicating factor in longitude estimates the dateline---provided a serendipi- tous opportunity to make a contrasting set of predictions for this experiment. To examine these, half the participants in each of the Lima and Rio de Janeiro seed groups were told that the dateline at 180 ° longitude runs through the island of Fiji, and the other half was told it runs through the Western Aleutians.
Although we have no basis for predicting where observers in the Fiji group would place the western boundary of North America, the different category memberships of the two dateline conditions allowed us to anticipate that locating the dateline in the Western Aleutians should cause the initial North American estimates to shift west, relative to the Fiji dateline. This is because the Western Aleutians should be perceived as belonging to the same category as the rest of the cities in North America and should therefore serve as a western boundary for the category as a whole. That is, within the plausible-reasoning framework, there is no a priori necessity for the Americas to be vertically aligned in the first place, and there is also no reason that they need to be aligned the same way in the different dateline conditions. The dateline is therefore sort of a seed fact; as such, it may operate as either an anchor or a regional boundary. In the
208 FRIEDMAN AND BROWN
case of Fiji, the dateline is neutral with respect to both regions, whereas in the case of the Western Aleutians, the dateline is in the same category as only one of the regions. Thus, the nature of the alignment between the continents displayed in the initial estimates might depend on the strength of the relation between the Americas together with the logical implications of the dateline. Moreover, South America may be only loosely "connected" to North America. If so, then just as the southern European seeds had no implications for the relocation of Africa, because the cat- egory-level relations remained the same, the location of the dateline within the North American region carries no implications for the location of South America. In other words, the relation "North America is north of South America" remains true regardless of where the dateline is and regardless of how South America is shifted as a result of learning the South American seeds. Thus, just as the southern European seeds shifted southern Europe indepen- dently of Africa, the Western Aleutian dateline might shift North America independently of South America, and the South American seeds might shift South America indepen- dently of North America.
According to the alignment hypothesis, the initial esti- mates o f the locations of South American cities should reflect the alignment of the Americas: The average longitude across the cities in each region should be very similar. Moreover, the alignment of the continents should be insensi- tive to the location of the dateline. That is, strictly speaking, the alignment hypothesis on its own does not predict that the location of the dateline should shift the location of the estimates. Nevertheless, if the alignment hypothesis holds, then to the extent that people want to maintain the relative positions of the Americas, South America should "move"
with the North American estimates. Thus, the initial esti- mates for South America should be further west with the Western Aleutian dateline than with the Fiji dateline. Further- more, if South America is to remain aligned with North America, then both the North and South American second estimates should shift by a similar amount as a function of the South American seed, and the average second estimates in both regions should remain similar in magnitude.
M e t h o d
Participants and design. Undergraduate volunteers (N = 120) from the University of Alberta participated in the experiment as part of a course requirement. There were 30 participants in each of the four groups formed by the factorial combination of dateline (Fiji or the Western Aleutians) and seed fact (Lima and Rio de Janeiro).
Procedure. The method was identical to that of Experiment 2, except for the instructions about longitudes. Participants were told that longitudes begin at 0 ° in Greenwich, England, and increase to the dateline at 180 ° west. The particular anchor given for the dateline depended on the group (Fiji vs. the Western Aleutians). Participants were required to respond to each city with an estimate of its actual longitude. In addition, a chart depicting the anchors appropriate for each group (i.e., Greenwich, England, and either Fiji or the Western Aleutians) was displayed throughout both the first and second estimate tasks.
R e su l t s a n d D i s c u s s i o n
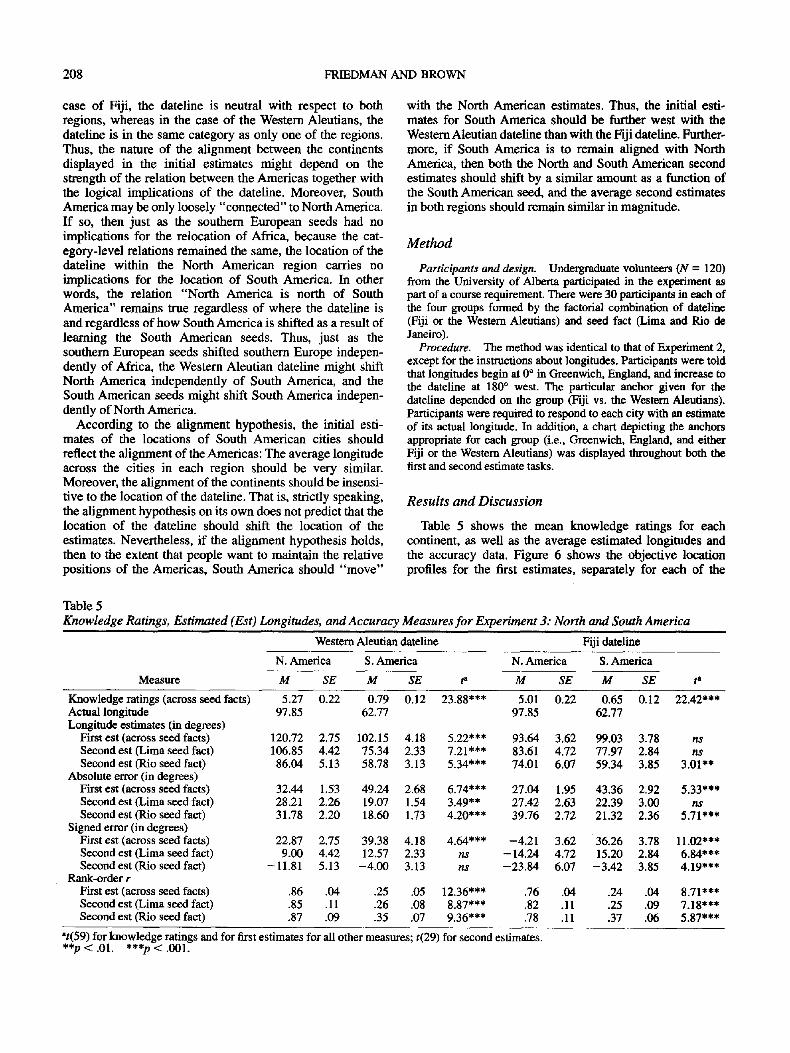
Table 5 shows the mean knowledge ratings for each continent, as well as the average estimated longitudes and the accuracy data. Figure 6 shows the objective location profiles for the first estimates, separately for each of the
Table 5 Knowledge Ratings, Estimated (Est) Longitudes, and Accuracy Measures f o r Experiment 3: North and South America
Western Aleutian dateline Fiji dateline
N. Amefica S.Amefica N.Amenca S.Amenca
Measure M SE M SE t a M SE M SE t a
Knowledge ratings (across seed facts) 5.27 0.22 0.79 0.12 5.01 0.22 0.65 0.12 Actual longitude 97.85 62.77 97.85 62.77 Longitude estimates (in degrees)
First est (across seed facts) 120.72 2.75 102.15 4.18 5.22*** 93.64 3.62 99.03 3.78 ns Second est (Lima seed fact) 106.85 4.42 75.34 2.33 7.21"** 83.61 4.72 77.97 2.84 ns Second est (Rio seed fact) 86.04 5.13 58.78 3.13 5.34*** 74.01 6.07 59.34 3.85 3.01"*
Absolute error (in degrees) First est (across seed facts) 32.44 1.53 49.24 2.68 6.74*** 27.04 1 . 9 5 43.36 2.92 5.33*** Second est (Lima seed fact) 28.21 2.26 19.07 1.54 3.49** 27.42 2.63 22.39 3.00 ns Second est (Rio seed fact) 31.78 2.20 18.60 1.73 4.20*** 39.76 2.72 21.32 2.36 5.71"**
Signed error (in degrees) First est (across seed facts) 22.87 2.75 39.38 4.18 4.64*** -4.21 3.62 36.26 3.78 Second est (Lima seed fact) 9.00 4.42 12.57 2.33 ns - 14.24 4.72 15.20 2.84 Second est (Rio seed fact) -11.81 5.13 -4.00 3.13 ns -23.84 6.07 -3.42 3.85
Rank-order r First est (across seed facts) .86 .04 .25 .05 .76 .04 .24 .04 8.71"** Second est (Lima seed fact) .85 .11 .26 .08 .82 .11 .25 .09 7.18"** Second est (Rio seed fact) .87 .09 .35 .07 .78 .11 .37 .06 5.87***
23.88*** 22.42***
12.36"** 8.87*** 9.36***
11.02"** 6.84*** 4.19"**
at(59) for knowledge ratings and for first estimates for all other measures; t(29) for second estimates. **p < .01. ***p < .001.
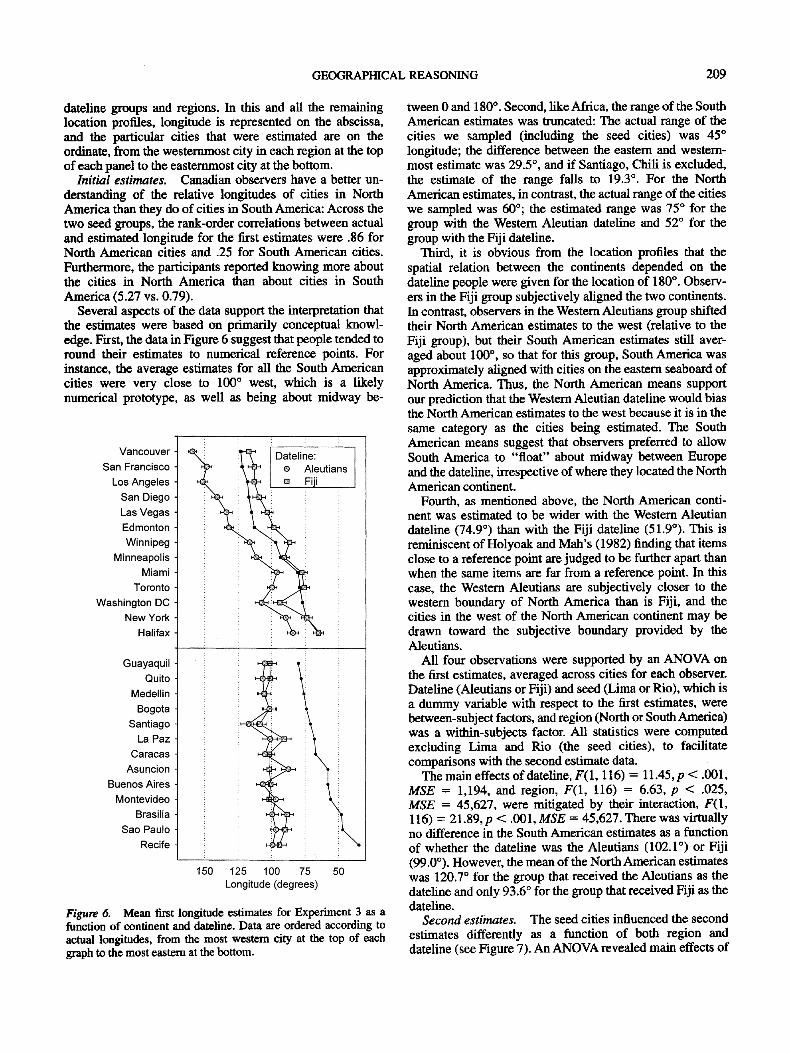
GEOGRAPHICAL REASONING 209
dateline groups and regions. In this and all the remaining location profiles, longitude is represented on the abscissa, and the particular cities that were estimated are on the ordinate, from the westernmost city in each region at the top of each panel to the easternmost city at the bottom.
Initial estimates. Canadian observers have a better un- derstanding of the relative longitudes of cities in North America than they do of cities in South America: Across the two seed groups, the rank-order correlations between actual and estimated longitude for the first estimates were .86 for North American cities and .25 for South American cities. Furthermore, the participants reported knowing more about the cities in North America than about cities in South America (5.27 vs. 0.79).
Several aspects of the data support the interpretation that the estimates were based on pdrnarily conceptual knowl- edge. First, the data in Figure 6 suggest that people tended to round their estimates to numerical reference points. For instance, the average estimates for all the South American cities were very close to 100 ° west, which is a likely numerical prototype, as well as being about midway be-
Figure 6. Mean first longitude estimates for Experiment 3 as a function of continent and dateline. Data are ordered according to actual longitudes, from the most western city at the top of each graph to the most eastern at the bottom.
tween 0 and 180 °. Second, like Africa, the range of the South American estimates was truncated: The actual range of the cities we sampled (including the seed cities) was 45 ° longitude; the difference between the eastern and western- most estimate was 29.5 ° , and if Santiago, Chili is excluded, the estimate of the range falls to 19.3 ° . For the North American estimates, in contrast, the actual range of the cities we sampled was 60°; the estimated range was 75 ° for the group with the Western Aleutian dateline and 52 ° for the group with the Fiji dateline.
Third, it is obvious from the location profiles that the spatial relation between the continents depended on the dateline people were given for the location of 180 °. Observ- ers in the Fiji group subjectively aligned the two continents. In contrast, observers in the Western Aleutians group shifted their North American estimates to the west (relative to the Fiji group), but their South American estimates still aver- aged about 100% so that for this group, South America was approximately aligned with cities on the eastern seaboard of North America. Thus, the North American means support our prediction that the Western Aleutian dateline would bias the North American estimates to the west because it is in the same category as the cities being estimated. The South American means suggest that observers preferred to allow South America to "float" about midway between Europe and the dateline, irrespective of where they located the North American continent.
Fourth, as mentioned above, the North American conti- nent was estimated to be wider with the Western Aleutian dateline (74.9 °) than with the Fiji dateline (51.9°). This is reminiscent of Holyoak and Mah's (1982) finding that items close to a reference point are judged to be further apart than when the same items are far from a reference point. In this case, the Western Aleutians are subjectively closer to the western boundary of North America than is Fiji, and the cities in the west of the North American continent may be drawn toward the subjective boundary provided by the Aleutians.
All four observations were supported by an ANOVA on the first estimates, averaged across cities for each observer. Dateline (Aleutians or Fiji) and seed (Lima or Rio), which is a dummy variable with respect to the first estimates, were between-subject factors, and region (North or South America) was a within-subjects factor. All statistics were computed excluding Lima and Rio (the seed cities), to facilitate comparisons with the second estimate data.
The main effects of dateline, F(1,116) = 11.45,p < .001, MSE = 1,194, and region, F(1, 116) = 6.63, p < .025, MSE = 45,627, were mitigated by their interaction, F(1, 116) = 21.89,p < .001, MSE = 45,627. There was virtually no difference in the South American estimates as a function of whether the dateline was the Aleutians (102.1 °) or Fiji (99.0°). However, the mean of the North American estimates was 120.7 ° for the group that received the Aleutians as the dateline and only 93.6 ° for the group that received Fiji as the dateline.
Second estimates. The seed cities influenced the second estimates differently as a function of both region and dateline (see Figure 7). An ANOVA revealed main effects of
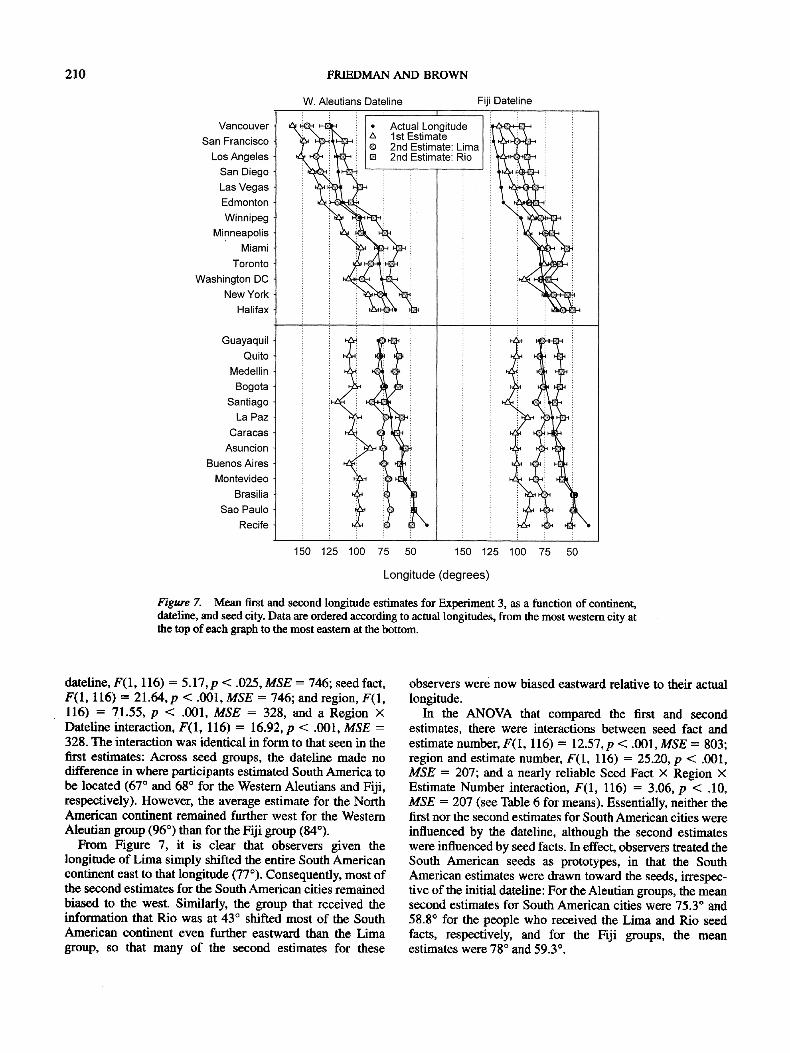
210 FRIEDMAN AND BROWN
Figure 7. Mean first and second longitude estimates for Experiment 3, as a function of continent, dateline, and seed city. Data are ordered according to actual longitudes, from the most western city at the top of each graph to the most eastern at the bottom.
dateline, F(1 ,116) = 5.17,p < .025, M S E = 746; seed fact, F(1 ,116) = 21.64,p < .001, M S E = 746; and region, F(1, 116) = 71.55, p < .001, M S E = 328, and a Region X Dateline interaction, F(1, 116) = 16.92, p < .001, MSE = 328. The interaction was identical in form to that seen in the first estimates: Across seed groups, the dateline made no difference in where participants estimated South America to be located (67 ° and 68 ° for the Western Aleutians and Fiji, respectively). However, the average estimate for the North American continent remained further west for the Western Aleutian group (96 °) than for the Fiji group (84°).
From Figure 7, it is clear that observers given the longitude of Lima simply shifted the entire South American continent east to that longitude (77°). Consequently, most of the second estimates for the South American cities remained biased to the west. Similarly, the group that received the information that Rio was at 43 ° shifted most of the South American continent even further eastward than the Lima group, so that many of the second estimates for these
observers were now biased eastward relative to their actual longitude.
In the ANOVA that compared the first and second estimates, there were interactions between seed fact and estimate number, F(1,116) = 12.57,p < .O01,MSE = 803; region and estimate number, F(1, 116) = 25.20, p < .001, M S E = 207; and a nearly reliable Seed Fact × Region x Estimate Number interaction, F ( I , 116) = 3.06, p < .10, MSE = 207 (see Table 6 for means). Essentially, neither the first nor the second estimates for South American cities were influenced by the dateline, although the second estimates were influenced by seed facts. In effect, observers treated the South American seeds as prototypes, in that the South American estimates were drawn toward the seeds, irrespec- tive of the initial dateline: For the Aleutian groups, the mean second estimates for South American cities were 75.3 ° and 58.8 ° for the people who received the Lima and Rio seed facts, respectively, and for the Fiji groups, the mean estimates were 78 ° and 59.3 ° .
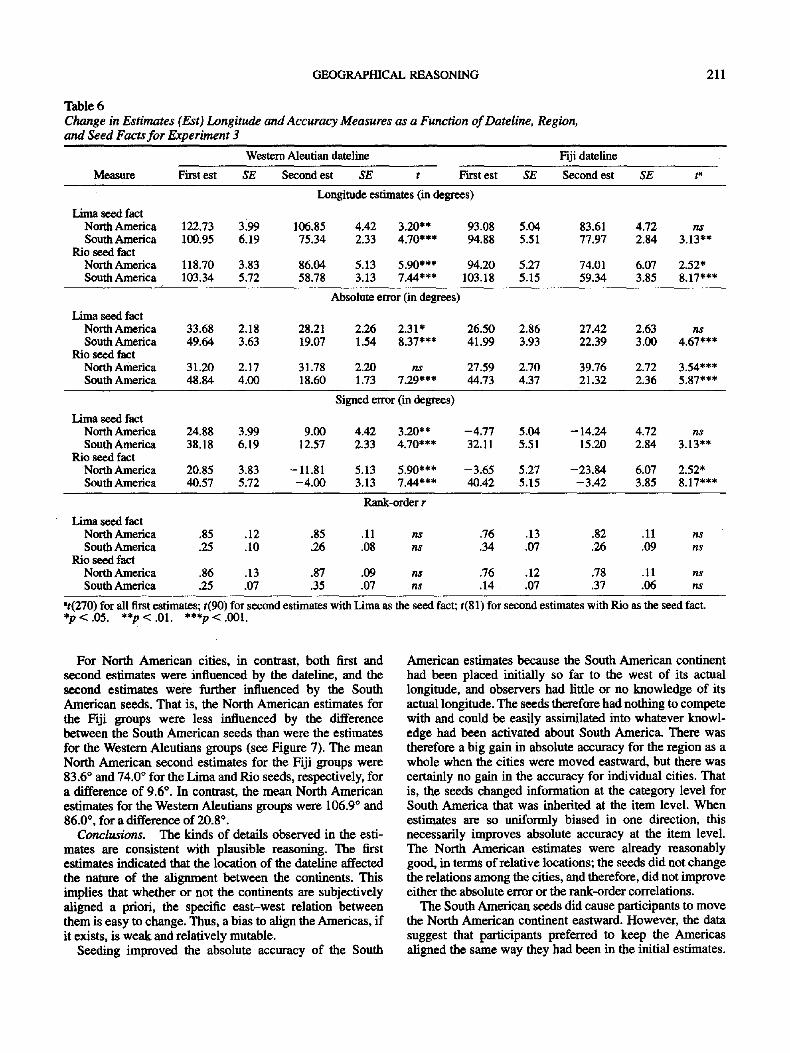
GEOGRAPHICAL REASONING
Table 6 Change in Estimates (Est) Longitude and Accuracy Measures as a Function o f Dateline, Region, and Seed Facts f o r Experiment 3
211
Western Aleutian dateline Fiji datefine
Measure First est SE Second est SE t First est SE Second est SE t a
Longitude estimates (in degrees)
Lima seed fact North America 122.73 3.99 106.85 4.42 3.20** 93.08 5.04 83.61 4.72 ns South America 100.95 6.19 75.34 2.33 4.70*** 94.88 5.51 77.97 2.84 3.13"*
Rio seed fact North America 118.70 3.83 86.04 5.13 5.90*** 94.20 5.27 74.01 6.07 2.52* South America 103.34 5.72 58.78 3.13 7.44*** 103.18 5.15 59.34 3.85 8.17"**
Absolute error (in degrees)
Limaseedfact NorthAmerica 33.68 2.18 28.21 2.26 2.31" 26.50 2.86 27.42 2.63 ns SouthAmerica 49.64 3.63 19.07 1.54 8.37*** 41.99 3.93 22.39 3.00 4.67***
Rio seed fact NorthAmerica 31.20 2.17 31.78 2.20 ns 27.59 2.70 39.76 2.72 3.54*** SouthAmerica 48.84 4.00 18.60 1.73 7.29*** 44.73 4.37 21.32 2.36 5.87***
Signed error (in degrees)
Lima seed fact NorthAmerica 24.88 3.99 9.00 4.42 3.20** -4.77 5 .04 -14.24 4.72 ns SouthAmerica 38.18 6.19 12.57 2.33 4.70*** 32.11 5.51 15.20 2.84 3.13"*
Rio seedfact NorthAmefica 20.85 3 .83 -11.81 5.13 5.90*** -3.65 5 .27 -23.84 6.07 2.52* SouthAmenca 40.57 5.72 -4.00 3.13 7.44*** 40.42 5.15 -3.42 3.85 8.17"**
Rank-order r
Lima seedfact NorthAmerica .85 .12 .85 .11 ns .76 .13 .82 .11 ns SouthAmenca .25 .10 .26 .08 ns .34 .07 .26 .09 ns
Rio seed fact NorthAmerica .86 .13 .87 .09 ns .76 .12 .78 .11 ns SouthAmefica .25 .07 .35 .07 ns .14 .07 .37 .06 ns
It(270) for all first estimates; t(90) for second estimates with Lima as the seed fact; t(81) for second estimates with Rio as the seed fact. *p < .05. **p < .01. ***p < .001.
For North American cities, in contrast, both first and second estimates were influenced by the dateline, and the second estimates were further influenced by the South American seeds. That is, the North American estimates for the Fiji groups were less influenced by the difference between the South American seeds than were the estimates for the Western Aleutians groups (see Figure 7). The mean North American second estimates for the Fiji groups were 83.6 ° and 74.0 ° for the Lima and Rio seeds, respectively, for a difference of 9.6 °. In contrast, the mean North American estimates for the Western Aleutians groups were 106.9 ° and 86.0 °, for a difference of 20.8 °.
Conclusions. The kinds of details observed in the esti- mates are consistent with plausible reasoning. The first estimates indicated that the location of the dateline affected the nature of the alignment between the continents. This implies that whether or not the continents are subjectively aligned a priori, the specific east-west relation between them is easy to change. Thus, a bias to align the Americas, if it exists, is weak and relatively mutable.
Seeding improved the absolute accuracy of the South
American estimates because the South American continent had been placed initially so far to the west of its actual longitude, and observers had tittle or no knowledge of its actual longitude. The seeds therefore had nothing to compete with and could be easily assimilated into whatever knowl- edge had been activated about South America. There was therefore a big gain in absolute accuracy for the region as a whole when the cities were moved eastward, but there was certainly no gain in the accuracy for individual cities. That is, the seeds changed information at the category level for South America that was inherited at the item level. When estimates are so uniformly biased in one direction, this necessarily improves absolute accuracy at the item level. The North American estimates were already reasonably good, in terms of relative locations; the seeds did not change the relations among the cities, and therefore, did not improve either the absolute error or the rank-order correlations.
The South American seeds did cause participants to move the North American continent eastward. However, the data suggest that participants preferred to keep the Americas aligned the same way they had been in the initial estimates.

212 FRIEDMAN AND BROWN
So, when participants learned either of the South American seeds, the information was useful in conveying how far off their initial South American estimates were. There are several ways they could have responded to this, but the way they did preserved the initial relation between the continents that was revealed by the first estimates.
In summary, even if similarity of climate was responsible for the subregions observed in the Old and New World in Experiments 1 and 2, the data from Experiment 3 necessitate the conclusion that not all geographical judgments can be based primarily on knowledge about climates. Second, the South American estimates can be taken as corroborating evidence for use of prototypes when item knowledge is sparse. Third, the alignment of the Americas was context sensitive and thus not absolute in any sense. Finally, the seed facts shifted estimates of both North and South America, but in such a way as to keep the original relation between the Americas intact.
Experiment 4
Participants who had been given a western boundary for North America preferred to align South America with the eastern seaboard of North America, both during their first estimates and after receiving the South American seed facts. In Experiment 4, we explored this bias further as well as what happens when the seeds come from both regions. We asked people to make longitude estimates of 13 North American cities and 13 South American cities. Then we gave them both a North and a South American seed city and asked them to estimate all the cities a second time. The seed cities came from the east coast, the west coast, and the approxi- mate center of each continent and were factorially combined to form nine conditions. Because Experiment 3 showed that using the Western Aleutians as a dateline produced an interesting (and apparently strong) bias in people's estimates of the longitude of the western boundary of North America, all the participants in Experiment 4 were given the informa- tion that the dateline runs through the Western Aleutians.
We chose seeds from both continents and from both coastal and central locations to try to determine which of several factors might be influencing the estimates, as well as how people would combine information about the two continents. Note that North America should act as an anchor, or reference point, because it is more familiar to North American participants than is South America on many dimensions besides location. Moreover, North American residents should take a North American perspective when making their estimates (cf. Holyoak & Mah, 1982). If North America does act as a reference point, North American seeds should influence South American estimates more than South American seeds influence North American estimates (Mc- Namara & Diwadkar, 1997; Sadalla, Burroughs, & Staplin, 1980; A. Tversky, 1969). Alternatively, participants in Experiment 3 had a strong tendency to maintain the spatial relation between the Americas that they committed them- selves to with their first estimates. Experiment 4 thus enabled us to determine whether, and by how much, South American seeds would influence North American estimates
when people were explicitly given a competing North American seed.
Me&od
Participants. Participants were 271 University of Alberta undergraduates enrolled in large psychology classes. Because the test booklets were randomly distributed among students in the classes, the number of people per group ranged from 20 to 37.
Procedure and design. Participants completed two question- naires in a large classroom setting. In the first, 26 cities along with their countries were listed in a random order. This set included 13 South American cities and 13 North American cities, selected so that the sample spanned the width of the continents, and included cities from each coast as well as some inland cities. Consistent with the actual layout of the New World, the North American cities (M = 98 °) tended to lie to the west of the South American cities (M = 63°).
No knowledge ratings of the cities were collected in this experiment. At the beginning of the experiment, participants were given the longitude instructions, and this information was dis- played on a screen at the front of the room for the duration of the experiment. When all participants had turned in the first question- naire, they were given the second. The second questionnaire included information about the actual longitudes of one North American city (Halifax, Minneapolis, or Vancouver) and one South American city (Rio de Janeiro, Asuncion, or Lima). Because all participants received one seed from each region, each of the combinations of North and South American seeds defined one experimental group (e.g., one group learned the actual longitudes of Halifax and Rio, a second the actual longitudes of Halifax and Asuncion). Participants were also told that this new information was correct and that it might help them. Nine versions of the second questionnaire were created and distributed. Each version included a different pairing of the seed cities from the two continents.
Results and Discussion
Initial estimates. The means of the first estimates for each of the 26 test cities, as well as the seed cities, were computed over all 271 participants and are displayed in Figure 8. The location profile closely replicates those of the two Western Aleutians groups of Experiment 3, in that the estimates for the South American cities generally lie along the east coast of North America, and were rounded to the same numerical reference points: Average estimates across participants for all South American cities were very close to 100 ° west. Rounding also defined the range for North American cities, from the most easterly estimate at 75 ° to the most westerly at 150 ° .
Table 7 shows the mean first longitude estimates and accuracy measures across cities and observers for each region. An ANOVA on the participant means, with region as a within-subjects factor and the North and South American seeds as dummy variables, showed an overall effect of region, F(1, 262) = 62.57, p < .001, MSE = 498. The average estimates for North American cities was 114.5 °, and for South American cities it was 99.4 °, for a difference of 15.1 ° . The initial South American estimates were again far more biased than the North American estimates; the mean signed error was 36 ° versus 15 ° , respectively. The rank- order correlations show, again, that participants had a much
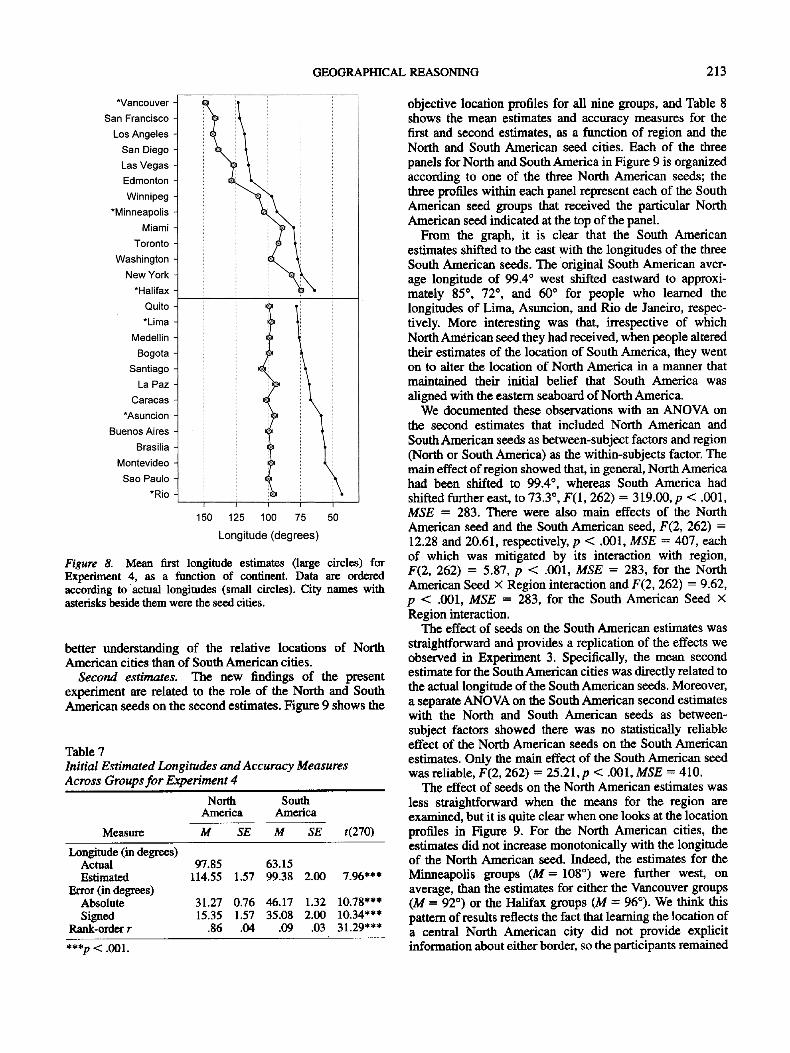
GEOGRAPHICAL REASONING 213
Figure & Mean first longitude estimates (large circles) for Experiment 4, as a function of continent. Data are ordered according to-actual longitudes (small circles). City names with asterisks beside them were the seed cities.
better understanding of the relative locations of North American cities than of South American cities.
Second estimates. The new findings of the present experiment are related to the role of the North and South American seeds on the second estimates. Figure 9 shows the
Table 7 Initial Estimated Longitudes and Accuracy Measures Across Groups for Experiment 4
North South America America
Measure M SE M SE t(270)
Longitude (in degrees) Actual 97.85 63.15 Estimated 114.55 1.57 99.38 2.00 7.96***
Error (in degrees) Absolute 31.27 0.76 46.17 1.32 10.78"** Signed 15.35 1.57 35.08 2.00 10.34"**
Rank-order r .86 .04 .09 .03 31.29"**
***p < .001.
objective location profiles for all nine groups, and Table 8 shows the mean estimates and accuracy measures for the first and second estimates, as a function of region and the North and South American seed cities. Each of the three panels for North and South America in Figure 9 is organized according to one of the three North American seeds; the three profiles within each panel represent each of the South American seed groups that received the particular North American seed indicated at the top of the panel.
From the graph, it is clear that the South American estimates shifted to the east with the longitudes of the three South American seeds. The original South American aver- age longitude of 99.4 ° west shifted eastward to approxi- mately 85 °, 72 °, and 60 ° for people who learned the longitudes of Lima, Asnncion, and Rio de Janeiro, respec- tively. More interesting was that, irrespective of which North American seed they had received, when people altered their estimates of the location of South America, they went on to alter the location of North America in a manner that maintained their initial belief that South America was aligned with the eastern seaboard of North America.
We documented these observations with an ANOVA on the second estimates that included North American and South American seeds as between-subject factors and region (North or South America) as the within-subjects factor. The main effect of region showed that, in general, North America had been shifted to 99.4 ° , whereas South America had shifted further east, to 73.3 °, F(1,262) = 319.00, p < .001, MSE = 283. There were also main effects of the North American seed and the South American seed, F(2, 262) = 12.28 and 20.61, respectively, p < .001, MSE = 407, each of which was mitigated by its interaction with region, F(2, 262) = 5.87, p < .001, MSE = 283, for the North American Seed × Region interaction and F(2, 262) = 9.62, p < .001, MSE = 283, for the South American Seed × Region interaction.
The effect of seeds on the South American estimates was straightforward and provides a replication of the effects we observed in Experiment 3. Specifically, the mean second estimate for the South American cities was directly related to the actual longitude of the South American seeds. Moreover, a separate ANOVA on the South American second estimates with the North and South American seeds as between- subject factors showed there was no statistically reliable effect of the North American seeds on the South American estimates. Only the main effect of the South American seed was reliable, F(2, 262) = 25.21,p < .001, MSE = 410.
The effect of seeds on the North American estimates was less straightforward when the means for the region are examined, but it is quite clear when one looks at the location profiles in Figure 9. For the North American cities, the estimates did not increase monotonically with the longitude of the North American seed. Indeed, the estimates for the Minneapolis groups (M = 108 °) were further west, on average, than the estimates for either the Vancouver groups (M = 92 °) or the Halifax groups (M = 96°). We think this pattern of results reflects the fact that learning the location of a central North American city did not provide explicit information about either border, so the participants remained
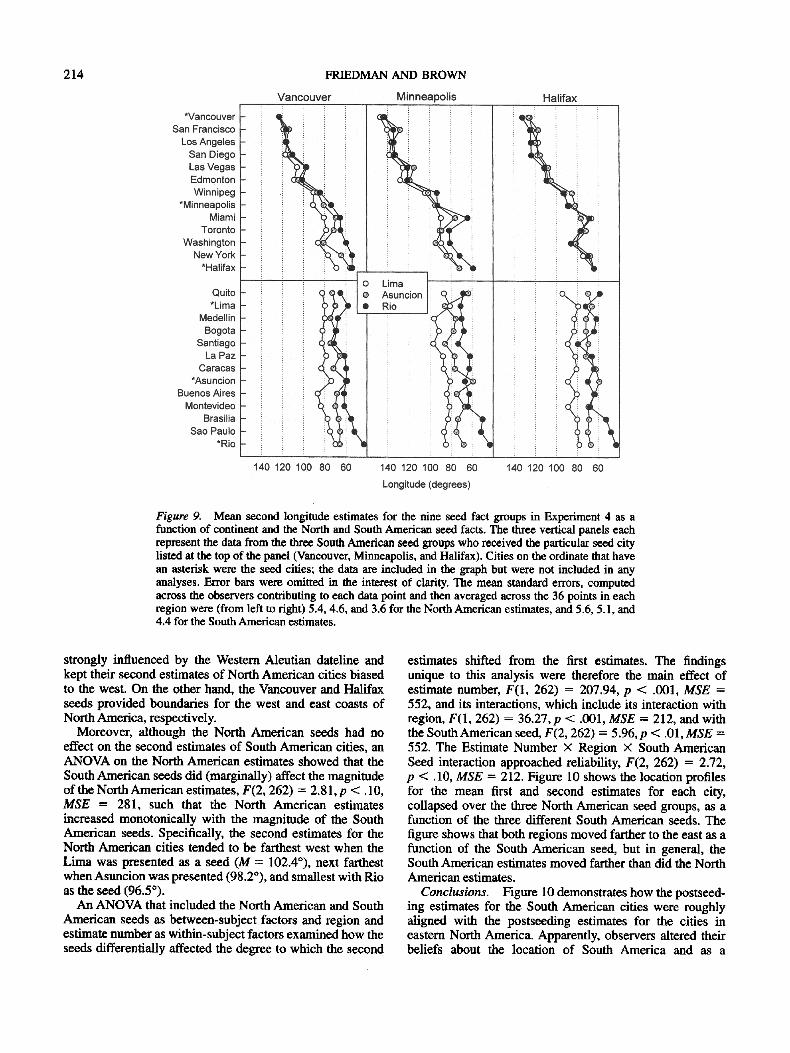
214 FRIEDMAN AND BROWN
Figure 9. Mean second longitude estimates for the nine seed fact groups in Experiment 4 as a function of continent and the North and South American seed facts. The three vertical panels each represent the data from the three South American seed groups who received the particular seed city listed at the top of the panel (Vancouver, Minneapolis, and Halifax). Cities on the ordinate that have an asterisk were the seed cities; the data are included in the graph but were not included in any analyses. Error bars were omitted in the interest of clarity. The mean standard errors, computed across the observers contributing to each data point and then averaged across the 36 points in each region were (from left to right) 5.4, 4.6, and 3.6 for the North American estimates, and 5.6, 5.1, and 4.4 for the South American estimates.
strongly influenced by the Western Aleutian dateline and kept their second estimates of North American cities biased to the west. On the other hand, the Vancouver and Halifax seeds provided boundaries for the west and east coasts of North America, respectively.
Moreover, although the North American seeds had no effect on the second estimates of South American cities, an ANOVA on the North American estimates showed that the South American seeds did (marginally) affect the magnitude of the North American estimates, F(2, 262) = 2.81, p < . 10, M S E = 281, such that the North American estimates increased monotonically with the magnitude of the South American seeds. Specifically, the second estimates for the North American cities tended to be farthest west when the Lima was presented as a seed (M = 102.4°), next farthest when Asuncion was presented (98.2°), and smallest with Rio as the seed (96.5°).
An ANOVA that included the North American and South American seeds as between-subject factors and region and estimate number as within-subject factors examined how the seeds differentially affected the degree to which the second
estimates shifted from the first estimates. The findings unique to this analysis were therefore the main effect of estimate number, F(1, 262) = 207.94, p < .001, M S E = 552, and its interactions, which include its interaction with region, F(1,262) = 36.27,p < .001, M S E = 212, and with the South American seed, F(2, 262) = 5.96,p < .01, M S E = 552. The Estimate Number X Region × South American Seed interaction approached reliability, F(2, 262) = 2.72, p < .10, M S E = 212. Figure 10 shows the location profiles for the mean first and second estimates for each city, collapsed over the three North American seed groups, as a function of the three different South American seeds. The figure shows that both regions moved farther to the east as a function of the South American seed, but in general, the South American estimates moved farther than did the North American estimates.
Conclus ions . Figure 10 demonstrates how the postseed- ing estimates for the South American cities were roughly aligned with the postseeding estimates for the cities in eastern North America. Apparently, observers altered their beliefs about the location of South America and as a
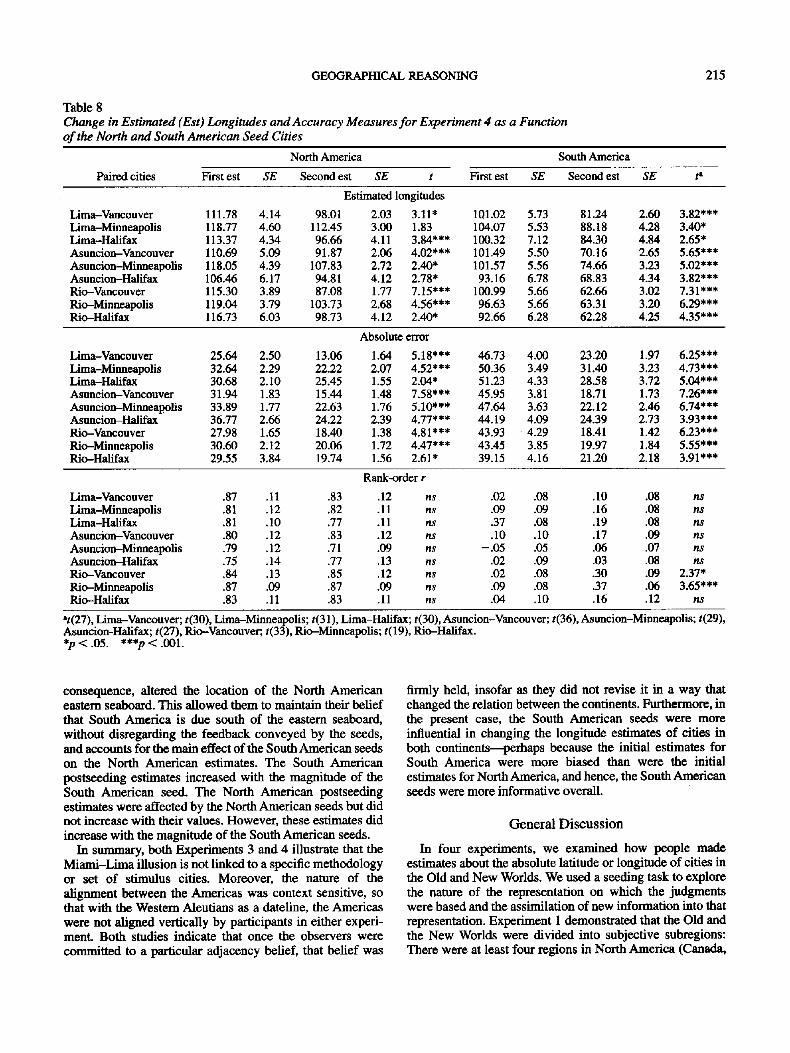
GEOGRAPI-I]CAL REASONING 215
Table 8 C h a n g e in E s t i m a t e d (Est) L o n g i t u d e s a n d A c c u r a c y M e a s u r e s f o r E x p e r i m e n t 4 as a F u n c t i o n o f the N o r t h a n d S o u t h A m e r i c a n S e e d Ci t ies
NorthAmenca
Paired cities First est SE Second est SE t First est
SouthAmenca
SE Second est SE t a
Estimated longitudes
Lima-Vancouver 111.78 4.14 98.01 2.03 3.11 * 101.02 5.73 Lima-Minneapolis 118.77 4.60 112.45 3.00 1.83 104.07 5.53 Lima-Halifax 113.37 4.34 96.66 4.11 3.84*** 100.32 7.12 Asuncion-Vancouver 110.69 5.09 91.87 2.06 4.02*** 101.49 5.50 Asuncion-Minneapolis 118.05 4.39 107.83 2.72 2.40* 101.57 5.56 Asuncion-Halifax 106.46 6.17 94.81 4.12 2.78* 93.16 6.78 Rio-Vancouver 115.30 3.89 87.08 1.77 7.15"** 100.99 5.66 Rio-Minneapolis 119.04 3 .79 103.73 2.68 4.56*** 96.63 5.66 Rio-Halifax 116.73 6.03 98.73 4.12 2.40* 92.66 6.28
81.24 2.60 3.82*** 88.18 4.28 3.40* 84.30 4.84 2.65* 70.16 2.65 5.65*** 74.66 3.23 5.02*** 68.83 4.34 3.82*** 62.66 3.02 7.31"** 63.31 3.20 6.29*** 62.28 4.25 4.35***
Absolute error
Lima-Vancouver 25.64 2.50 13.06 1.64 5.18"** 46.73 4.00 Lima-Minneapolis 32.64 2.29 22.22 2.07 4.52*** 50.36 3.49 Lima-Halifax 30.68 2.10 25.45 1.55 2.04* 51.23 4.33 Asuneion-Vancouver 31.94 1.83 15.44 1.48 7.58*** 45.95 3.81 Asnneion-Minneapolis 33.89 1.77 22.63 1.76 5.10"** 47.64 3.63 Astmcion--Halifax 36.77 2.66 24.22 2.39 4.77*** 44.19 4.09 Rio-Vancouver 27.98 1.65 18.40 1.38 4.81"** 43.93 4.29 Rio-Minneapolis 30.60 2.12 20.06 1.72 4.47*** 43.45 3.85 Rio-Halifax 29.55 3.84 19.74 1.56 2.61" 39.15 4.16
23.20 1.97 6.25*** 31.40 3.23 4.73*** 28.58 3.72 5.04*** 18.71 1.73 7.26*** 22.12 2.46 6.74*** 24.39 2.73 3.93*** 18.41 1.42 6.23*** 19.97 1.84 5.55*** 21.20 2.18 3.91"**
Rank-order r
Lima-Vancouver .87 .11 .83 .12 ns .02 .08 Lima-Minneapolis .81 .12 .82 .11 ns .09 .09 Lima-Halifax .81 .10 .77 .11 ns .37 .08 Asuncion-Vancouver .80 .12 .83 .12 ns .10 .10 Asuncion-Minneapolis .79 .12 .71 .09 ns -.05 .05 Asuncion-Halifax .75 .14 .77 .13 ns .02 .09 Rio-Vancouver .84 .13 .85 .12 ns .02 .08 Rio-Minneapolis .87 .09 .87 .09 ns .09 .08 Rio-Halifax .83 .11 .83 .11 ns .04 .10
.10 .08 ns
.16 .08 ns
.19 .08 ns
.17 .09 ns
.06 .07 ns
.03 .08 ns
.30 .09 2.37*
.37 .06 3.65***
.16 .12 ns
"t(27), Lima-Vancouver; t(30), Lima-Minneapolis; t(31), Lima-Halifax; t(30), Asuncion-Vancouver; Astmcion-Halifax; t(27), Rio-Vancouver; t(33), Rio-Minneapolis; t(19), Rio-Halifax. *p < .05. ***p < .001.
t(36), Asuncion-Minneapolis; t(29),
consequence, altered the location of the North American eastern seaboard. This allowed them to maintain their belief that South America is due south of the eastern seaboard, without disregarding the feedback conveyed by the seeds, and accounts for the main effect of the South American seeds on the North American estimates. The South American postseeding estimates increased with the magnitude of the South American seed. The North American postseeding estimates were affected by the North American seeds but did not increase with their values. However, these estimates did increase with the magnitude of the South American seeds.
In summary, both Experiments 3 and 4 illustrate that the Miami-Lima illusion is not linked to a specific methodology or set of stimulus cities. Moreover, the nature of the alignment between the Americas was context sensitive, so that with the Western Aleutians as a dateline, the Americas were not aligned vertically by participants in either experi- ment. Both studies indicate that once the observers were committed to a particular adjacency belief, that belief was
fmnly held, insofar as they did not revise it in a way that changed the relation between the continents. Furthermore, in the present case, the South American seeds were more influential in changing the longitude estimates of cities in both continentswperhaps because the initial estimates for South America were more biased than were the initial estimates for North America, and hence, the South American seeds were more informative overall.
General Discussion
In four experiments, we examined how people made estimates about the absolute latitude or longitude of cities in the Old and New Worlds. We used a seeding task to explore the nature of the representation on which the judgments were based and the assimilation of new information into that representation. Experirnent 1 demonstrated that the Old and the New Worlds were divided into subjective subregions: There were at least four regions in North America (Canada,
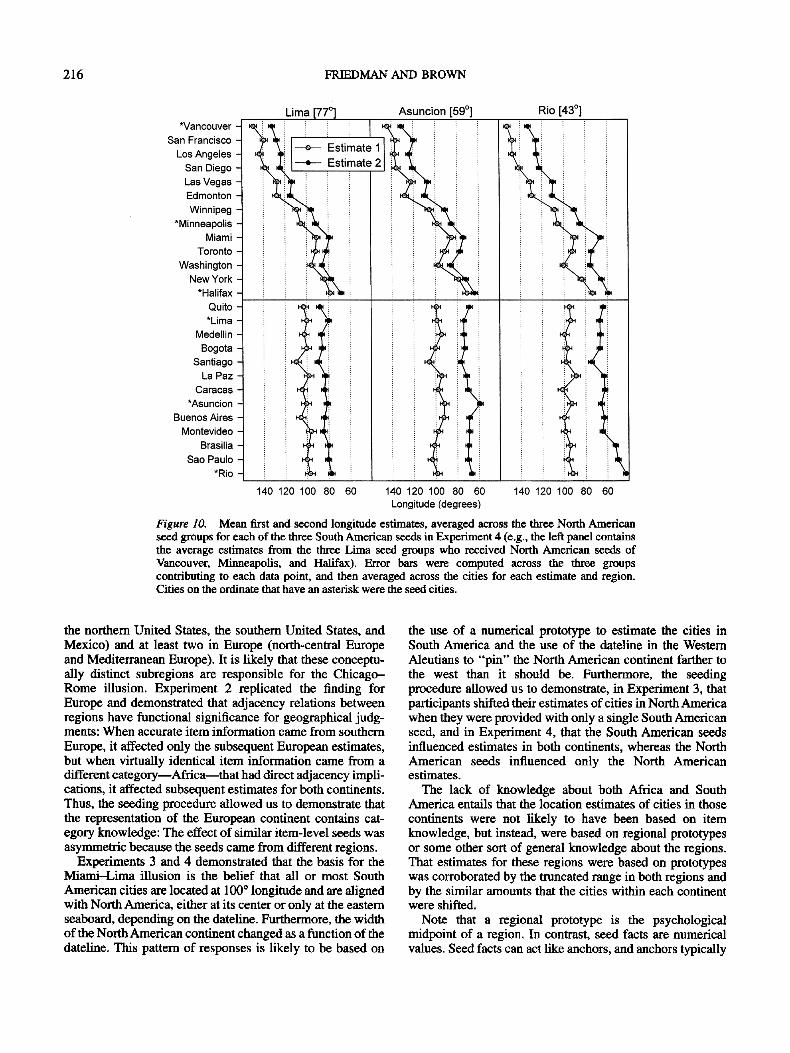
216 FRIEDMAN AND BROWN
Figure 10. Mean first and second longitude estimates, averaged across the three North American seed groups for each of the three South American seeds in Experiment 4 (e.g., the left panel contains the average estimates from the three Lima seed groups who received North American seeds of Vancouver, Minneapolis, and Halifax). Error bars were computed across the three groups contributing to each data point, and then averaged across the cities for each estimate and region. Cities on the ordinate that have an asterisk were the seed cities.
the northern United States, the southern United States, and Mexico) and at least two in Europe (north-central Europe and Mediterranean Europe). It is likely that these conceptu- ally distinct subregions are responsible for the Chicago- Rome illusion. Experiment 2 replicated the finding for Europe and demonstrated that adjacency relations between regions have functional significance for geographical judg- ments: When accurate item information came from southern Europe, it affected only the subsequent European estimates, but when virtually identical item information came from a different category--Africa that had direct adjacency impli- cations, it affected subsequent estimates for both continents. Thus, the seeding procedure allowed us to demonstrate that the representation of the European continent contains cat- egory knowledge: The effect of similar item-level seeds was asymmetric because the seeds came from different regions.
Experiments 3 and 4 demonstrated that the basis for the Miami-Lima illusion is the belief that all or most South American cities are located at 100 ° longitude and are aligned with North America, either at its center or only at the eastern seaboard, depending on the dateline. Furthermore, the width of the North American continent changed as a function of the dateline. This pattern of responses is likely to be based on
the use of a numerical prototype to estimate the cities in South America and the use of the dateline in the Western Aleutians to "pin" the North American continent farther to the west than it should be. Furthermore, the seeding procedure allowed us to demonstrate, in Experiment 3, that participants shifted their estimates of cities in North America when they were provided with only a single South American seed, and in Experiment 4, that the South American seeds influenced estimates in both continents, whereas the North American seeds influenced only the North American estimates.
The lack of knowledge about both Africa and South America entails that the location estimates of cities in those continents were not likely to have been based on item knowledge, but instead, were based on regional prototypes or some other sort of general knowledge about the regions. That estimates for these regions were based on prototypes was corroborated by the truncated range in both regions and by the similar amounts that the cities within each continent were shifted.
Note that a regional prototype is the psychological midpoint of a region. In contrast, seed facts are numerical values. Seed facts can act like anchors, and anchors typically
GEOGRAPHICAL REASONING 217
draw things toward them. In geography, however, it appears that seeds, as anchors, can affect judgments in several ways. Occasionally, an anchor is a functional prototype, as when items are drawn toward it and eventually cluster around it. This kind of anchoring appeared to occur with some of the South American seeds in Experiments 3 and 4. More often, an anchor acts like a boundary, so that items are drawn toward it but not beyond it. This kind of anchoring was seen when the African cities were drawn toward, but not beyond, the north African seeds in Experiment 2. However, because of the spatial relations inherent between regions, when seeds assume the role o f regional boundaries they can "push" cities away from them (e.g., the movement of southern Europe with the north African seeds). Furthermore, seeds that provide regional boundaries may affect estimates in both locally adjacent and globally coordinate regions, be- cause the spatial relations between the regions must remain coherent (A. Friedman & Brown, in press). The circum- stances under which seeds assume each of these roles are not clear and should provide a topic for future research. Nevertheless, it is clear that when the seeding procedure is combined with the subjective location profiles, it provides compelling evidence for the existence of psychologically distinct geographical categories and subeategories, as well as evidence for the existence and use of geographical prototypes. The prototype, boundary, and anchoring effects we observed are further support for the conceptual underpin- nings that are the basis of the judgments.
The variety of evidence we obtained for both inheritance- and adjacency-based inferences in the second estimates of Experiments 2-4 supports the use of plausible-reasoning strategies in the location estimate task. We think it is quite likely that plausible-reasoning processes and conceptual- level knowledge of the sort described throughout this article are also used in other tasks requiring geographical judg- ments, including distance estimates (Holyoak & Mah, 1982), comparative location estimates (Maki, 1981; Stevens & Coupe, 1978), and bearing estimates (Glicksohn, 1994; B. Tversky, 1981). Note that we are not claiming that mental maps do not exist, nor do we think that perceptually based representations of large-scale geography always play a secondary role to more conceptually based representations. However, in the plansible-reasoning view, many phenomena that appear to be perceptually based have alternative expla- nations. For example, in the Glicksohn (1994) study, if the knowledge that north is at 90 ° is combined with the belief that cities in northern Israel are due north of cities in southern Israel, then one readily predicts exactly the 15 ° (point estimate) discrepancy between actual and estimated locations that he obtained, without reference to analog representations or image processes. Moreover, although the belief that cities in northern Israel are due north of cities in southern Israel could have been caused by the normalization of map-derived memories, it seems equally plausible that such beliefs could stem from a variety of other sources. These include, for example, having been told that certain cities are north of others or driving from one region to another (few highway exit signs indicate anything other than the cardinal directions).
Thus, although we do not deny that maps are an important source of geographical knowledge, the apparent simplifica- tion of geographical knowledge may have many sources. Consequently, another direction for future research is to delineate the circumstances under which either plausible reasoning with different kinds of knowledge or the use of perceptual or imaginal processes play a role in all kinds of judgments about geography. The delineation of these differ- ent circumstances probably is not as simple as categorizing the different stimulus domains in which observers make memorial and perceptual spatial judgments (e.g., maps vs. stories or maps vs. graphs; B. Tversky, 1997; B. Tversky & Schiano, 1989). It may be that a more important distinction is between geographical knowledge gained from direct navigational experience (e.g., Thorndyke & Hayes-Roth, 1982) versus knowledge acquired from maps. Yet even that distinction seems simplistic, when one considers the ways in which these two kinds of knowledge may be queried and used in different circumstances (e.g., giving directions; making time or distance estimates; recalling landmarks; figuring out a detour).
Recently, Huttenlocher (Huttenlocher et al., 1988; 1991), Kosslyn (1995), McNamara and Diwadkar (1997), and B. Tversky (1997) have each concluded, albeit for different reasons and regarding different sets of data, that spatial judgments in a variety of tasks draw on multiple sources of knowledge. We agree. Furthermore, McNamara and Didwad- kar concluded, from the asymmetries they found in spatial judgments, that stimuli retrieved from long-term memory are interpreted and scaled by the context in which the retrieval takes place. This idea is not far from the idea we have put forward regarding the multiple types of information that are activated and then used in judgments in general. Part of that information is surely given by context (e.g., seeds). We merely add that the plansible-reasoning framework is useful here because the fundamental assumption of this framework is that people use whatever information is at hand to aid their judgment and decision-making processes and that what is "at hand" may change with a variety of factors.
The contributions of this research are thus twofold. First, we have explained a diverse set of findings in our own data and provided a framework for re-evaluating and further understanding a diverse set of findings from other geographi- cal judgment tasks. Second, the plausible-reasoning frame- work we outline provides a model of how decisions are reached in other complex domains. What all such domains have in common is that the sources of knowledge are varied, the knowledge itself is usually limited, and its representation plays an important role in how it is retrieved, evaluated, and used in making judgments.
In conclusion, the four experiments presented here pro- vide converging evidence for a theory of estimation pro- cesses in which people either combine information from an item level and a category level or (in the absence of item-level knowledge) use category knowledge to generate their estimates. In the case of geography, even when item-level knowledge is sparse, people can go a long way by using regional prototypes. The data therefore also provide
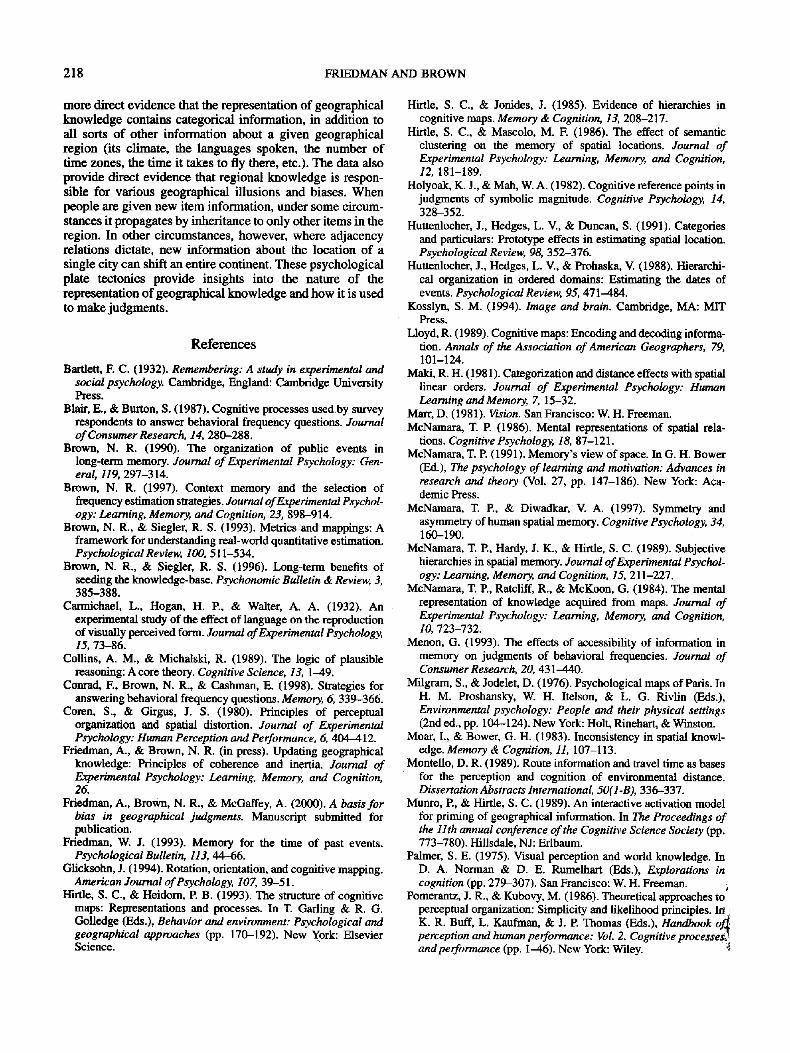
218 FRIEDMAN AND BROWN
more direct evidence that the representation of geographical knowledge contains categorical information, in addition to all sorts o f other information about a given geographical region (its climate, the languages spoken, the number of time zones, the time it takes to fly there, etc.). The data also provide direct evidence that regional knowledge is respon- sible for various geographical illusions and biases. When people are given new item information, under some circum- stances it propagates by inheritance to only other items in the region. In other circumstances, however, where adjacency relations dictate, new information about the location of a single city can shift an entire continent. These psychological plate tectonics provide insights into the nature of the representation of geographical knowledge and how it is used to make judgments.
R e f e r e n c e s
Bartlett, E C. (1932). Remembering: A study in experimental and social psychology. Cambridge, England: Cambridge University Press.
Blair, E., & Burton, S. (1987). Cognitive processes used by survey respondents to answer behavioral frequency questions. Journal of Consumer Research, 14, 280-288.
Brown, N. R. (1990). The organization of public events in long-term memory. Journal of Experimental Psychology: Gen- eral 119, 297-314.
Brown, N. R. (1997). Context memory and the selection of frequency estimation strategies. Journal of Experimental Psychol- ogy: Learning, Memory, and Cognition, 23, 898-914.
Brown, N. R., & Siegler, R. S. (1993). Metrics and mappings: A framework for understanding real-world quantitative estimation. Psychological Review, 100, 511-534.
Brown, N. R., & Siegler, R. S. (1996). Long-term benefits of seeding the knowledge-base. Psychonomic Bulletin & Review, 3, 385-388.
Carmichael, L., Hogan, H. P., & Walter, A. A. (1932). An experimental study of the effect of language on the reproduction of visually perceived form. Journal of Experimental Psychology, 15, 73-86.
Collins, A. M., & Michalski, R. (1989). The logic of plausible reasoning: A core theory. Cognitive Science, 13, 1-49.
Conrad, F., Brown, N. R., & Cashman, E. (1998). Strategies for answering behavioral frequency questions. Memory, 6, 339-366.
Coren, S., & Girgus, J. S. (1980). Principles of perceptual organization and spatial distortion. Journal of Experimental Psychology: Human Perception and Performance, 6, 404-412.
Friedman, A., & Brown, N. R. (in press). Updating geographical knowledge: Principles of coherence and inertia. Journal of Experimental Psychology: Learning, Memory, and Cognition, 26.
Friedman, A., Brown, N. R., & McGaffey, A. (2000). A basis for bias in geographical judgments. Manuscript submitted for publication.
Friedman, W. J. (1993). Memory for the time of past events. Psychological Bulletin, 113, a.a 66.
Glicksohn, J. (1994). Rotation, orientation, and cognitive mapping. American Journal of Psychology, 107, 39-51.
Hirtle, S. C., & Heidom, P. B. (1993). The structure of cognitive maps: Representations and processes. In T. Gading & R. G. Golledge (Eds.), Behavior and environment: Psychological and geographical approaches (pp. 170-192). New York: Elsevier Science.
Hirfle, S. C., & Jonides, J. (1985). Evidence of hierarchies in cognitive maps. Memory & Cognition, 13, 208-217.
Hirtle, S. C., & Mascolo, M. E (1986). The effect of semantic clustering on the memory of spatial locations. Journal of Experimental Psychology: Learning, Memory, and Cognition, 12, 181-189.
Holyoak, K. J., & Mah, W. A. (1982). Cognitive reference points in judgments of symbolic magnitude. Cognitive Psychology, 14, 328-352.
Huttenlocher, J., Hedges, L. V., & Duncan, S. (1991). Categories and particulars: Prototype effects in estimating spatial location. Psychological Review, 98, 352-376.
Huttenlocher, J., Hedges, L. V., & Prohaska, V. (1988). Hierarchi- cal organization in ordered domains: Estimating the dates of events. Psychological Review, 95, 471-484.
Kosslyn, S. M. (1994). Image and brain. Cambridge, MA: MIT Press.
Lloyd, R. (1989). Cognitive maps: Encoding and decoding informa- tion. Annals of the Association of American Geographers, 79, 101-124.
Maki, R. H. (!981). Categorization and distance effects with spatial linear orders. Journal of Experimental Psychology: Human Learning and Memory, 7, 15-32.
Marr, D. (1981). Vision. San Francisco: W. H. Freeman. McNamara, T. P. (1986). Mental representations of spatial rela-
tions. Cognitive Psychology, 18, 87-121. McNamara, T. P. (1991). Memory's view of space. In G. H. Bower
(Ed.), The psychology of learning and motivation: Advances in research and theory (Vol. 27, pp. 147-186). New York: Aca- demic Press.
McNamara, T. P., & Diwadkar, V. A. (1997). Symmetry and asymmetry of human spatial memory. Cognitive Psychology, 34, 160-190.
McNamara, T. P., Hardy, J. K., & Hirtle, S. C. (1989). Subjective hierarchies in spatial memory. Journal of Experimental Psychol- ogy: Learning, Memory, and Cognition, 15, 211-227.
McNamara, T. P., Ratcliff, R., & McKoon, G. (1984). The mental representation of knowledge acquired from maps. Journal of Experimental Psychology: Learning, Memory, and Cognition, 10, 723-732.
Menon, G. (1993). The effects of accessibility of information in memory on judgments of behavioral frequencies. Journal of Consumer Research, 20, 431--440.
Milgram, S., & Jodelet, D. (1976). Psychological maps of Pads. In H. M. Proshansky, W. H. Itelson, & L. G. Rivlin (F_xts.), Environmental psychology: People and their physical settings (2rid ed., pp. 104-124). New York: Holt, Rinehart, & Winston.
Moar, I., & Bower, G. H. (1983). Inconsistency in spatial knowl- edge. Memory & Cognition, 11, 107-113.
Montello, D. R. (1989). Route information and travel time as bases for the perception and cognition of environmental distance. Dissertation Abstracts International, 50(1-B), 336-337.
Munro, P., & Hirtle, S. C. (1989). An interactive activation model for priming of geographical information. In The Proceedings of the 11th annual conference of the Cognitive Science Society (pp. 773-780). Hillsdale, NJ: Erlbaum.
Palmer, S. E. (1975). Visual perception and world knowledge. In D. A. Norman & D. E. Rumelhart (Eds.), Explorations in cognition (pp. 279-307). San Francisco: W. H. Freeman.
Pomerantz, J. R., & Kubovy, M. (1986). Theoretical approaches to perceptual organization: Simplicity and likelihood principles. In i K. R. Buff, L. Kaufman, & J. P. Thomas (Eds.), Handbook o 4 perception and human performance: Vol. 2. Cognitive processes2~ and performance (pp. 1-46). New York: Wiley. '~