Embed Size (px)
Citation preview
HDP: 15 – 05
The Resonator Banjo Resonator, part 2:
What makes ’em “really crack”?
David Politzer∗
California Institute of Technology
(Dated: June 17, 2015)
A simple experiment quantifies the difference between the sound production of
a banjo with and without a resonator back. Driven by a small tweeter mounted
inside the pot, for frequencies above about 4500 Hz, the produced external sound is
6 to 10 dB louder with the resonator than without. With the banjo played in any
normal fashion, this gives a negligible contribution to the overall volume. However,
that difference is clearly a reflection of the universally recognized resonator sound,
in close analogy to plosive consonants in human speech. No direct correlation is
observed between the head-resonator separation and the spectrum of the enhanced
response. This suggests that direct reflection off the back is not a primary contributor
to the resonator/openback difference, leaving differences in overall absorption as the
major suspect.
∗[email protected]; http://www.its.caltech.edu/~politzer; 452-48 Caltech, Pasadena CA 91125
2
The Resonator Banjo Resonator, part 2: What makes ’em “really crack”?
I. INTRODUCTION
What is the role of the resonator on a resonator banjo? A previous exploration[1] found
that it doesn’t make the banjo particularly louder overall — as compared to the same
instrument with the resonator removed. This observation was well-known to some players
and regarded as obvious nonsense by others. However, there is no disagreement that the
presence of the resonator changes the sound, producing something with sharper projection,
better articulation, and subtly different tone. It allows the banjo to cut through the sound
of other instruments. Other aspects of the timbre change as well. In its extreme version, it
is said that a fine resonator banjo “really cracks.”
I couldn’t identify any easily quantifiable, distinguishing features in sound recordings of
normal playing — not in the time sequence, its frequency spectrum, or any combination of
the two. The features common to resonator on versus off were too overwhelming. But I
thought of an experiment that might highlight the differences.
Normal banjo sound production proceeds as follows: The plucked string moves the bridge;
the bridge moves the head; and most of the sound comes directly off the head. The head
also sets in motion the air inside the pot (the cylindrical volume between the head, rim, and
back [resonator or player’s belly]). Some of the pot sound comes out the sound hole (the
space between the rim and back), and some reacts back on the head, altering its motion and,
hence, the sound it produces. Changing the back can change the way the pot air responds
to being driven, which, in turn, effects the total produced sound.
II. THE TWEETER-DRIVEN POT
In ref. [1], simple measures of overall loudness did not distinguish a resonator from an
openback played naturally or with an ersatz experimental-grade “synthetic” belly (con-
structed of cotton fabric, cork, and closed-cell foam to approximate reflection and absorp-
tion of a real belly in a reproducible fashion). The detailed analysis was restricted to below
4000 Hz. In spite of the banjo being far richer in its high frequency production than other
instruments, the power spectrum nevertheless drops dramatically with increasing frequency.
3
There’s just not much power at higher frequencies. However, in speech and song, frequen-
cies much higher than musical fundamental pitches are crucial to understanding the words.
Consonants, particularly stops or plosives, are very short-time features that don’t appear
in simple spectral analysis or energy accounting. But our brains efficiently process their
meaning.
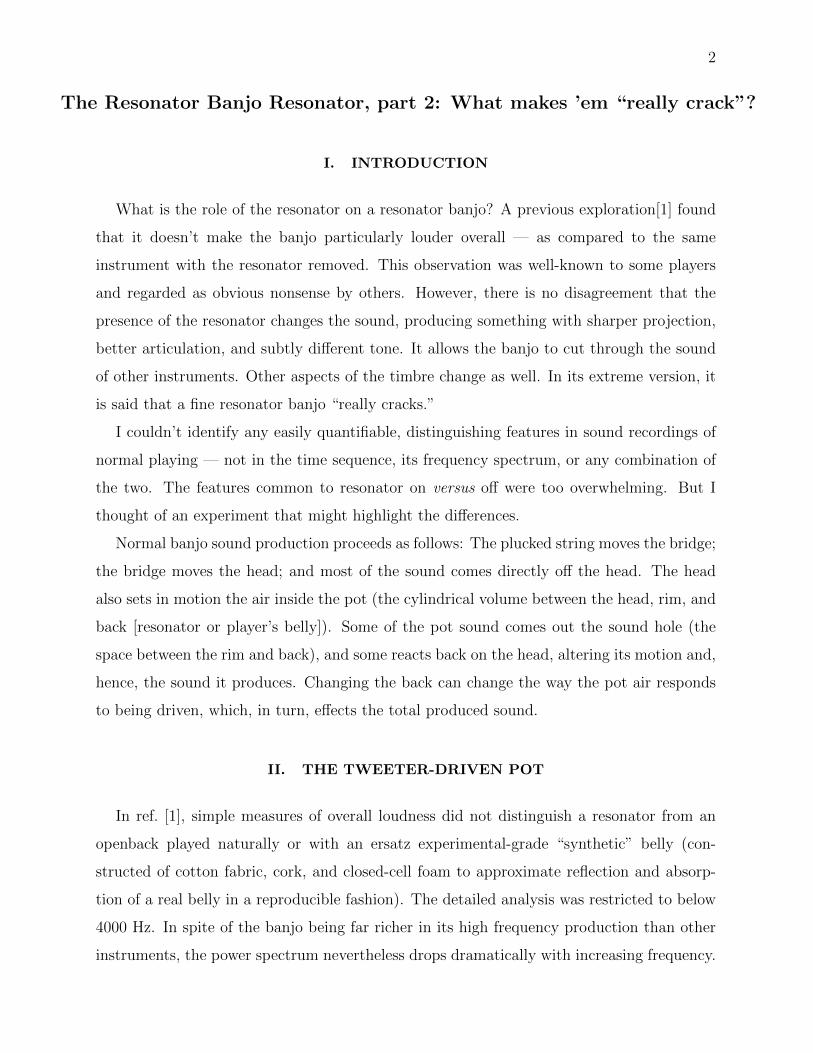
I decided to look at external sound production driven by high frequency vibration intro-
duced inside the pot. I mounted a 3/4′′ tweeter inside a Deering Sierra, damped the strings,
swept the tweeter slowly in frequency from 150 to 20,000 Hz at fixed amplitude. I recorded
with a microphone at 7′′ from the head, facing toward the plane of the head, but located
above the edge. More details of the set-up and discussion of the results are given later.
FIG. 1. Resonator banjo, 3/4′′ tweeter, and synthetic belly
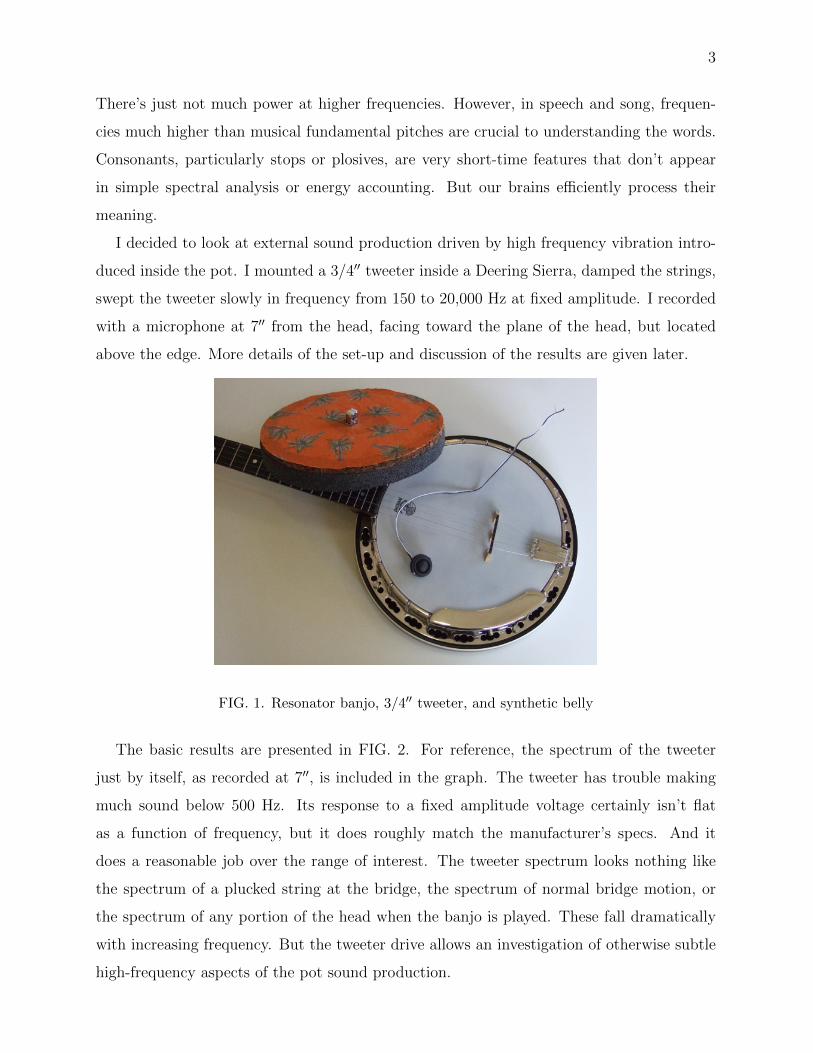
The basic results are presented in FIG. 2. For reference, the spectrum of the tweeter
just by itself, as recorded at 7′′, is included in the graph. The tweeter has trouble making
much sound below 500 Hz. Its response to a fixed amplitude voltage certainly isn’t flat
as a function of frequency, but it does roughly match the manufacturer’s specs. And it
does a reasonable job over the range of interest. The tweeter spectrum looks nothing like
the spectrum of a plucked string at the bridge, the spectrum of normal bridge motion, or
the spectrum of any portion of the head when the banjo is played. These fall dramatically
with increasing frequency. But the tweeter drive allows an investigation of otherwise subtle
high-frequency aspects of the pot sound production.
4
!70$
!60$
!50$
!40$
!30$
!20$
!10$0$ 5000$ 10000$ 15000$ 20000$
power&(d
B)&
frequency&(Hz)&
tweeter4driven&pot&
resonator$belly$back$tweeter$resonator$(avg$of$4)$
FIG. 2. sound production of the tweeter frequency sweep
!3#
0#
3#
6#
9#
12#
0# 5000# 10000# 15000# 20000#
ra#o
%of%reson
ator%to
%belly%back%%(d
B)%
frequency%%(Hz)%
resonator/belly%
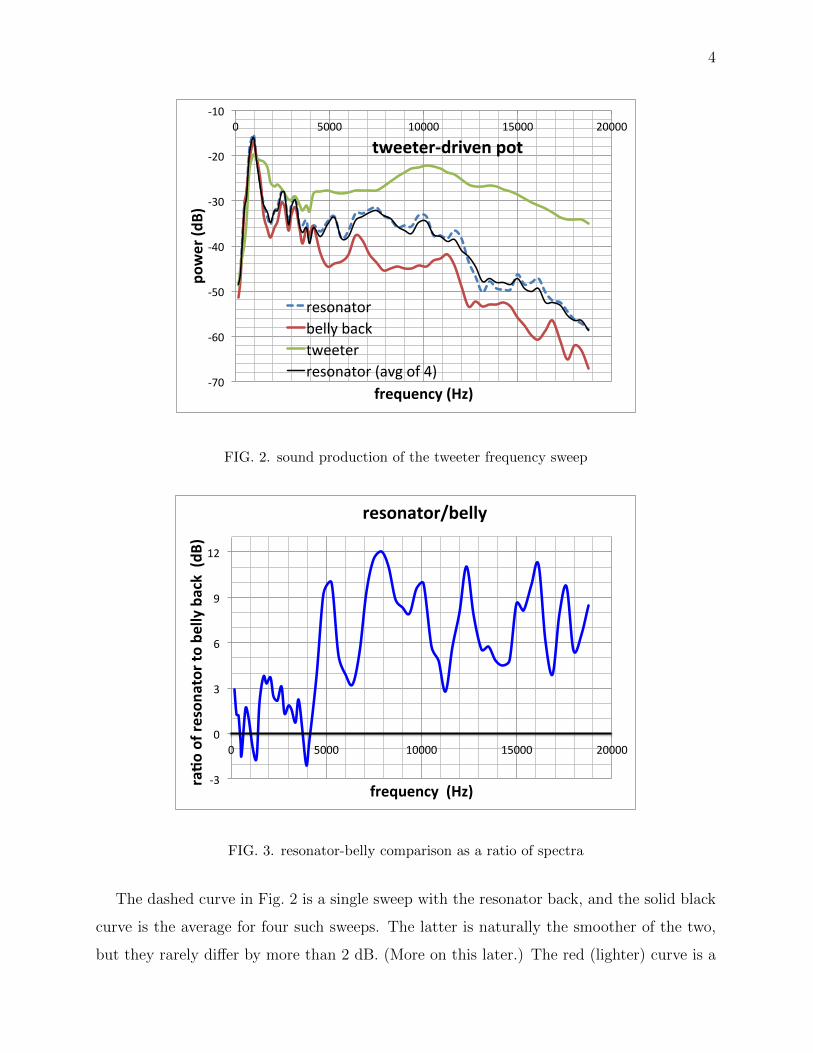
FIG. 3. resonator-belly comparison as a ratio of spectra
The dashed curve in Fig. 2 is a single sweep with the resonator back, and the solid black
curve is the average for four such sweeps. The latter is naturally the smoother of the two,
but they rarely differ by more than 2 dB. (More on this later.) The red (lighter) curve is a
5
sweep with the synthetic belly back. (See ref.s [1] and [2] for belly details.) Between 1400
and 3700 Hz, the resonator back is typically about 2 dB louder. That kind of difference
is often considered barely perceptible. However, starting at about 4400 Hz, the difference
between the two backs is dramatic and remains so over the entire high frequency range.
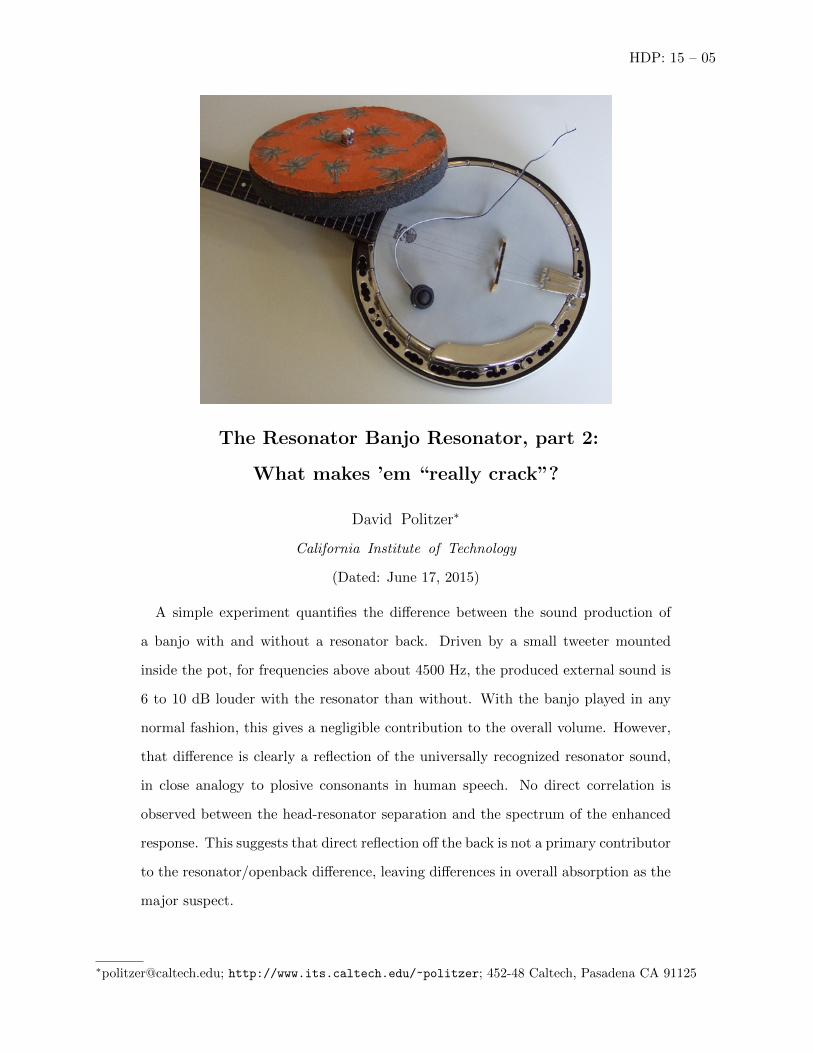
To emphasize the identification of the difference between the resonator and belly back,
I plot their ratio in FIG. 3. Decibels give a logarithmic measure, and the plot is of the
decibel differences between backs. In terms of the actual microphone signal as an oscillating
voltage, what is calculated is the ratio of the spectra — and then that ratio is expressed in
decibels. A zero decibel difference indicates equal strength signals.
III. THE LESSON
Apparently, the resonator improves the produced sound response to high frequency exci-
tation of the pot. But we do not listen to musical pitches in that high frequency range. In
fact, it is difficult (or even impossible) to distinguish the pitch of pure sinusoidal tones above
some frequency. For me, that’s anything over about 5000 Hz. That frequency and above are
quite audible, but they just sound like identical squeals. At some much higher frequency,
pure tones become totally inaudible. However, these frequencies contribute to the sound
and timbre of musical notes. Likely, even much of the “inaudible” range contributes to dis-
tinctions in sound that we can hear. Perception of sound is not simply a matter of frequency
decomposition. Rather, we simultaneously process our auditory inputs in a variety of ways.
We consider both the time sequence and frequency content. We evaluate intervals of various
lengths in each (rather than simply point-by-point functions[3]). And these parallel lines of
analysis exchange partial results along the way — enhancing the effectiveness of each. We
are certainly aware of and can distinguish features of sound that rely on very high frequency
components, such as dramatic changes that occur very quickly.
One can divide the pot interior’s impact on sound into two parts: 1) its reaction back onto
the head and 2) the sound radiated from the sound hole. The interaction between the head
and the air inside the pot is quite complex. They are in direct contact, pushing on each other,
over a dynamic surface. The very lowest and also the asymptotically highest frequencies are
simple to picture, but it is the intervening ones that are relevant to music. Nevertheless, it
is clear that the resonator back dissipates considerably less vibrational energy above 5000
6
Hz than a belly. So more energy is available for sound. In the pure time domain description,
the resonator back enables a more faithful produced-sound response to the driving by the
plucked strings.
Elementary acoustical science tells us about the sound radiation from sound holes in two
limiting cases. If the sound wavelength is much longer than the sound hole’s dimensions,
then sound is radiated isotropically but only very weakly. If the sound wavelength is much
shorter than the sound hole’s dimensions, then sound is narrowly beamed in the forward
direction and is of relatively strong amplitude. Inbetween is inbetween, but that’s where
banjos live. 100 to 20,000 Hz corresponds to wavelengths between 10 feet and 11/16 of an
inch. Its high frequency strength gives the resonator banjo an advantage over the open back
both in terms of directionality of projection and the amount of direct radiation from the
sound hole. The directionality aspect is probably why resonator banjo design has settled
for the past century on the forward facing sound hole rather than sideways, as provided by
a simpler flat disk back spaced slightly off the bottom of the rim.
IV. COMPARISONS OF EQUALIZED RECORDINGS
Doing a resonator banjo justice requires some decent picking. Ken LeVan, designer and
luthier extraodinaire[4], agreed to let me use some of his sound files. In particular, a short
selection of Pretty Polly is presented here, with and without a resonator on the same banjo,
recorded as identically as possible. Of course they sound different — although the differences
might only be immediately apparent to people who listen a lot to banjos.
To test the relevance of the tweeter drive results to actual music listening, I constructed an
“equalizer” in Audacityr that is a cartoon version of the resonator enhancement shown in
FIG. 3. That equalizer can be applied to any sound file to create a new one that is enhanced,
as a function of frequency, by the specified amount. So I created an enhanced version of
Ken’s openback rendition. The listener can decide whether this gives the performance the
extra punch and sparkle characteristic of a resonator banjo. Conversely, I wrote an equalizer
function that is the inverse of the FIG. 3 resonator/belly difference and applied it to Ken’s
resonator back performance.
That makes four versions of the same short tune. The files are ppA.mp3, ppB.mp3,
ppC.mp3, and ppD.mp3. (Click on those file names or retrieve them from Banjo Physics
7
411.) Can you hear the differences and identify which is which? Good speakers help. The
answer is at the end of this paper, just before the notes and references, in Appendix B. Note
that the equalizer values came from a comparison of a Deering Sierra with and without its
resonator, and it was a crude approximation at that. The sound files are played on a LeVan
one-of-a-kind. Further adjustment of the equalizer form might have been able to bring the
corresponding real and equalized recordings even closer. The question for now is whether
the enhanced openback plausibly sounds like a resonator banjo and the suppressed resonator
sounds like an openback.
V. THE EQUALIZED SOUND, PLOSIVES, AND VOICE RECOGNITION
The application of the equalizers defined by FIG. 3 to real, recorded music files highlights
a conundrum. An openback is made to sound plausibly like a resonator banjo and vice
versa. However, FIG. 3 represents the sound produced by air oscillations in the pot. The
observed many decibel difference at high frequency is a feature of the pot and its backs, not
of the whole banjo sound. Most of banjo sound comes directly off the head. A spectrum
analysis of the original, complete, unaltered music recordings reveals only slight differences
between the backs, in spite of their being identifiably different to a listener. Processing one
of the recordings through the equalizer produces something that sounds much closer to the
other recording. But now the difference in spectra is no longer slight. It is roughly given by
FIG. 3.
A plausible resolution of the disparity is the following. Those high frequencies play at
least two idistinguishable roles. 1) They contribute to high frequency ripples superposed
onto lower frequency oscillations, and 2) they combine with each other to produce features
in the sound that are sharp as a function of time. For very high frequencies, we take notice
of 2) but are barely aware of 1). The equalizer enhances the strength of 2) in the openback
recording. It also enhances the strength of 1), but that goes largely unnoticed — and
conversely, going the other way.
An enlightening simple exercise with spoken words can be performed with a modern
computer and sound software. Record the eight, three letter words formed by {T or D},
{I or A}, and {P or B}. Multiple versions of each would help. Those four consonants are
plosives, characterized by high pressure pulses of very short duration. Played back, just by
8
themselves, they can be hard to distinguish. Furthermore, a Fourier decomposition of just
those short durations has significant power between 6000 and 20,000 Hz. Pure sinusoidal
tones of the lower end of that range of frequencies are indistinguishable to most people’s
ears, and the higher end is simply inaudible. Nevertheless, those frequencies are essential to
the understanding of speech.
Computerized voice recognition plays a variety of roles in current society, some sinister
and some not. The recognition of vowel sounds goes back to Helmholtz. He had his wife
sing vowel sounds into a piano, and he carefully noted which strings resonated. He identified
the characteristic patterns of string excitation that we now call “formants.” Fricatives are
the consonants that have extended sounds. Examples are f , j, l, m, n, s, sh, v, and z.
They come with their own enhanced regions of frequency, all rather higher than the vowels.
Plosives are the short ones, nearly instantaneous in time. They don’t involve much sound
energy, relative to the others. We hear them nevertheless.
Plosives were a challenge to computer recognition, but huge advances in computer power
have allowed a practical solution. A computer can identify all the possible plosives that
might correspond to a particular sound. The adjoining sounds will combine to make possible
words. If more than one is actually a word in the language in use, the computer can look
at the containing phrase to narrow down which makes sense. This might seem like an
elaborate algorithm. But computers do billions of steps per second. Our brains might be
doing something very similar. While we only do steps at a rate of thousands per second, we
can do zillions of such chains simultaneously. (So we’re still a bit ahead.)
VI. SOME SIMPLE PHYSICS
Qualitative aspects of sound reflection and absorption by common materials are part of
everyday experience. Elementary physics has little to add. Only the most general features
and trends can be explicated. Orderly crystals can be hard to distort, and, when they
do, they do so “elastically,” giving back the energy that had been put into the distortion.
Tangles of very long molecules might typically distort more easily and lose energy to the
friction between them. The details are consequences of molecular dynamics and are the
subject of practical studies in acoustical engineering.
But it would be helpful to understand a bit about what the sound is “doing” inside
9
the pot. “Ballistic” or “ray” trajectory descriptions, familiar from thinking about light and
common objects, can be misleading (unless one takes care to keep track of phase information
along the paths[5]). They really only make sense if the wavelength is much shorter than
the object’s dimensions. And, even then, edges of objects are inherently very short scale
features, irrespective of the overall size. So wave-like features can appear due to edges of
large objects. For wavelengths much longer than any of the object’s dimensions, the shape
of the object becomes irrelevant.
A typical physics approach is to consider the “normal modes,” i.e., resonances and res-
onant motions, of the air inside the pot. This is useful if that air motion is only weakly
coupled to other parts of the system, including both coupling to other oscillations and to
dissipative damping effects. In such cases, the actual air motion is well-approximated by
a superposition of the normal mode motions, at least for a time lasting several cycles of
the relevant modes. The case at hand, as with many cases in musical acoustics, seems to
satisfy this approximation.[6] Coupling to the head and damping of the pot air motion are
important, but they can be considered separately, after the basic air motion is understood.
The sound modes of a cylindrical cavity are well known. They are labeled by three
integers that count the number of nodal planes[7] of three basic types. There are concentric
cylinders, diameter planes equally spaced in angle, and flat disks parallel to the cylinder
top and bottom. A given mode has some number of each. If the cavity is long and thin
(like the pipe of a wind instrument), the umpteen lowest frequency modes have no cylinder
or diameter nodes. All the nodes are equally spaced disks along the length. For the squat
banjo pot, it’s the other way around. The lowest frequency modes have cylinder and diameter
plane nodes. The lowest frequency mode with a disk node plane has a wavelength in free
air given by twice the pot depth. Half of a wavelength fits in the pot from top to bottom.
This is a standing wave, but it can be equally well described as the superposition of waves
traveling back and forth between the head and the back, uniform in the plane perpendicular
to that motion. For a typical banjo, this motion is around 2500 Hz. In the vicinity of
that frequency, there are already many closely spaced resonances with radial and azimuthal
variation (i.e., cylindrical and diametrical node planes). Furthermore, above 2500 Hz, that
one disk mode gets “dressed” with air motions in the other directions, to yield yet higher
resonant frequencies. A second disk nodal plane appears around 3750 Hz, and it, too, gets
dressed with the other kinds of nodal planes.
10
This is the physicist’s answer to when air motion involving bouncing off the back is
of dynamical importance. The answer is that the frequency must correspond to travel at
the speed of sound of a wave back and forth between the head and the back. And that
gives a relatively high frequency that is inversely proportional to the pot depth. At lower
frequencies, the pot air interaction with the back is also significant, but the air behaves as
if it were not compressible in that direction. Lower frequency head motions force air in and
out the sound hole and/or push it radially and/or from side-to-side.
As shown in FIG. 3, 4400 Hz was where the resonator and belly backs began to differ
appreciably. That corresponds to a wavelength of 3 inches. This is somewhat smaller than
the back diameter. Hence, it is possible that the shape (e.g., curvature) of the back has some
relevance to the sound at that frequency and higher. Plausible details are hard to picture,
but the coupling of pot air motion to head motion might be affected by back curvature,
particularly at the highest frequencies.
The shape of the resonator back can certainly have an very important impact for struc-
tural reasons, independent of the directionality of reflection of high frequency sound. The
resonator back wood is typically about 1/4′′ thick. For the same wood and construction
technique, a flat back will be more flexible than one with dish-shape curvature or ribs. Flex-
ing leads to greater dissipation. So a curved back is a further contributor to the resonator
goal.
To the extent that the geometries are the same or similar, the resonator-belly back differ-
ence is all about dissipation. The normal mode description suggests a division of the general
phenomenon into two parts: 1) air motion parallel to the back surface and 2) air motion
perpendicular to the back surface.
1) Even well below 2500 Hz (or wherever the first disk node plane appears), the air motion
parallel to the plane of the back will certainly lead to some energy dissipation in the back.
The important point is that the air motion also comes with a wave of pressure. As a force,
pressure is isotropic, i.e., the same on any plane that goes through a given point, irrespective
of its orientation. The pressure oscillations of the low frequency modes push and pull on
the back, even if the basic air motion is parallel to the surface of the back. This generates
motion of the back material and consequent dissipation of energy. In an idealized version
of this situation with an interface between two infinite half-volumes, one of air and one of
back material, waves in the air at vanishingly small angles to the interface do not generate
11
traveling waves into the back material.[8] However, there is motion of the back material that
decays exponentially with distance from the interface. That motion is subject to dissipation.
2) Air motion perpendicular to the back (or at least at greater than some critical angle
from the surface) generates wave motion into the back material. Energy loss to the air comes
from the energy transferred to motion in the back. Some of that is dissipated nearby in the
back. If the back were, indeed, very thick, some of it would continue to travel to further
depths, dissipating along the way.
In conclusion, in addition to material property effects, there are geometrical effects. For
typical belly materials, sound reflection is weaker and absorption stronger at an air inter-
face than for resonator materials. And those differences increase with increasing frequency.
(These are observed acoustical engineering facts.) But there is also a geometrical effect. Dis-
sipation by the back may become more significant when there is air motion perpendicular
to the back. In the language of Fourier analysis, that only happens above the frequencies of
modes which include such motion.
VII. COMPARING DIFFERENT POT DEPTHS
Through the generosity of Greg Deering, I happen to have three banjos that are as
identical as possible as CNC milling can produce out of maple, differing only in the depth
of their pots.[2] In particular, they are research-grade Goodtime banjos with pot depths of
2′′, 234
′′, and 55
8
′′. This banjo trio allowed a study of how the distance between the head and
the back impacts the difference between a resonator and a belly. Mounting a traditional
resonator on the three in an identical way is somewhat problematical. Instead, I chose a
simple alternative, which actually yields a better comparison. In particular, I used the more
primitive flat disk back, made of 1/2′′ plywood, mounted with the same clip-on hardware
(cupboard latch to the coordinator rod) as the synthetic belly. Hence, the geometry of the
sound hole was identical for all banjos and backs. This is in contrast to the comparison of
the real resonator with the belly, where the difference in projection or radiation pattern was
a confounding issue. For these three banjos, each with two possible backs, the microphone
was placed at 7′′ facing directly into the sound hole, i.e., facing the single 3/8′′ spacer that
defined the angled opening sound hole of all of the backs. The tweeter and the signal
generater sweep were as they were for the Deering Sierra.
12
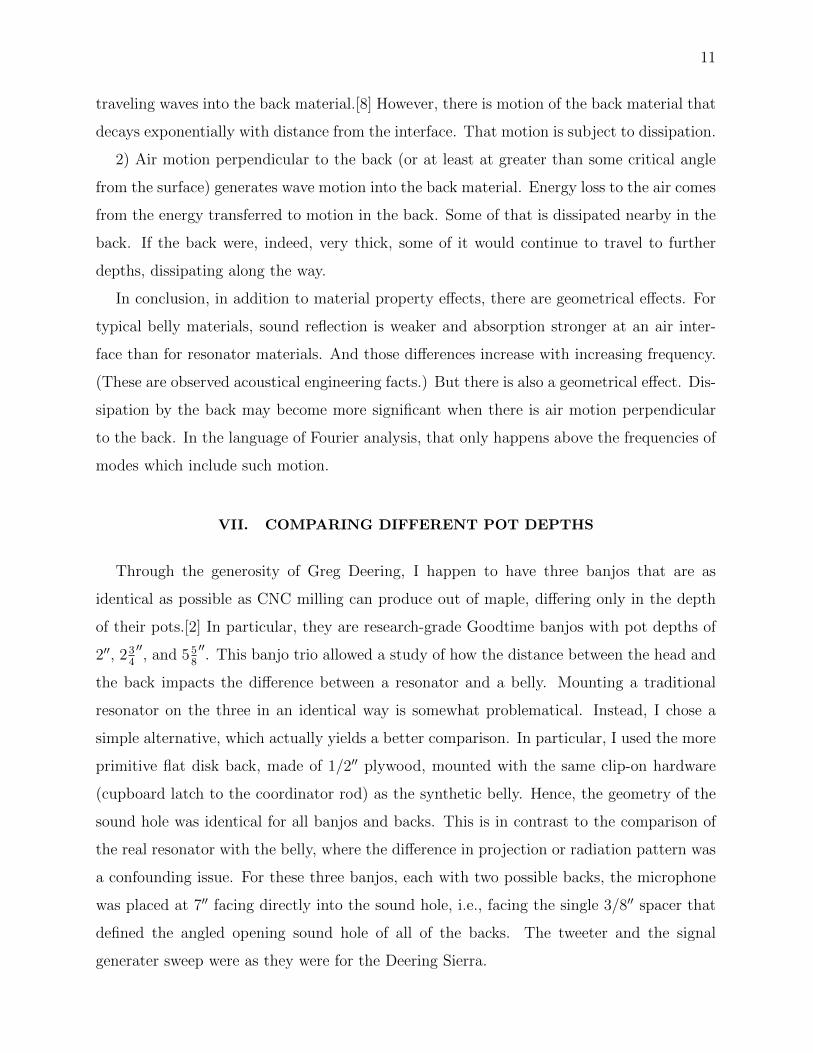
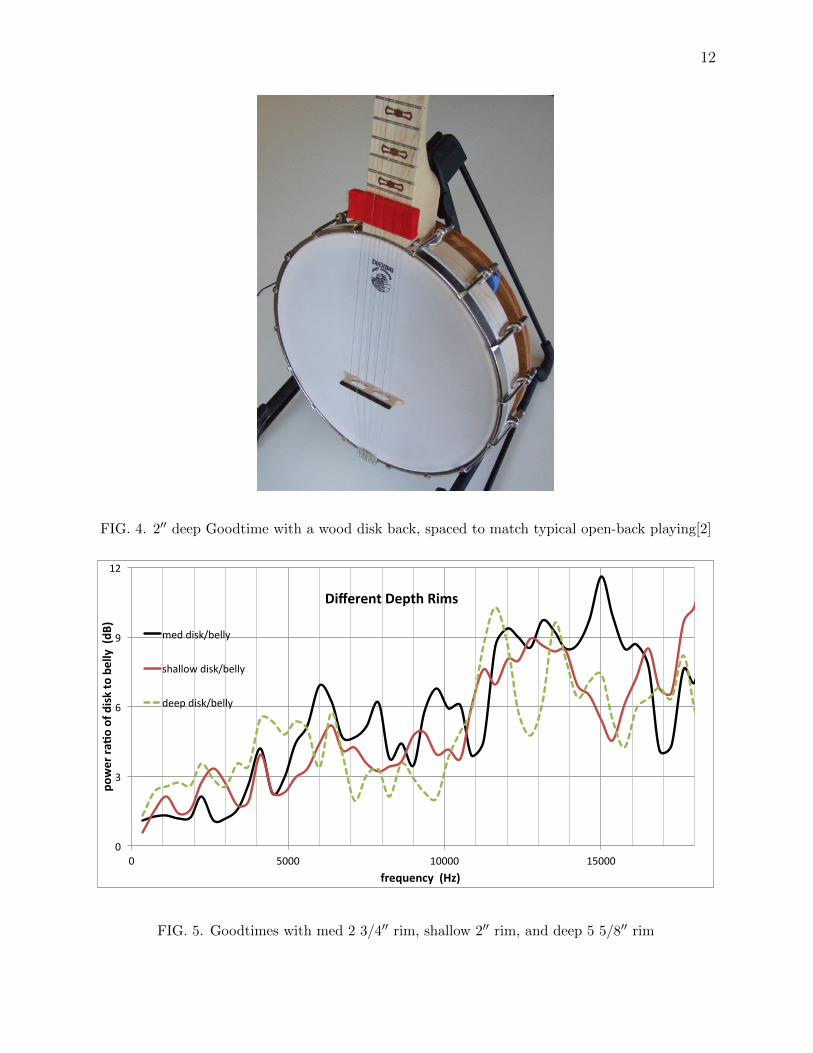
FIG. 4. 2′′ deep Goodtime with a wood disk back, spaced to match typical open-back playing[2]
0"
3"
6"
9"
12"
0" 5000" 10000" 15000"
power&ra
(o&of&d
isk&to&belly&&(dB
)&
frequency&&(Hz)&
Different&Depth&Rims&
med"disk/belly"
shallow"disk/belly"
deep"disk/belly"
FIG. 5. Goodtimes with med 2 3/4′′ rim, shallow 2′′ rim, and deep 5 5/8′′ rim
13
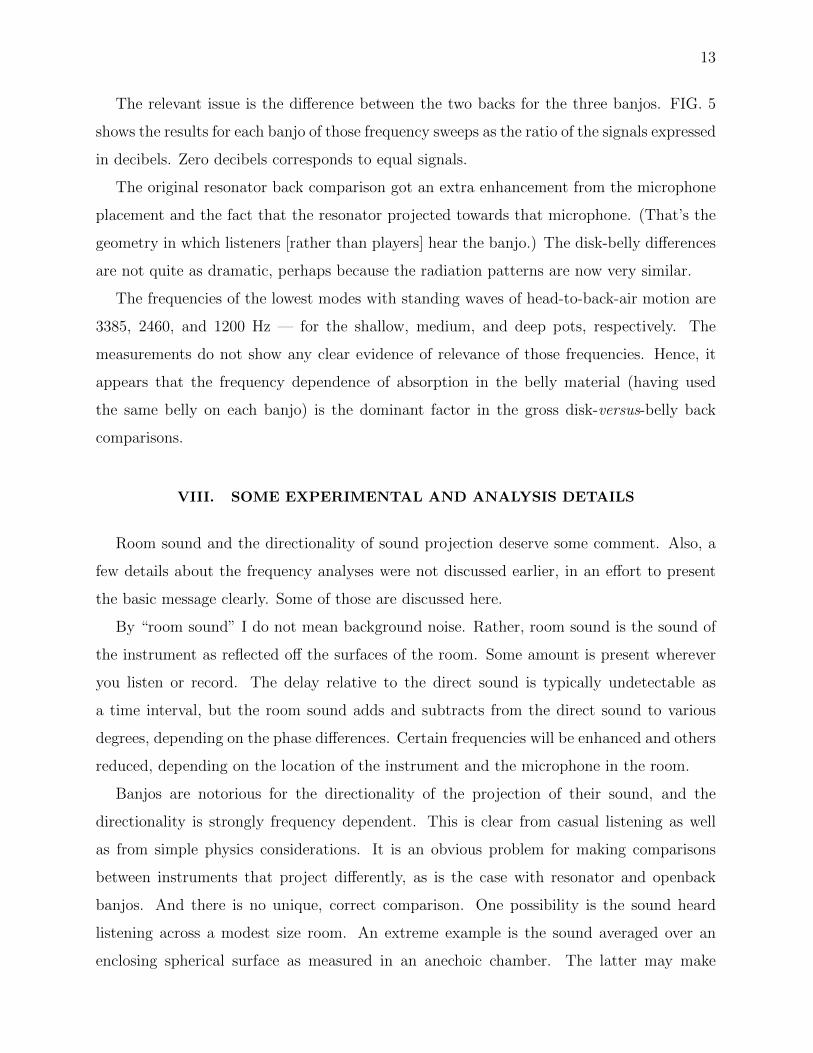
The relevant issue is the difference between the two backs for the three banjos. FIG. 5
shows the results for each banjo of those frequency sweeps as the ratio of the signals expressed
in decibels. Zero decibels corresponds to equal signals.
The original resonator back comparison got an extra enhancement from the microphone
placement and the fact that the resonator projected towards that microphone. (That’s the
geometry in which listeners [rather than players] hear the banjo.) The disk-belly differences
are not quite as dramatic, perhaps because the radiation patterns are now very similar.
The frequencies of the lowest modes with standing waves of head-to-back-air motion are
3385, 2460, and 1200 Hz — for the shallow, medium, and deep pots, respectively. The
measurements do not show any clear evidence of relevance of those frequencies. Hence, it
appears that the frequency dependence of absorption in the belly material (having used
the same belly on each banjo) is the dominant factor in the gross disk-versus-belly back
comparisons.
VIII. SOME EXPERIMENTAL AND ANALYSIS DETAILS
Room sound and the directionality of sound projection deserve some comment. Also, a
few details about the frequency analyses were not discussed earlier, in an effort to present
the basic message clearly. Some of those are discussed here.
By “room sound” I do not mean background noise. Rather, room sound is the sound of
the instrument as reflected off the surfaces of the room. Some amount is present wherever
you listen or record. The delay relative to the direct sound is typically undetectable as
a time interval, but the room sound adds and subtracts from the direct sound to various
degrees, depending on the phase differences. Certain frequencies will be enhanced and others
reduced, depending on the location of the instrument and the microphone in the room.
Banjos are notorious for the directionality of the projection of their sound, and the
directionality is strongly frequency dependent. This is clear from casual listening as well
as from simple physics considerations. It is an obvious problem for making comparisons
between instruments that project differently, as is the case with resonator and openback
banjos. And there is no unique, correct comparison. One possibility is the sound heard
listening across a modest size room. An extreme example is the sound averaged over an
enclosing spherical surface as measured in an anechoic chamber. The latter may make
14
contact with some physics calculation, but no one listens to music that way. The sound of a
recording depends on microphone placement. And mixing more than one mic (even without
any filtering or equalizing) creates a continuum of possible sounds.
For the previous, lower frequency back comparison[1], I recorded at a considerable dis-
tance, with a variety of baffles, over a circuitous route. Here, I set the microphone rather
close to reduce the ratio of room sound to direct sound and placed the mic in a place that
favored the resonator over the openback because that’s closer to natural listening. The flat
disk back comparisons were on a more equal footing because the banjo geometries were the
same for disk and belly.
Unless there are no reflective surfaces, room sound is potentially an issue. Close placement
of the mic reduces its strength relative to the sound that comes directly from the instrument.
However, the nature of the radiated sound depends on distance. Different frequencies spread
out differently. So a close microphone records sound which differs from what an audience
hears.
Normally, the active sound processing of our brains tries to ignore room sound. That
involves calling on past experience and moving our heads and ears as we listen. (It is also
possible to focus specifically on the room sound, e.g., if you want to know where you are).
A stationary microphone (or one not connected to our body) yields a dramatically different
experience, undercutting much of that normal process. A dramatic version occurs with
single, constant frequency sounds (as were used in the tweeter sweeps). When the frequency
is at a resonance of the room, the room sound becomes a standing wave with nodes and
maxima at fixed locations. For wavelengths small compared to the room dimensions, there
are a great many resonances very closely spaced in frequency. Move your head, and you
hear loud and then soft. A fixed microphone is somewhere in that standing wave field, but
not necessarily at a maximum. If the driving frequency is changed slowly, the node planes
will move and cross through the stationary microphone as the frequency changes. So the
recorded volume will go up and down — not because of going on or off a resonance but
because of being near a maximum or node of the current frequency.
The moving of node planes offers a way to reduce the confusion due to room sound in
the frequency sweep recordings. With the microphone and banjo in a fixed relation, one
can move them and rotate them together, repeating the same sweep, and average those
recordings. In FIG. 2, there’s a comparison of a single sweep and the average of four. And
15
all of the disk and openback data are the average of three runs with different orientation
and placement of the fixed-relation mic and banjo. Because the phase relation between the
direct sound and the room sound at the microphone is different for different locations, it is
possible for the room sound to cancel out with sufficiently many different runs. In practice,
one makes a compromise, doing more than one but fewer than infinity.
In performing a numerical spectrum calculation, the finite time length of the data and
the finite time available to do the calculation necessitate compromises. That can be used
to your advantage. Audacityr makes explicit your choice of time interval to be considered
for calculating the spectrum. That choice determines the frequency resolution. Because the
current investigation studied the sound response to a sweep of driver frequency (and not to
particular plucked notes), a crude resolution was appropriate. (In normal playing, the pot
is called upon to respond to a great variety of frequencies.) For the disk/belly comparisons,
my choice is equivalent to about a 200 Hz resolution at all frequencies. The resonator/belly
comparison used a 100 Hz resolution for the lower half (on log scale) of the spectrum and
200 Hz for the upper.
IX. CONCLUSION
The characteristic resonator banjo sound may be hard to pin down in terms of mathe-
matical description or specification. The strength of the transduction path from string pluck
to radiated sound at frequencies above 5000 Hz plays a crucial part. Less of that energy is
absorbed by a resonator than by a body behind the openback. The resonator sound may
remain in the realm famously identified by Supreme Court Justice Potter Stewart, to para-
phrase “I know it when I hear it.” The onomatopoeic double plosive characterization that a
resonator banjo can “really crack” may be the best we can do. But, as a diagnostic tool for
design and development, very high frequency testing may prove useful.
Appendix A: the Goodtimes as openbacks
In ref. [2] I compared the sound of the three Goodtime banjos played as open backs.
The only physics analyses there addressed the lowest two modes, i.e., the Helmholtz mode
of the pot and the lowest head mode. I developed simple models of how these depended
16
on the pot depth. There were clearly other differences in the actual sounds of the banjos.
For example, my friend Rick concluded that no head stuffing was required on the deep pot.
It produced the mellow pluck sound he liked without any such modification. The present
tweeter-driven comparison allows an investigation of subtle but audible differences at high
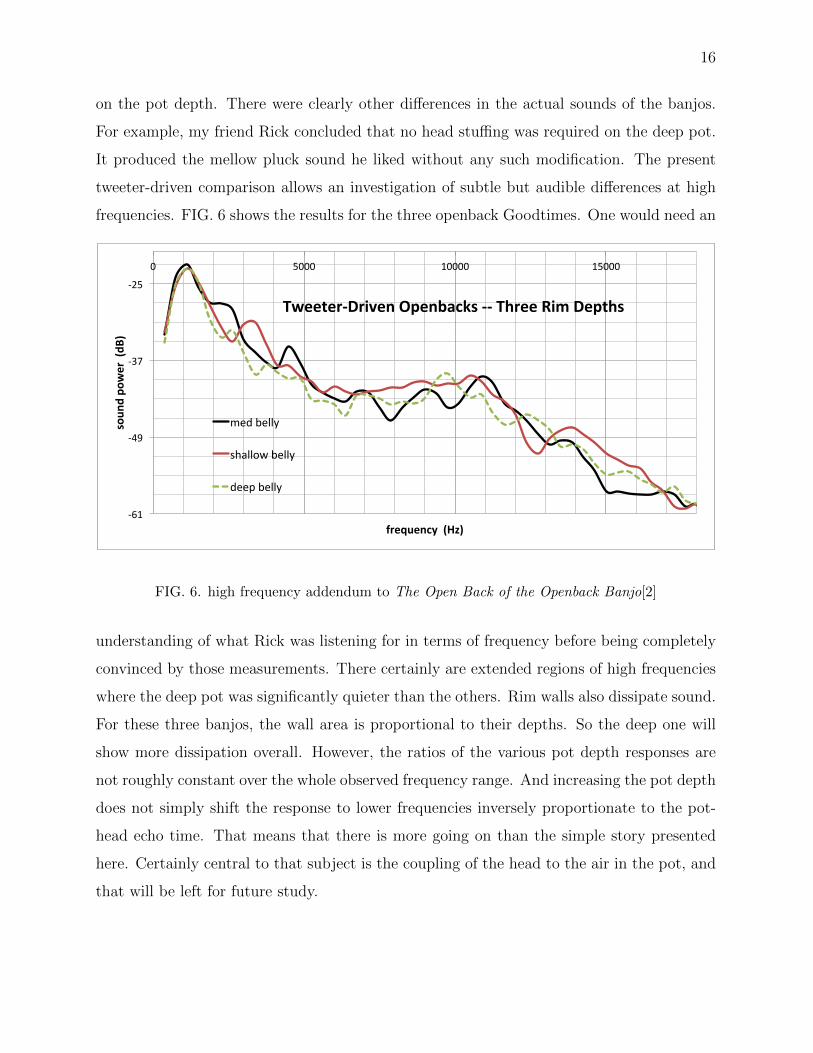
frequencies. FIG. 6 shows the results for the three openback Goodtimes. One would need an
!61$
!49$
!37$
!25$
0$ 5000$ 10000$ 15000$
soun
d&po
wer&&(dB
)&
frequency&&(Hz)&
Tweeter6Driven&Openbacks&66&Three&Rim&Depths&
med$belly$
shallow$belly$
deep$belly$
FIG. 6. high frequency addendum to The Open Back of the Openback Banjo[2]
understanding of what Rick was listening for in terms of frequency before being completely
convinced by those measurements. There certainly are extended regions of high frequencies
where the deep pot was significantly quieter than the others. Rim walls also dissipate sound.
For these three banjos, the wall area is proportional to their depths. So the deep one will
show more dissipation overall. However, the ratios of the various pot depth responses are
not roughly constant over the whole observed frequency range. And increasing the pot depth
does not simply shift the response to lower frequencies inversely proportionate to the pot-
head echo time. That means that there is more going on than the simple story presented
here. Certainly central to that subject is the coupling of the head to the air in the pot, and
that will be left for future study.
17
Appendix B: sound samples: which is which
Click here or otherwise retrieve http://www.its.caltech.edu/∼politzer/back-key.pdf to
find which sound file had a real resonator, which had synthetic resonator sound from high
frequency enhancement, etc.
[1] D. Politzer, The Resonator Banjo Resonator, part 1: Overall Loudness, HDP: 15 – 3,
http://www.its.caltech.edu/∼politzer
[2] D. Politzer, The Open Back of the Open-Back Banjo, HDP: 13 – 02,
http://www.its.caltech.edu/∼politzer
[3] J. N. Oppenheim and M. O. Magnasco, Human Time-Frequency Acuity Beats the Fourier
Uncertainty Principle, PRL 110, 044301 (2013)
[4] You can view photos and descriptions of Ken LeVan’s banjos and other design work at
http://www.levanbanjos.levandesign.com/ and http://www.levandesign.com/.
[5] R. Feynman and A. Hibbs, Quantum Mechanics and Path Integrals (variously, 1965, 2010, etc.)
[6] Banjo examples of such systems that are independent to a zeroth approximation are the individ-
ual strings, the head, the rim, and, here, the pot interior. A banjo counter example is the tone
ring. That ring is sufficiently strongly attached to the rim that it cannot vibrate independently
of the top edge of the rim. Consequently, the resonant frequencies of the ring by itself have no
immediate, simple relation to the what the ring does when it is in place and the dynamics of
the rim are essential.
[7] In a normal mode, all the air is moving in phase (or 180o out of phase) with a single frequency.
The pressure is oscillating likewise. There are stationary places where the amplitude of motion
is zero, and those are called nodes. In this three-dimensional system, the nodes come in planes.
Explicit solution of sound in a cylinder as a physics exercise usually does not appear until the
third year of college physics. It can be found in any number of intermediate textbooks and
other references.
[8] This is the phenomenon of total internal reflection. At small angles to an interface, a wave in
the slower medium cannot generate a wave in the faster medium. A common example is light
at a water-air interface. It reflects completely, going back into the water, if the incident angle

18
from the water onto the interface is sufficiently far from perpendicular.