Embed Size (px)
Citation preview
Realizing the Promise and Competitive Advantage of a
Thriving and Sustainable Workplace and Workforce
Strategies for 2013 and BeyondThe University of Michigan
Edington Associates
Dee W. Edington
October 10, 2012
Health Promotion – The value of meeting patients where they are
The University of Michigan
Edington Associates
Dee W. Edington
October 10, 2012
dedi
cate
d to
impr
ovin
g th
e he
alth
of p
eopl
ein
wes
tern
new
yor
k
Leadership Buffalo 2012
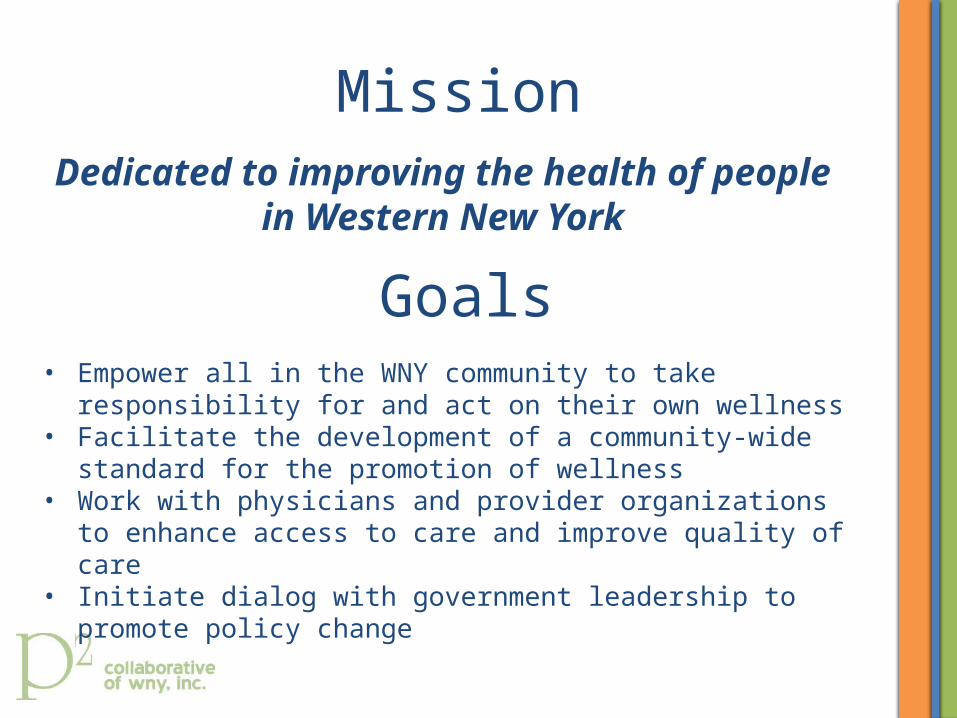
MissionDedicated to improving the health of people in
Western New York
Goals• Empower all in the WNY community to take responsibility for and act
on their own wellness• Facilitate the development of a community-wide standard for the
promotion of wellness• Work with physicians and provider organizations to enhance access to
care and improve quality of care• Initiate dialog with government leadership to promote policy change
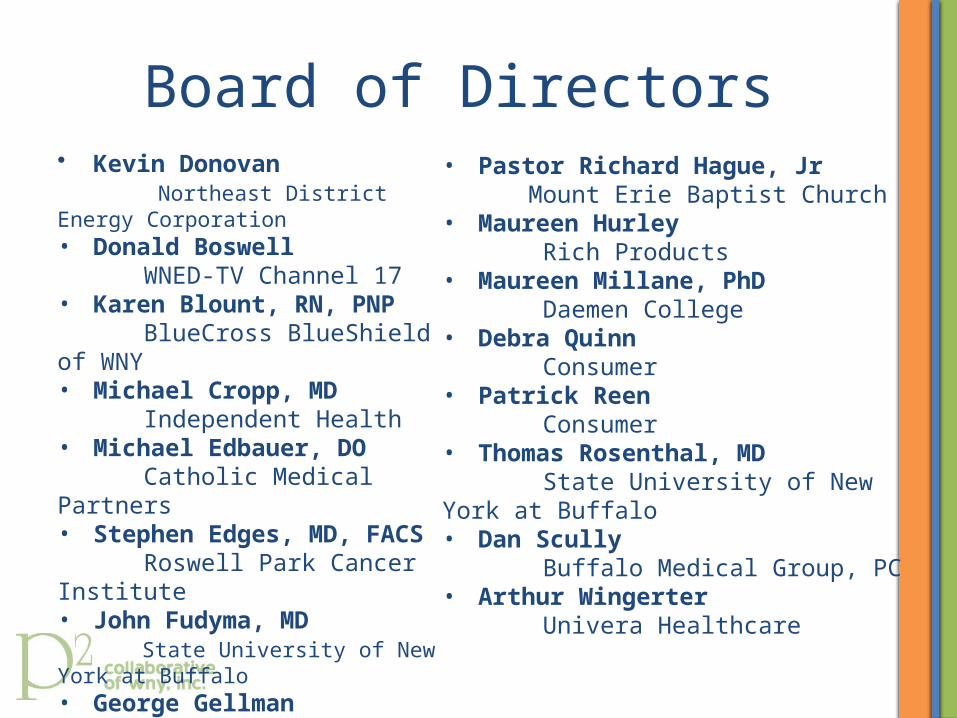
Board of Directors• Kevin Donovan Northeast District Energy Corporation• Donald Boswell WNED-TV Channel 17• Karen Blount, RN, PNP BlueCross BlueShield of WNY• Michael Cropp, MD Independent Health• Michael Edbauer, DO Catholic Medical Partners• Stephen Edges, MD, FACS Roswell Park Cancer Institute• John Fudyma, MD State University of New York at Buffalo • George Gellman The Benchmark Group
• Pastor Richard Hague, Jr Mount Erie Baptist Church• Maureen Hurley Rich Products• Maureen Millane, PhD Daemen College• Debra Quinn Consumer• Patrick Reen Consumer• Thomas Rosenthal, MD State University of New York at Buffalo • Dan Scully Buffalo Medical Group, PC• Arthur Wingerter Univera Healthcare
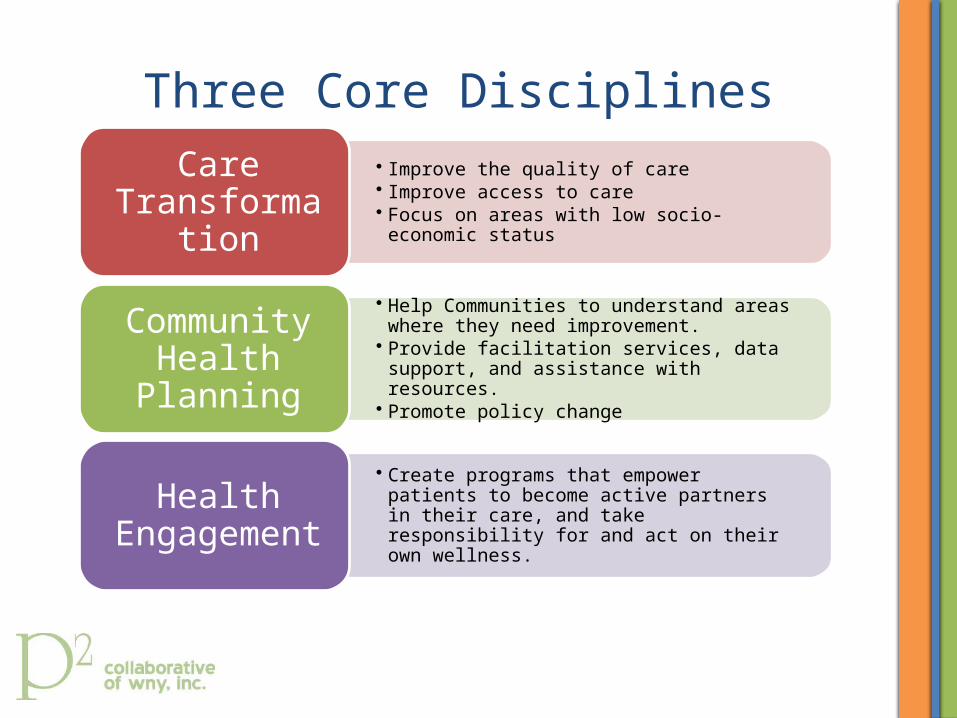
Three Core Disciplines• Improve the quality of care• Improve access to care• Focus on areas with low socio-economic status
Care Transformation
• Help Communities to understand areas where they need improvement.
• Provide facilitation services, data support, and assistance with resources.
• Promote policy change
Community Health Planning
• Create programs that empower patients to become active partners in their care, and take responsibility for and act on their own wellness.
Health Engagement
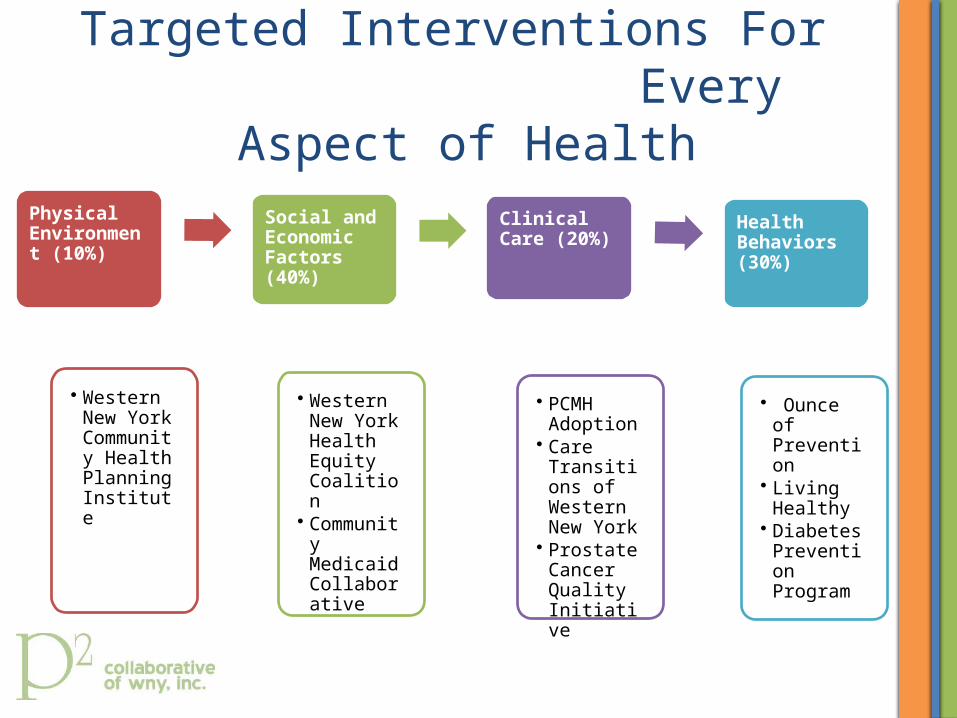
Targeted Interventions For Every Aspect of Health
Physical Environment (10%)
• Western New York Community Health Planning Institute
Social and Economic Factors (40%)
• Western New York Health Equity Coalition
• Community Medicaid Collaborative
Clinical Care (20%)
• PCMH Adoption
• Care Transitions of Western New York
• Prostate Cancer Quality Initiative
Health Behaviors (30%)
• Ounce of Prevention
• Living Healthy
• Diabetes Prevention Program
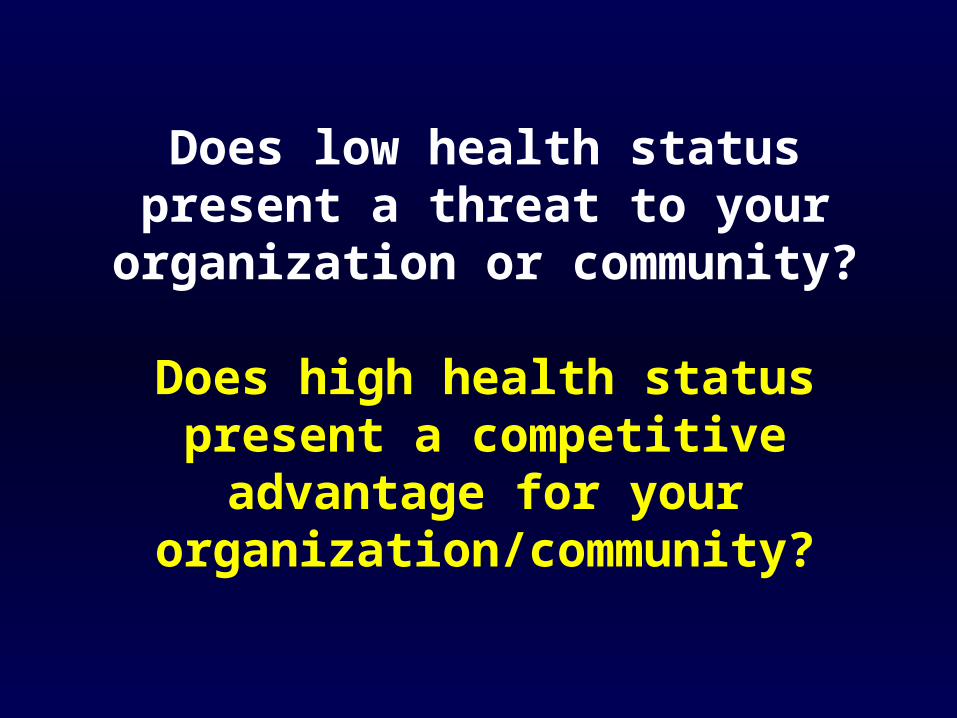
Does low health status present a threat to your
organization or community?
Does high health status present a competitive
advantage for your organization/community?
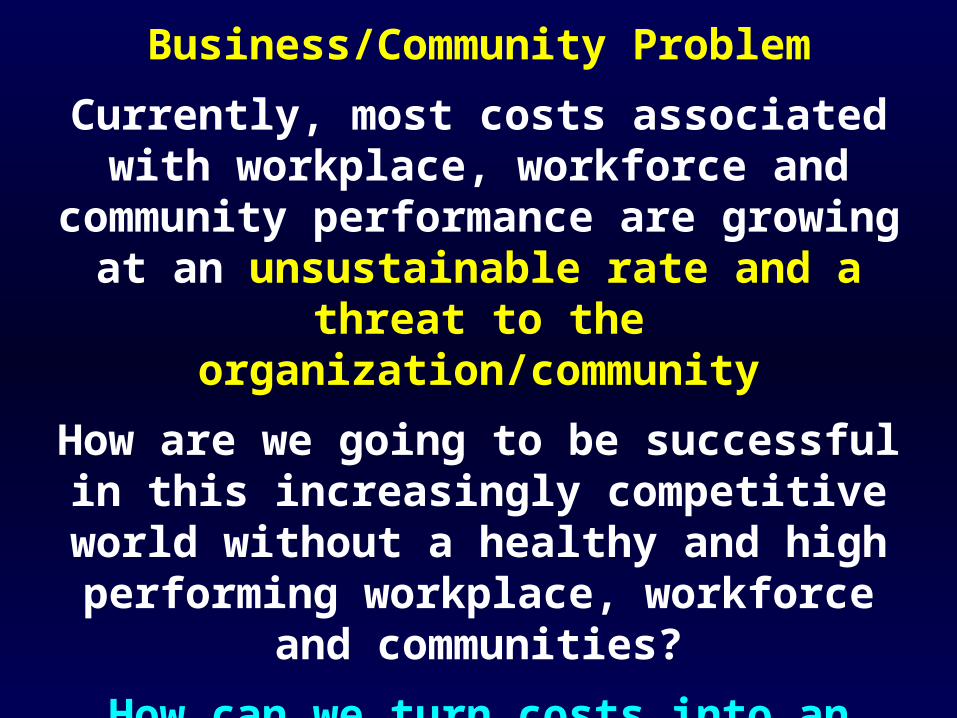
Business/Community Problem
Currently, most costs associated with workplace, workforce and
community performance are growing at an unsustainable rate
and a threat to the organization/community
How are we going to be successful in this increasingly competitive
world without a healthy and high performing workplace, workforce
and communities?
How can we turn costs into an investment?
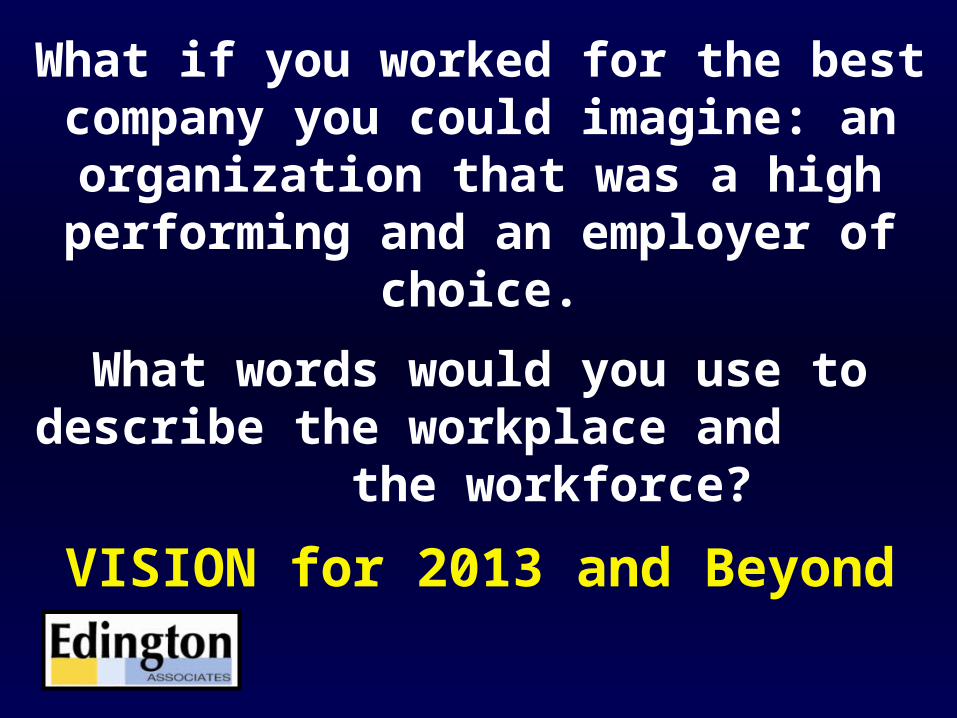
What if you worked for the best company you could imagine: an
organization that was a high performing and an employer of
choice.
What words would you use to describe the workplace and
the workforce?
VISION for 2013 and Beyond
Who is your target audience and what to they look like?
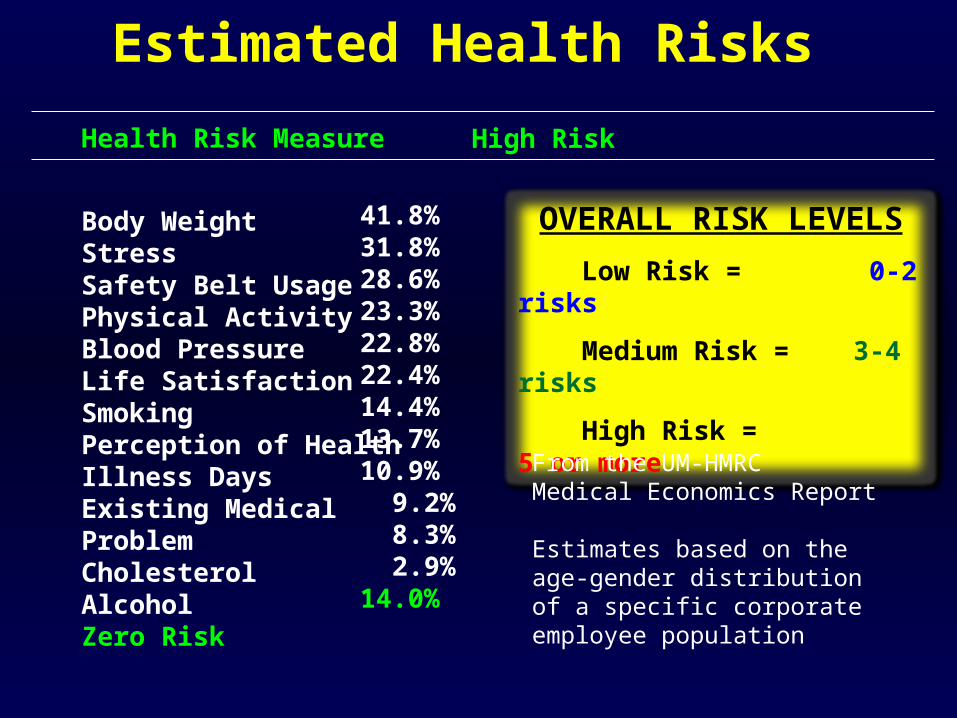
Estimated Health Risks
Health Risk Measure
Body WeightStress Safety Belt UsagePhysical ActivityBlood PressureLife SatisfactionSmoking Perception of Health Illness DaysExisting Medical ProblemCholesterolAlcoholZero Risk
High Risk
41.8%31.8% 28.6% 23.3% 22.8%22.4% 14.4% 13.7%10.9% 9.2% 8.3% 2.9%14.0%
OVERALL RISK LEVELS
Low Risk = 0-2 risks
Medium Risk = 3-4 risks
High Risk = 5 or more
From the UM-HMRC Medical Economics Report
Estimates based on the age-gender distribution of a specific corporate employee population
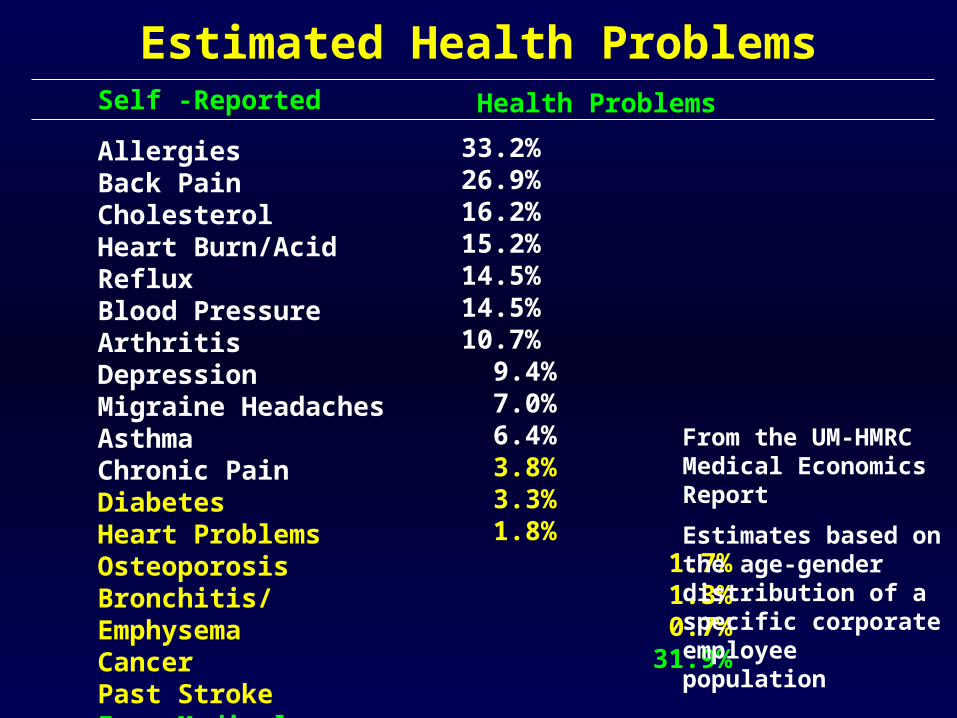
Estimated Health ProblemsSelf -Reported
AllergiesBack PainCholesterolHeart Burn/Acid RefluxBlood PressureArthritisDepressionMigraine HeadachesAsthmaChronic PainDiabetesHeart ProblemsOsteoporosisBronchitis/EmphysemaCancerPast StrokeZero Medical Conditions
Health Problems
33.2% 26.9% 16.2% 15.2% 14.5% 14.5% 10.7% 9.4% 7.0% 6.4% 3.8% 3.3% 1.8%
1.7% 1.3% 0.7% 31.9%
From the UM-HMRC Medical Economics Report
Estimates based on the age-gender distribution of a specific corporate employee population
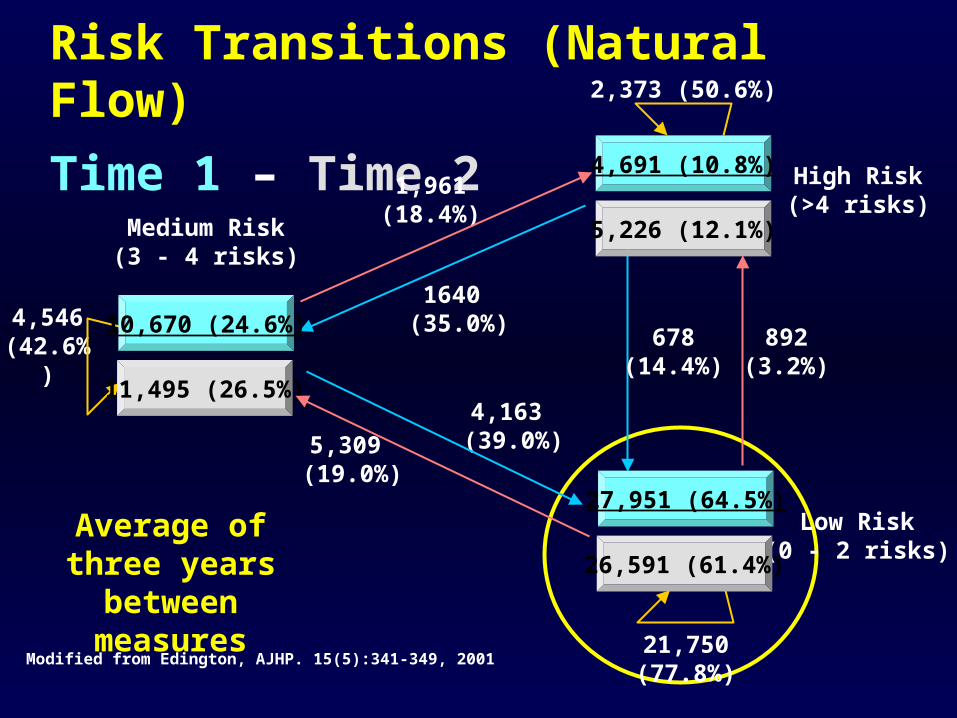
1640 (35.0%)
4,163 (39.0%)
678(14.4%)
Risk Transitions (Natural Flow)
Time 1 – Time 2 High Risk(>4 risks)
Low Risk(0 - 2 risks)
Medium Risk(3 - 4 risks)
2,373 (50.6%)
21,750 (77.8%)
4,546(42.6%)
10,670 (24.6%)
4,691 (10.8%)
27,951 (64.5%)
11,495 (26.5%)
5,226 (12.1%)
26,591 (61.4%)
892(3.2%)
1,961 (18.4%)
5,309 (19.0%)
Modified from Edington, AJHP. 15(5):341-349, 2001
Average of three years between
measures
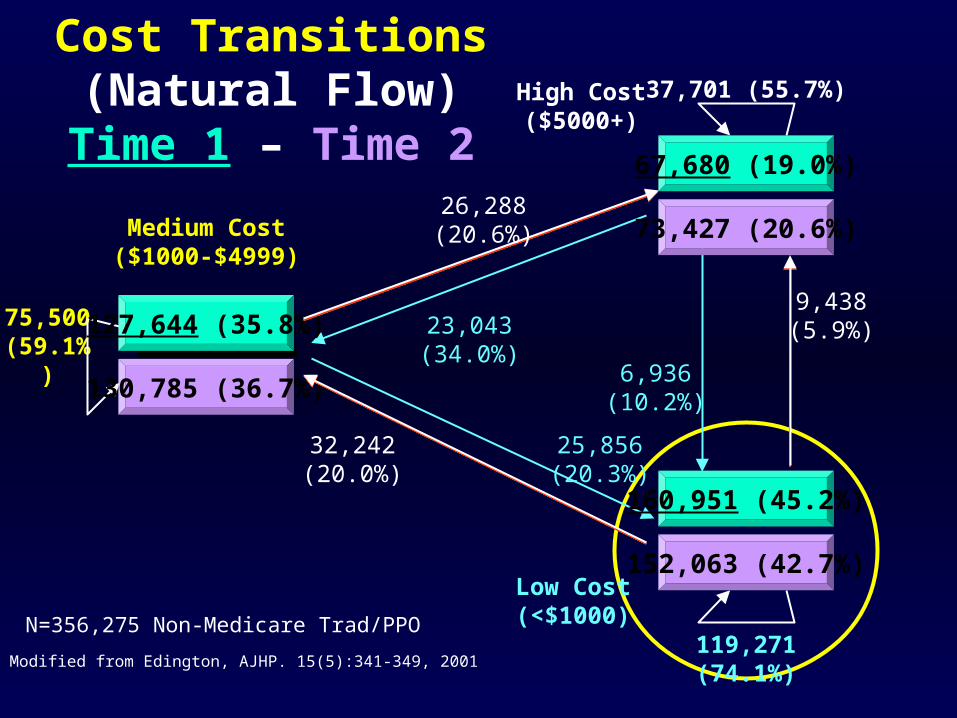
23,043 (34.0%)
25,856 (20.3%)
6,936(10.2%)
Cost Transitions(Natural Flow)Time 1 – Time 2
High Cost($5000+)
Medium Cost($1000-$4999)
Low Cost(<$1000)
37,701 (55.7%)
119,271 (74.1%)
75,500(59.1%)
127,644 (35.8%)
67,680 (19.0%)
160,951 (45.2%)
130,785 (36.7%)
73,427 (20.6%)
152,063 (42.7%)
9,438(5.9%)
32,242 (20.0%)
26,288 (20.6%)
N=356,275 Non-Medicare Trad/PPO
Modified from Edington, AJHP. 15(5):341-349, 2001
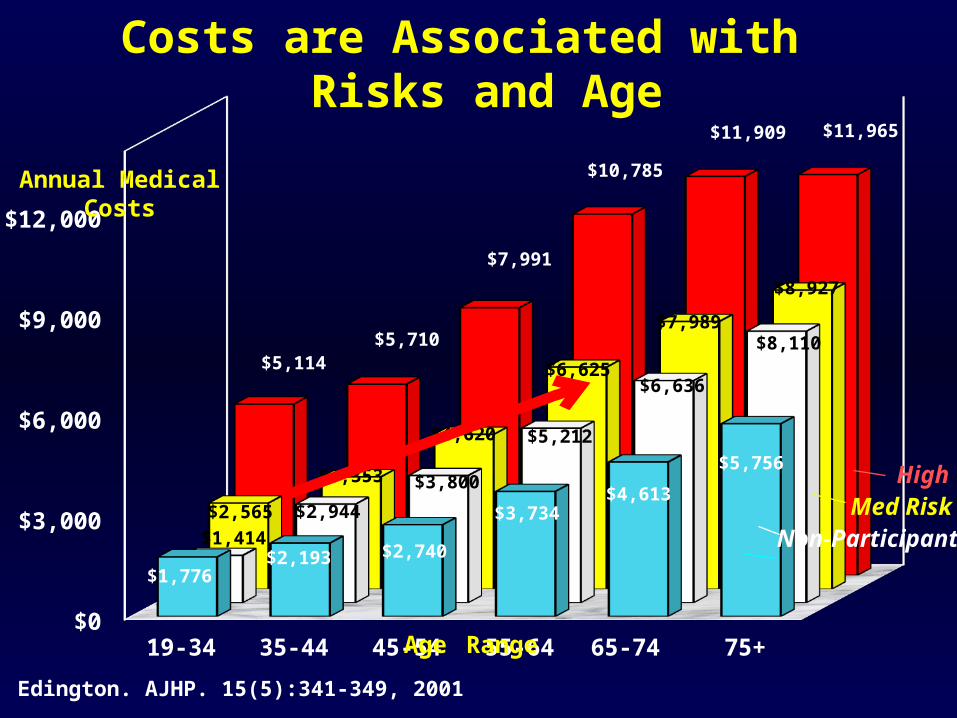
Low
19-34 35-44 45-54 55-64 65-74 75+$0
$3,000
$6,000
$9,000
$12,000
$1,776 $2,193 $2,740
$3,734 $4,613
$5,756
$1,414
$2,944
$3,800
$5,212
$6,636
$8,110
$2,565
$3,353
$4,620
$6,625
$7,989
$8,927
$5,114 $5,710
$7,991
$10,785
$11,909 $11,965
Costs are Associated with Risks and Age
Annual Medical Costs
Med Risk
Age Range
High
Non-Participant
Edington. AJHP. 15(5):341-349, 2001
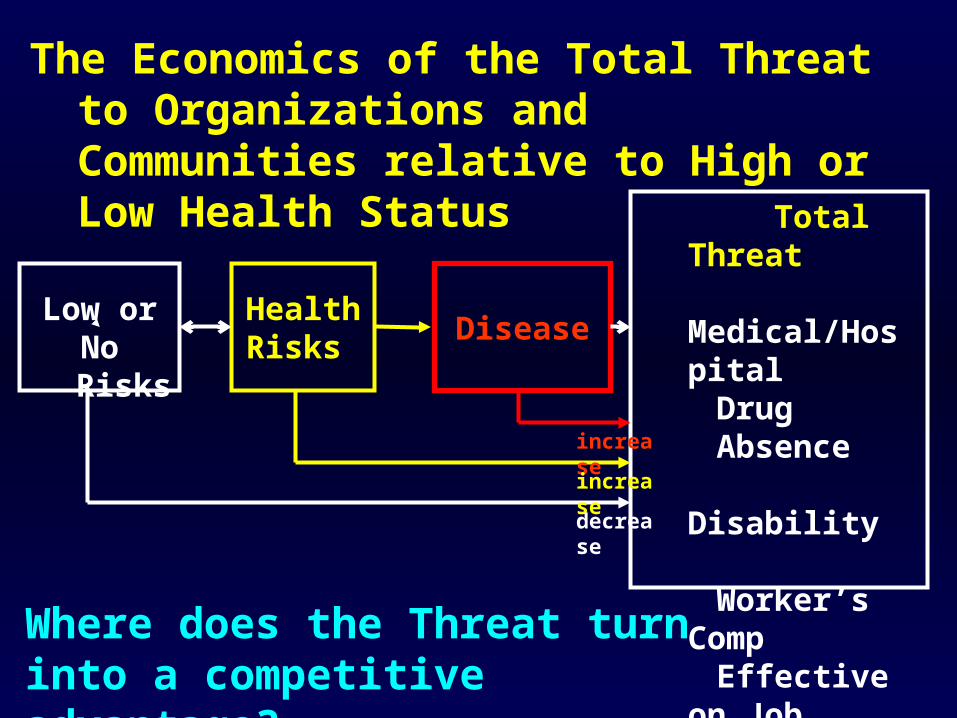
Total Threat Medical/Hospital Drug Absence Disability Worker’s Comp Effective on Job Recruitment Retention Morale
Disease
HealthRisks
The Economics of the Total Threat to Organizations and Communities relative to High or Low Health Status
Low orNo Risks
Where does the Threat turn into a competitive advantage?
increase
increase
decrease
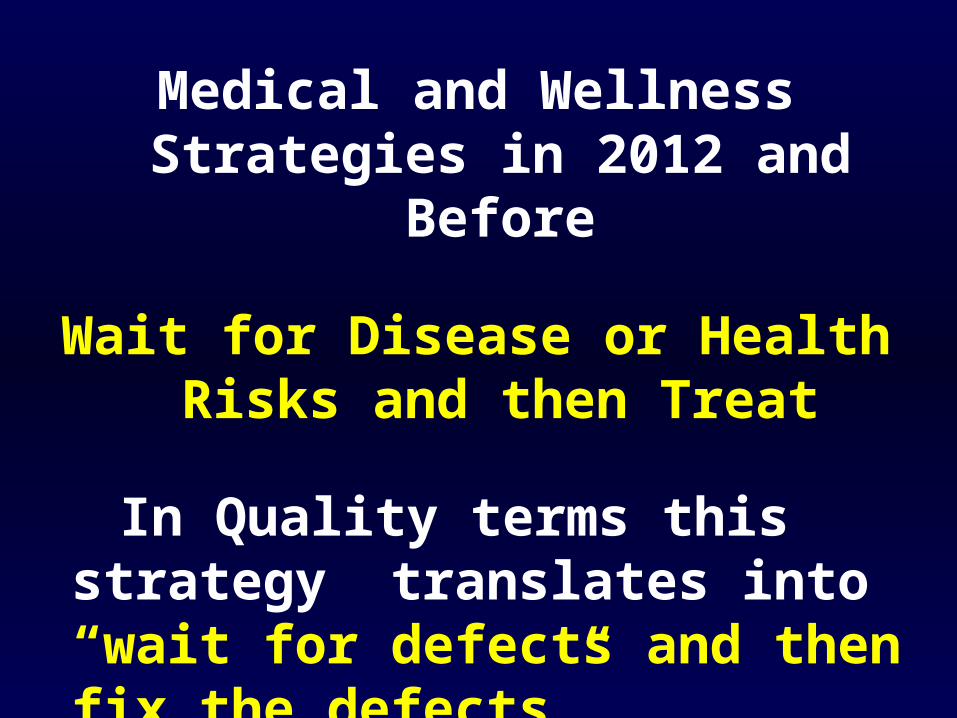
Medical and Wellness Strategies in 2012 and
Before
Wait for Disease or Health Risks and then Treat
In Quality terms this strategy translates into “wait for defects and then fix the defects”
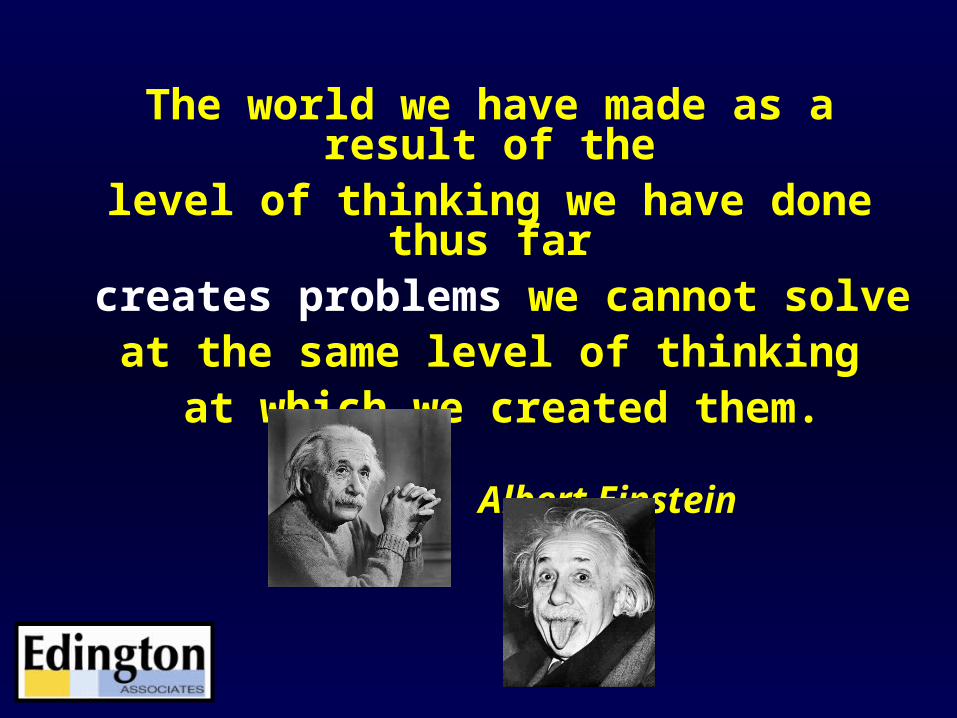
The world we have made as a result of thelevel of thinking we have done thus far
creates problems we cannot solveat the same level of thinking at which we created them.
- Albert Einstein
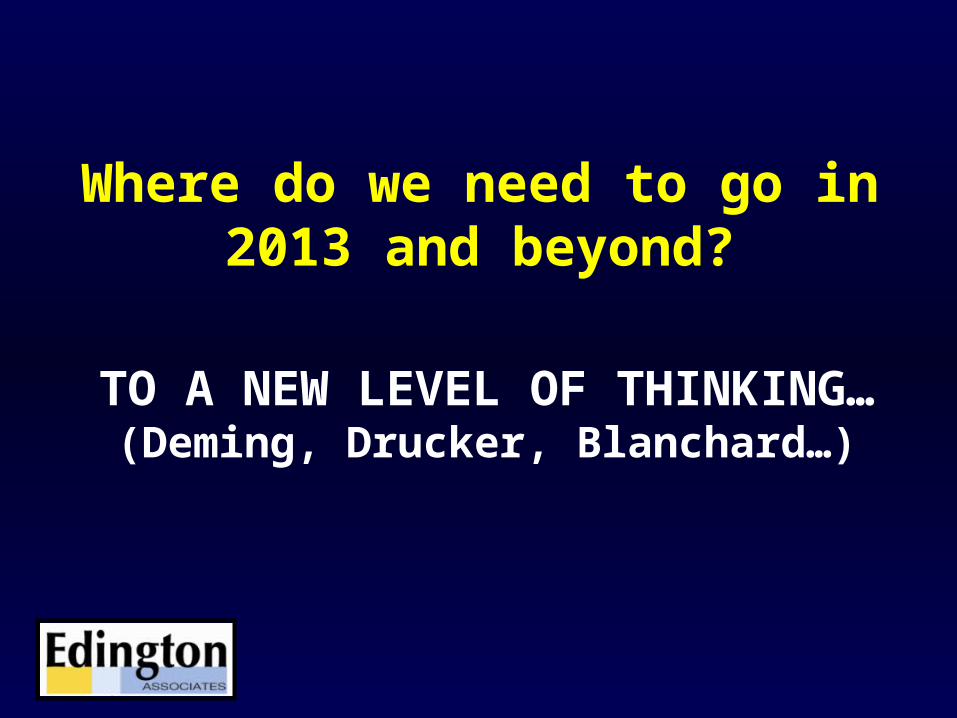
Where do we need to go in 2013 and beyond?
TO A NEW LEVEL OF THINKING…(Deming, Drucker, Blanchard…)
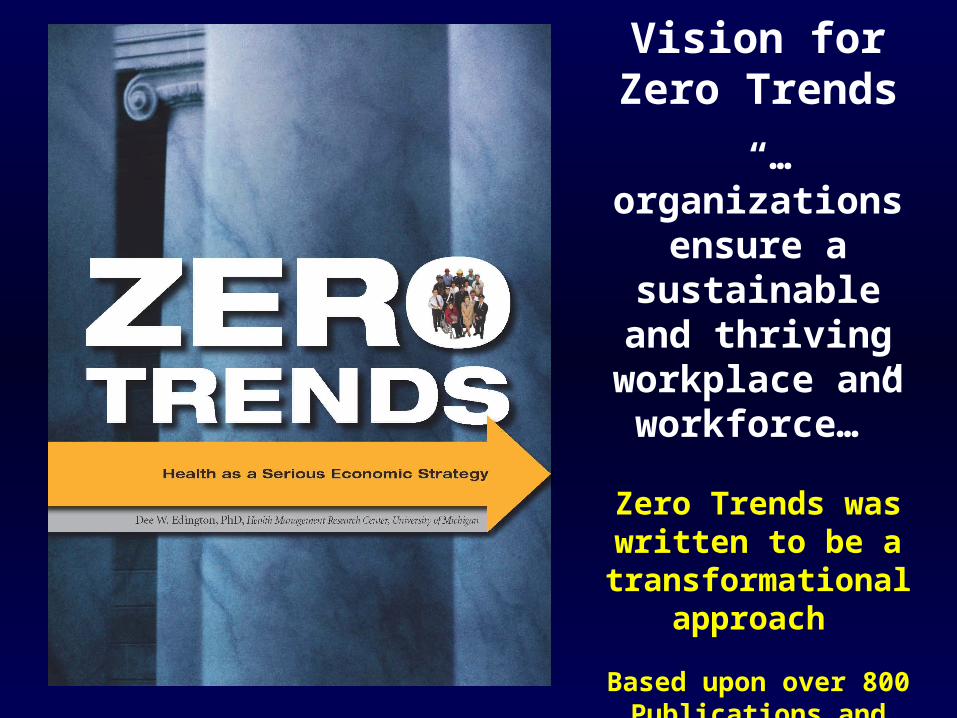
Vision for Zero Trends
“…organizations ensure a
sustainable and thriving workplace and workforce…”
Zero Trends was written to be a
transformational approach
Based upon over 800 Publications and
Presentations
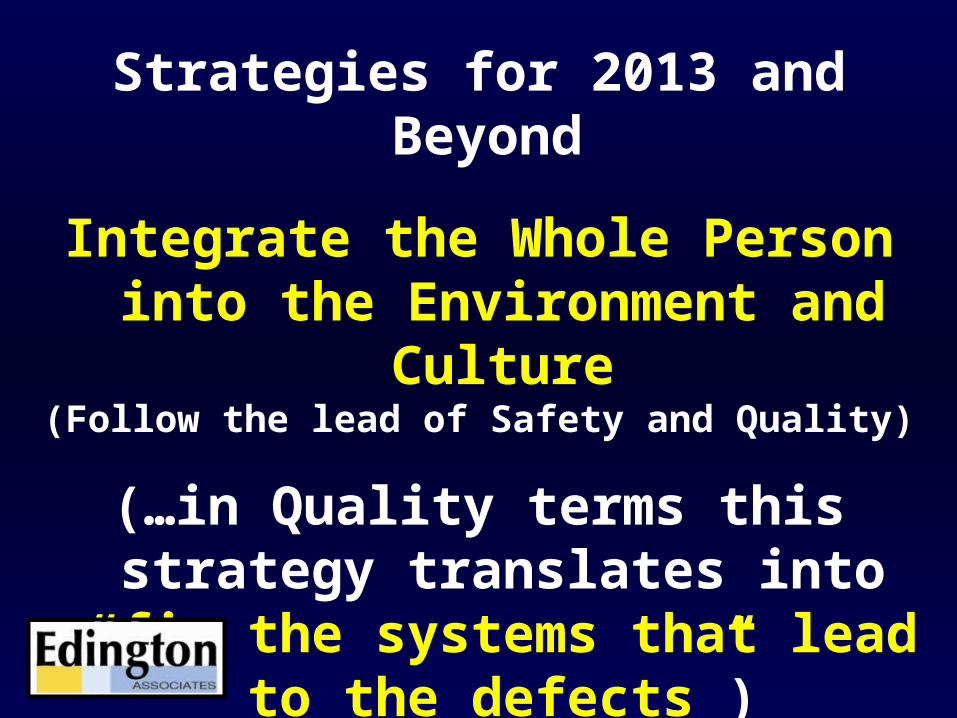
Strategies for 2013 and Beyond
Integrate the Whole Person into the Environment and
Culture(Follow the lead of Safety and Quality)
(…in Quality terms this strategy translates into “fix the systems that lead to the
defects”)(Deming, Drucker, Blanchard)
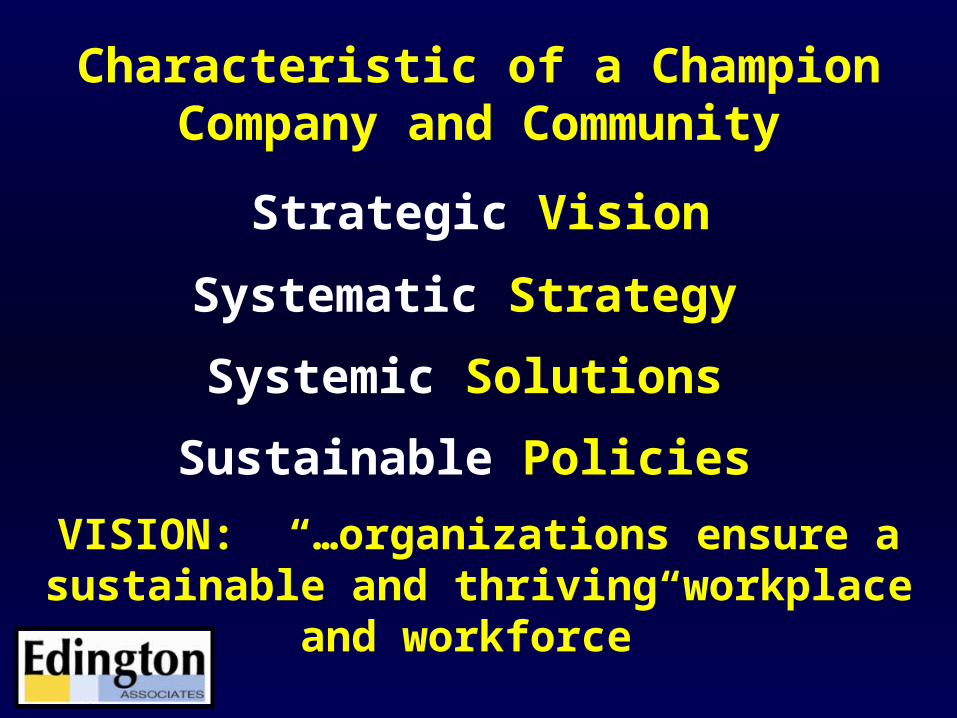
Characteristic of a Champion Company and Community
Strategic Vision
Systematic Strategy
Systemic Solutions
Sustainable Policies
VISION: “…organizations ensure a sustainable and thriving workplace and
workforce”
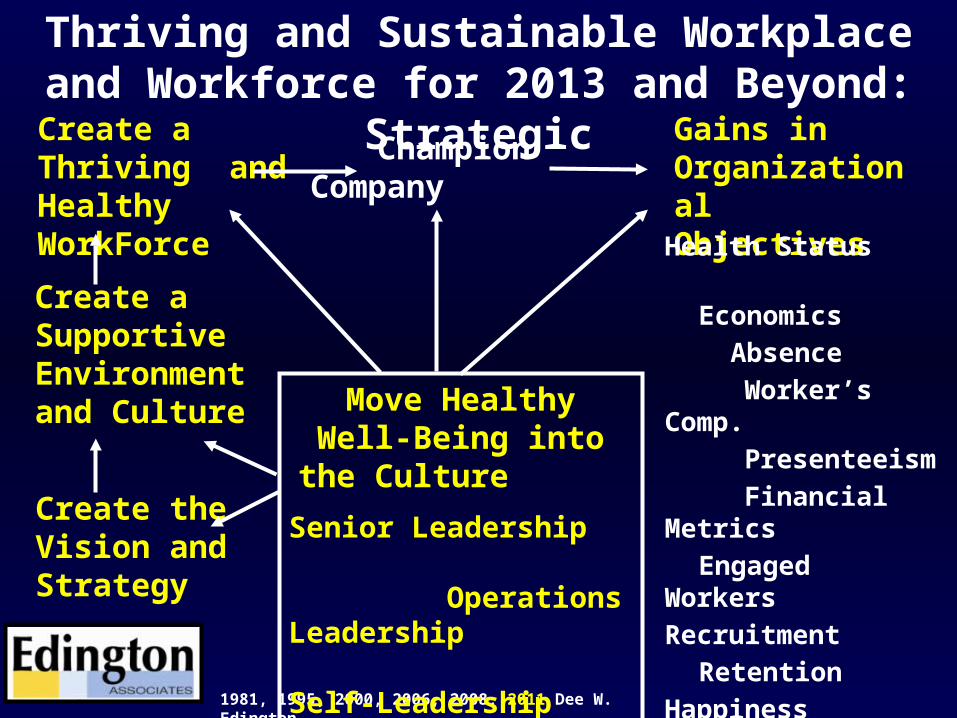
Create a Thriving and Healthy WorkForce
Champion Company
Gains inOrganizational Objectives
Health Status
Economics
Absence
Worker’s Comp.
Presenteeism
Financial Metrics
Engaged Workers
Recruitment
Retention
Happiness
Company Visibility
Social Responsibility
1981, 1995, 2000, 2006, 2008, 2011 Dee W. Edington
Create a Supportive Environment and Culture
Create the Vision and Strategy
Move Healthy Well-Being into the Culture
Senior Leadership Operations Leadership Self-Leadership Recognize Positive Acts Quality Assurance
Thriving and Sustainable Workplace and Workforce for 2013 and Beyond:
Strategic
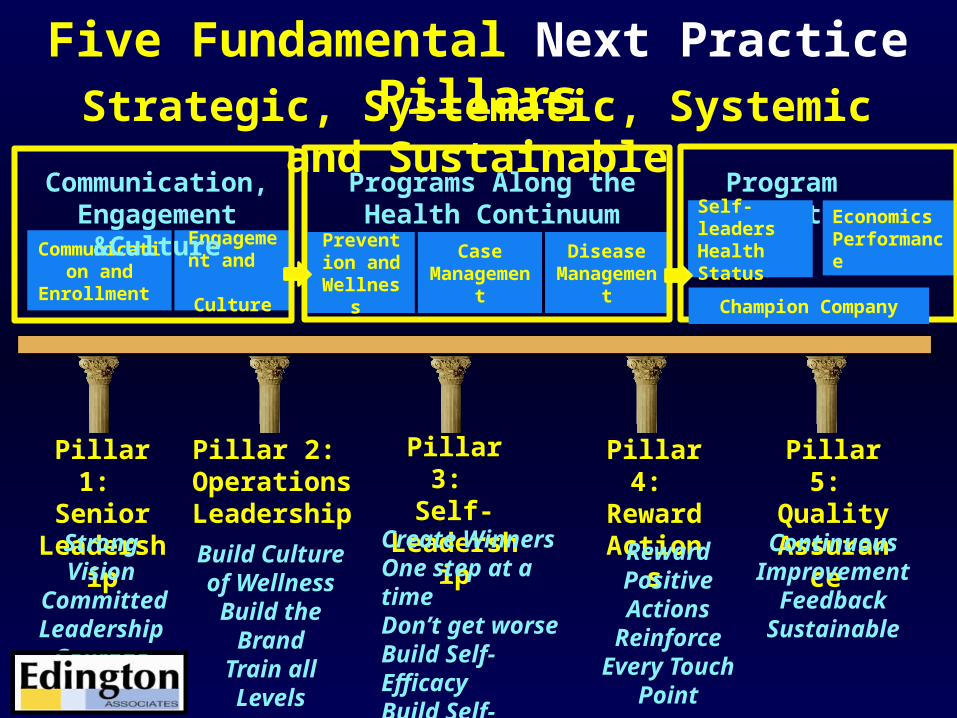
Five Fundamental Next Practice Pillars
Pillar 3: Self-
Leadership
Pillar 4: Reward Actions
Pillar 5: Quality
Assurance
Pillar 1: Senior
Leadership
Pillar 2: Operations Leadership
Strong Vision Committed Leadership
Courage
Build Culture of Wellness
Build the BrandTrain all Levels
Create WinnersOne step at a timeDon’t get worse Build Self-EfficacyBuild Self-Leaders
Reward Positive Actions
Reinforce Every Touch Point
Continuous Improvement
FeedbackSustainable
Strategic, Systematic, Systemic and Sustainable
Communication and
Enrollment
Engagement and
Culture
Economics PerformancePrevention
and Wellness
CaseManagement
Disease Management
Programs Along the Health Continuum
Program Impact
Champion Company
Self-leadersHealth Status
Communication, Engagement &Culture
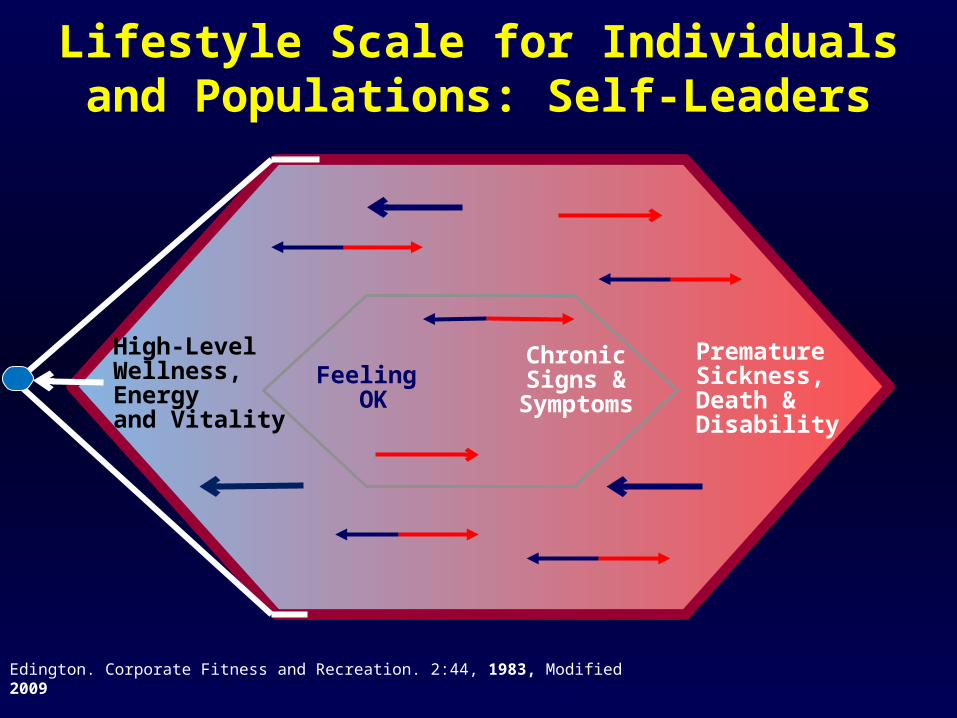
Lifestyle Scale for Individuals and Populations: Self-Leaders
ChronicSigns &
SymptomsFeeling OK
PrematureSickness, Death & Disability
High-Level Wellness, Energy and Vitality
Edington. Corporate Fitness and Recreation. 2:44, 1983, Modified 2009
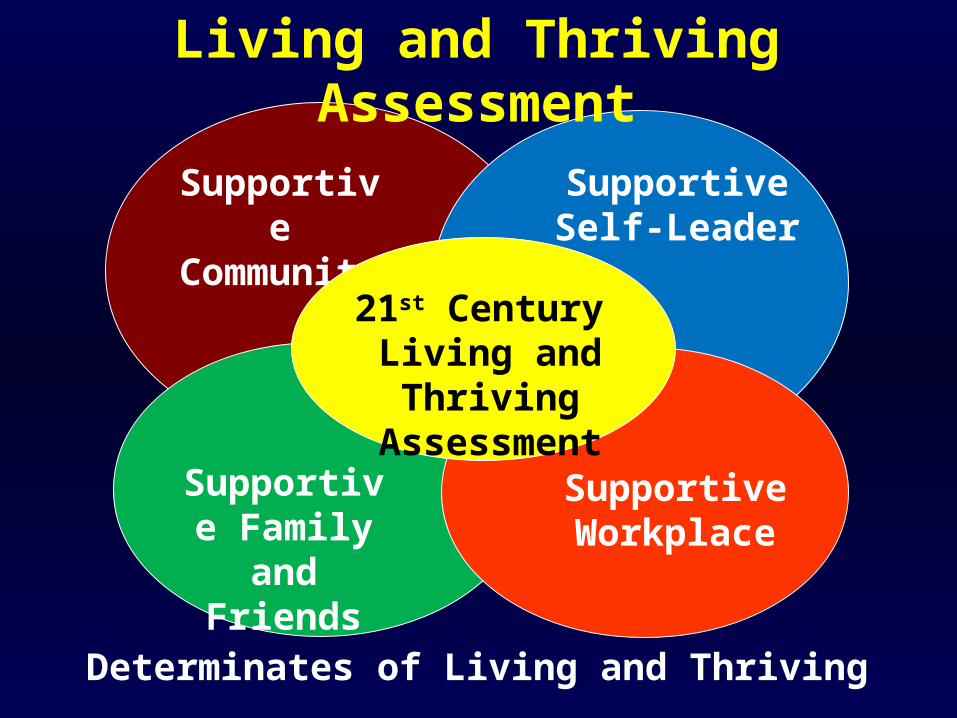
Supportive Self-Leader
Supportive
Community
Supportive Family
and Friends
Supportive Workplace
21st Century Living and Thriving
Assessment
Determinates of Living and Thriving
Living and Thriving Assessment
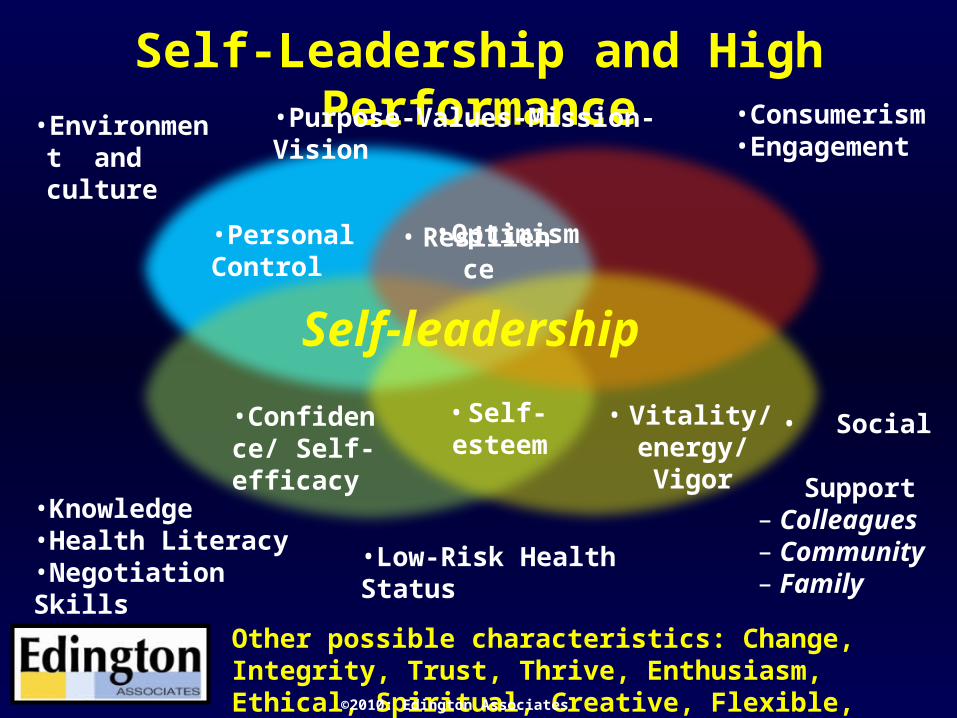
Self-Leadership and High Performance
•Personal Control
• Optimism
Self-leadership
• Resilience
•Confidence/ Self-efficacy
• Self-esteem
•Knowledge •Health Literacy•Negotiation Skills
• Vitality/energy/Vigor
•Consumerism•Engagement
• Social Support
– Colleagues– Community – Family
•Environment and culture
Other possible characteristics: Change, Integrity, Trust, Thrive, Enthusiasm, Ethical, Spiritual, Creative, Flexible,
•Low-Risk Health Status
•Purpose-Values-Mission-Vision
©2010: Edington Associates
Implementation
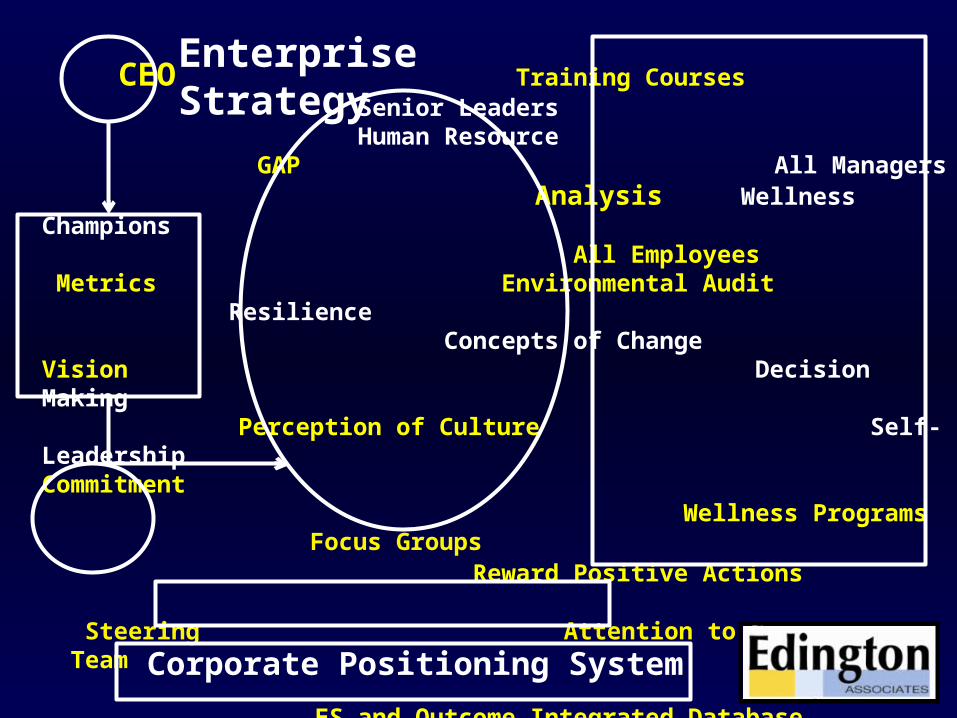
CEO Training Courses Senior Leaders Human Resource
GAP All Managers Analysis Wellness Champions
All Employees Metrics Environmental Audit Resilience
Concepts of ChangeVision Decision Making
Perception of Culture Self-LeadershipCommitment
Wellness Programs Focus Groups
Reward Positive Actions
Steering Attention to Gaps Team
ES and Outcome Integrated Database
Corporate Positioning System
Enterprise Strategy
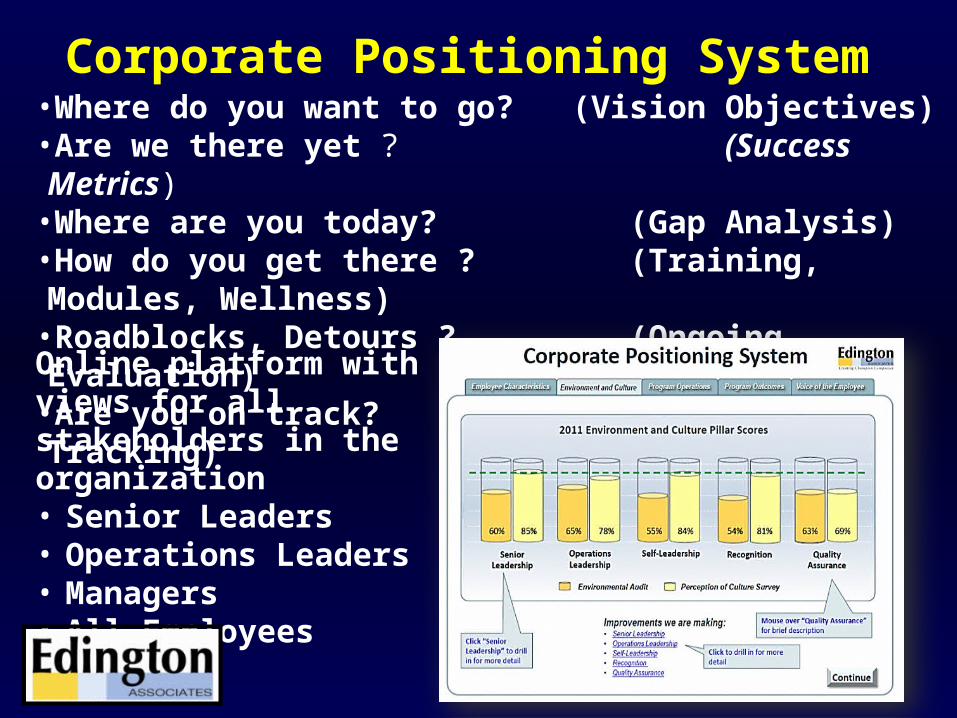
Corporate Positioning System•Where do you want to go? (Vision Objectives)•Are we there yet ? (Success Metrics)•Where are you today? (Gap Analysis)•How do you get there ? (Training, Modules, Wellness)•Roadblocks, Detours ? (Ongoing Evaluation)•Are you on track? (Real Time Tracking)
Online platform with views for all stakeholders in the organization• Senior Leaders• Operations Leaders• Managers• All Employees
Summary
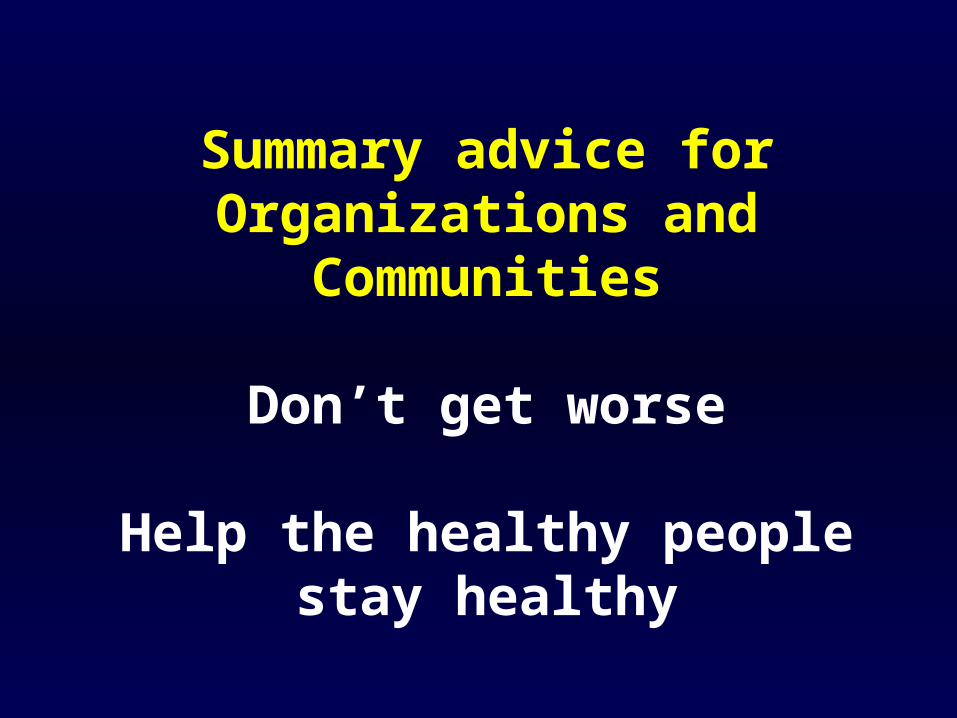
Summary advice for Organizations and
Communities
Don’t get worse
Help the healthy people stay healthy
© 2011 Edington Associates, LLC
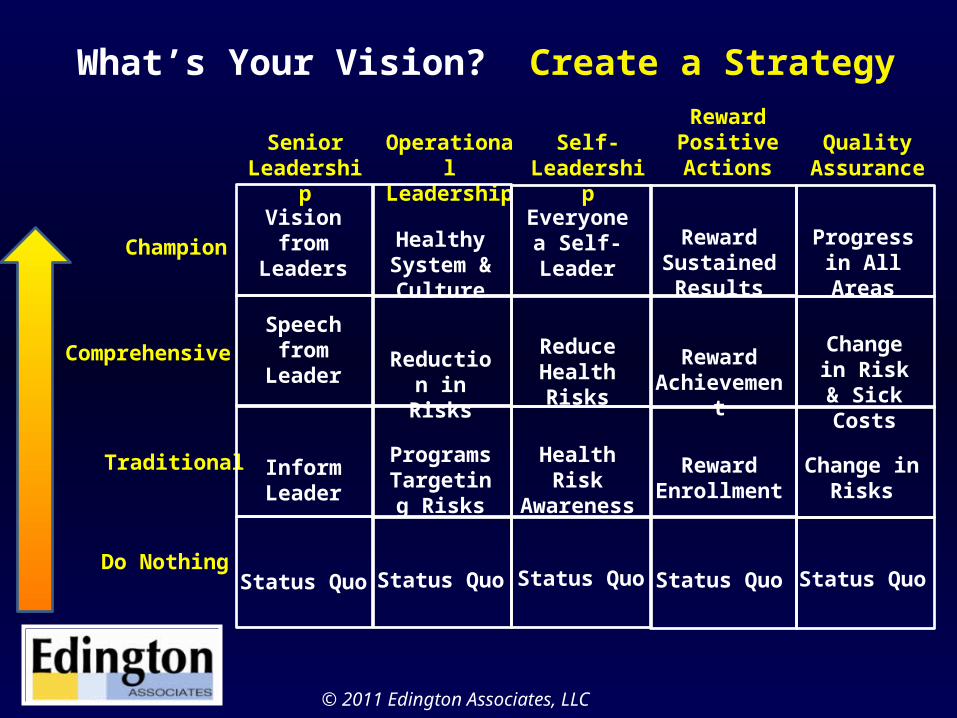
What’s Your Vision? Create a Strategy
Vision from
LeadersHealthy
System & Culture
Champion
Everyone a Self-Leader
Reward Sustained
Results
Progress in All Areas
Comprehensive
Traditional
Do Nothing
Speech from
LeaderReduction in Risks
Reduce Health Risks
Reward Achievement
Change in Risk &
Sick Costs
Inform Leader
Programs Targeting
Risks
Health Risk
Awareness
Change in Risks
Status Quo
Senior Leadership
Operational Leadership
Self-Leadership
Reward Positive Actions
Quality Assurance
Status Quo Status Quo Status Quo Status Quo
Reward Enrollment

What’s the Point
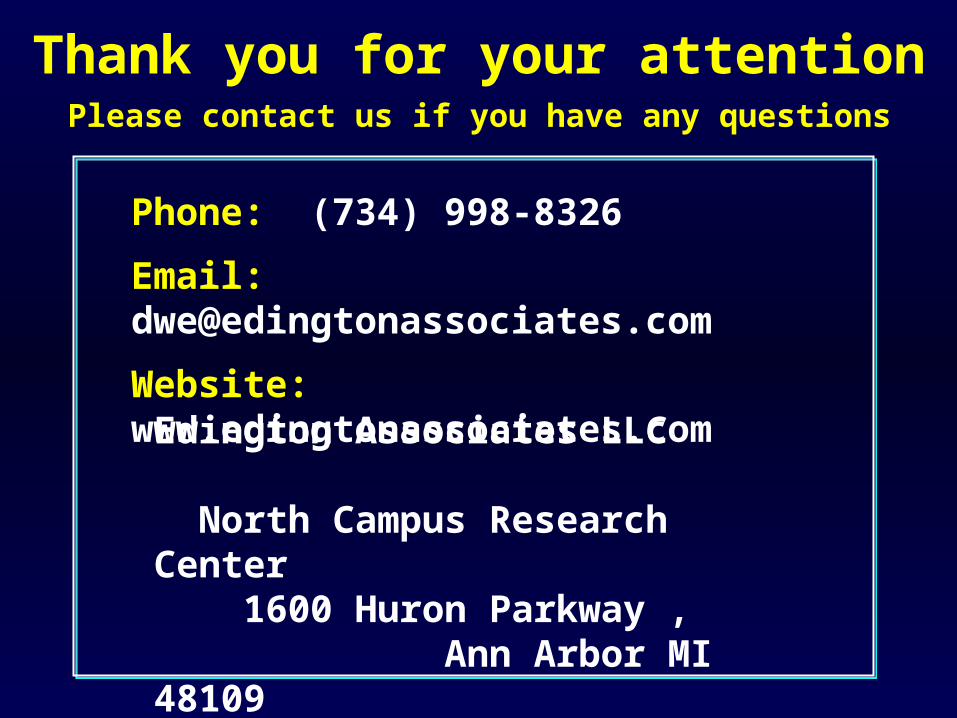
Thank you for your attentionPlease contact us if you have any questions
Phone: (734) 998-8326
Email: [email protected]
Website: www.edingtonassociates.com
Edington Associates LLC North Campus Research Center 1600 Huron Parkway , Ann Arbor MI 48109 Twitter, Facebook, LinkedIn