Embed Size (px)
Citation preview


Copyright © 2014, Oracle and/or its affiliates. All rights reserved. |
Real-World Performance TrainingExtreme OLTP Performance
Real-World Performance Team

Copyright © 2014, Oracle and/or its affiliates. All rights reserved. |
• Small transactions
• Processing small numbers of rows
• Fast (single-digit millisecond) response times
• Large numbers of users
• It’s all about efficiency
• Get-in-get-out
• Be nice to others
Extreme OLTP Workloads
Copyright © 2014, Oracle and/or its affiliates. All rights reserved. |
Agenda
Connection Pools
Serialization
Leaking
Database / Middleware Interaction
Extreme IO
Tools for Diagnostics
Analysis
1
2
3
4
5
6
7

Copyright © 2014, Oracle and/or its affiliates. All rights reserved. |
Agenda
Connection Pools
Serialization
Leaking
Database / Middleware Interaction
Extreme IO
Tools for Diagnostics
Analysis
1
2
3
4
5
6
7

Copyright © 2014, Oracle and/or its affiliates. All rights reserved. |
Connection Pools
• The primary reason for escalation of OLTP systems into the Real-World Performance Group is poor connection pooling strategies.
• Symptoms of a poor connection strategy:
– A high number of connections to the database ( 1,000s )
– A dynamic connection pool with a large number of logon/off to the database ( > 1/Sec )
– Periods of acceptable performance and then unexplainable/undebuggable periods of poor performance/availability
– The inability to determine what is happening in real time
Architectural Challenge

Copyright © 2014, Oracle and/or its affiliates. All rights reserved. |
Connection PoolsConnection Pools

Copyright © 2014, Oracle and/or its affiliates. All rights reserved. |
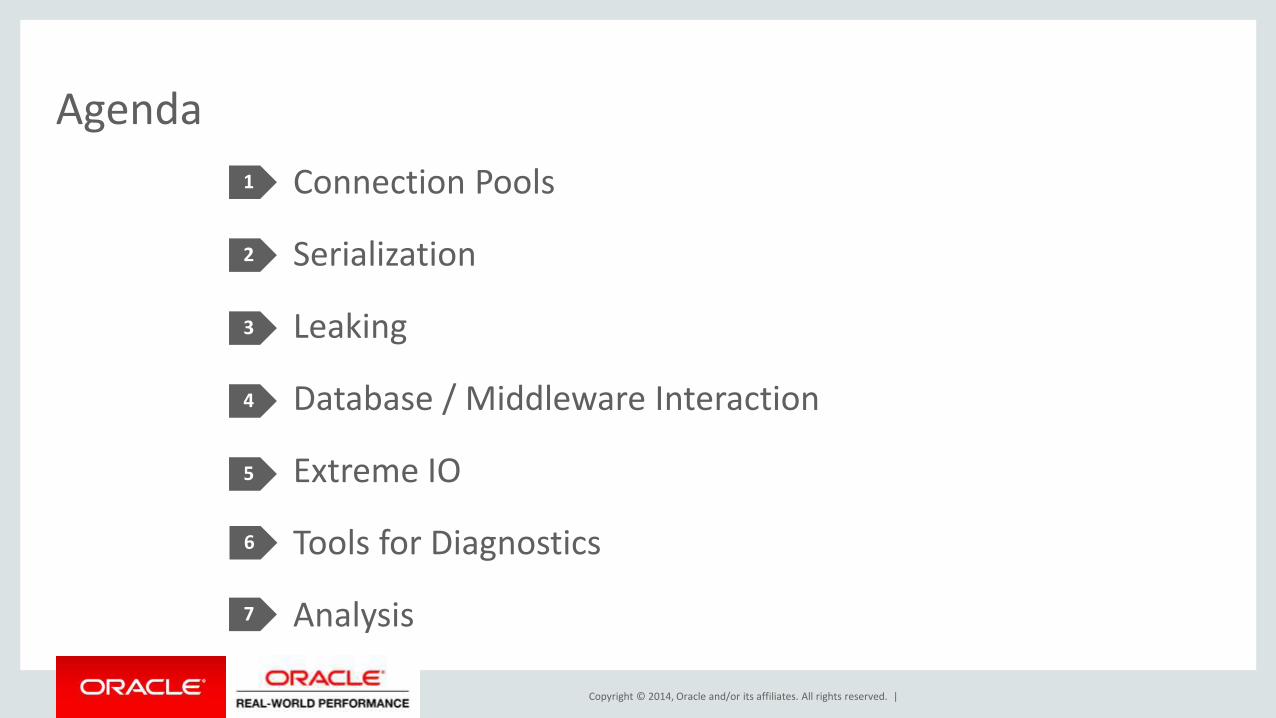
Performance DataConnection Pools
The workload is incrementally increased by doubling the load.
System appears scalable up to 65% CPU on the DB server.

Copyright © 2014, Oracle and/or its affiliates. All rights reserved. |
Performance DataConnection Pools
A checkpoint is initiated, creating a spike that results in unpredictable response time

Copyright © 2014, Oracle and/or its affiliates. All rights reserved. |
Performance DataConnection Pools
A slight increase to the workload results in a disproportionate CPU
increase, while response time degrades and the system
througput becomes unstable. System monitoring tools become
unreliable
Copyright © 2014, Oracle and/or its affiliates. All rights reserved. |
Performance DataConnection Pools
Reducing the connection pool by 50% results in more application server queuing and fewer DB
processes in a wait state. Observable improvement in response time and a consistent
transaction rate.
Copyright © 2014, Oracle and/or its affiliates. All rights reserved. |
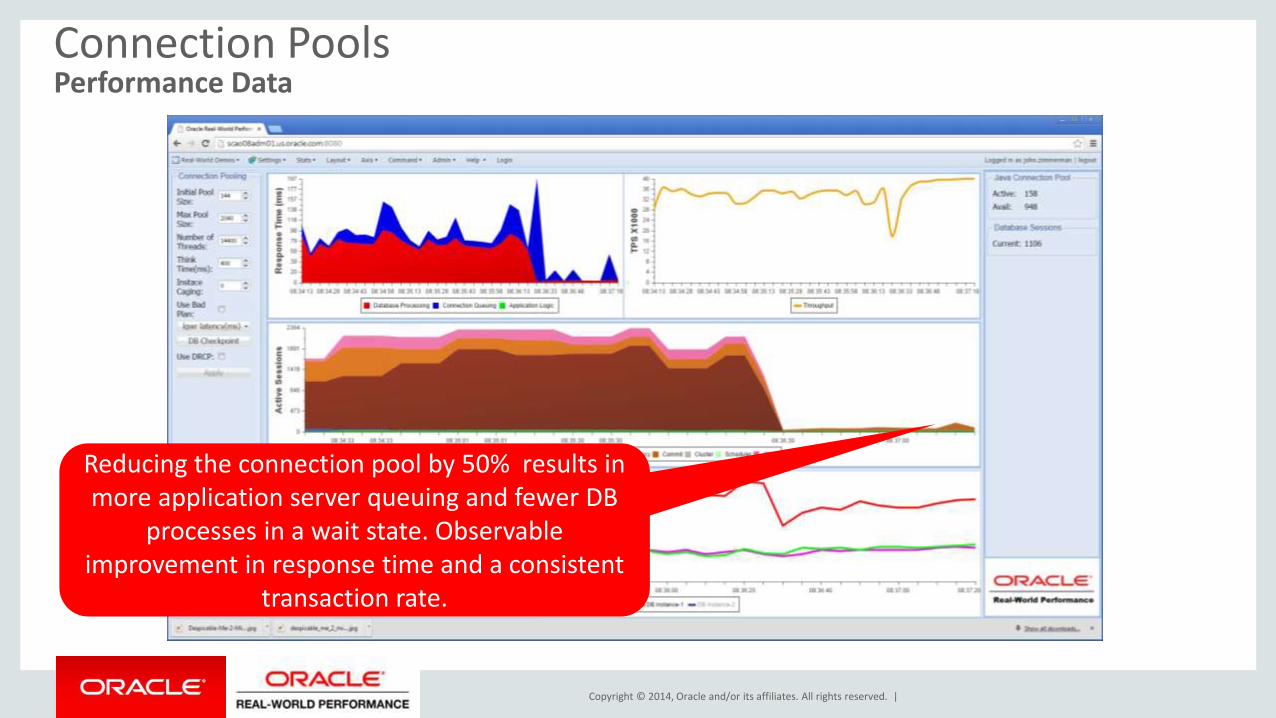
Performance DataConnection Pools
Another slight increase to the workload results in a an unstable system with spikes
in response time and throughput

Copyright © 2014, Oracle and/or its affiliates. All rights reserved. |
Performance DataConnection Pools
Connection pool reduced to 144. Note improvement in response
time and transaction rate.CPU utilization is also reduced.

Copyright © 2014, Oracle and/or its affiliates. All rights reserved. |
Connection Pools
• In order to stay in control of an OLTP system, the DBA must be able to:– Query the system
– Extract trace files
– Debug issues
• Without these tools, when a race condition occurs, it becomes impossible to determine the root cause of any problem or to prevent the problem from reoccurring
• Resource Management: Learning how to manage and control resources• RM is not a turbo, it is a gatekeeper
• RM will slow/stop some processes so that other process can run efficiently
Staying in Control

Copyright © 2014, Oracle and/or its affiliates. All rights reserved. |
ControlConnection Pools
By reducing the CPU_COUNT in the resource manager, the database can be throttled back. Note the increase in response time and the wait event resmgr: cpu quantum

Copyright © 2014, Oracle and/or its affiliates. All rights reserved. |
Connection Pools
• Connection Storms
• SQL Plan degradations
Race Conditions

Copyright © 2014, Oracle and/or its affiliates. All rights reserved. |
Connection Pools
• May be caused by application servers that allow the size of the pool of database connections to increase rapidly when the pool is exhausted
• A connection storm may take the number of connections from hundreds to thousands in a matter of seconds
• The process creation and logon activity may mask the real problem of why the connection pool was exhausted and make debugging a longer process
• A connection storm may render the database server unstable, unusable
Connection Storms

Copyright © 2014, Oracle and/or its affiliates. All rights reserved. |
The Anatomy of a Connection Storm
Connection Pools

Copyright © 2014, Oracle and/or its affiliates. All rights reserved. |
The Anatomy of a Connection Storm
Connection Pools

Copyright © 2014, Oracle and/or its affiliates. All rights reserved. |
The Anatomy of a Connection Storm
Connection Pools

Copyright © 2014, Oracle and/or its affiliates. All rights reserved. |
Connection Pools
• SQL Plan changes can be caused by multiple issues:– Change in init.ora parameters that influence the optimizer– RDBMS version change– New Schema statistics– Bind Peeking
• Poor SQL can also be introduced by:– Badly tested new application code– Tools version changes
• All have the same impact they introduce SQL that is executing sub optimally resulting in increases of:– CPU– I/O
SQL Plan Degradations

Copyright © 2014, Oracle and/or its affiliates. All rights reserved. |
Connection Pools
• The increases in CPU and I/O can be orders of magnitude greater than the optimal SQL Plan
• The impact is usually to overload the system beyond the ability of the system to respond
• When the number of concurrent sub optimal SQL statements > CPUs a race condition will take place
• Symptoms include– System appears hung
– Unable to get keyboard response from the Database Server even at the console
– To regain control you may have pull the power from the HW
SQL Plan Degradations

Copyright © 2014, Oracle and/or its affiliates. All rights reserved. |
Connection Pools
• SQL Plan degradations are going to happen, it is important to be able to diagnose them and obtain the debug info before you loose the system. To assist in this process there things that can be done to help
– set init.ora(CPU_COUNT) to 75% of the actual CPUs and invoke the default resource plan or construct a resource plan leaving some resources idle
– Limit connections to the DB to 2-3 times the number of Cores
– Ensure a DB connection pool cannot grow under load
SQL Plan Degradations

Copyright © 2014, Oracle and/or its affiliates. All rights reserved. |
Agenda
Connection Pools
Serialization
Leaking
Database / Middleware Interaction
Extreme IO
Tools for Diagnostics
Analysis
1
2
3
4
5
6
7

Copyright © 2014, Oracle and/or its affiliates. All rights reserved. |
Serialization
• The current system performance is acceptable
• New requirement: Capture transaction summary statistics and store data in a flattened “history” table for further analysis
• Implementations of the INSERT statement causes a dramatic reduction in system performance
• The accepted solution must scale, as the application will be deployed globally in the new year
Observations

Copyright © 2014, Oracle and/or its affiliates. All rights reserved. |
Serialization

Copyright © 2014, Oracle and/or its affiliates. All rights reserved. |
Performance DataSerialization
Transaction rate: 52,000 TPS Response time: 2 ms
Dominant wait events: log file sync and CPU

Copyright © 2014, Oracle and/or its affiliates. All rights reserved. |
Performance DataSerialization
Transaction rate: 5,300 TPS Response time: 18 ms
Dominant wait events: buffer busy waits and
enq:TX–index contention

Copyright © 2014, Oracle and/or its affiliates. All rights reserved. |
Reverse Key IndexSerialization
Transaction rate: 19,000 TPS Response time: 5 ms
Contention reduced while the history table remains small.
CPU increases with workload.

Copyright © 2014, Oracle and/or its affiliates. All rights reserved. |
Reverse Key IndexSerialization
Transaction rate: 3,000 TPS Response time: 33 ms
Contention shifts to I/O subsystem when the
history table grows larger

Copyright © 2014, Oracle and/or its affiliates. All rights reserved. |
Hash Partition IndexSerialization
Transaction rate: 20,000 TPS Response time: 5 ms
Contention reduced by hash partitioned history table index

Copyright © 2014, Oracle and/or its affiliates. All rights reserved. |
Add RAC nodeSerialization
Transaction rate: 21,000 TPS Response time: 9 ms
RAC appears not to scale well with contention in cluster waits

Copyright © 2014, Oracle and/or its affiliates. All rights reserved. |
Composite Key IndexSerialization
Transaction rate: 35,000 TPSResponse time: 5 ms
RAC configuration scales well with no contention or gc waits

Copyright © 2014, Oracle and/or its affiliates. All rights reserved. |
Serialization
• INSERT statement results in index contention due to surrogate primary key generated by using a sequence
• Solution 1: REVERSE KEY primary key index– This proves unsatisfactory after the table has grown to a critical size
• Solution 2: HASH PARTITION primary key index– This proves unsatisfactory after moving to a RAC cluster
• Solution 3: Code the sequence to ensure no index contention– New sequence structure: instance# | session id | sequence
– Solution 3 demonstrates optimal scaling and response time characteristics
Data Analysis

Copyright © 2014, Oracle and/or its affiliates. All rights reserved. |
The Scalable Key Code
INSERT INTO clo_normal.log_big_clever
VALUES
(
1E+25 * USERENV('INSTANCE')
+ 1E+20 * mod(USERENV('SID'),100)
+ clo_normal.big_clever_seq.nextval,
0,0,'card id','HallID','TID',sysdate,1,12,'WheelPos',123456,123456,123456,0,1);

Copyright © 2014, Oracle and/or its affiliates. All rights reserved. |
Performance Testing Results
Serialization
0
5
10
15
20
25
30
35
0
5000
10000
15000
20000
25000
Normal Reverse Key Small Reverse Key Big Hash Big Hash Big 2Nodes
Smart Big 2Nodes
Tx Rate per sec
Response Time (ms)

Copyright © 2014, Oracle and/or its affiliates. All rights reserved. |
Response Time
• Response time impacted by non database code
– Application server time• Code problem
• Capacity planning
• Response time impacted by database internal contention
– Right growing index problem• Reverse Key Index ( Good for small tables )
• Hash partitioned Index ( Good for large tables, poor with RAC )
• Non contentious primary key ( Good in all scenarios, application code change required )
Debugging by Numbers

Copyright © 2014, Oracle and/or its affiliates. All rights reserved. |
Agenda
Connection Pools
Serialization
Leaking
Database / Middleware Interaction
Extreme IO
Tools for Diagnostics
Analysis
1
2
3
4
5
6
7

Copyright © 2014, Oracle and/or its affiliates. All rights reserved. |
Leaking

Copyright © 2014, Oracle and/or its affiliates. All rights reserved. |
Leaking
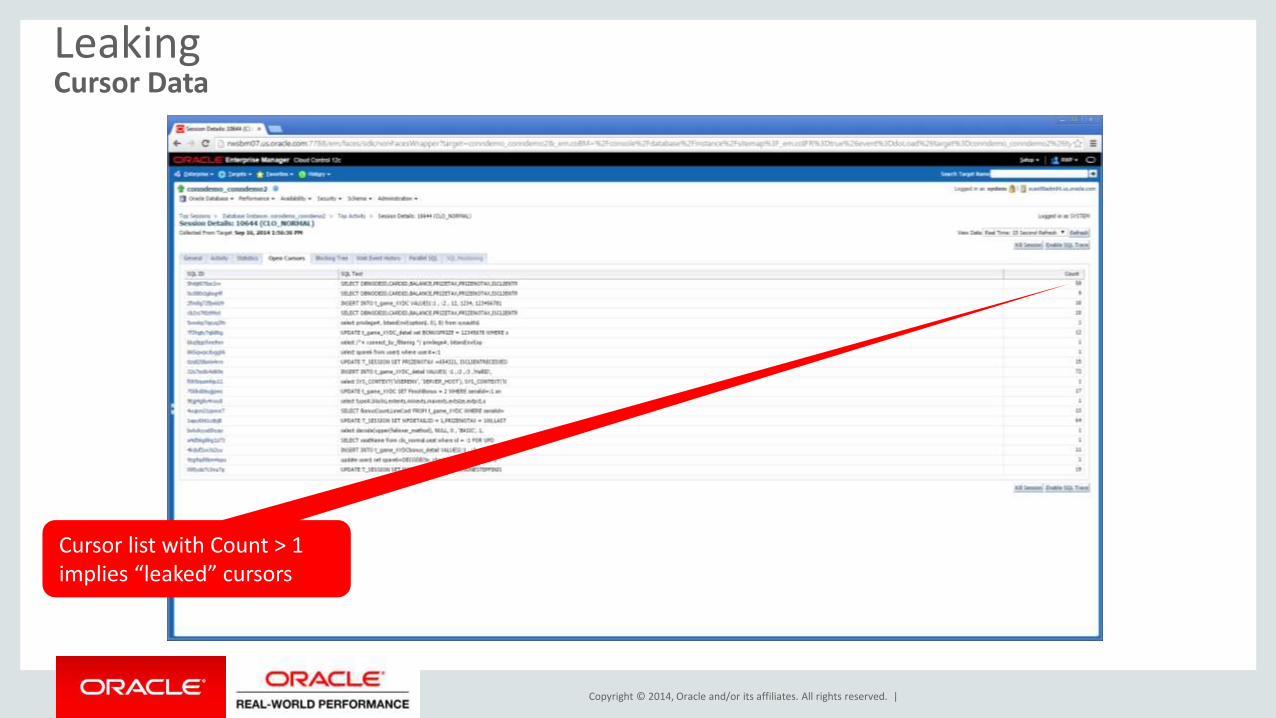
• Intermittent error: “ORA-01000: Maximum number of cursors exceeded”. Application server fails and must be restarted
• The DBA has suggested that the init.ora parameter open_cursors be reset to 30,000 to make the problem “go away for a while”.
• Symptoms of cursor leaking
Observations

Copyright © 2014, Oracle and/or its affiliates. All rights reserved. |
Performance DataLeaking
Error message: ORA-01000 Maximum open
cursors exceeded
“SQL*Net break/reset to client”

Copyright © 2014, Oracle and/or its affiliates. All rights reserved. |
Session DetailsLeaking
SQL*Net break/reset to client
Copyright © 2014, Oracle and/or its affiliates. All rights reserved. |
Cursor DataLeaking
Cursor list with Count > 1 implies “leaked” cursors

Copyright © 2014, Oracle and/or its affiliates. All rights reserved. |
Leaking
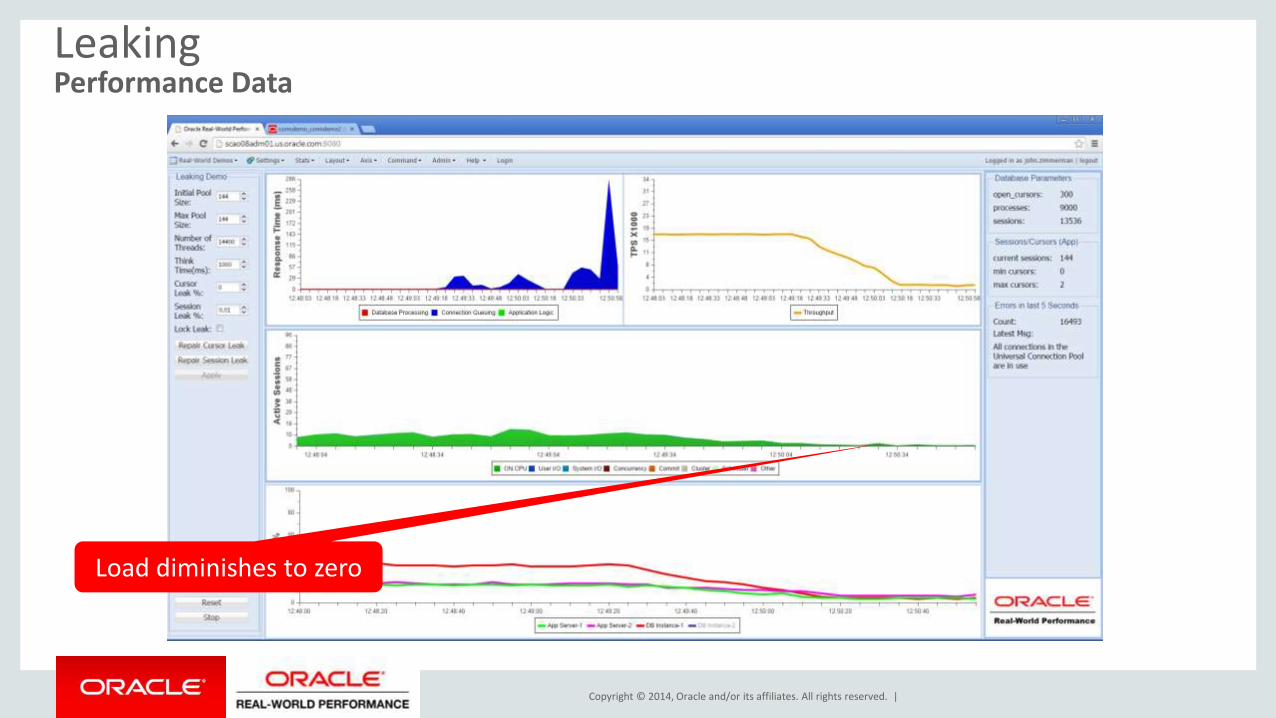
• After a period of time, the system performance begins to decline and then degrades rapidly
• After rapid degradation, the application servers time out and the system is unavailable
• The DBA claims the database is not the problem and simply needs more connections
– The init.ora parameter processes is increased to 20,000
Observations
Copyright © 2014, Oracle and/or its affiliates. All rights reserved. |
Performance DataLeaking
Load diminishes to zero

Copyright © 2014, Oracle and/or its affiliates. All rights reserved. |
Leaking
• Due to coding errors on exception handling, the application leaks connections in the connection pool making them programmatically impossible to use
• This reduces the effective size of the connection pool
• The remaining connection are unable to keep up with the incoming workload
• The rate of connection leakage is accelerated until there are no useable connections left in the pool
Session Leaking

Copyright © 2014, Oracle and/or its affiliates. All rights reserved. |
Leaking
• Potential indicators of session leaking:
– Frequent application server resets
– init.ora parameters process and sessions set very high
– Configuration of large and dynamic connection pools
– Large number of idle connections connected to the database
– Free memory on database server continually reduced
– Presence of idle connection kill scripts or middleware configured to kill idle sessions
Session Leaking

Copyright © 2014, Oracle and/or its affiliates. All rights reserved. |
Leaking
• Without warning, the database appears to hang and the application servers time out simultaneously
• The DBA sees that all connections are waiting on a single lock held by a process that has not been active for a while.
• Each time the problem occurs, the DBA responds by running a script to kill sessions held by long time lock holders and allowing the system to restart.
Observations

Copyright © 2014, Oracle and/or its affiliates. All rights reserved. |
Performance DataLeaking
Leaked lock holder causes entire system
to stall

Copyright © 2014, Oracle and/or its affiliates. All rights reserved. |
Blocking TreeLeaking
Block tree reveals lock holder which
can be killed

Copyright © 2014, Oracle and/or its affiliates. All rights reserved. |
Performance DataLeaking
enq: TX – row lock contention

Copyright © 2014, Oracle and/or its affiliates. All rights reserved. |
Performance DataLeaking
System returns to normal when lock is released. There could have been logical data corruption and it may happen again
Copyright © 2014, Oracle and/or its affiliates. All rights reserved. |
Leaking
• Lock leaking is usually a side effect of session leaking and the exception handling code failing to execute a commit or rollback in the exception handling process.
• A leaked session may be programmatically lost to the connection while holding locks and uncommitted changes to the database.
Lock Leaking

Copyright © 2014, Oracle and/or its affiliates. All rights reserved. |
Leaking
• Programming error impact:
– Potential system hangs: all connections queue up for the held lock
– Potential database logical corruptions: end users may have thought transactions were committed when in fact they have not been
– If sessions return to the connection pool but still have uncommitted changes, it is not deterministic, if and/or when the changes are committed or rolled back. This is a serious data integrity issue.
Lock Leaking

Copyright © 2014, Oracle and/or its affiliates. All rights reserved. |
Leaking
• Developer Bugs
– Incorrect/untested exception handling• Cursor, session and lock leaking
– High values for init.ora ( open_cursors, processes, sessions )
– Idle process and lock holder kill scripts
– Oversized connection pools of largely idle processes
How to Develop High Performance Applications

Copyright © 2014, Oracle and/or its affiliates. All rights reserved. |
Agenda
Connection Pools
Serialization
Leaking
Database / Middleware Interaction
Extreme IO
Tools for Diagnostics
Analysis
1
2
3
4
5
6
7

Copyright © 2014, Oracle and/or its affiliates. All rights reserved. |
Database / MiddlewareInteraction

Copyright © 2014, Oracle and/or its affiliates. All rights reserved. |
ScenarioDatabase / Middleware Interaction
• Devices ship files.
• Files read and processed by multiple application servers
• Each application server uses multiple threads that connect to database through a connection pool which is distributed by a scan listener over two instances.

Copyright © 2014, Oracle and/or its affiliates. All rights reserved. |
ProblemDatabase / Middleware Interaction
• It’s too slow
• It’s a problem with the database
– Look at all those waits
• Need to be able to process an order of magnitude more data
• Obviously need to move to Hadoop

Copyright © 2014, Oracle and/or its affiliates. All rights reserved. |
AnalysisDatabase / Middleware Interaction
• Only small amount of data being processed.
• Both instances essentially idle with most processes waiting in RAC and concurrency waits.

Copyright © 2014, Oracle and/or its affiliates. All rights reserved. |
SolutionDatabase / Middleware Interaction
• Remove all of those RAC waits by running against a single database instance.

Copyright © 2014, Oracle and/or its affiliates. All rights reserved. |
AnalysisDatabase / Middleware Interaction
• Throughput up by factor of 2x
• RAC waits gone
• CPU time actually visible
• High concurrency waits
– Buffer busy
– Tx index contention

Copyright © 2014, Oracle and/or its affiliates. All rights reserved. |
SolutionDatabase / Middleware Interaction
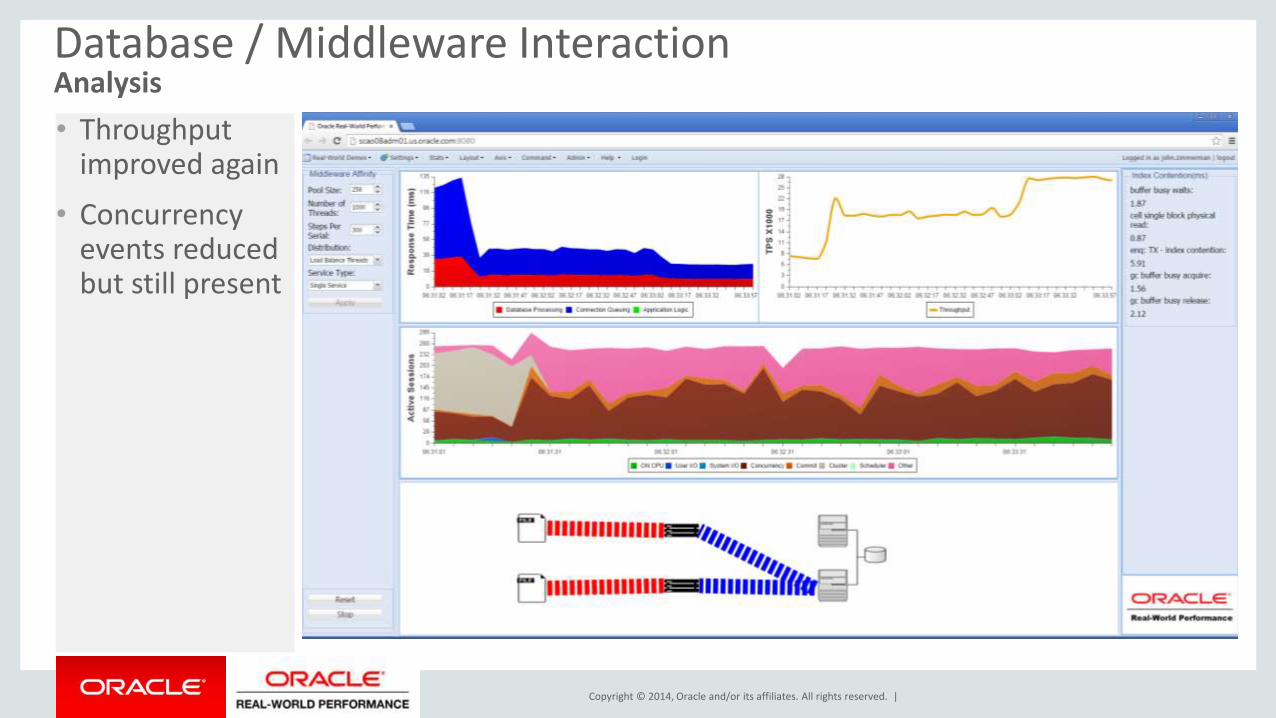
• Reduce contention waits by processing a file entirely within a single application server
Copyright © 2014, Oracle and/or its affiliates. All rights reserved. |
AnalysisDatabase / Middleware Interaction
• Throughput improved again
• Concurrency events reduced but still present

Copyright © 2014, Oracle and/or its affiliates. All rights reserved. |
SolutionDatabase / Middleware Interaction
• Introduce affinity for a related set of records to a single thread by hashing
• All records for the same primary key processed by single thread so no contention in index for same primary key vale

Copyright © 2014, Oracle and/or its affiliates. All rights reserved. |
AnalysisDatabase / Middleware Interaction
• More throughput
• Log file sync predominant event
• CPU usage close to core count

Copyright © 2014, Oracle and/or its affiliates. All rights reserved. |
SolutionDatabase / Middleware Interaction
• Reintroduce RAC to add more CPU resource
• Implement separate service for each instance
• Connect application server to one instance

Copyright © 2014, Oracle and/or its affiliates. All rights reserved. |
Agenda
Connection Pools
Serialization
Leaking
Database / Middleware Interaction
Extreme IO
Tools for Diagnostics
Analysis
1
2
3
4
5
6
7

Copyright © 2014, Oracle and/or its affiliates. All rights reserved. |
Extreme IO

Copyright © 2014, Oracle and/or its affiliates. All rights reserved. |
Performance DataExtreme IO
Database slow down is magnified in application
server
Erratic database performance

Copyright © 2014, Oracle and/or its affiliates. All rights reserved. |
Performance DataExtreme IO
Note smoothing effect of async logging. Beware of data integrity issues!
log file sync events have been replaced
with log buffer space events

Copyright © 2014, Oracle and/or its affiliates. All rights reserved. |
ResolutionExtreme IO
With uniform log file sync events, we now
see a slight slow down of other DB I/O
Performance is consistent as flash
cache protects system from I/O
surges

Copyright © 2014, Oracle and/or its affiliates. All rights reserved. |
Extreme IO
• Average response times for log writes mask outlier values of very high write times > 1 sec ( log file parallel write )
• Investigation reveals surges in workloads on shared storage from unrelated workloads
• The business requires full data integrity. Asynchronous logging is not an option due to potential data loss
• There are three potential solutions:– Eliminate background workloads
– Relocate log files to dedicated devices
– Use Exadata flash logging
Data Analysis

Copyright © 2014, Oracle and/or its affiliates. All rights reserved. |
Agenda
Connection Pools
Serialization
Leaking
Database / Middleware Interaction
Extreme IO
Tools for Diagnostics
Analysis
1
2
3
4
5
6
7

Copyright © 2014, Oracle and/or its affiliates. All rights reserved. |
Main Tools for OLTP Diagnostics
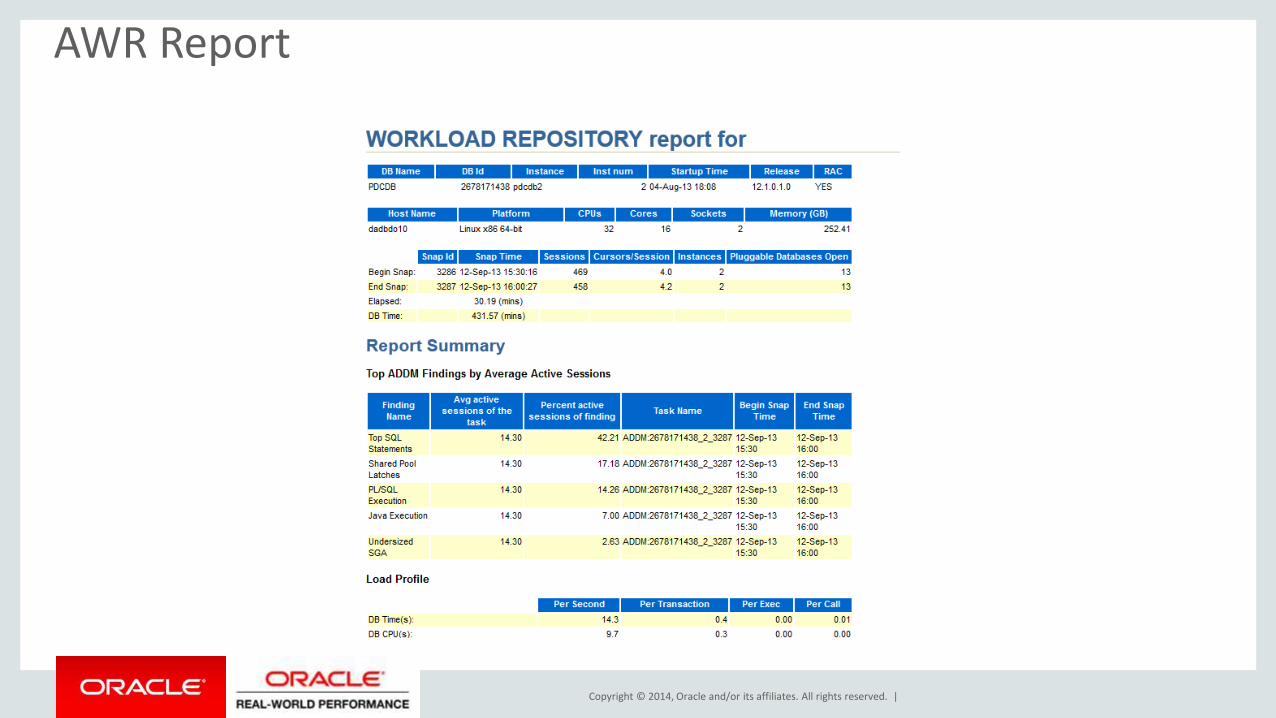
• AWR Report
– Diagnostic information on the instance or database level
– Information for the system as a whole
• ADDM Report– Recommendations based on AWR information
• ASH Report
– More granular information such as the session level

Copyright © 2014, Oracle and/or its affiliates. All rights reserved. |
Instance, database reports of database activityHTML reports are preferred
AWR Report
SQL>REM
SQL>REM For Current Database Instance
SQL>@?/rdbms/admin/awrrpt.sql
SQL>REM
SQL>REM For Full RAC Clusterwide Report
SQL>@?/rdbms/admin/awrgrpt.sql
SQL>REM
SQL>REM For SQL Exec History(Detecting Plan Changes)
SQL>@?/admin/awrsqrpt.sql
Copyright © 2014, Oracle and/or its affiliates. All rights reserved. |
AWR Report

Copyright © 2014, Oracle and/or its affiliates. All rights reserved. |
AWR Report
• AWR report can be accessed by navigating
– Database Tab
– Automatic Workload Repository
– Select snapshots
• You may find the command line interface is quicker !
EM Access to Reports

Copyright © 2014, Oracle and/or its affiliates. All rights reserved. |
EM Access to ReportsAWR Report

Copyright © 2014, Oracle and/or its affiliates. All rights reserved. |
ADDM Report
• Performs performance diagnostic analysis and makes recommendations for improvement.
• The ADDM report should accompany any AWR report as a matter of standard practice
ADDM
SQL>REM
SQL>REM For Current Database Instance
SQL>@?/rdbms/admin/addmrpt.sql

Copyright © 2014, Oracle and/or its affiliates. All rights reserved. |
ADDM Report

Copyright © 2014, Oracle and/or its affiliates. All rights reserved. |
ADDM Report
• ADDM report can be accessed by navigating
– Performance Tab
– “Historical” Right hand drop down menu
– Select snapshot
– (Run ADDM) Button
EM Access to Reports

Copyright © 2014, Oracle and/or its affiliates. All rights reserved. |
EM AccessADDM Report
Select “Historical”

Copyright © 2014, Oracle and/or its affiliates. All rights reserved. |
EM AccessADDM Report
Choose analysis icon of interest
Run ADDM Report

Copyright © 2014, Oracle and/or its affiliates. All rights reserved. |
ASH Report
• Active Session History reports can provided fine granularity tightly scoped reports e.g. for a short time period (< AWR interval) or
• for an individual session or a particular module.
ASH
SQL>REM
SQL>REM For Current Database Instance
SQL>@?/rdbms/admin/ashrpt.sql

Copyright © 2014, Oracle and/or its affiliates. All rights reserved. |
ASH Report

Copyright © 2014, Oracle and/or its affiliates. All rights reserved. |
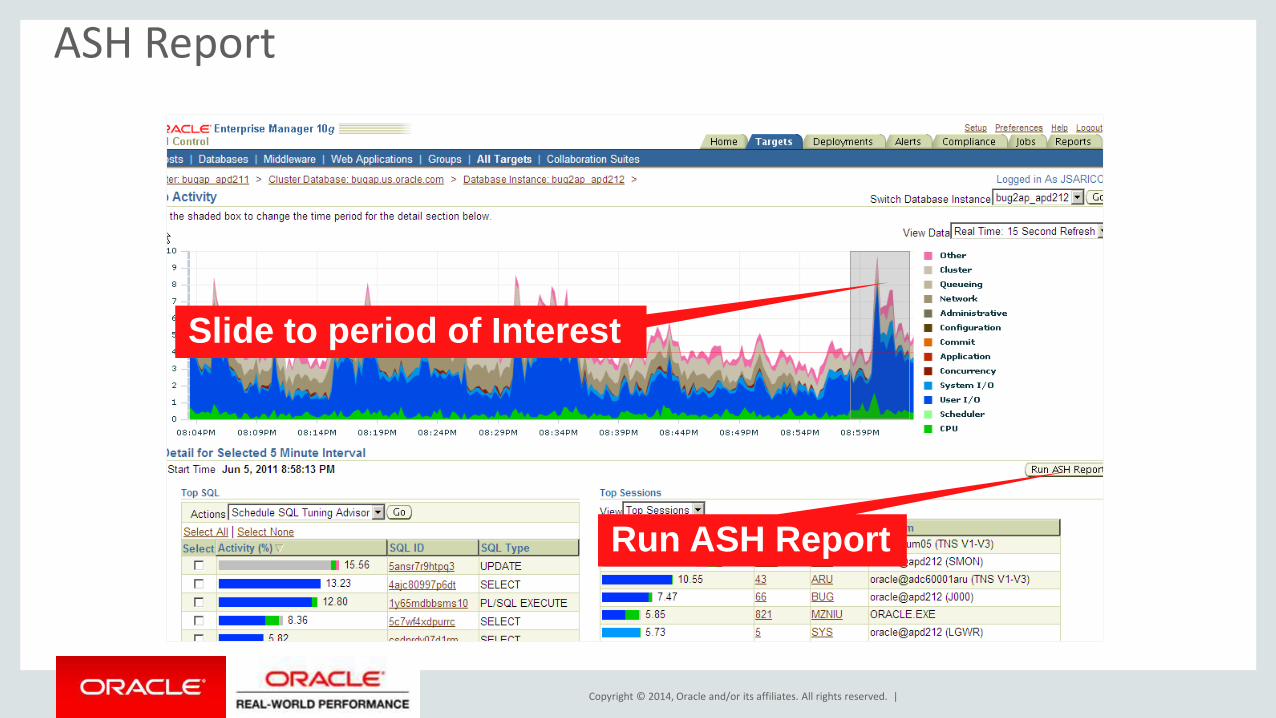
ASH Report
• ASH report can be accessed by navigating
– Performance Tab
– “Top Activity” Link
– Slide moving window over period of interest
– (Run ASH Report) Button
EM Access to Reports

Copyright © 2014, Oracle and/or its affiliates. All rights reserved. |
ASH Report
Select Top Activity Link
Copyright © 2014, Oracle and/or its affiliates. All rights reserved. |
ASH Report
Slide to period of Interest
Run ASH Report

Copyright © 2014, Oracle and/or its affiliates. All rights reserved. |
ASH Report

Copyright © 2014, Oracle and/or its affiliates. All rights reserved. |
Agenda
Connection Pools
Serialization
Leaking
Database / Middleware Interaction
Extreme IO
Tools for Diagnostics
Analysis
1
2
3
4
5
6
7

Copyright © 2014, Oracle and/or its affiliates. All rights reserved. |
AWR Architecture Analysis
• Large amount of data in the AWR report
• Tells us about the way that the system has been architected and designed as well as about how it is performing
• Often see common mistakes
More than just wait events and top SQL
Copyright © 2014, Oracle and/or its affiliates. All rights reserved. |
AWR from online systemReady for Black Friday?

Copyright © 2014, Oracle and/or its affiliates. All rights reserved. |
AWR from Online system
• Testing system for Black Friday readiness
• Cannot generate load expected on test system
• Do you see any problems with this system scaling up from this test?
• Will we survive Black Friday ?
Copyright © 2014, Oracle and/or its affiliates. All rights reserved. |
AWR Header
• First-level bulleted text is Calibri 28 pt
– Second-level text (press tab key) is 24 pt
• Calibri is the only font used in the template
• All bulleted text is sentence case (capitalize first letter of first word)
• Use bold, red, or both to highlight ONLY KEY text
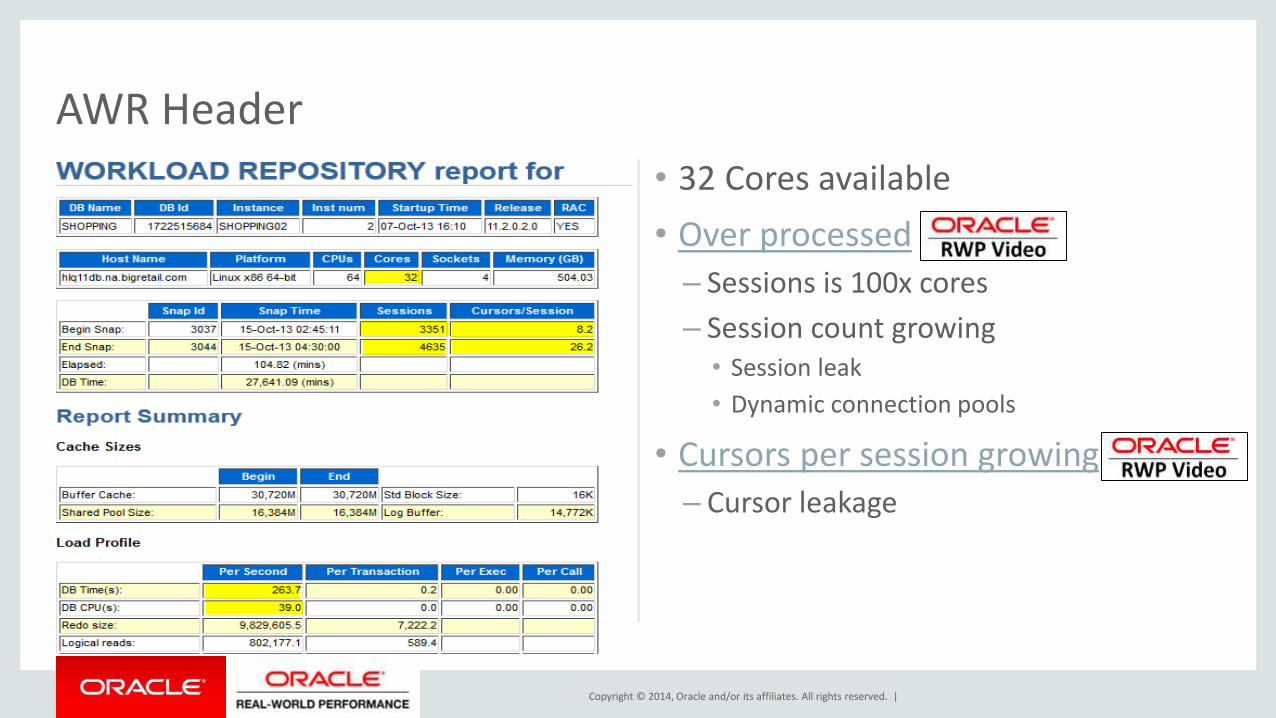
• 32 Cores available
• Over processed
– Sessions is 100x cores
– Session count growing• Session leak
• Dynamic connection pools
• Cursors per session growing– Cursor leakage
Copyright © 2014, Oracle and/or its affiliates. All rights reserved. |
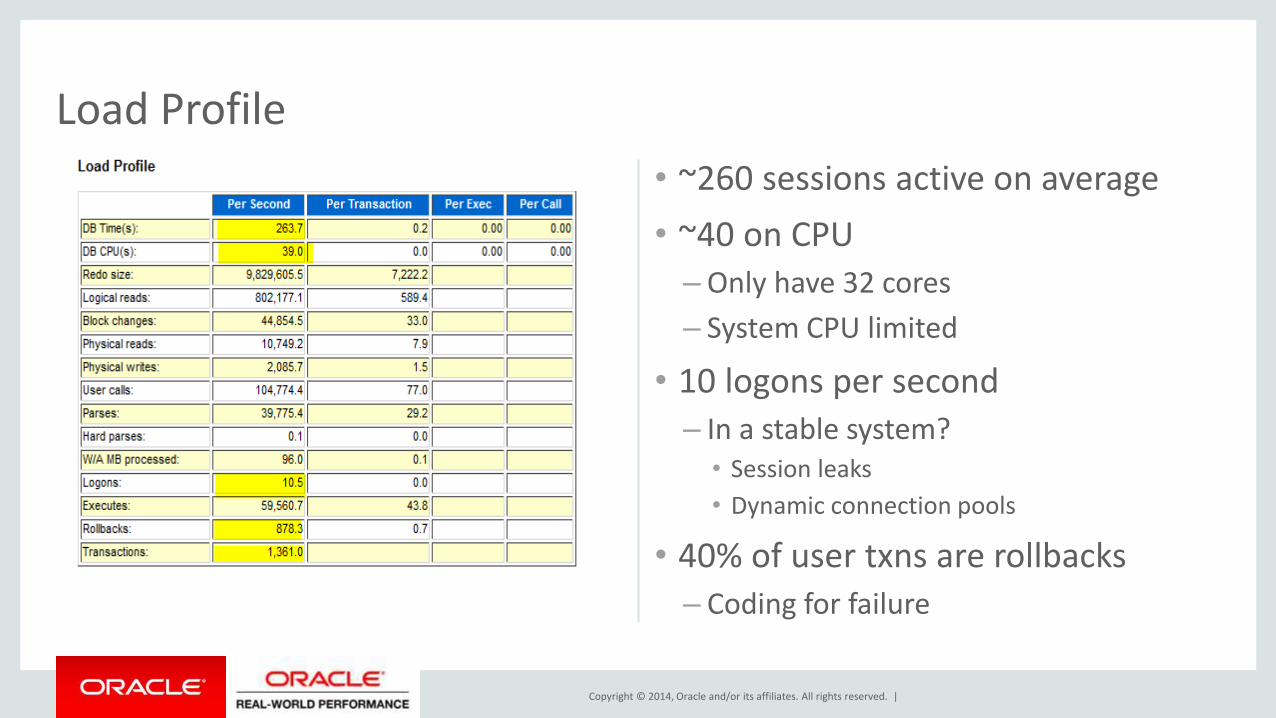
Load Profile
• ~260 sessions active on average
• ~40 on CPU
– Only have 32 cores
– System CPU limited
• 10 logons per second – In a stable system?
• Session leaks
• Dynamic connection pools
• 40% of user txns are rollbacks
– Coding for failure

Copyright © 2014, Oracle and/or its affiliates. All rights reserved. |
Init.ora
• Underscore parameters
• Db_block_size=16384
• Cursor_sharing=FORCE
• Db_file_multiblock_read_count=32

Copyright © 2014, Oracle and/or its affiliates. All rights reserved. |
Init.ora
• Db_writer_processes=12
– On a system that supports asynchIO?
• Open_cursors=2000
– Per session limit
– Implies cursor leaking

Copyright © 2014, Oracle and/or its affiliates. All rights reserved. |
Init.ora
• Optimizer_index_cost_adj=50
– Classic hack parameter
• Processes=5500
• Sessions=8320

Copyright © 2014, Oracle and/or its affiliates. All rights reserved. |
Top events
• Concurrency waits > 35% of time
– Library cache: mutex X
– Latch:row cache objects
– Typical of high CPU load
– A symptom, not the problem
• Row lock contention 18% of time
• IO with 7ms avg read time
• CPU only 15% of DB Time
• Log file sync?
Where is the time going?

Copyright © 2014, Oracle and/or its affiliates. All rights reserved. |
Top SQL
• Top statementSELECT /*SHOP*/ YFS_ORDER_HEADER.*
FROM YFS_ORDER_HEADER
WHERE (ORDER_HEADER_KEY = :1 )
FOR UPDATE
– 12% of load
– 2 million executions
– Average execution 0.1 sec
Where is the time going?

Copyright © 2014, Oracle and/or its affiliates. All rights reserved. |
Top SQL
• Top statementSELECT /*SHOP*/ YFS_ORDER_HEADER.*
FROM YFS_ORDER_HEADER
WHERE (ORDER_HEADER_KEY = :1 )
FOR UPDATE
– 40% of RLWs are on that object

Copyright © 2014, Oracle and/or its affiliates. All rights reserved. |
Top SQL
• Next two statements
– Call of DBMS_APPLICATION_INFO• Application instrumentation
– 14% of load
– 26M executions each
– Instrumentation is a good thing BUT
– Not needed since Oracle 10g
– Use parameters to OCI or Java instead

Copyright © 2014, Oracle and/or its affiliates. All rights reserved. |
Other SQL

Copyright © 2014, Oracle and/or its affiliates. All rights reserved. |
Online Summary
• System is CPU bound at test load levels
• System seems to be leaking both cursors and sessions (and maybe locks)
• System is running far too many processes
• High overhead application instrumentation
Not looking good for Black Friday

Copyright © 2014, Oracle and/or its affiliates. All rights reserved. |
Reference Section
Copyright © 2014, Oracle and/or its affiliates. All rights reserved. |
Operating System Diagnostics
• Captures Operating system data– top
– vmstat
– netstat
– iostat
– mpstat
• Described in MOS Notes 1617454.1 and 301137.1.
• Note that Exadata deployment is a modified version of OSWatcher that is installed by default on all database nodes and storage cells.
ExaWatcher and OSWatcher

Copyright © 2014, Oracle and/or its affiliates. All rights reserved. |
Operating System Diagnostics
• Lives in – /opt/oracle.ExaWatcher
– /opt/oracle.oswatcher/osw
• The collected data will be under – /opt/oracle.ExaWatcher/archive
– /opt/oracle.oswatcher/osw/archive
– one subdirectory per collector
• Should purge data after seven days
ExaWatcher and OSWatcher

Copyright © 2014, Oracle and/or its affiliates. All rights reserved. |