Embed Size (px)
Citation preview

A. M. Adams & S. I. Walker, Int. J. of Design & Nature and Ecodynamics. Vol. 12, No. 4 (2017) 458–469
© 2017 WIT Press, www.witpress.comISSN: 1755-7437 (paper format), ISSN: 1755-7445 (online), http://www.witpress.com/journalsDOI: 10.2495/DNE-V12-N4-458-469
REAL-WORLD OPEN-ENDED EVOLUTION: A LEAGUE OF LEGENDS ADVENTURE
ALYSSA M. ADAMS1,2 & SARA I. WALKER1,3,4,5
1Beyond Center for Fundamental Concepts in Science, Arizona State University, Tempe, USA 2Algorithmic Nature Group, LABORES, Paris, France
3School of Earth and Space Exploration, Arizona State University, Tempe, USA 4ASU-SFI Center for Biosocial Complex Systems, Arizona State University, Tempe, USA
5Blue Marble Space Institute of Science, Seattle, USA
ABSTRACTA prominent feature of life on Earth is the evolution of biological complexity: over evolutionary history the biosphere has displayed continual adaptation and innovation, giving rise to an apparent open-ended increase in complexity. The capacity for open-ended evolution has been cited as a hallmark feature of life and also characterizes human and technological systems. Yet, the underlying drivers of open-ended evolution remain poorly understood. League of Legends (League) is an online team-based strategy game that has become immensely popular over the last 6 years. Because new characters (called ‘champions’) are regularly added and the game is updated every few weeks by the game’s developer Riot Games, the game never settles into an equilibrium distribution of player strategies. Innovative strategies are required for players to succeed, just as innovation is required to outcompete other organisms in open-ended biological systems. Although understanding open-endedness is crucial to understanding how living sys-tems operate, it is often difficult or impossible to collect sufficient data to study the mechanisms driving open-ended evolution in natural systems. Online social systems, particularly games, offer ideal laboratories for studying open-ended evolutionary dynamics because of the rich data archived on statistics of users and their interactions. We focus on using data from North America’s top 200 players to determine how dominance hierarchies emerge from player strategies and how they evolve in time after an external perturbation. This is a microcosm for studying, in detail, how external and internal mechanisms can drive a real-world open-ended system. Our goal is to provide general insights that can be applied to a wide range of fields, including astrobiology and evolutionary systems.Keywords: complexity, Open-ended evolution, social systems, theoretical biology, video games
1 INTRODUCTIONArguably, one of the most challenging scientific endeavors at the forefront of 21st century research is the quest to understand life. We currently have few insights into how living systems might quantifiably differ from their non-living counterparts, something increasing critical as astrobiology advances as a discipline. Development of a theory of living systems, if at all possible, demands mathematical understanding of how data is generated, collected, and changes over time. One prominent example of this limited understanding is the exact mechanisms underlying open-ended evolution on multiple levels of biological organization. We currently lack a coherent theory general enough to encompass all levels of biology and its open-ended and emergent properties. On the other hand, technology in today’s (respectively more) globalized society is providing us with an overabundance of data. Recent work on open-ended evolution has therefore shifted focus to studying innovative technological and social systems, such as the evolution of patents [1, 2], and online social systems [3–5]. Online video games have rich dynamics as well, with high-resolution data available on player statistics and strategies, which have under utilized as data sets for studying open-ended dynamics.
In this paper, we explore a small dataset of top players in the online video game League of Legends (League) and utilize this data as a tractable model for studying a real-world
A. M. Adams & S. I. Walker, Int. J. of Design & Nature and Ecodynamics. Vol. 12, No. 4 (2017) 459
open-ended dynamical system in detail. League is an online community of players where millions of players play with and against each other on a virtual battlefield, pitting 140+ in-game characters against one-another in team battles. The game is developed by Riot Games and is regularly modified (in code) every week or two. The interactions between play-ers within the game and regular external interventions by the developer Riot Games lead to a dynamical system where player strategies never achieve a fixed state. This leads the game to display many ‘life-like’ properties that resemble features seen in other complex biological systems, as a result of human-to-human interactions. In particular, the game updates itself according to its own history and its current state, making it a self-referential system. Memory of the past is likely stored in the game’s current state. The game can most simply be parti-tioned into two interacting subsystems: the players and the game developers. Both these subsystems update each other’s behavior much like an organism (game) and its environment (developer) interact in a highly non-linear way. The game as a whole does not evolve under a predefined state space. Since the game developers are not limited in the number of changes they can make to the game, the game evolves in an open-ended way.
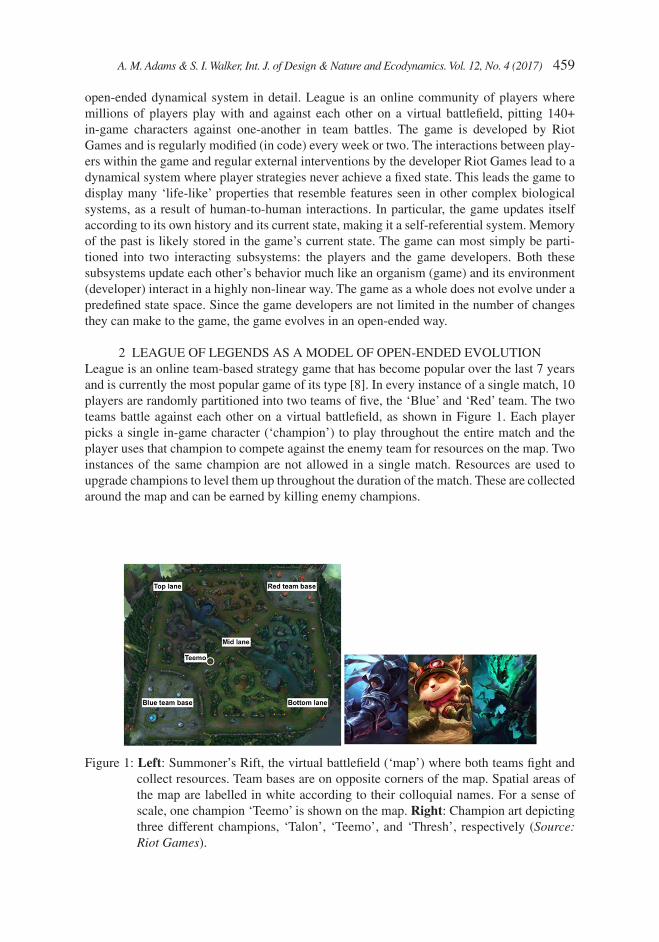
2 LEAGUE OF LEGENDS AS A MODEL OF OPEN-ENDED EVOLUTIONLeague is an online team-based strategy game that has become popular over the last 7 years and is currently the most popular game of its type [8]. In every instance of a single match, 10 players are randomly partitioned into two teams of five, the ‘Blue’ and ‘Red’ team. The two teams battle against each other on a virtual battlefield, as shown in Figure 1. Each player picks a single in-game character (‘champion’) to play throughout the entire match and the player uses that champion to compete against the enemy team for resources on the map. Two instances of the same champion are not allowed in a single match. Resources are used to upgrade champions to level them up throughout the duration of the match. These are collected around the map and can be earned by killing enemy champions.
Figure 1: Left: Summoner’s Rift, the virtual battlefield (‘map’) where both teams fight and collect resources. Team bases are on opposite corners of the map. Spatial areas of the map are labelled in white according to their colloquial names. For a sense of scale, one champion ‘Teemo’ is shown on the map. Right: Champion art depicting three different champions, ‘Talon’, ‘Teemo’, and ‘Thresh’, respectively (Source: Riot Games).

460 A. M. Adams & S. I. Walker, Int. J. of Design & Nature and Ecodynamics. Vol. 12, No. 4 (2017)
The goal of the game is for one team to destroy the other team’s base. This requires a high level of cooperation and trust within individual teams of players. The more matches a single player wins over time, the higher the player climbs up in skill ranking.
Riot Games, the game’s developer, updates the game every 1–3 weeks. They add new champions, update old champions, change properties of the map, and change other aspects of the game via code updates. Most of these changes are aimed at making the game more fun for the players [9]; listening to player needs/wants to make the best accommodations possible. Thus, the majority of Riot Games’ changes are based on feedback from the players and reflect the current state of the game.
Figure 2 shows a schematic of the players’ exploration of the game space, as constrained by Riot Games. The possible game state space is not self-defined because it depends on several unaccounted factors such as technology that is implemented, creativity, and even the economy. In this sense, the game as a whole (players, platform and Riot Games) is open-ended, since its evolution will never repeat [10–12].
By defining a constant constraint on the game space, the dynamics are guaranteed to repeat and open-ended evolution is not possible. Changing the constraints allows a system to generate dynamics that do not repeat, thus the player dynamics are also open-ended as long as the constraints are changing [12]. It is unclear how a signal is translated into an act on the game’s current constraint, and Riot Games might not use a single function to determine it.
2.1 Collecting relevant data
League is a very complicated and layered game in its own right. There are three maps, seven match modes, and eight tiers of skill. For this analysis, we only collected data from players that have the highest skill ranking on the North American server. League’s skill ranking system is crowned with the Challenger tier: Only the top 200 players on each server occupy this tier of play. If a player is in the Challenger tier, they are most likely a professional player and stream their matches on Twitch (an online streaming service) for money. Several tournament players are in Challenger tier as well.
Figure 2: Left: In the possible game space, Riot Games’ rule constraint a subspace for the players to explore. The players have a finite number of possible ways of creating data in the game state space. At some point during the players’ trajectory, Riot Games collects some signal about the state of the game generated by the players. Right: Riot Games processes the signal in some way and changes the game constraints by updating the game. This allows new space for the players to explore.

A. M. Adams & S. I. Walker, Int. J. of Design & Nature and Ecodynamics. Vol. 12, No. 4 (2017) 461
In League’s player community, Challenger players often set gameplay trends. Since they are the best-of-the-best players, lower level players often imitate their strategies and game-play styles in hopes of climbing the skill ranks themselves. Hence, we assume that Challenger players are the players’ main drivers. We note that there are other aspects of lower skill game-play that are not addressed in the current work. Although this game has many interacting complex parts like most complex systems, we emphasize that the main point of this study is not to determine if this system evolves in an open-ended way, nor does it explore what drives the open-endedness. Rather, the point is to determine how this system evolves mechanistically and if these mechanisms can be generalized to other levels of biological organization.
We also only consider matches that were played on League’s most popular map, Summoner’s Rift. Since we want to ensure these players are playing their best (because players can purposefully play bad games to entertain an audience), we only consider Ranked matches. Ranked matches determine if a player stays in Challenger tier or is demoted to a lower skill tier and are therefore taken more seriously.
Here, we consider two consecutive game ‘patches’. Between the times that the game is patched, the game’s constraints remain unchanged and constant. As a starting point, it will be easier to assess two separate time periods in the data where the game constraints remain unperturbed by developer intervention. These patches, named 7.2 and 7.3, were used 6 Jan 2017 to 7 Feb 2017 and 9 Feb 2017 to 22 Feb 2017, respectively. One day between the two patches was discarded since the game deployed patch 7.3 that day.
2.2 Methods
All game data are made freely available to the public by Riot Games and can be downloaded thorough Riot Games’ server API [13]. To save time, we used a pre-written Python 3.X package called Cassiopeia [14] as an interface to connect to the API. Datreant [15] was also employed for fast and easy data sorting and exploration.
2.3 Internal mechanisms
Riot Games’ changes to the game are assumed to be changes to the game’s constraints. Players (Challenger tier players) generate data by playing matches (ranked matches on Summoner’s Rift). Between patches, the game is fixed in the sense that it has a static code underlying the game and a pre-defined state space; there are only so many different things players are able to do with the game’s current code. In physics, systems typically evolve under a pre-defined state space. This makes them easier to understand conceptually. Equations are used to quantify how systems move through and explore the pre-defined state space. For this reason, this part of the data is the best place to start to eventually understand the game’s dynamics as a whole. In other words, we begin our analysis by considering player-generated data between Riot Games’ game changes, where the game’s code is unchanged and the constraints that the players play under are constant.
How are the players moving through this space? Presumably, players want to win matches and are picking strategies to help them achieve that goal. So is the players’ trajectory their way of discovering optimal strategies to win the game? There is a subtle conceptual pitfall here based on what the data represents. Despite Riot Games’ attempts to make all of its cham-pions equally competitive, there is no reason to assume there is a pre-existing optimal champion or strategy to use. All knowledge about how the players explore the game state

462 A. M. Adams & S. I. Walker, Int. J. of Design & Nature and Ecodynamics. Vol. 12, No. 4 (2017)
space (including Riot Games’ knowledge) is generated solely by player data. There are only a finite number of possible states the data can be in at any given time. There is also no explicit ‘best’ strategy that is optimal at any given time. However, players supposedly seek a type of optimum by exploring possible strategies and using the ones that win the most games. This could be an analogy for biology since organisms and species evolve by exploring the possibility space of phenotypes and use the ones that are the most ‘successful’ at a particular time.
There are several different ways to quantify how the players explore possible strategies and evolve the current ‘metagame’. The term ‘metagame’ is a kin to the most popular strategy being used at a given time. Physically, the game consists of people, electronic hardware, and software. Virtually, a metagame can be described in several different ways, depending on the question at hand. As an example, asking what the metagame is at a certain point in time is much like asking what state the United States’ Republican party is in at a certain point in time. In an attempt to understand the game in alignment with Riot Games, we are going to use a metric that players use to pick their strategies for every match: which champion beats what other champions. Champion selection is a core mechanic of selecting a strategy. If a player sees the enemy team picks the champion ‘Teemo’, the player is likely going to pick a champion that can beat ‘Teemo’, such as ‘Talon’. This decision is guided by knowledge from past experiences. In previous games, the player was successful in beating ‘Teemo’ with ‘Talon’ (or perhaps participated in games where they observed this interaction between other players) several times. In other words, players have some general knowledge about the metagame.
Since there is no explicit optimal strategy to use as a goalpost for the players, we can only use only player-generated data to determine which champion beats what. Let’s say champions {A, B, C, D and E} are used on Blue team, and champions {V, W, X, Y and Z} are used on the Red team for a single match. Blue team wins the match. We say that in this match, champion A beat all Red team’s champions (V, W, X, Y and Z), W beat all Blue team’s champions (A, B, C, D and E), etc. This is a generalization of high-level play, since all players on Red team interact with all players on Blue team frequently during a single match. This also simplifies our analysis.
Figure 3: ‘Teemo’ is on the Blue team and ‘Tristana’ is on the Red team. If Blue team won, we represent the ‘Teemo’/‘Tristana’ interaction on a graph like so.

A. M. Adams & S. I. Walker, Int. J. of Design & Nature and Ecodynamics. Vol. 12, No. 4 (2017) 463
This can be represented as a network, where if the character Teemo beat the champion Tristana, the interaction is represented by a directed edge from node ‘Teemo’ into node ‘Tristana’, as shown in Figure 3.
For an aggregate of matches, edges have weights to represent exactly how badly ‘Teemo’ beats ‘Tristana’ during those matches. Edge weights are quantified in the next section.
2.4 Meta strategy trends
When League was first released in 2009, any champion was played on any spatial location on the map by the players. As time passed, players decided that having certain types of champions on certain locations of the map was preferred. Since the community made this decision, a team’s general spatial organization has not changed for over 6 years. In some sense, players computed a firm ‘meta’, the player community term for a persistent and uniquely identifiable strategy trend.
Within this firm meta, there are sub-metas. For example, high-damage characters might be very popular. After some time, the champions that easily beat the sub-meta champions (tough champions that do not take damage) become popular, simply because they counter the current sub-meta. Thus, the counter sub-meta becomes the new sub-meta. This minor sub-meta rotation is reminiscent of negative frequency-dependent selection in biology [16]. An agent-based model could be used to further explore these sub-meta dynamics as emergent dynamics among players.
Since players respond to current sub-metas by finding counter-strategies within the firm meta, the system retains a type of memory. There is an underlying mechanism that causes new sub-metas to emerge while allowing the firm meta to persist, even if a better firm meta may exist.
3 CONSTRUCTING NETWORKSTo represent the players’ internal dynamics under constant constraints (during a single patch, when the games’ code is unchanged), we constructed a champion counter network from collected data to see how champion power changes over time. In this context, power is used to describe how dominant a champion is over other champion, given a set of match data. Dominant or powerful champions are often more likely able to win games, regardless of the rest of the team’s performance. Players often consider particular champions to be powerful during certain days or weeks, while other characters could be considered under-powered (‘Who would ever play that champion?’ a player might remark).
At any given minute throughout the day, anywhere from 10 to 100 matches are being played in this pool of players. Matches can last anywhere from 20 to 60 minutes (a hard minimum on 20 and a rough higher estimate on the 60). It is unclear if the game has a natural time scale, which makes it difficult to identify individual time steps. All matches were binned into days according to their start times. This is arbitrary, but since Riot Games’ changes occur anywhere between 1 and 3 weeks, it seems like a reasonable time unit for network analysis.
Edge weights are constructed in the following way for a given day:
w i j→= ( )×( )popularity winrate
wi j n
i j→= ×
matches with vs
total matches
umber of matches whhere beat
matches with vs.
i j
i j
N
Mi j
=→ (1)

464 A. M. Adams & S. I. Walker, Int. J. of Design & Nature and Ecodynamics. Vol. 12, No. 4 (2017)
Since edge weights change on a daily basis, the network is dynamic with respect to time.
3.1 Power
For this analysis, we use eigenvector centrality (EVC) as a representation of a node’s power. For a weighted adjacency matrix W with EVC values xi, eigenvector centrality is defined as:
Wx x= l
x Wx=1
l
x w xi ij
n
i j j= =
=
∑EVC1
1λ, .
Google uses a modified version of this to determine the webpage rank as the result of a Google search [17]. Colloquially, EVC represents how much influence a node has in a net-work. It not only considers how many in-degrees or out-degrees a node has, but the degree of nodes it is connected to as well. A node with five connections has a higher EVC value when the nodes it is connected to are also highly connected. With this metric, we are interested in two questions to understand how a champion power hierarchy is formed and maintained. (1) What happens to the power over time in champions that were changed in the last patch? (2) What happens to the power over time in champions that are going to be changed during the next patch?
To gain a general sense of the distribution of power in the game, all data for a single patch were aggregated into a single network, shown in Figure 4. The distribution in Figure 4 shows the EVC ranking of champions over an entire patch, for both patch 7.2 and 7.3. This repre-sents a larger time scale than individual days.
The same analysis was completed for individual days, but we found each individual day had an approximately linear distribution. Since the distribution over the whole patch is non-linear, this indicates that points on the linear daily distribution move up and down the distribution day by day (Fig. 5). This figure shows the same ranking of EVC values, but on
Figure 4: Left: Ranked EVC distribution of nodes over the whole patch 7.2. The blue line represents EVC measured over the entire patch’s data aggregated onto a single network. The green dashed line shows the same, except for the last half of the patch. Right: Likewise for patch 7.3.

A. M. Adams & S. I. Walker, Int. J. of Design & Nature and Ecodynamics. Vol. 12, No. 4 (2017) 465
the time scale of individual days. This distribution is linear, as opposed to the non-linear distribution for the larger time scale.
The majority of champions on the upper half of the distribution continue to remain on the upper half day by day. The non-linear distribution on a larger time scale and the linear distri-bution on a smaller time scale remained largely invariant for their respective time scales. However, the non-linear distribution from the larger time scale suggests there may be an underlying dynamic on how the linear daily distributions change point ranking. This phe-nomenon may indicate a type of dynamic equilibrium in the game’s dynamics, which is characterized on a larger time scale by a non-linear distribution. The EVC values for individual nodes over time were analyzed to address this phenomenon. No clear trends were found for the
Figure 5: Left: Patch 7.2 single day (the first day of the patch) distribution of EVC node values. Points on the upper and lower half of the distribution are colored blue and red, respectively. Colors simply correspond to their rank position on the first day of the patch. Without changing the colors of the nodes, the distribution of EVC is shown for the last day of the patch (right).
Figure 6: EVC values for champions that were changed in patch 7.2 over time. Solid lines represent champions that were ‘buffed’ (made better in some way). Dashed lines represent champions that were ‘nerfed’ (made weaker).

466 A. M. Adams & S. I. Walker, Int. J. of Design & Nature and Ecodynamics. Vol. 12, No. 4 (2017)
accumulation of nodes (champions), so it was more fruitful to analyze specific champions, particularly ones that were changed during the two patches (Figs. 6–8).
From Figures 6–8, it is unclear whether Riot Games’ patches were beneficial to the ‘power- balance’ of the corresponding champions. In other words, it is unclear whether Riot Games’ patches accomplished the goal of adjusting the champions towards a more equal distribution
Figure 7: EVC values for champions that were changed in patch 7.3 over time. Solid lines represent champions that were ‘buffed’ (made better in some way). Dashed lines represent champions that were ‘nerfed’ (made weaker).
Figure 8: EVC values for champions in 7.2 that were eventually changed in patch 7.3 over time. These are champions that ‘signaled’ Riot Games in some form or another. Solid lines represent champions that were ‘buffed’ (made better in some way). Dashed lines represent champions that were “nerfed” (made weaker).

A. M. Adams & S. I. Walker, Int. J. of Design & Nature and Ecodynamics. Vol. 12, No. 4 (2017) 467
of power. In Figure 8, ‘Akali’ was buffed (made better in some way) and ‘Camille’ was nerfed (made weaker). Their power levels after their changes seem to suggest the opposite. Only a few champions seemed to have benefitted from their changes. Figure 10 suggests a better indication of what champions need future changes for the majority of champions, although still misses the mark on champions like ‘Rengar’ and ‘LeBlanc’ since their power is decreasing over time, yet they are nerfed anyways.
Since champion power levels depend on each other in a very intricate way, buffing or nerfing a particular champion doesn’t seem to have the desired effect on that given champion. For example, if champion A beats champion B, nerfing champion A is an indirect buff to champion B. Since this system is highly connected, making changes to the game can perturb the network in unforeseen ways. A deeper understanding of how elements of the system (such as champions in this context) affect each other rather than analysing the element dynamics themselves seems to be a more insightful direction of inquiry than a network approach. Although networks are useful in understand the direct relationships between entities, an agent-based-modelling approach might be more useful in understanding how these entities interact in a complex system.
For example, we could model agents who randomly select champions based on a distribution derived from the data. Match outcomes could be decided on factors such as the agent’s skill and data-based outcomes on which characters win against which other characters. From such a model, are the same EVC distributions produced over the rank of champions? We could also incorporate feedback, updating the champion-selection distribution based on the resulting EVC distribution. Such a model will be explored in the near future.
3.2 Player perspectives
Are players aware of the entire network’s structure? Players only observe interactions between 10 nodes per match, so it is unlikely they observe interactions that include all the 140+ champions every day. Players observe a smaller network from only the matches they participated in. If their goal as a player is to win, are they increasing the EVC value on their champions’ nodes in their smaller network of observed interactions? How do the EVC values of these smaller networks compare to the EVC values of the whole network?
In addition to these questions, it is important to highlight the two different kinds of League players. There are players who mainly stick to playing a single champion, and players who play whatever they think will help them win matches. We denote these players as Type 1 and Type 2, respectively. Type 1 players who stick to a single champion over time have more influence on a node. They actively maintain the state of a node and its connecting edges. In some sense, this is a lot like a system’s stability. Type 2 players who only play certain champions to win and the player who are more explorative and perhaps even more innovative. Their presence contributes to nodes that are likely more powerful. In another sense, they are a system’s innovation- apparatus.
4 WRAP-UPSo far, we have only considered a few components of League’s dynamics. Instead of using EVC as a metric, it could be fruitful to explore perturbation centrality measures [18], since game changes occur frequently. Our next immediate goal is to explore other ways of quantifying the players’ dynamics besides using a network, such as the agent-based models discussed previously. In addition, the idea of smaller player-observed networks described in the last section can be studied for practical purposes. Do players have unique ‘personal
468 A. M. Adams & S. I. Walker, Int. J. of Design & Nature and Ecodynamics. Vol. 12, No. 4 (2017)
network’ unique to their own match history or is the network topology similar for any given Type 1 player? It could be possible that if players have personal networks, cheaters can be detected. The most common form of cheating is when players purchase high skill-level accounts to use them as their own. Another is using external code to artificially improve a player’s skill. Cheating could be flagged by tracking sudden topological changes in a player’s personal network.
Understanding the rest of Figure 2 is beyond the scope of this paper, but can be addressed in future studies. In particular, what signal is Riot Games gathering from the players’ dynam-ics? How is this signal processed and translated into game updates? How do the game’s constraints on the players evolve? Finally, how do all these dynamics interact and aggregate to evolve the entire game as a whole? One could argue this data could be a useful compared to population dynamics data—both measured from real systems and generated from computer models. In League, however, this data exists on the boundary between real and computer- generated: real human players are using computers to interact with each other through software and the Internet. The game encompasses both types of data used in population dynamics studies. Returning to the negative-frequency dependence selection [16] analogy to describe player strategy dynamics, it would be useful to see how League data compares to both real data and purely computer-generated data.
Physical laws as we currently understand them are insufficient to describe biological phenomenon such as heredity, adaptability, and the number of global tweets per minute. If we were to somehow rewind the universe to the point of the Big Bang, is the presence of life somewhere in the universe inevitable? Perhaps, the reason this quest is so difficult is our lack of a fundamental understanding of biological data, although this is certainly up for speculation.
ACKNOWLEDGEMENTSSpecial thanks to Riot Games’ API team for allowing all League data to be public. Here’s a shout-out to David Dotson, the creator of Datreant. This project would not have been possible without his help. We would also like to thank the team at Cassiopeia for their helpfulness. A.A. and S.I.W. were supported by a grant from the Templeton World Charity Foundation.
REFERENCES [1] Chalmers, D.W, et al. High-content words in patent records reflect key innovations in
the evolution of technology. Alife XII Proceedings, pp. 838–845, 2010. [2] Buchanan, A., Packard, N.H. & Bedau, M.A., Measuring the evolution of the drivers of
technological innovation in the patent record. Artificial Life, 17(2), pp. 109–122, 2011. https://doi.org/10.1162/artl_a_00022
[3] DeDeo, S. Collective phenomena and non-finite state computation in a human social system. PLoS ONE, 9(6), e101511, 2013.
[4] Oka, M. & Ikegami, T. Exploring default mode and information flow on the web. PLoS ONE, 8(4), e60398, 2013.
[5] Oka, M., Hashimoto, Y. & Ikegami, T. Open-ended evolution in a web system. Late Breaking Papers at Artificial Life, 2015.
[6] Bringing big data to the enterprise, What is big data? IBM, available at: ibm.com/ software/data/bigdata/, accessed March 2017.
[7] Calude, C.S. & Longo, G., The deluge of spurious correlations in big data. Foundations of Science, pp. 1–18, 2016. https://doi.org/10.1007/s10699-016-9489-4

A. M. Adams & S. I. Walker, Int. J. of Design & Nature and Ecodynamics. Vol. 12, No. 4 (2017) 469
[8] Player Numbers. Riot Games, available at: riotgames.com/tags/player-numbers, accessed February 2016.
[9] Riot Manifesto. Riot Games, available at: riotgames.com/riot-manifesto, accessed March 2017.
[10] Banzhaf, W. et al. Defining and simulating open-ended novelty: requirements, guide-lines, and challenges. Theory in Biosciences, 135(3), pp. 131–161, 2016.https://doi.org/10.1007/s12064-016-0229-7
[11] Ruiz-Mirazo, K., Peretó, J. & Moreno, A., A universal definition of life: autonomy and open-ended evolution. Origins of Life and Evolution of the Biosphere, 34(3), pp. 323–346, 2004.
[12] Adams, A.M., Zenil, H., Davies, P.C.W. & Walker, S.I. Formal definitions of unbounded evolution and innovation reveal universal mechanisms for open-ended evolution in dynamical systems. Scientific Reports, 7(1), 2016.https://doi.org/10.1038/s41598-017-00810-8
[13] Stats straight from the source. Riot Games, available at: developer.riotgames.com/. (accessed March 2017).
[14] Cassiopeia. Merkai-Analytics, available at: github.com/meraki-analytics/cassiopeia. (accessed March 2017).
[15] Datreant: Persistent, pythonic trees for heterogeneous data. ReadtheDocs, available at: http://datreant.readthedocs.io/en/latest/. (accessed March 2017).
[16] Allen, J. A. & Clarke, B. C., Frequency-dependent selection- homage to Poulton. Biological Journal of the Linnean Society, 23, pp. 15–18, 1984.
[17] Austin, D., How google finds your needle in the Web’s Haystack. AMS Feature Column, available at: http://www.ams.org/samplings/feature-column/fcarc-pagerank, accessed March 2017.
[18] Szalay, K.Z. & Csermely, P., Perturbation centrality and turbine: a novel centrality mea-sure obtained using a versatile network dynamics tool. PLoS ONE, 8(10), e78059, 2013.