Embed Size (px)
Citation preview

Real-world fuel economy of heavy trucks
Prepared by Haobo Wang, Iain McGlinchy and Ralph SamuelsonTransport Knowledge Conference 2019 (5 December)
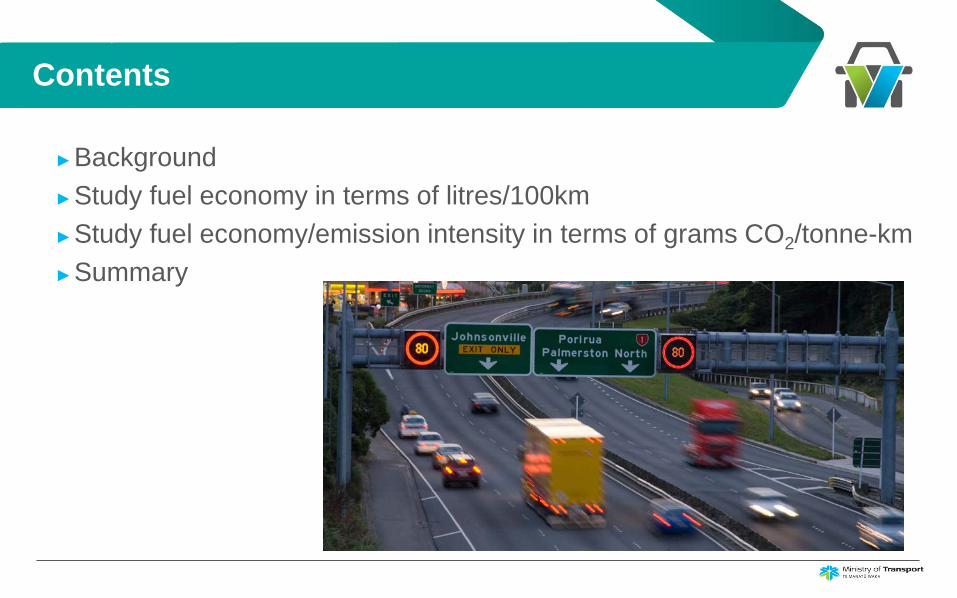
Contents
►Background►Study fuel economy in terms of litres/100km ►Study fuel economy/emission intensity in terms of grams CO2/tonne-km►Summary

Background

Vehicle fleet mix and travel
►Heavy trucks accounted for 3% of vehicles, but 6% of vkt►They used a lot more fuel for every km travelled

Heavy trucks are gross emitters
► Road transport contributed about 18% of national GHG emissions► Heavy trucks contributed roughly a quarter of the road emissions

Study fuel economy in terms of litres/100km

Heavy diesel trucks surveyed in EROAD data► Fuel use and VKT for each truck were recorded in each month from Jan 2015 to Aug 2018► Actual loads were not recorded► Data was analysed for more than 35,000 heavy trucks, with several thousands trucks surveyed each
year; overall, more than one thousand trucks were surveyed for each GVM category► EROAD data are fairly representative of NZ heavy truck fleet
NZ truck fleet (Sep 18) EROAD dataGross vehicle mass (GVM) GVM_Mean GVM_Median GVM_Mean GVM_Median<5000kg 4,401 4,495 4,395 4,495<7500kg 5,825 5,700 5,869 5,995<10000kg 8,698 8,900 8,370 8,500<12000kg 10,653 10,600 10,622 10,600<15000kg 13,203 13,210 13,055 13,200<20000kg 16,284 16,000 16,282 16,000<25000kg 23,298 24,000 23,610 24,000<30000kg 26,901 26,000 27,179 26,500>=30000kg 32,210 32,000 31,891 31,780
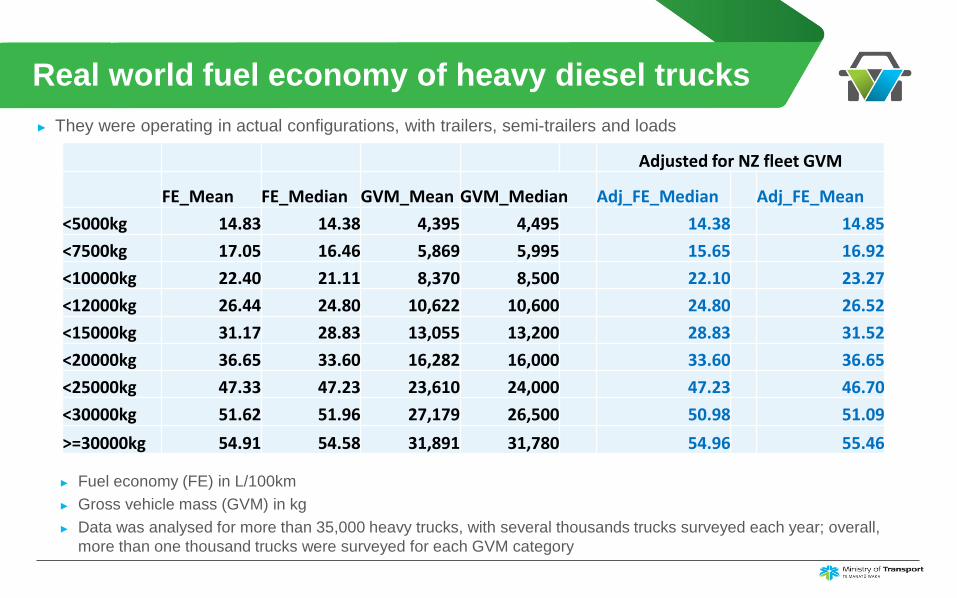
Real world fuel economy of heavy diesel trucks► They were operating in actual configurations, with trailers, semi-trailers and loads
► Fuel economy (FE) in L/100km► Gross vehicle mass (GVM) in kg► Data was analysed for more than 35,000 heavy trucks, with several thousands trucks surveyed each year; overall,
more than one thousand trucks were surveyed for each GVM category
Adjusted for NZ fleet GVM
FE_Mean FE_Median GVM_Mean GVM_Median Adj_FE_Median Adj_FE_Mean<5000kg 14.83 14.38 4,395 4,495 14.38 14.85<7500kg 17.05 16.46 5,869 5,995 15.65 16.92<10000kg 22.40 21.11 8,370 8,500 22.10 23.27<12000kg 26.44 24.80 10,622 10,600 24.80 26.52<15000kg 31.17 28.83 13,055 13,200 28.83 31.52<20000kg 36.65 33.60 16,282 16,000 33.60 36.65<25000kg 47.33 47.23 23,610 24,000 47.23 46.70<30000kg 51.62 51.96 27,179 26,500 50.98 51.09>=30000kg 54.91 54.58 31,891 31,780 54.96 55.46

Good linear relationship between FE (L/100km) and GVM (kg)
► Exception at the top end

Real world FE (L/100km) vs. Year of Manufacture
► Variation in FE is likely caused by GVM changes
► FE seems not to change with YoMfor heavy diesel trucks

Study fuel economy / emission intensity in terms of grams CO2/tonne-km

Load factors are essential – Weight in Motion data
► Seven WiM sites are managed by NZTA
► Load factors can be determined by RUC type (together with tare weight data in Motor Vehicle Register)

Typical RUC types for powered trucks
► Heavy trucks of RUC type 1 grouped into RUC type 2
► Other RUC types are grouped into these types

Average load factors by RUC type (WiM data)
► The average load for RUC type 2 trucks has decreased over time► Average loads of RUC type 19 have been subject to large fluctuations due to the small numbers of these trucks
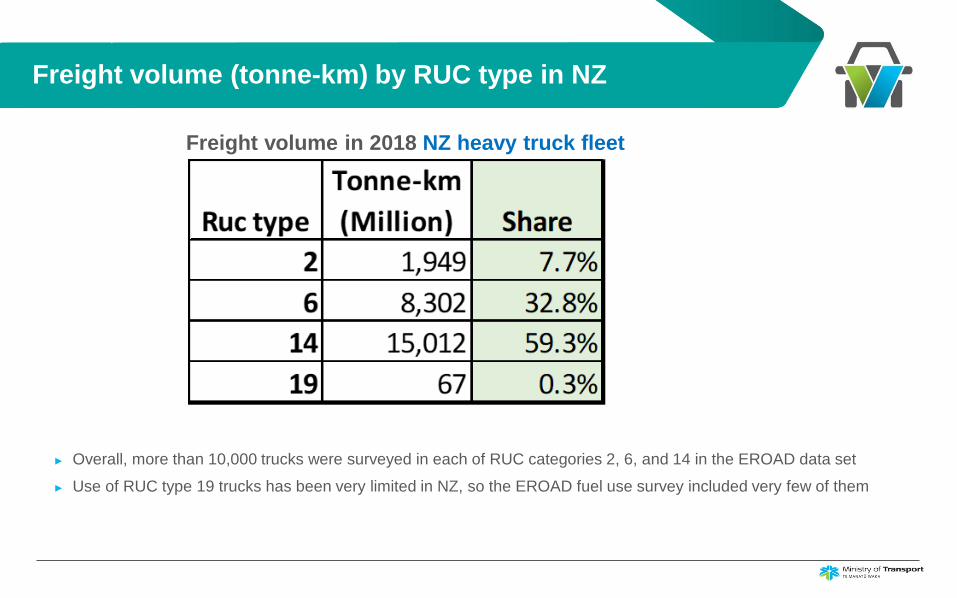
Freight volume (tonne-km) by RUC type in NZ
Freight volume in 2018 NZ heavy truck fleet
► Overall, more than 10,000 trucks were surveyed in each of RUC categories 2, 6, and 14 in the EROAD data set► Use of RUC type 19 trucks has been very limited in NZ, so the EROAD fuel use survey included very few of them

Emission intensity (EI) of heavy diesel trucks► Assume the average load factors in EROAD data are the same as those determined in WiM data for each
RUC type
EI (g CO2/tkm) by RUC type
EI (g CO2/tkm) for all trucksSurvey year EI_Mean EI_Median
2015 188 118
2016 195 120
2017 220 127
2018 236 135
2 6 14Survey year EI_Mean EI_Median EI_Mean EI_Median EI_Mean EI_Median
2015 378 336 114 116 98 992016 413 370 119 121 98 982017 427 384 120 120 99 982018 432 389 119 118 98 97

Urban delivery vs. long haul (g CO2/tkm)
Assumptions:► Urban delivery: RUC type = 2 (including heavy trucks of RUC type 1)► Long haul: RUC type = 6, 14, and 19
Urban delivery Long haul
Survey year EI_Mean EI_Median EI_Mean EI_Median
2015 378 336 106 104
2016 413 370 108 105
2017 427 384 109 106
2018 432 389 108 105

Heavy truck emissions vs. other NZ freight modes
► Coastal shipping figures based on international data for ships comparable to those used in NZ► Rail figures based on data provided by Kiwirail; electric includes indirect emissions
Mode Typical g CO2/tkm
Coastal shipping (oil products) 16
Coastal shipping (other bulk) 30
Coastal shipping (container freight) 46
Rail (electric) 7
Rail (diesel) 29
Rail (NZ average) 28
Long-haul heavy truck 105
Urban delivery heavy truck 390

Summary

Main conclusions
► Heavy trucks contribute about a quarter of GHG emissions from road, despite representing only 6% of vkt
► On average, heavy trucks’ fuel economy in terms of litres/100km has a strong linear relationship with GVM
► It appears heavy trucks’ fuel economy in terms of litres/100km does not change with YoM► This is the first time, CO2 emissions per tonne-km have been studied for NZ’s heavy trucks► For all trucks, the emission intensity could be around 135 g CO2/tkm in 2018► RUC type=2: 390 g CO2/tkm (upper bound); RUC type=6: 120 g CO2/tkm; RUC type=14:
100 g CO2/tkm► The upper bound for urban delivery could be 390 g CO2/tkm (increased over time due to
decreased load); while for long haul the emission intensity could be 105 g CO2/tkm► Compared to road, emission intensity of freight transport by rail and coastal shipping is
significantly lower► Emission saving of shifting long-haul road freight to rail/shipping will vary with commodity
type ► Emissions from urban delivery could be reduced by operation efficiency improvement, EV
and biofuel uptake

Acknowledgement:We appreciate EROAD for providing the fuel use survey data
Contact:Haobo WangPrincipal Analyst, Ministry of [email protected]