Embed Size (px)
Citation preview

for a Low Carbon Future
Flexible Networks
Real TimeThermal RatingSystem - Phase I AssetCondition Assessment
Report No.: 14-2132
July 2014
DNV GL – Report No. 14-2132 – www.dnvgl.com Page i
DNV GL - Energy
KEMA Nederland B.V.
P.O. Box 9035
6800 ET ARNHEM
The Netherlands
Tel: +31 26 356 9111
Registered Arnhem 09080262
Report title: Real Time Thermal Rating System – Phase I Asset
Condition Assessment
Customer: SPEN
Date of issue: 2014-07-14
Project No.: 74105321
Organisation unit: OPE/AM
Report No.: 14-2132
IMPORTANT NOTICE AND DISCLAIMER
This document is protected by copyright and may not be made available to third parties without the express and prior written consent of the DNV GL entity issuing this document (“DNV GL”).
This document is intended for the sole use of the Customer as detailed on the front page of this document to whom the document is addressed and who has entered into a written agreement with the DNV GL. To the extent permitted by law, neither DNV GL nor any group company (the "Group") assumes any responsibility whether in contract, tort including without limitation negligence, or otherwise howsoever, to third parties (being persons other than the Customer), and no company in the Group other than DNV GL shall be liable for any loss or damage whatsoever suffered by virtue of any act, omission or default (whether arising by negligence or otherwise) by DNV GL, the Group or any of its or their servants, subcontractors or agents. This document must be read in its entirety and is subject to any assumptions and qualifications expressed therein as well as in any other relevant communications in connection with it. This document may contain detailed technical data which is intended for use only by persons possessing requisite expertise in its subject matter.
This document has been produced from information relating to dates and periods referred to in this document. This document does not imply that any information is not subject to change. Except and to the extent that checking or verification of information or data is expressly agreed within the written scope of its services, DNV GL shall not be responsible in any way in connection with erroneous information or data provided to it by the Customer or any third party, or for the effects of any such erroneous information or data whether or not contained or referred to in this document.
Reference to part of this report which may lead to misinterpretation is not permissible.
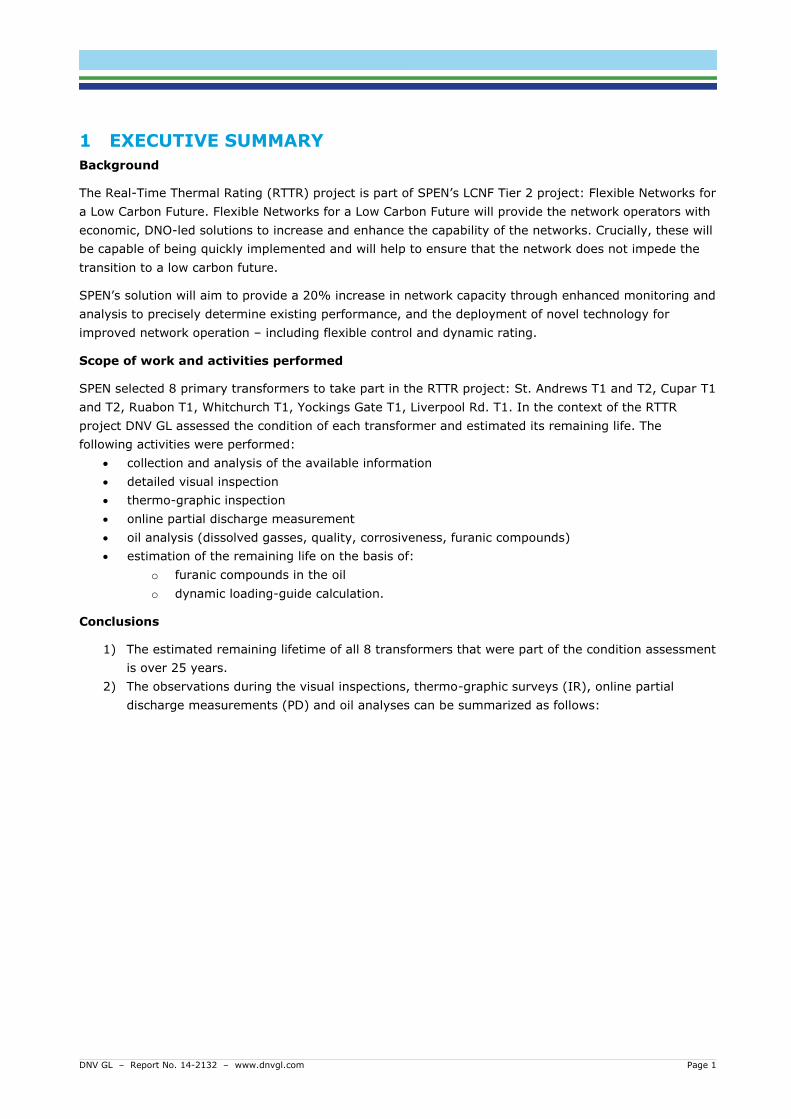
Rev. No. Date Reason for Issue Prepared by Verified by Approved by
0 2014-07-14 First issue M.W. Louwerse S. Meijer J.M. Wetzer
DNV GL – Report No. 14-2132 – www.dnvgl.com Page ii
Table of contents
1 EXECUTIVE SUMMARY ..................................................................................................... 1
2 INTRODUCTION .............................................................................................................. 4
2.1 Background 4
2.2 Scope of work and activities performed 4
2.3 Outline 4
3 TECHNIQUES, EQUIPMENT AND METHODOLOGIES .............................................................. 5
3.1 Data collection 5
3.2 Visual inspections 5
3.3 Partial discharge measurements 5
3.4 Thermal imaging 10
3.5 Oil analyses 10
3.6 Remaining lifetime assessment 10
4 RESULTS ASSET CONDITION ASSESSMENT ..................................................................... 15
4.1 Whitchurch 15
4.2 Liverpool Road 23
4.3 Yockings Gate 30
4.4 Ruabon 39
4.5 St. Andrews – Transformer 1 49
4.6 St. Andrews – Transformer 2 58
4.7 Cupar – Transformer 1 68
4.8 Cupar – Transformer 2 77
4.9 Summary 86
5 CONCLUSIONS/RECOMMENDATIONS .............................................................................. 88
5.1 Conclusions 88
5.2 Recommendations 89
DNV GL – Report No. 14-2132 – www.dnvgl.com Page 1
1 EXECUTIVE SUMMARY
Background
The Real-Time Thermal Rating (RTTR) project is part of SPEN’s LCNF Tier 2 project: Flexible Networks for
a Low Carbon Future. Flexible Networks for a Low Carbon Future will provide the network operators with
economic, DNO-led solutions to increase and enhance the capability of the networks. Crucially, these will
be capable of being quickly implemented and will help to ensure that the network does not impede the
transition to a low carbon future.
SPEN’s solution will aim to provide a 20% increase in network capacity through enhanced monitoring and
analysis to precisely determine existing performance, and the deployment of novel technology for
improved network operation – including flexible control and dynamic rating.
Scope of work and activities performed
SPEN selected 8 primary transformers to take part in the RTTR project: St. Andrews T1 and T2, Cupar T1
and T2, Ruabon T1, Whitchurch T1, Yockings Gate T1, Liverpool Rd. T1. In the context of the RTTR
project DNV GL assessed the condition of each transformer and estimated its remaining life. The
following activities were performed:
collection and analysis of the available information
detailed visual inspection
thermo-graphic inspection
online partial discharge measurement
oil analysis (dissolved gasses, quality, corrosiveness, furanic compounds)
estimation of the remaining life on the basis of:
o furanic compounds in the oil
o dynamic loading-guide calculation.
Conclusions
1) The estimated remaining lifetime of all 8 transformers that were part of the condition assessment
is over 25 years.
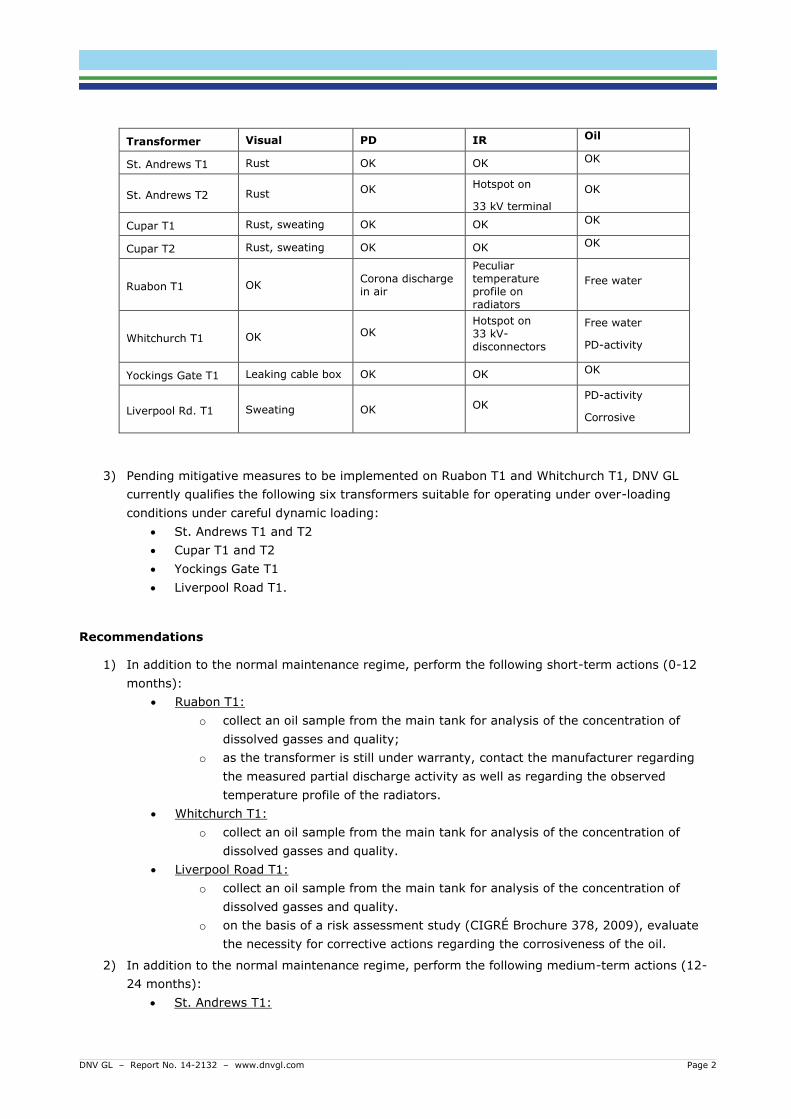
2) The observations during the visual inspections, thermo-graphic surveys (IR), online partial
discharge measurements (PD) and oil analyses can be summarized as follows:
DNV GL – Report No. 14-2132 – www.dnvgl.com Page 2
Transformer Visual PD IR Oil
St. Andrews T1 Rust OK OK OK
St. Andrews T2 Rust OK Hotspot on
33 kV terminal
OK
Cupar T1 Rust, sweating OK OK OK
Cupar T2 Rust, sweating OK OK OK
Ruabon T1 OK Corona discharge in air
Peculiar temperature profile on radiators
Free water
Whitchurch T1 OK OK Hotspot on 33 kV-disconnectors
Free water
PD-activity
Yockings Gate T1 Leaking cable box OK OK OK
Liverpool Rd. T1 Sweating OK OK PD-activity
Corrosive
3) Pending mitigative measures to be implemented on Ruabon T1 and Whitchurch T1, DNV GL
currently qualifies the following six transformers suitable for operating under over-loading
conditions under careful dynamic loading:
St. Andrews T1 and T2
Cupar T1 and T2
Yockings Gate T1
Liverpool Road T1.
Recommendations
1) In addition to the normal maintenance regime, perform the following short-term actions (0-12
months):
Ruabon T1:
o collect an oil sample from the main tank for analysis of the concentration of
dissolved gasses and quality;
o as the transformer is still under warranty, contact the manufacturer regarding
the measured partial discharge activity as well as regarding the observed
temperature profile of the radiators.
Whitchurch T1:
o collect an oil sample from the main tank for analysis of the concentration of
dissolved gasses and quality.
Liverpool Road T1:
o collect an oil sample from the main tank for analysis of the concentration of
dissolved gasses and quality.
o on the basis of a risk assessment study (CIGRÉ Brochure 378, 2009), evaluate
the necessity for corrective actions regarding the corrosiveness of the oil.
2) In addition to the normal maintenance regime, perform the following medium-term actions (12-
24 months):
St. Andrews T1:
DNV GL – Report No. 14-2132 – www.dnvgl.com Page 3
o define and implement actions to correct/mitigate the observed rust.
St. Andrews T2:
o define and implement actions to correct/mitigate the observed rust;
o define and implement actions to correct the observed hot-spot on a 33 kV-
terminal.
Cupar T1, Cupar T2:
o define and implement actions to correct/mitigate the observed rust.
Whitchurch:
o define and implement actions to correct the observed hot-spots on 33 kV-
disconnectors.
Yockings Gate T1:
o define and implement actions to correct the observed mass-leakage from the 33
kV-cable box.
3) In addition to the normal maintenance regime, perform the following long-term actions (24-60
months):
Cupar T1, Cupar T2 and Yockings Gate T1:
o define and implement actions to correct/mitigate the observed sweating.
DNV GL – Report No. 14-2132 – www.dnvgl.com Page 4
2 INTRODUCTION
2.1 Background
The Real-Time Thermal Rating (RTTR) project is part of SPEN’s LCNF Tier 2 project: Flexible Networks for
a Low Carbon Future. Flexible Networks for a Low Carbon Future will provide the network operators with
economic, DNO-led solutions to increase and enhance the capability of the networks. Crucially, these will
be capable of being quickly implemented and will help to ensure that the network does not impede the
transition to a low carbon future.
SPEN’s solution will aim to provide a 20% increase in network capacity through enhanced monitoring and
analysis to precisely determine existing performance, and the deployment of novel technology for
improved network operation – including flexible control and dynamic rating.
2.2 Scope of work and activities performed
This report describes the condition assessment of 8 primary transformers and any assets directly
involved with a potential transformer real-time thermal rating (RTTR) system. The following 8 primary
transformers were selected by SPEN to be part of the project:
St. Andrews T1 and T2
Cupar T1 and T2
Ruabon T1
Whitchurch T1
Yockings Gate T1
Liverpool Road T1.
In the context of the RTTR project DNV GL assessed the condition of each transformer and estimated its
remaining life. The following activities were performed:
collection and analysis of the available information
detailed visual inspection
thermo-graphic inspection
online partial discharge measurement
oil analysis (dissolved gasses, quality, corrosiveness, furanic compounds)
estimation of the remaining life on the basis of:
o furanic compounds in the oil
o dynamic loading-guide calculation.
2.3 Outline
Chapter 2 describes the used techniques, equipment and methodologies used for the condition
assessments. Chapter 3 presents the results of the site visit, the laboratory analyses and the condition
assessments for the eight transformers. Finally, in chapter 4 the conclusions are drawn and
recommendations are given.
DNV GL – Report No. 14-2132 – www.dnvgl.com Page 5
3 TECHNIQUES, EQUIPMENT AND METHODOLOGIES
DNV GL has developed its own methodology to assess the condition and estimate the remaining lifetime
of medium and high voltage equipment. This methodology is partly based on proprietary tools and
methods and partly confirmative to (international) recognized standards and industry's best practices.
Our methodology comprises the following steps:
1) Data collection
2) Testing and analysis
3) Estimation of remaining life time
4) Interpretation of results
5) Merging and summarization of results
3.1 Data collection
As a first step, DNV GL requests information regarding the component under study. This information
includes, but is not limited to the following:
name plate data
all available test reports (e.g. factory acceptance test, site acceptance tests, )
maintenance and inspection data
historical and/or representative loading data
historical results of oil analysis
failure and repair reports (if applicable).
3.2 Visual inspections
DNV GL engineers visually inspected the 8 transformers that were selected by Scottish Power.
The inspections were carried out according to a checklist containing the following aspects:
name plate data
ambient condition
vegetation around the transformer bay
coating / corrosion and deformation.
breather and silica gel
condition of bushings
oil leakage, gaskets
fans/cooling.
DNV GL analyzed the results of the inspections and made recommendations for maintenance purposes.
The results of the inspection are provided in chapter 3.
3.3 Partial discharge measurements
A partial discharge (PD) is a local breakdown of a dielectric when being stressed with a voltage. In
contrast to a full breakdown, a partial discharge only partially bridges the insulation medium.
Dielectric weaknesses are caused by irregularities in the isolation material, like inclusions, voids, cracks,
moisture, floating particles, tip on a potential, cavity, contact noise etcetera. These weaknesses may
cause breakdowns in time. Often, a breakdown will be preceded by partial discharges.
DNV GL – Report No. 14-2132 – www.dnvgl.com Page 6
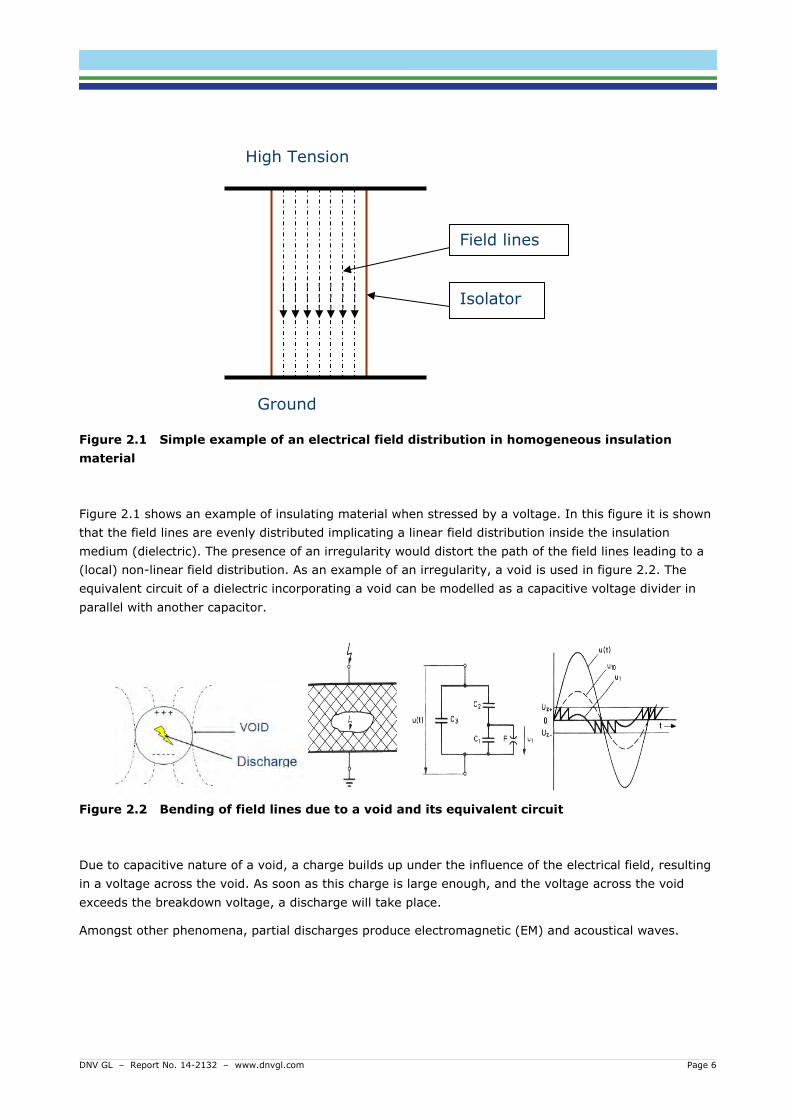
Figure 2.1 Simple example of an electrical field distribution in homogeneous insulation
material
Figure 2.1 shows an example of insulating material when stressed by a voltage. In this figure it is shown
that the field lines are evenly distributed implicating a linear field distribution inside the insulation
medium (dielectric). The presence of an irregularity would distort the path of the field lines leading to a
(local) non-linear field distribution. As an example of an irregularity, a void is used in figure 2.2. The
equivalent circuit of a dielectric incorporating a void can be modelled as a capacitive voltage divider in
parallel with another capacitor.
Figure 2.2 Bending of field lines due to a void and its equivalent circuit
Due to capacitive nature of a void, a charge builds up under the influence of the electrical field, resulting
in a voltage across the void. As soon as this charge is large enough, and the voltage across the void
exceeds the breakdown voltage, a discharge will take place.
Amongst other phenomena, partial discharges produce electromagnetic (EM) and acoustical waves.
High Tension
Ground
Field lines
Isolator
DNV GL – Report No. 14-2132 – www.dnvgl.com Page 7
3.3.1 UHF-methodology
The DNV GL-PD-MS system is a tool to detect partial discharges (PD) in HV equipment, such as circuit
breakers, GIS, insulators and (oil-filled) power transformers. It can provide phase-resolved discharge
patterns (PRPD) and time resolved discharge patterns (TRPD) from which the dielectric integrity of the
insulation of the HV equipment can be assessed.
One of the detection methods used by the DNV GL-PD system is based on the propagation of
electromagnetic waves. The technique used to detect the EM-waves emitted by partial discharges
comprises a broadband antenna and a spectrum analyzer.
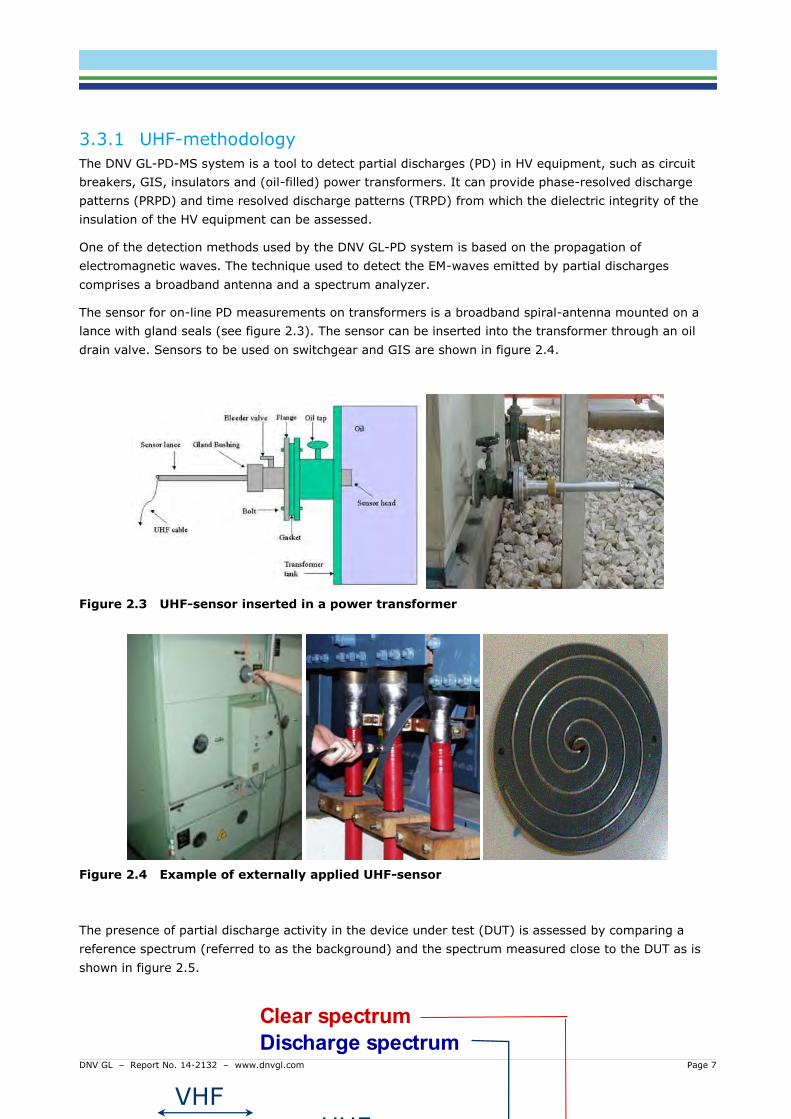
The sensor for on-line PD measurements on transformers is a broadband spiral-antenna mounted on a
lance with gland seals (see figure 2.3). The sensor can be inserted into the transformer through an oil
drain valve. Sensors to be used on switchgear and GIS are shown in figure 2.4.
Figure 2.3 UHF-sensor inserted in a power transformer
Figure 2.4 Example of externally applied UHF-sensor
The presence of partial discharge activity in the device under test (DUT) is assessed by comparing a
reference spectrum (referred to as the background) and the spectrum measured close to the DUT as is
shown in figure 2.5.
Clear spectrum
Discharge spectrum
UHF
VHF
DNV GL – Report No. 14-2132 – www.dnvgl.com Page 8
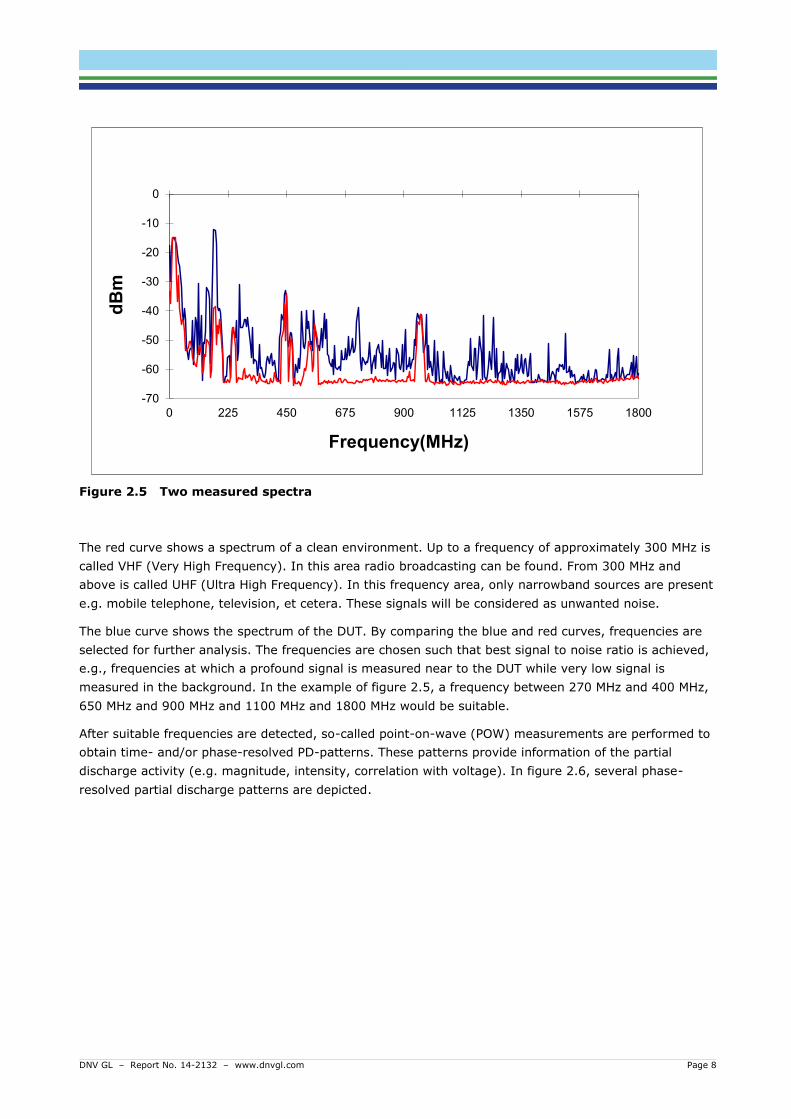
Figure 2.5 Two measured spectra
The red curve shows a spectrum of a clean environment. Up to a frequency of approximately 300 MHz is
called VHF (Very High Frequency). In this area radio broadcasting can be found. From 300 MHz and
above is called UHF (Ultra High Frequency). In this frequency area, only narrowband sources are present
e.g. mobile telephone, television, et cetera. These signals will be considered as unwanted noise.
The blue curve shows the spectrum of the DUT. By comparing the blue and red curves, frequencies are
selected for further analysis. The frequencies are chosen such that best signal to noise ratio is achieved,
e.g., frequencies at which a profound signal is measured near to the DUT while very low signal is
measured in the background. In the example of figure 2.5, a frequency between 270 MHz and 400 MHz,
650 MHz and 900 MHz and 1100 MHz and 1800 MHz would be suitable.
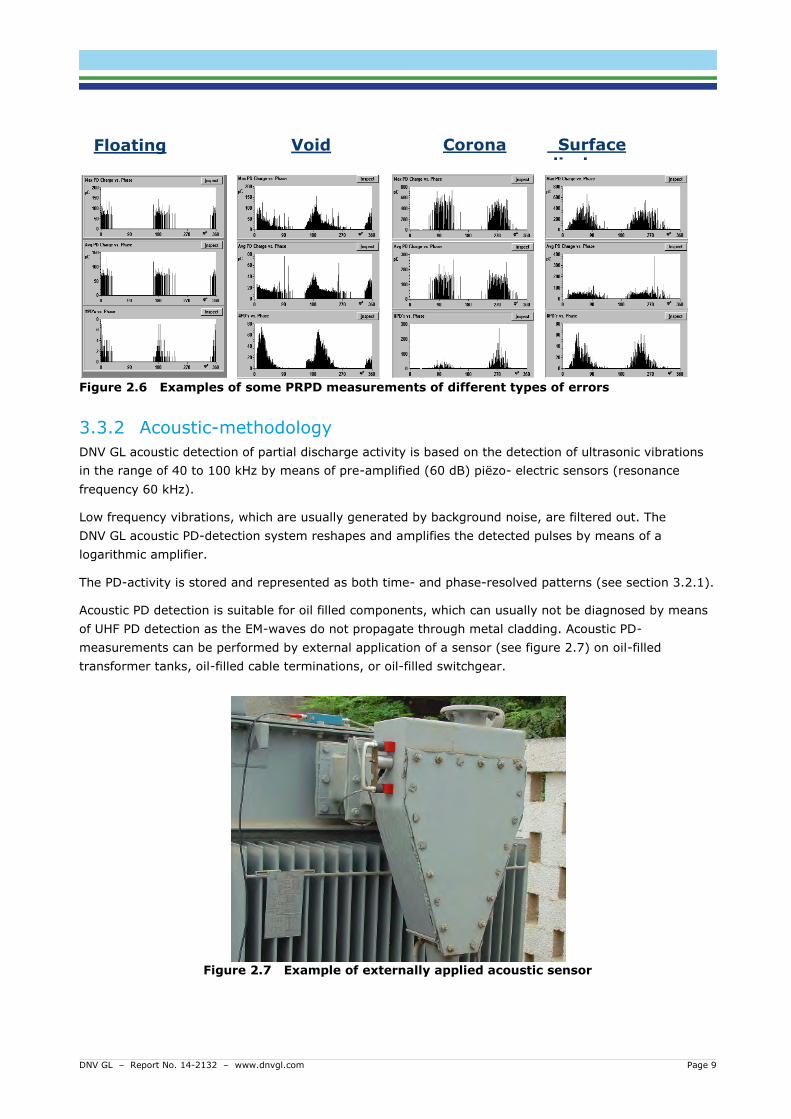
After suitable frequencies are detected, so-called point-on-wave (POW) measurements are performed to
obtain time- and/or phase-resolved PD-patterns. These patterns provide information of the partial
discharge activity (e.g. magnitude, intensity, correlation with voltage). In figure 2.6, several phase-
resolved partial discharge patterns are depicted.
-70
-60
-50
-40
-30
-20
-10
0
0 225 450 675 900 1125 1350 1575 1800
dB
m
Frequency(MHz)
DNV GL – Report No. 14-2132 – www.dnvgl.com Page 9
Figure 2.6 Examples of some PRPD measurements of different types of errors
3.3.2 Acoustic-methodology
DNV GL acoustic detection of partial discharge activity is based on the detection of ultrasonic vibrations
in the range of 40 to 100 kHz by means of pre-amplified (60 dB) piëzo- electric sensors (resonance
frequency 60 kHz).
Low frequency vibrations, which are usually generated by background noise, are filtered out. The
DNV GL acoustic PD-detection system reshapes and amplifies the detected pulses by means of a
logarithmic amplifier.
The PD-activity is stored and represented as both time- and phase-resolved patterns (see section 3.2.1).
Acoustic PD detection is suitable for oil filled components, which can usually not be diagnosed by means
of UHF PD detection as the EM-waves do not propagate through metal cladding. Acoustic PD-
measurements can be performed by external application of a sensor (see figure 2.7) on oil-filled
transformer tanks, oil-filled cable terminations, or oil-filled switchgear.
Figure 2.7 Example of externally applied acoustic sensor
Floating
potential
Void Surface discharge
Corona
DNV GL – Report No. 14-2132 – www.dnvgl.com Page 10
3.4 Thermal imaging
Thermal imaging uses infrared (IR) radiation to determine the associated temperature. Unlike X-ray
technology which allows one to look inside of equipment, this method is primarily sensitive to heat that
is radiated by the surface of the device under test. Hence, it may not provide conclusive proof about
internal thermal faults deep(er) down. Thermal imaging is most effective in detecting thermal faults
associated with loose or poorly fastened bolts, overheating of structural parts due to circulating currents
or bad contacts inside bushings.
The determination of anomalies is based on the relative temperature difference across the surface of the
device under test. For visual purposes, the hottest and coldest points are marked in contrasting colors
and all temperatures in between are graded by color, thus providing a graphic display of the heat
contours along the surface of the equipment.
3.5 Oil analyses
Oil samples of all 8 transformers (main tank – bottom) were taken by SPEN and subsequently analyzed
by DNV GL in her oil laboratory in Arnhem, The Netherlands.
The following analyses are performed:
dissolved gasses
furanic compounds
corrosive properties
DBPC-content
corrosive properties
DBDS-content
breakdown voltage
color and appearance
specific insulation resistance and power factor of insulation (tan(δ))
contaminants
acidity.
3.6 Remaining lifetime assessment
The remaining lifetime was assessed by two different methods:
1) Furanic compounds;
2) Dynamic loading guide calculations.
3.6.1 Method 1: Furanic compounds
Considering different ageing mechanisms, problems with the oil can often be solved by treatment or
replacement of the oil. Thermal and dielectrical problems can often be solved by repair. However the
aging of the insulating paper of a transformer is an irreversible process which results in the end of life of
a transformer.
In practice, the end of the technical life of a transformer will be reached when the degree of
polymerization (DP) of the insulating paper of the windings reaches a value lower than 250. New
insulating paper has a DP value of approximately 1200.
DNV GL – Report No. 14-2132 – www.dnvgl.com Page 11
The approach that DNV GL uses is to estimate the DP value of the insulating paper of the windings at a
certain moment using the gas-in-oil analysis (DGA) and the determination of the 2-furfural concentration
in the oil. This DP value has a certain inaccuracy (standard deviation, s.d.). With this estimated DP value,
the remaining lifetime will be calculated based on a model that gives the decrease of the DP value as a
function of time. A Monte Carlo simulation is used to incorporate uncertainties. The result is a failure rate
as a function of the remaining life under the assumption that the average loading of the transformer will
not change. It is up to the owner of the transformer to decide which failure rate is acceptable; mostly 5%
or 10% is used.
Changing the load will result in a different outcome of the remaining life estimation. Decreasing or
increasing the load will decrease or increase the hot-spot temperature and therefore affect the speed in
which the paper will degrade and the DP value will reach a value of 250 or lower.
The consequence of reaching the DP value of 250 or lower will not be an immanent failure but the
chance of a failure due to an extraneous event (e.g. transportation, a short circuit behind the
transformer or switching on and off the current) will be unacceptable high.
For old transformers with insulating paper in the core, the ageing of this paper also contributes to the 2-
furfural content of the oil. The confidential limits of the model are partly determined by this phenomenon.
DNV GL has determined a correlation between the DP value and the 2-furfural concentration, DP[fur].
DNV GL also determined a correlation between the DP value and the product of the 2-furfural
concentration and the CO concentration, DP([fur]*[CO]). The first relation is especially for 2-furfural
concentrations lower than 2 mg/kg. The second relation gives in general a better result for 2 furfural
concentrations higher than 2 mg/kg.
For DGA as well as for the furfural analysis it is important to know what happened to the oil. Treatment
of the oil to improve the thermal and/or the electrical properties often remove species which are used for
the DGA as well as for the furfural analysis. The concentrations of most of the gases used for DGA
decrease by oil treatment or oil replacement and increase again by production of these gases by thermal
and electrical processes in the oil. The concentration of the 2-furfural however shows a different
behaviour. The 2-furfural is produced in the paper and a part of the produced 2-furfural will move to the
oil. There will be an equilibrium in which the concentration of 2-furfural of the paper is much higher than
the concentration of 2-furfural in the oil. This is rather analogous to the behaviour of water where also
the concentration of water in paper is much higher than the concentration of water in the oil. After a
treatment or replacement of the oil only the relatively small amount of 2-furfural in the oil has been
removed. Within a few years there will be a new equilibrium and the concentration of 2-furfural in the oil
will be almost the concentration just before the oil treatment or replacement increased by the
concentration which has been produced in the meantime.
So by applying this analysis the history of the transformer with respect to the oil always has to be kept
in mind.
The 2-furfural concentration in the oil of some transformers was lower than the minimum detectable
concentration of 0.1 mg/kg. To assess the DP-values, and from that the remaining life, a concentration
of 0.1 mg/kg is used (worst case scenario). For these 2-furfural concentrations the DP-value is assessed
to be around 550. This means that these transformers have used only a small part of their technical life
time.
DNV GL – Report No. 14-2132 – www.dnvgl.com Page 12
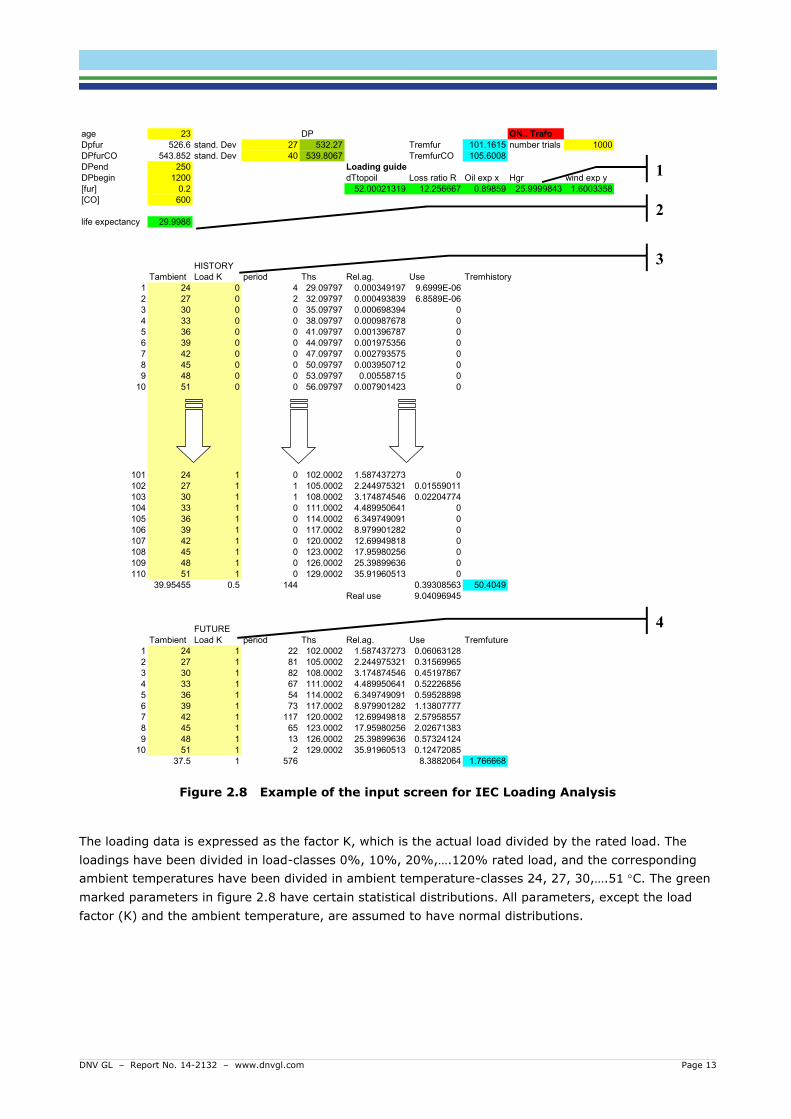
3.6.2 Method 2: dynamic loading guide calculations
The loading guide analysis is a KEMA software tool that uses algorithms stipulated by IEC 60076-7
ageing principles. The input parameters are statistically distributed according to pre-specified
distributions. The output is the estimated failure rate as a function of the remaining lifetime, and is
calculated by means of a Monte Carlo simulation (all values of the distributions of the input parameters
are calculated so that a distribution of the output values is obtained). Figure 2.8 shows the input screen
that is used for this analysis. For the analysis the following data is used, as indicated in figure 2.8:
1. Loading guide parameters:
a. d(top oil): This is the top-oil temperature rise at rated load
b. Loss ratio R: ratio between the load losses and the no-load losses
c. H*gr: difference between hot spot temperature and top oil temperature
d. oil exponent x, winding exponent y: parameters that account for the heat dissipation and
distribution within the oil and windings of the transformer, depending on the type of
cooling applied
2. Life expectancy for large power transformers. This is a value derived from manufacturer
recommended values and / or database information
3. Historical loading and ambient temperatures
4. Future expected loading and ambient temperatures.
DNV GL – Report No. 14-2132 – www.dnvgl.com Page 13
Figure 2.8 Example of the input screen for IEC Loading Analysis
The loading data is expressed as the factor K, which is the actual load divided by the rated load. The
loadings have been divided in load-classes 0%, 10%, 20%,….120% rated load, and the corresponding
ambient temperatures have been divided in ambient temperature-classes 24, 27, 30,….51 C. The green
marked parameters in figure 2.8 have certain statistical distributions. All parameters, except the load
factor (K) and the ambient temperature, are assumed to have normal distributions.
1
3
2
4
age 23 DP ON.. Trafo
Dpfur 526.6 stand. Dev 27 532.27 Tremfur 101.1615 number trials 1000
DPfurCO 543.852 stand. Dev 40 539.8067 TremfurCO 105.6008
DPend 250 Loading guide
DPbegin 1200 dTtopoil Loss ratio R Oil exp x Hgr wind exp y
[fur] 0.2 52.00021319 12.256667 0.89859 25.9999843 1.6003358
[CO] 600
life expectancy 29.9988
HISTORY
Tambient Load K period Ths Rel.ag. Use Tremhistory
1 24 0 4 29.09797 0.000349197 9.6999E-06
2 27 0 2 32.09797 0.000493839 6.8589E-06
3 30 0 0 35.09797 0.000698394 0
4 33 0 0 38.09797 0.000987678 0
5 36 0 0 41.09797 0.001396787 0
6 39 0 0 44.09797 0.001975356 0
7 42 0 0 47.09797 0.002793575 0
8 45 0 0 50.09797 0.003950712 0
9 48 0 0 53.09797 0.00558715 0
10 51 0 0 56.09797 0.007901423 0
101 24 1 0 102.0002 1.587437273 0
102 27 1 1 105.0002 2.244975321 0.01559011
103 30 1 1 108.0002 3.174874546 0.02204774
104 33 1 0 111.0002 4.489950641 0
105 36 1 0 114.0002 6.349749091 0
106 39 1 0 117.0002 8.979901282 0
107 42 1 0 120.0002 12.69949818 0
108 45 1 0 123.0002 17.95980256 0
109 48 1 0 126.0002 25.39899636 0
110 51 1 0 129.0002 35.91960513 0
39.95455 0.5 144 0.39308563 50.4049
Real use 9.04096945
FUTURE
Tambient Load K period Ths Rel.ag. Use Tremfuture
1 24 1 22 102.0002 1.587437273 0.06063128
2 27 1 81 105.0002 2.244975321 0.31569965
3 30 1 82 108.0002 3.174874546 0.45197867
4 33 1 67 111.0002 4.489950641 0.52226856
5 36 1 54 114.0002 6.349749091 0.59528898
6 39 1 73 117.0002 8.979901282 1.13807777
7 42 1 117 120.0002 12.69949818 2.57958557
8 45 1 65 123.0002 17.95980256 2.02671383
9 48 1 13 126.0002 25.39899636 0.57324124
10 51 1 2 129.0002 35.91960513 0.12472085
37.5 1 576 8.3882064 1.766668
DNV GL – Report No. 14-2132 – www.dnvgl.com Page 14
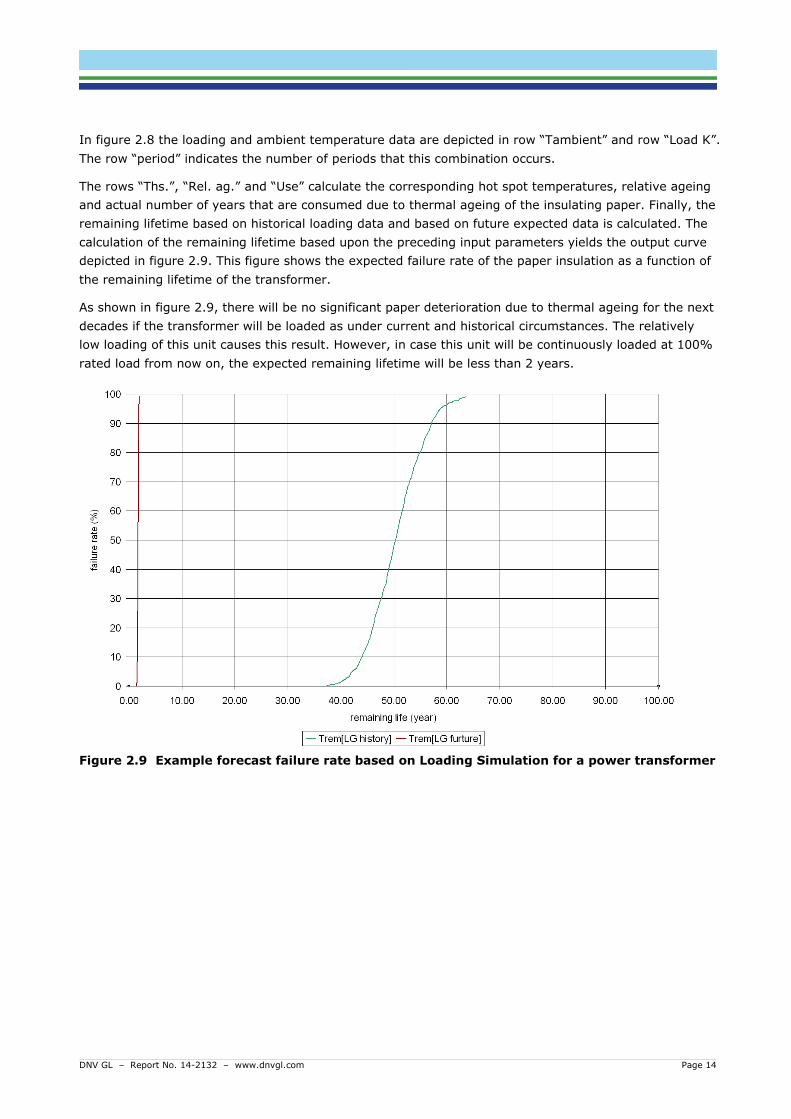
In figure 2.8 the loading and ambient temperature data are depicted in row “Tambient” and row “Load K”.
The row “period” indicates the number of periods that this combination occurs.
The rows “Ths.”, “Rel. ag.” and “Use” calculate the corresponding hot spot temperatures, relative ageing
and actual number of years that are consumed due to thermal ageing of the insulating paper. Finally, the
remaining lifetime based on historical loading data and based on future expected data is calculated. The
calculation of the remaining lifetime based upon the preceding input parameters yields the output curve
depicted in figure 2.9. This figure shows the expected failure rate of the paper insulation as a function of
the remaining lifetime of the transformer.
As shown in figure 2.9, there will be no significant paper deterioration due to thermal ageing for the next
decades if the transformer will be loaded as under current and historical circumstances. The relatively
low loading of this unit causes this result. However, in case this unit will be continuously loaded at 100%
rated load from now on, the expected remaining lifetime will be less than 2 years.
Figure 2.9 Example forecast failure rate based on Loading Simulation for a power transformer
DNV GL – Report No. 14-2132 – www.dnvgl.com Page 15
4 RESULTS ASSET CONDITION ASSESSMENT
4.1 Whitchurch
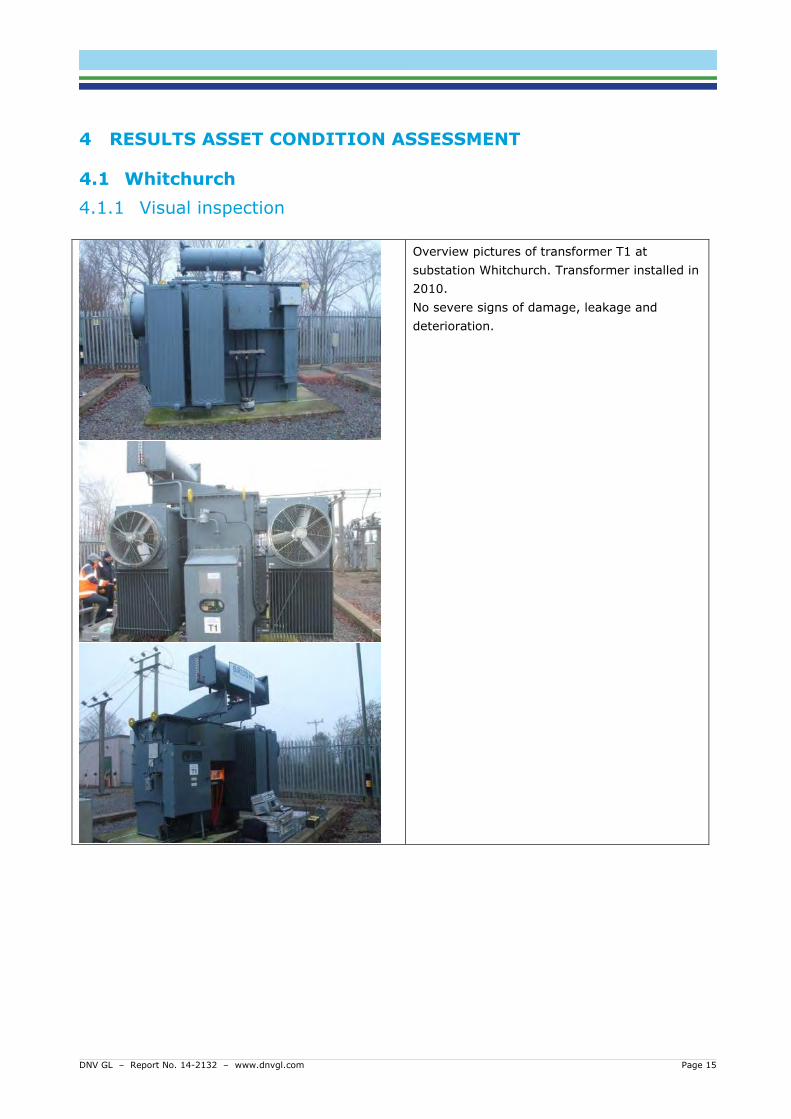
4.1.1 Visual inspection
Overview pictures of transformer T1 at
substation Whitchurch. Transformer installed in
2010.
No severe signs of damage, leakage and
deterioration.
DNV GL – Report No. 14-2132 – www.dnvgl.com Page 16
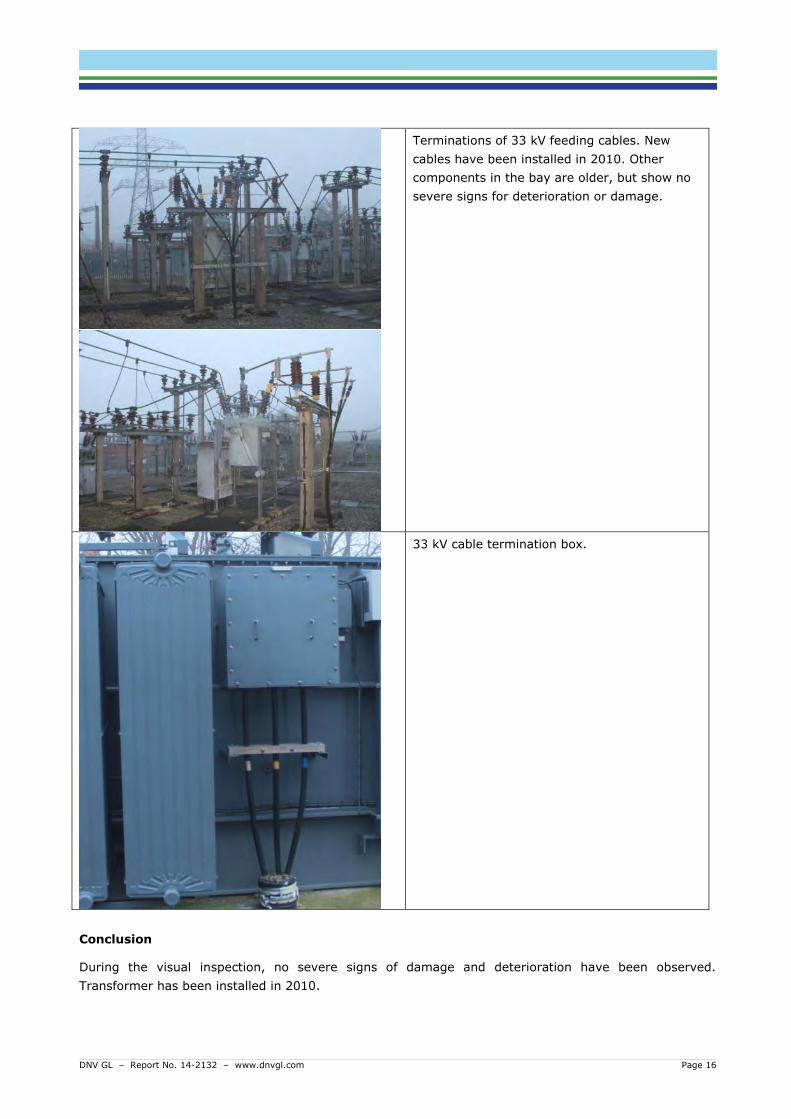
Terminations of 33 kV feeding cables. New
cables have been installed in 2010. Other
components in the bay are older, but show no
severe signs for deterioration or damage.
33 kV cable termination box.
Conclusion
During the visual inspection, no severe signs of damage and deterioration have been observed.
Transformer has been installed in 2010.
DNV GL – Report No. 14-2132 – www.dnvgl.com Page 17
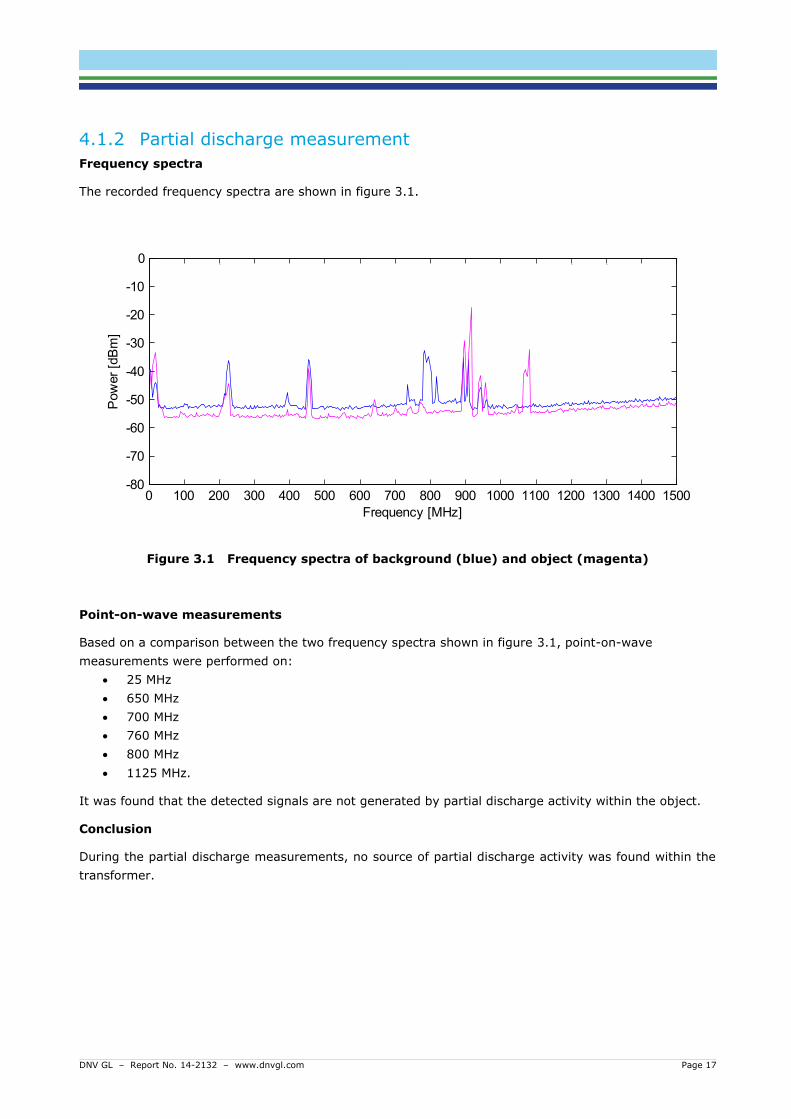
4.1.2 Partial discharge measurement
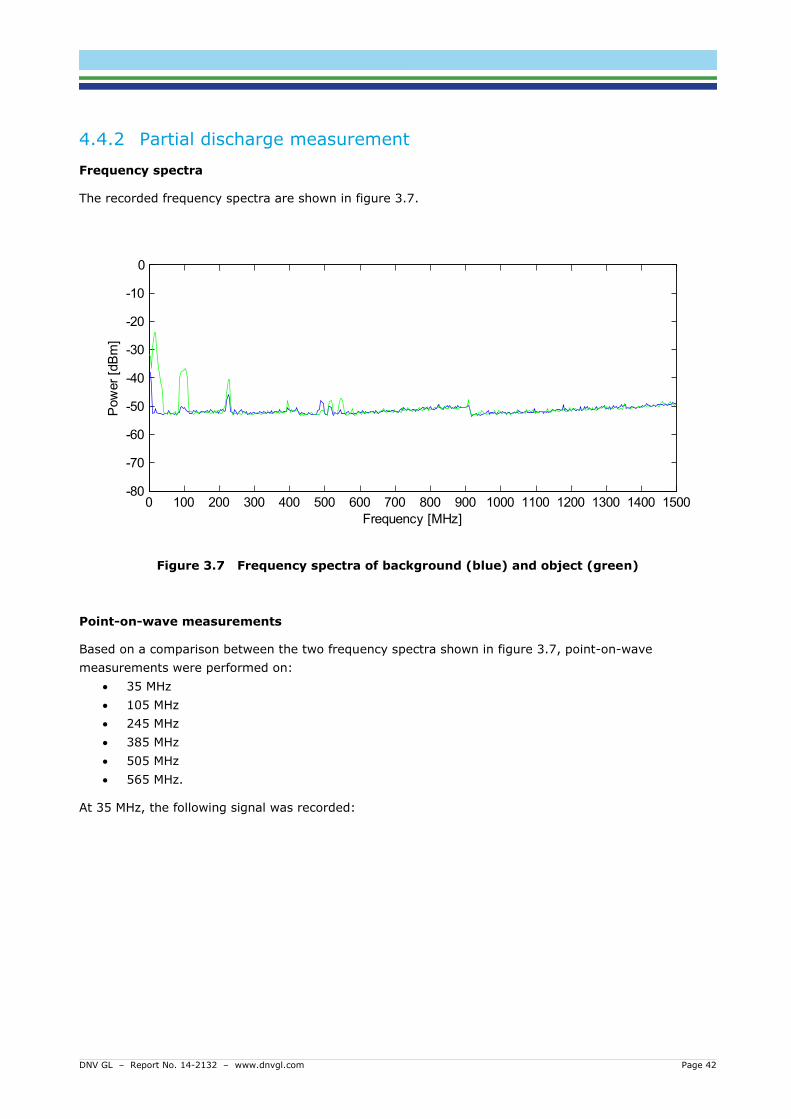
Frequency spectra
The recorded frequency spectra are shown in figure 3.1.
Figure 3.1 Frequency spectra of background (blue) and object (magenta)
Point-on-wave measurements
Based on a comparison between the two frequency spectra shown in figure 3.1, point-on-wave
measurements were performed on:
25 MHz
650 MHz
700 MHz
760 MHz
800 MHz
1125 MHz.
It was found that the detected signals are not generated by partial discharge activity within the object.
Conclusion
During the partial discharge measurements, no source of partial discharge activity was found within the
transformer.
0 100 200 300 400 500 600 700 800 900 1000 1100 1200 1300 1400 1500-80
-70
-60
-50
-40
-30
-20
-10
0
Pow
er
[dB
m]
Frequency [MHz]
DNV GL – Report No. 14-2132 – www.dnvgl.com Page 18
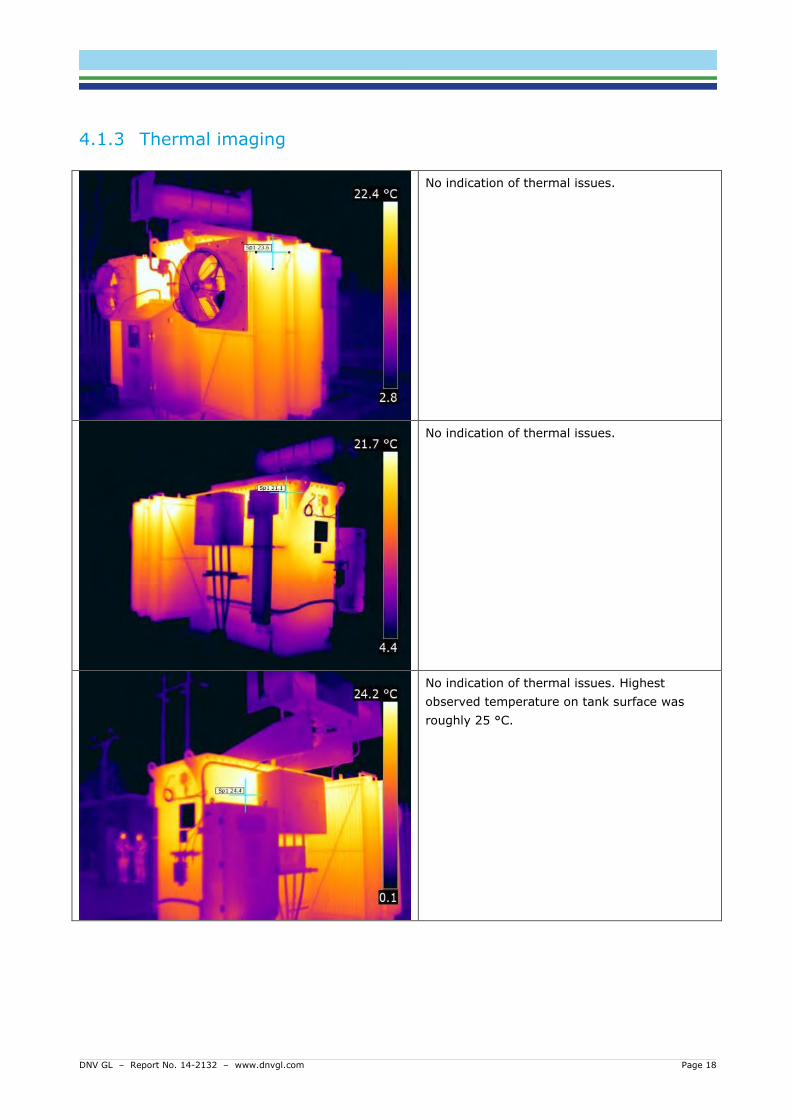
4.1.3 Thermal imaging
No indication of thermal issues.
No indication of thermal issues.
No indication of thermal issues. Highest
observed temperature on tank surface was
roughly 25 °C.
DNV GL – Report No. 14-2132 – www.dnvgl.com Page 19
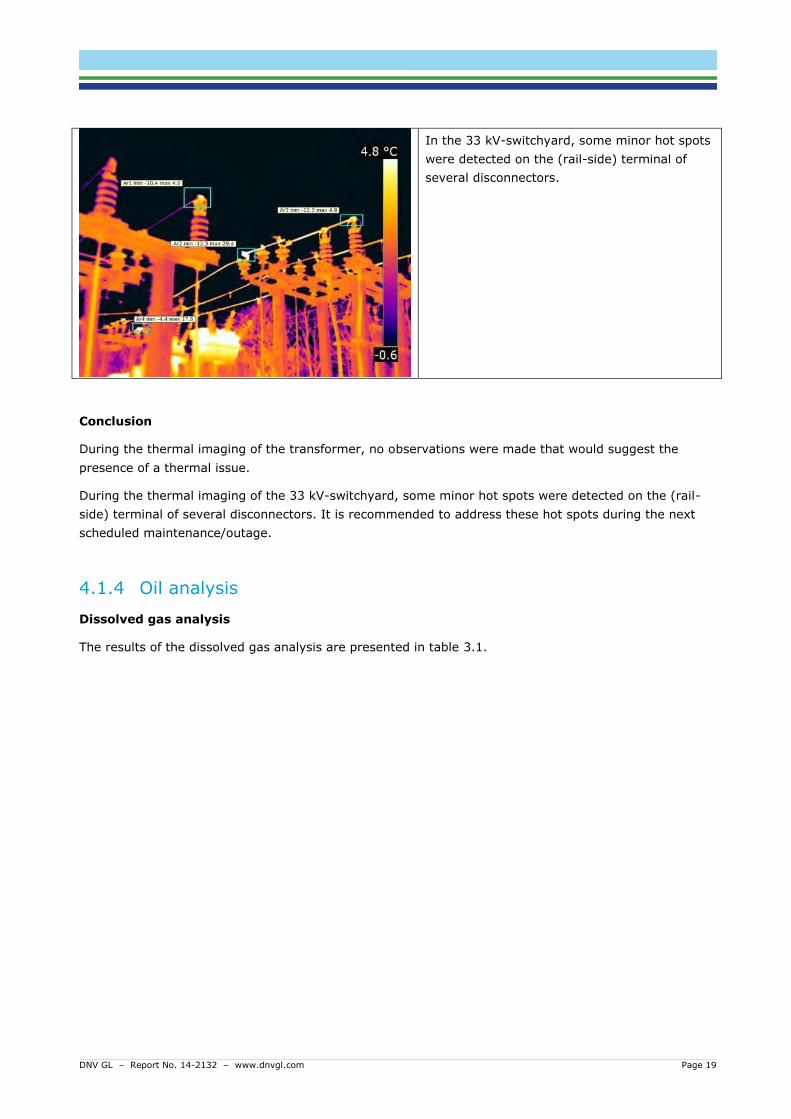
In the 33 kV-switchyard, some minor hot spots
were detected on the (rail-side) terminal of
several disconnectors.
Conclusion
During the thermal imaging of the transformer, no observations were made that would suggest the
presence of a thermal issue.
During the thermal imaging of the 33 kV-switchyard, some minor hot spots were detected on the (rail-
side) terminal of several disconnectors. It is recommended to address these hot spots during the next
scheduled maintenance/outage.
4.1.4 Oil analysis
Dissolved gas analysis
The results of the dissolved gas analysis are presented in table 3.1.
DNV GL – Report No. 14-2132 – www.dnvgl.com Page 20
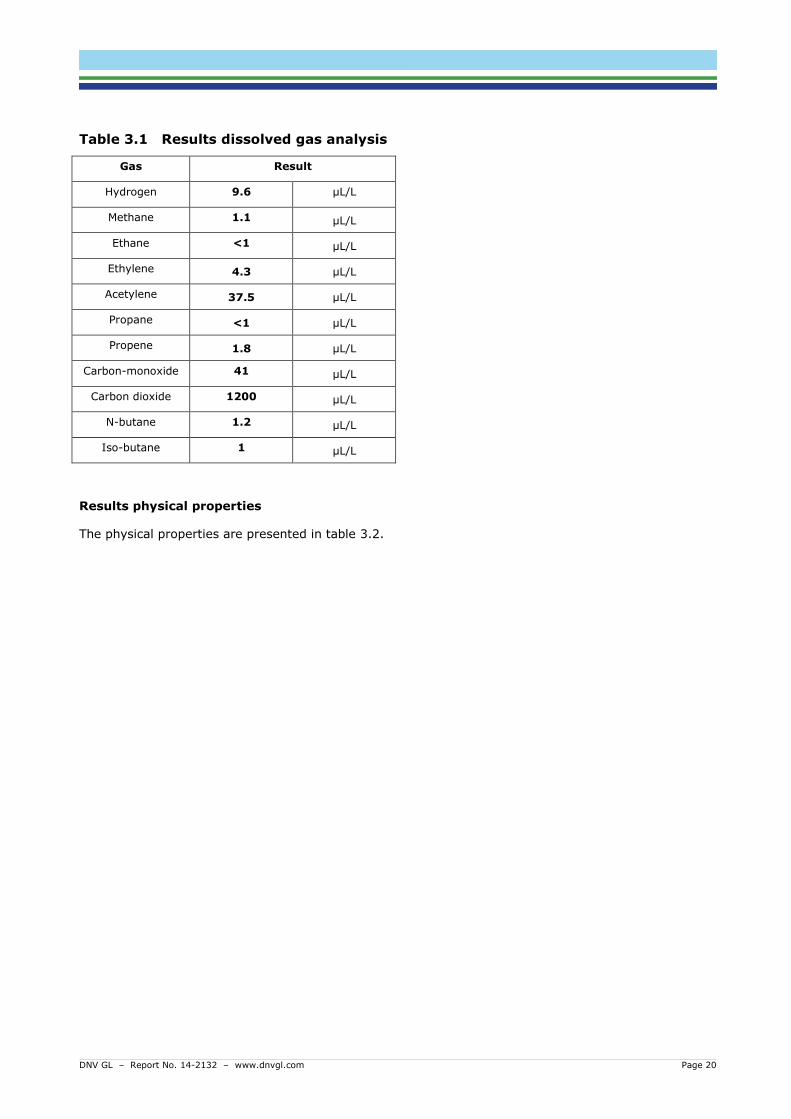
Table 3.1 Results dissolved gas analysis
Gas Result
Hydrogen 9.6 μL/L
Methane 1.1 μL/L
Ethane <1 μL/L
Ethylene 4.3 μL/L
Acetylene 37.5 μL/L
Propane <1 μL/L
Propene 1.8 μL/L
Carbon-monoxide 41 μL/L
Carbon dioxide 1200 μL/L
N-butane 1.2 μL/L
Iso-butane 1 μL/L
Results physical properties
The physical properties are presented in table 3.2.
DNV GL – Report No. 14-2132 – www.dnvgl.com Page 21
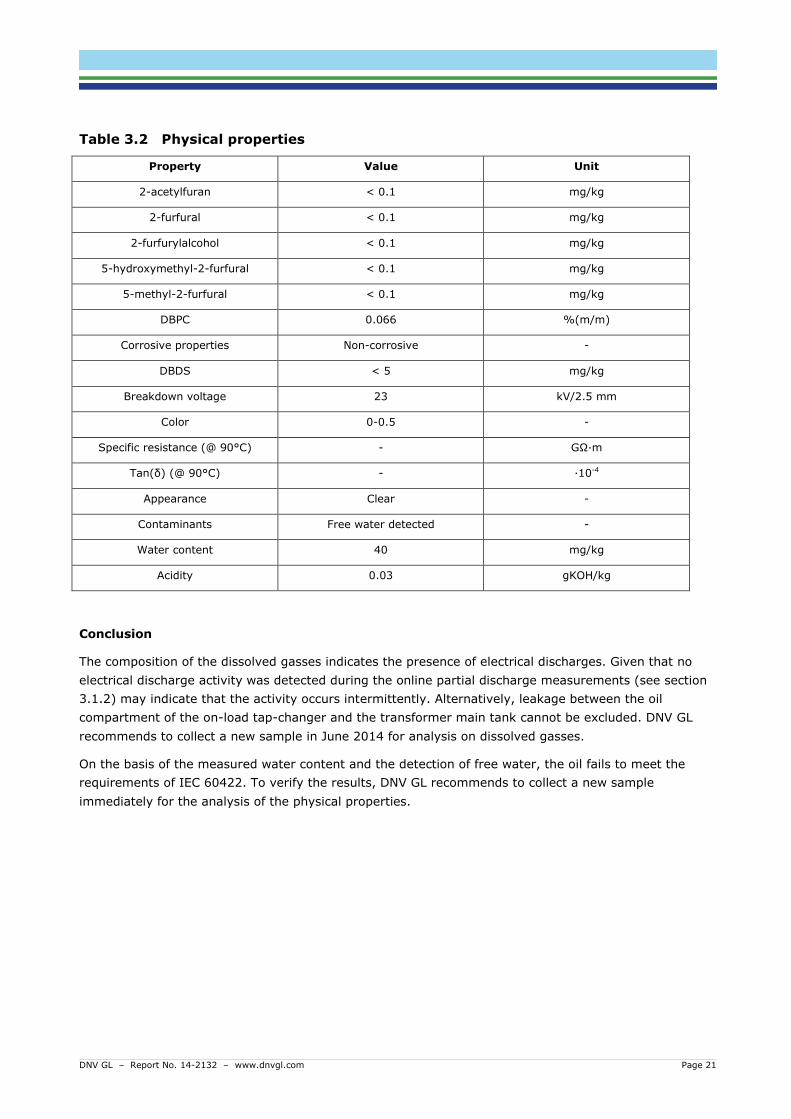
Table 3.2 Physical properties
Property Value Unit
2-acetylfuran < 0.1 mg/kg
2-furfural < 0.1 mg/kg
2-furfurylalcohol < 0.1 mg/kg
5-hydroxymethyl-2-furfural < 0.1 mg/kg
5-methyl-2-furfural < 0.1 mg/kg
DBPC 0.066 %(m/m)
Corrosive properties Non-corrosive -
DBDS < 5 mg/kg
Breakdown voltage 23 kV/2.5 mm
Color 0-0.5 -
Specific resistance (@ 90°C) - GΩ∙m
Tan(δ) (@ 90°C) - ∙10-4
Appearance Clear -
Contaminants Free water detected -
Water content 40 mg/kg
Acidity 0.03 gKOH/kg
Conclusion
The composition of the dissolved gasses indicates the presence of electrical discharges. Given that no
electrical discharge activity was detected during the online partial discharge measurements (see section
3.1.2) may indicate that the activity occurs intermittently. Alternatively, leakage between the oil
compartment of the on-load tap-changer and the transformer main tank cannot be excluded. DNV GL
recommends to collect a new sample in June 2014 for analysis on dissolved gasses.
On the basis of the measured water content and the detection of free water, the oil fails to meet the
requirements of IEC 60422. To verify the results, DNV GL recommends to collect a new sample
immediately for the analysis of the physical properties.
DNV GL – Report No. 14-2132 – www.dnvgl.com Page 22
4.1.5 Remaining lifetime assessment
Method 1: Furanic compounds
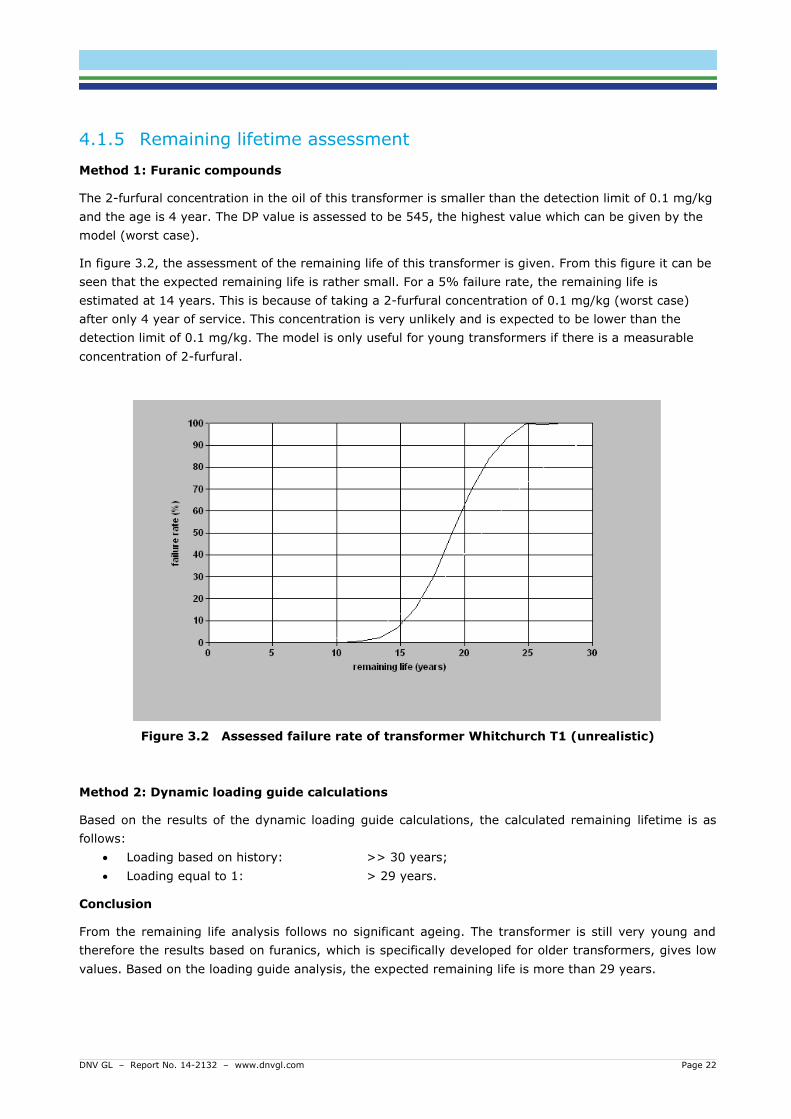
The 2-furfural concentration in the oil of this transformer is smaller than the detection limit of 0.1 mg/kg
and the age is 4 year. The DP value is assessed to be 545, the highest value which can be given by the
model (worst case).
In figure 3.2, the assessment of the remaining life of this transformer is given. From this figure it can be
seen that the expected remaining life is rather small. For a 5% failure rate, the remaining life is
estimated at 14 years. This is because of taking a 2-furfural concentration of 0.1 mg/kg (worst case)
after only 4 year of service. This concentration is very unlikely and is expected to be lower than the
detection limit of 0.1 mg/kg. The model is only useful for young transformers if there is a measurable
concentration of 2-furfural.
Figure 3.2 Assessed failure rate of transformer Whitchurch T1 (unrealistic)
Method 2: Dynamic loading guide calculations
Based on the results of the dynamic loading guide calculations, the calculated remaining lifetime is as
follows:
Loading based on history: >> 30 years;
Loading equal to 1: > 29 years.
Conclusion
From the remaining life analysis follows no significant ageing. The transformer is still very young and
therefore the results based on furanics, which is specifically developed for older transformers, gives low
values. Based on the loading guide analysis, the expected remaining life is more than 29 years.
DNV GL – Report No. 14-2132 – www.dnvgl.com Page 23
4.2 Liverpool Road
4.2.1 Visual inspection
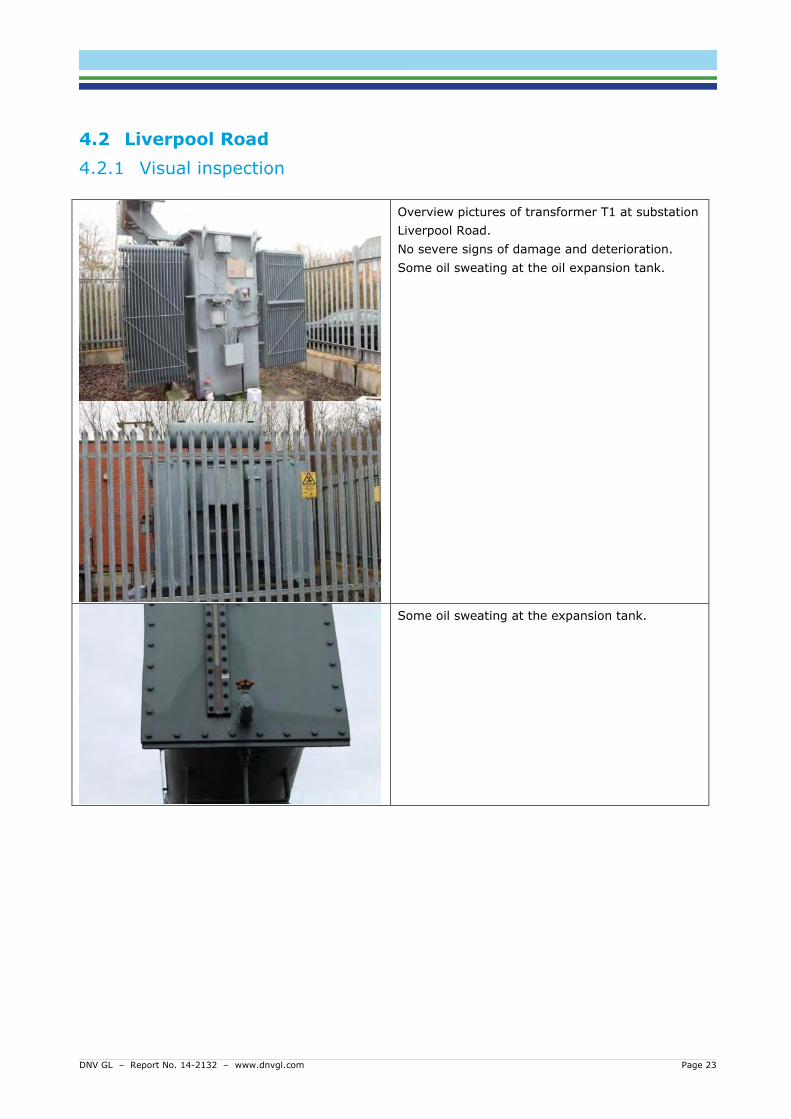
Overview pictures of transformer T1 at substation
Liverpool Road.
No severe signs of damage and deterioration.
Some oil sweating at the oil expansion tank.
Some oil sweating at the expansion tank.
DNV GL – Report No. 14-2132 – www.dnvgl.com Page 24
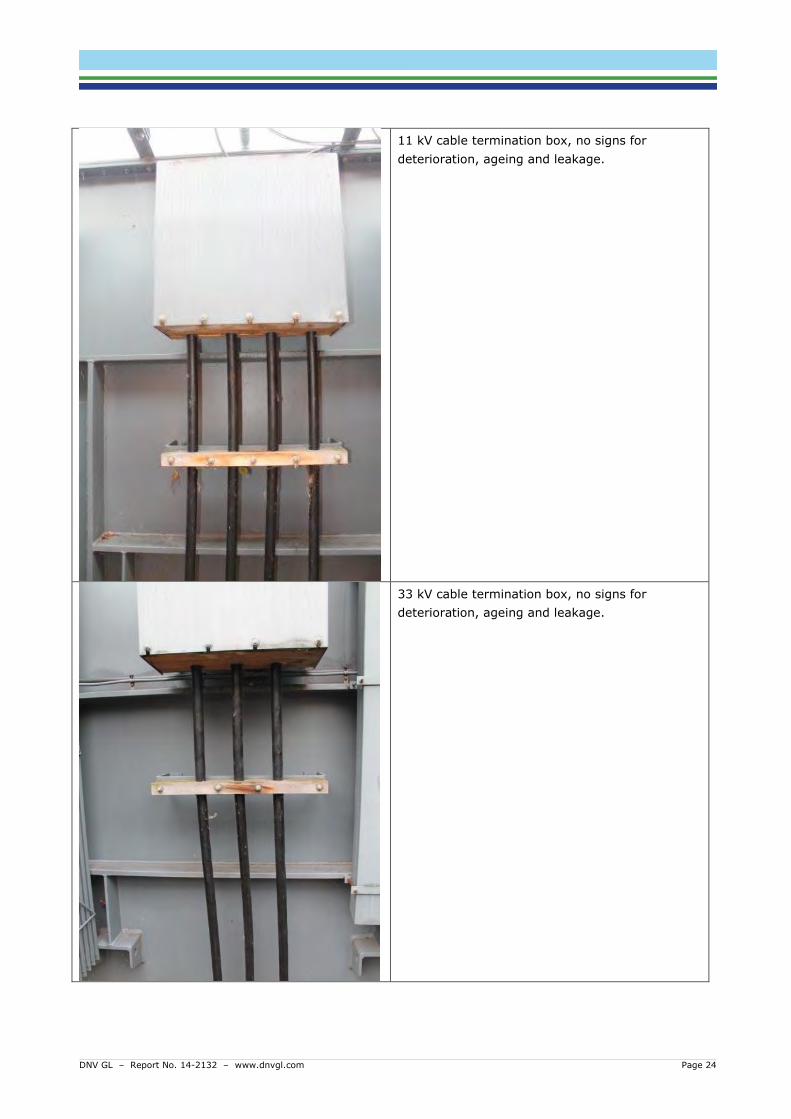
11 kV cable termination box, no signs for
deterioration, ageing and leakage.
33 kV cable termination box, no signs for
deterioration, ageing and leakage.
DNV GL – Report No. 14-2132 – www.dnvgl.com Page 25
Conclusion
During the visual inspection, no severe signs of damage, deterioration and leakage have been observed.
Some oil sweating at the oil expansion tank.
4.2.2 Partial discharge measurement
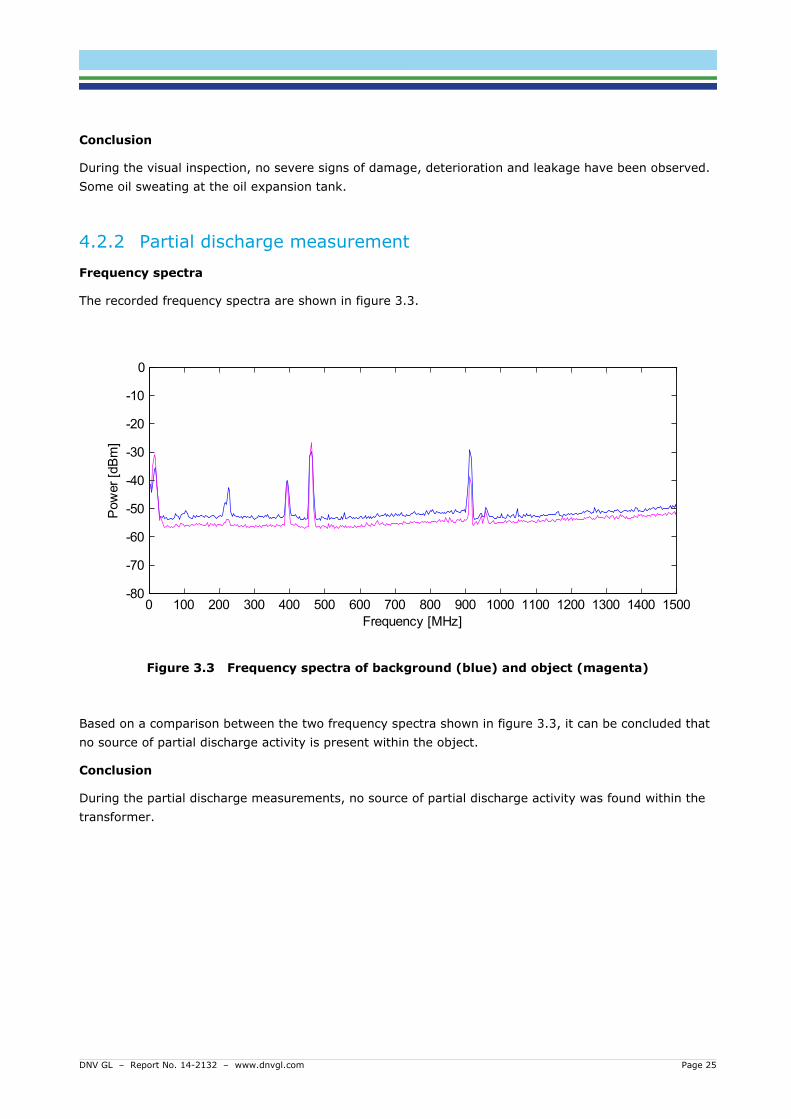
Frequency spectra
The recorded frequency spectra are shown in figure 3.3.
Figure 3.3 Frequency spectra of background (blue) and object (magenta)
Based on a comparison between the two frequency spectra shown in figure 3.3, it can be concluded that
no source of partial discharge activity is present within the object.
Conclusion
During the partial discharge measurements, no source of partial discharge activity was found within the
transformer.
0 100 200 300 400 500 600 700 800 900 1000 1100 1200 1300 1400 1500-80
-70
-60
-50
-40
-30
-20
-10
0
Pow
er
[dB
m]
Frequency [MHz]
DNV GL – Report No. 14-2132 – www.dnvgl.com Page 26
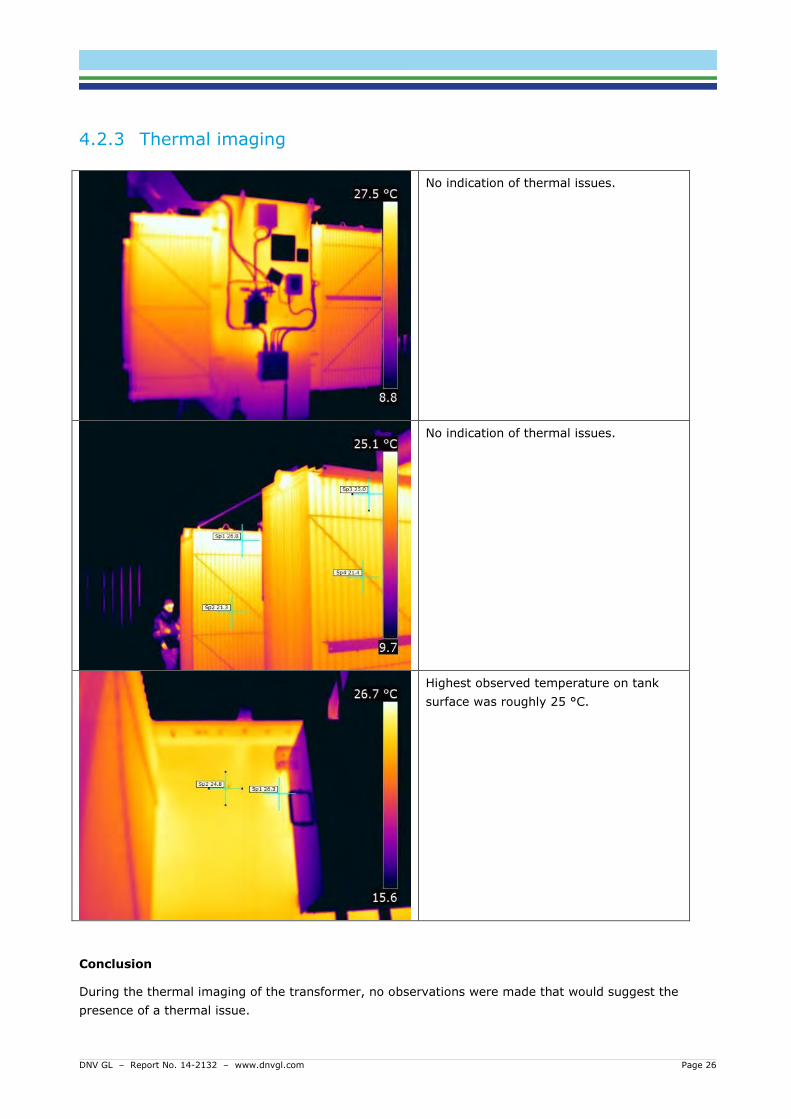
4.2.3 Thermal imaging
No indication of thermal issues.
No indication of thermal issues.
Highest observed temperature on tank
surface was roughly 25 °C.
Conclusion
During the thermal imaging of the transformer, no observations were made that would suggest the
presence of a thermal issue.
DNV GL – Report No. 14-2132 – www.dnvgl.com Page 27
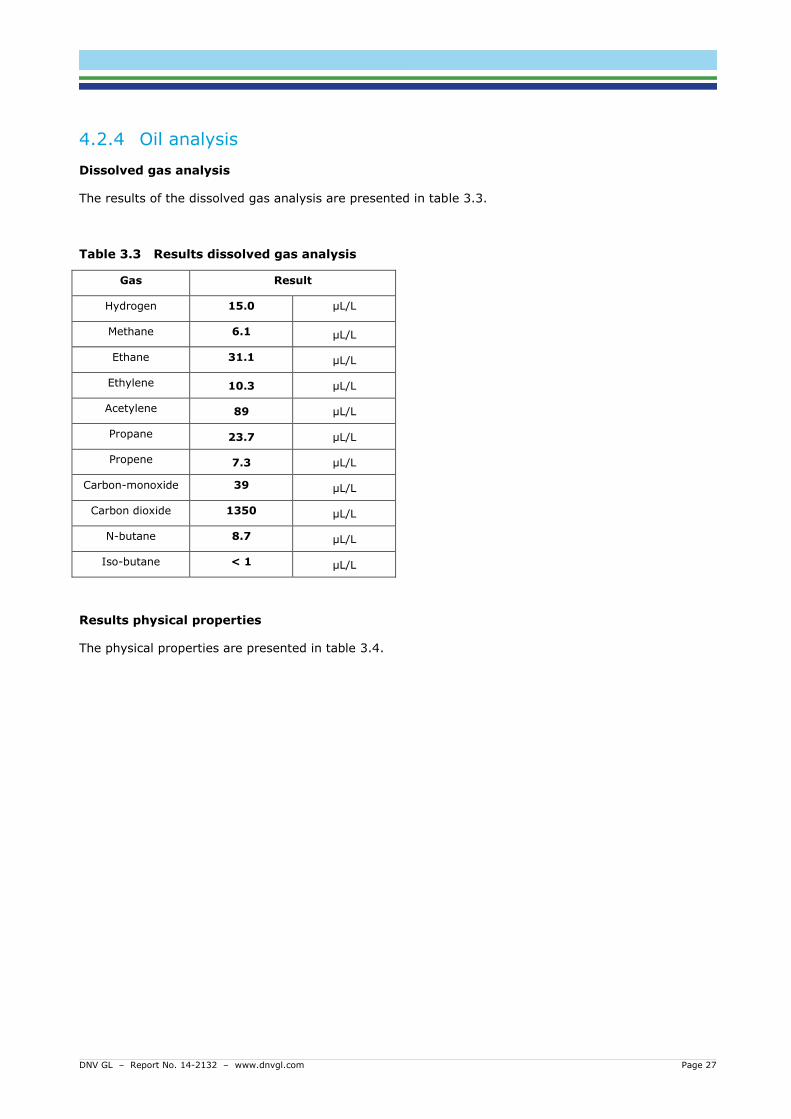
4.2.4 Oil analysis
Dissolved gas analysis
The results of the dissolved gas analysis are presented in table 3.3.
Table 3.3 Results dissolved gas analysis
Gas Result
Hydrogen 15.0 μL/L
Methane 6.1 μL/L
Ethane 31.1 μL/L
Ethylene 10.3 μL/L
Acetylene 89 μL/L
Propane 23.7 μL/L
Propene 7.3 μL/L
Carbon-monoxide 39 μL/L
Carbon dioxide 1350 μL/L
N-butane 8.7 μL/L
Iso-butane < 1 μL/L
Results physical properties
The physical properties are presented in table 3.4.
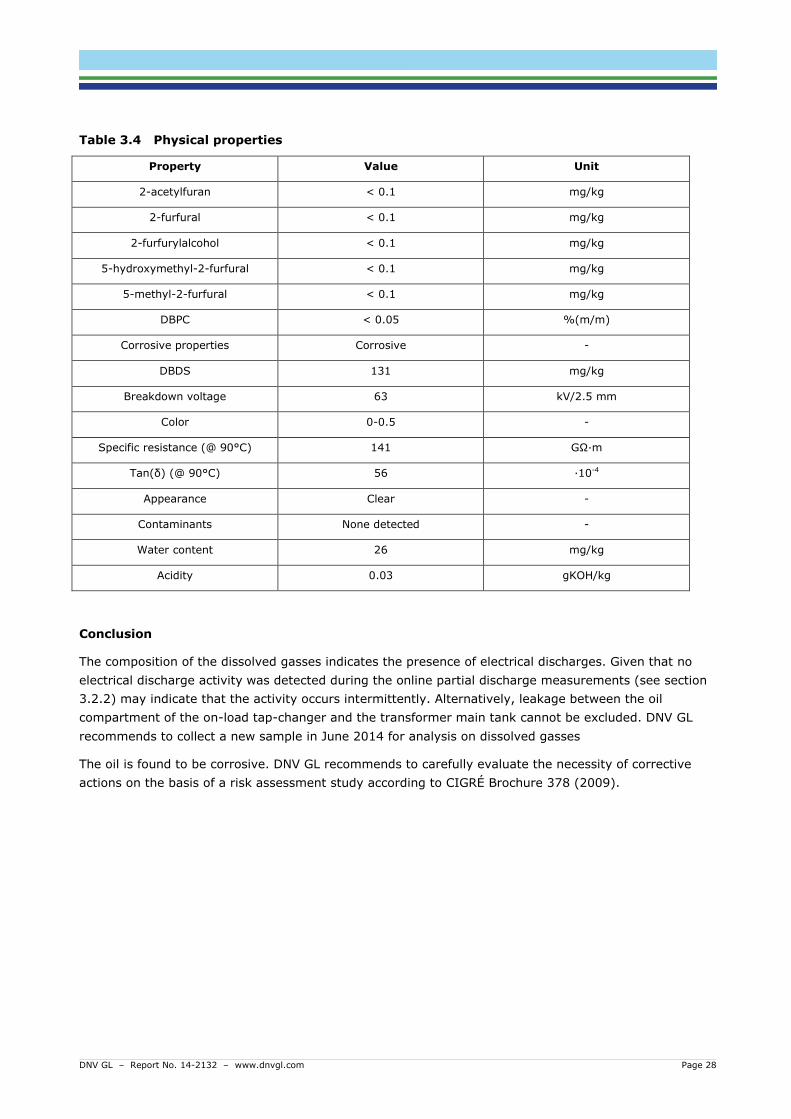
DNV GL – Report No. 14-2132 – www.dnvgl.com Page 28
Table 3.4 Physical properties
Property Value Unit
2-acetylfuran < 0.1 mg/kg
2-furfural < 0.1 mg/kg
2-furfurylalcohol < 0.1 mg/kg
5-hydroxymethyl-2-furfural < 0.1 mg/kg
5-methyl-2-furfural < 0.1 mg/kg
DBPC < 0.05 %(m/m)
Corrosive properties Corrosive -
DBDS 131 mg/kg
Breakdown voltage 63 kV/2.5 mm
Color 0-0.5 -
Specific resistance (@ 90°C) 141 GΩ∙m
Tan(δ) (@ 90°C) 56 ∙10-4
Appearance Clear -
Contaminants None detected -
Water content 26 mg/kg
Acidity 0.03 gKOH/kg
Conclusion
The composition of the dissolved gasses indicates the presence of electrical discharges. Given that no
electrical discharge activity was detected during the online partial discharge measurements (see section
3.2.2) may indicate that the activity occurs intermittently. Alternatively, leakage between the oil
compartment of the on-load tap-changer and the transformer main tank cannot be excluded. DNV GL
recommends to collect a new sample in June 2014 for analysis on dissolved gasses
The oil is found to be corrosive. DNV GL recommends to carefully evaluate the necessity of corrective
actions on the basis of a risk assessment study according to CIGRÉ Brochure 378 (2009).
DNV GL – Report No. 14-2132 – www.dnvgl.com Page 29
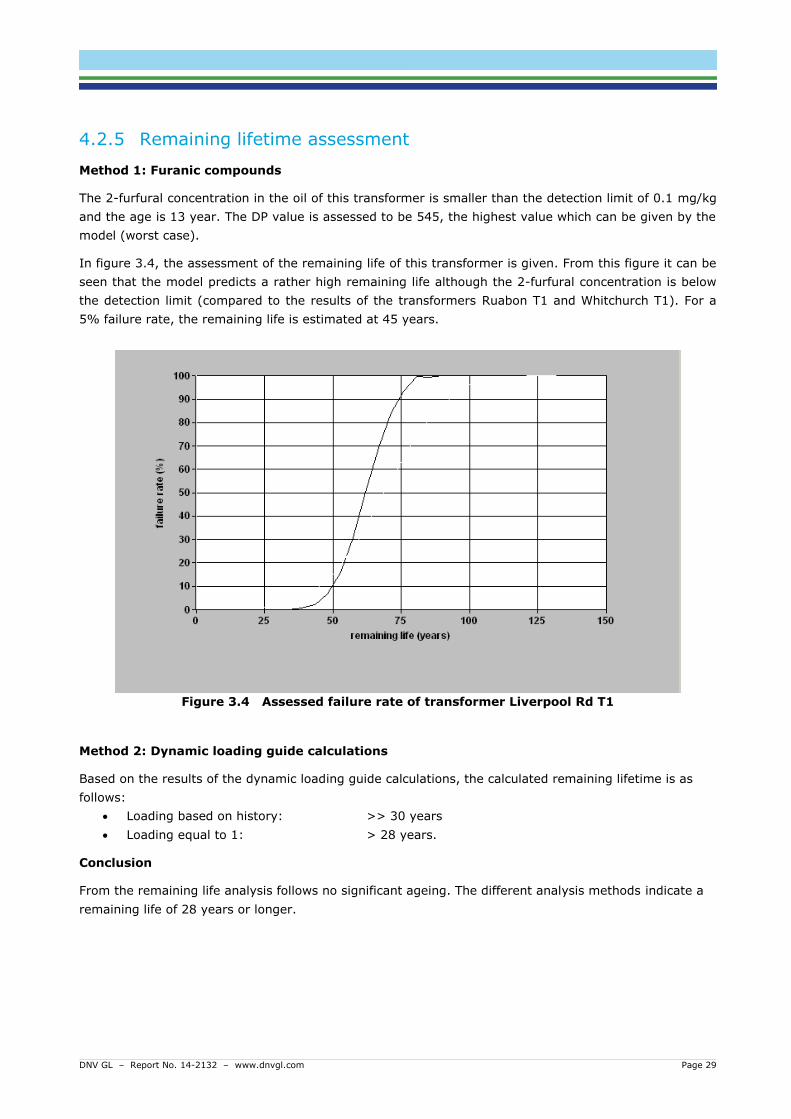
4.2.5 Remaining lifetime assessment
Method 1: Furanic compounds
The 2-furfural concentration in the oil of this transformer is smaller than the detection limit of 0.1 mg/kg
and the age is 13 year. The DP value is assessed to be 545, the highest value which can be given by the
model (worst case).
In figure 3.4, the assessment of the remaining life of this transformer is given. From this figure it can be
seen that the model predicts a rather high remaining life although the 2-furfural concentration is below
the detection limit (compared to the results of the transformers Ruabon T1 and Whitchurch T1). For a
5% failure rate, the remaining life is estimated at 45 years.
Figure 3.4 Assessed failure rate of transformer Liverpool Rd T1
Method 2: Dynamic loading guide calculations
Based on the results of the dynamic loading guide calculations, the calculated remaining lifetime is as
follows:
Loading based on history: >> 30 years
Loading equal to 1: > 28 years.
Conclusion
From the remaining life analysis follows no significant ageing. The different analysis methods indicate a
remaining life of 28 years or longer.
DNV GL – Report No. 14-2132 – www.dnvgl.com Page 30
4.3 Yockings Gate
4.3.1 Visual inspection
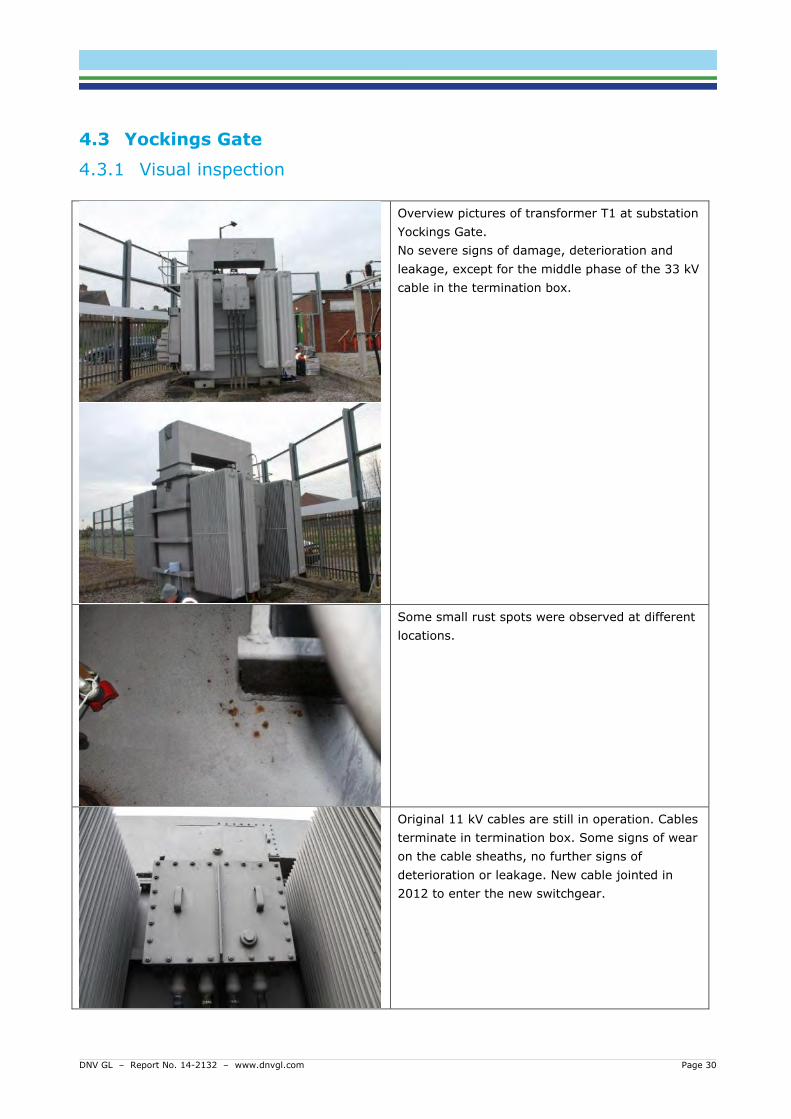
Overview pictures of transformer T1 at substation
Yockings Gate.
No severe signs of damage, deterioration and
leakage, except for the middle phase of the 33 kV
cable in the termination box.
Some small rust spots were observed at different
locations.
Original 11 kV cables are still in operation. Cables
terminate in termination box. Some signs of wear
on the cable sheaths, no further signs of
deterioration or leakage. New cable jointed in
2012 to enter the new switchgear.
DNV GL – Report No. 14-2132 – www.dnvgl.com Page 31
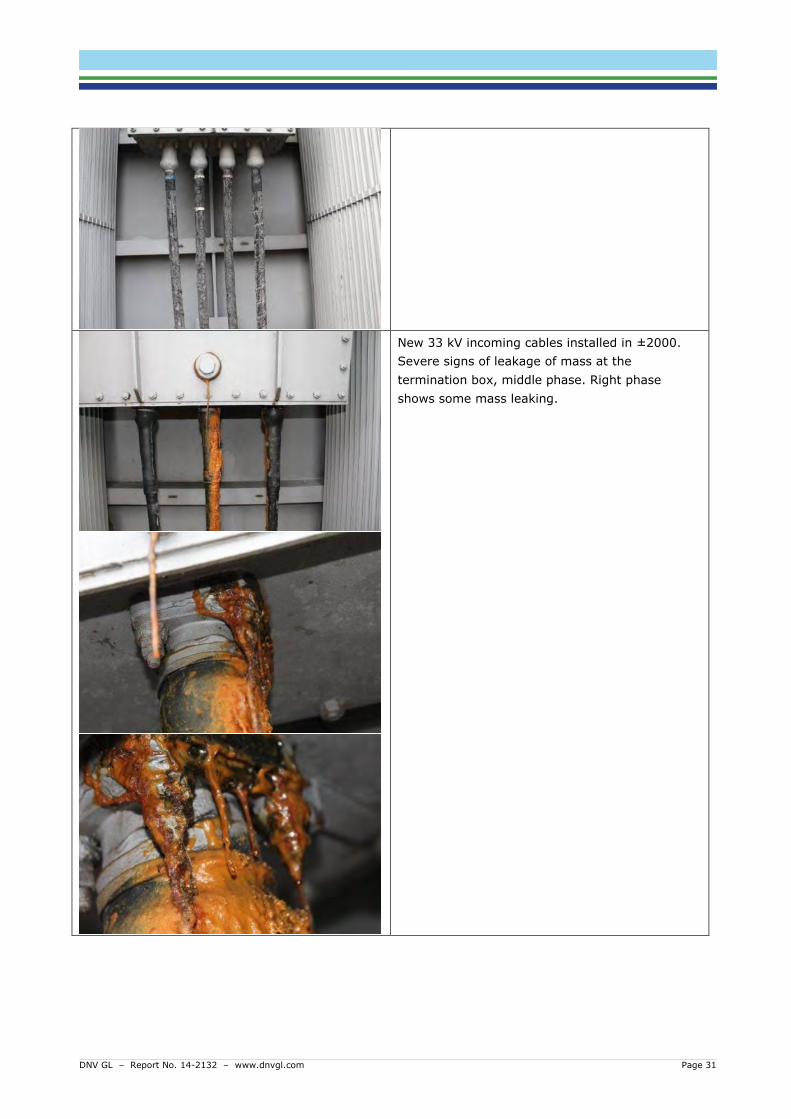
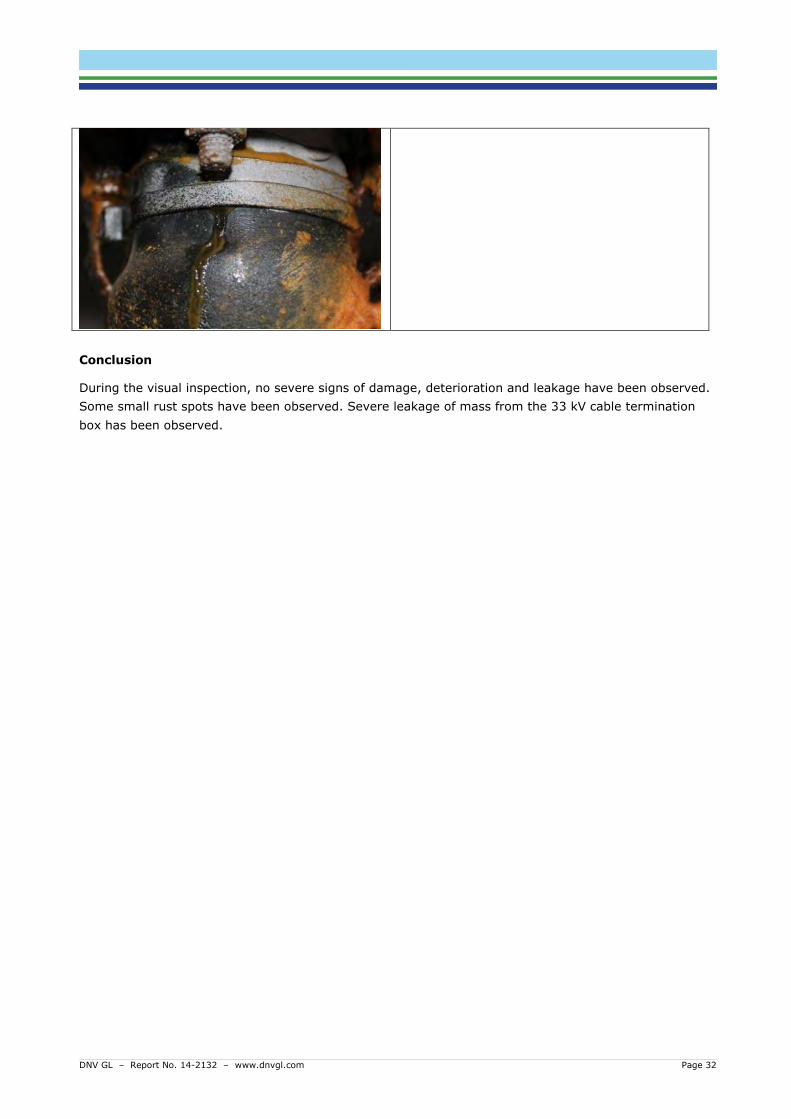
New 33 kV incoming cables installed in ±2000.
Severe signs of leakage of mass at the
termination box, middle phase. Right phase
shows some mass leaking.
DNV GL – Report No. 14-2132 – www.dnvgl.com Page 32
Conclusion
During the visual inspection, no severe signs of damage, deterioration and leakage have been observed.
Some small rust spots have been observed. Severe leakage of mass from the 33 kV cable termination
box has been observed.
DNV GL – Report No. 14-2132 – www.dnvgl.com Page 33
4.3.2 Partial discharge measurement
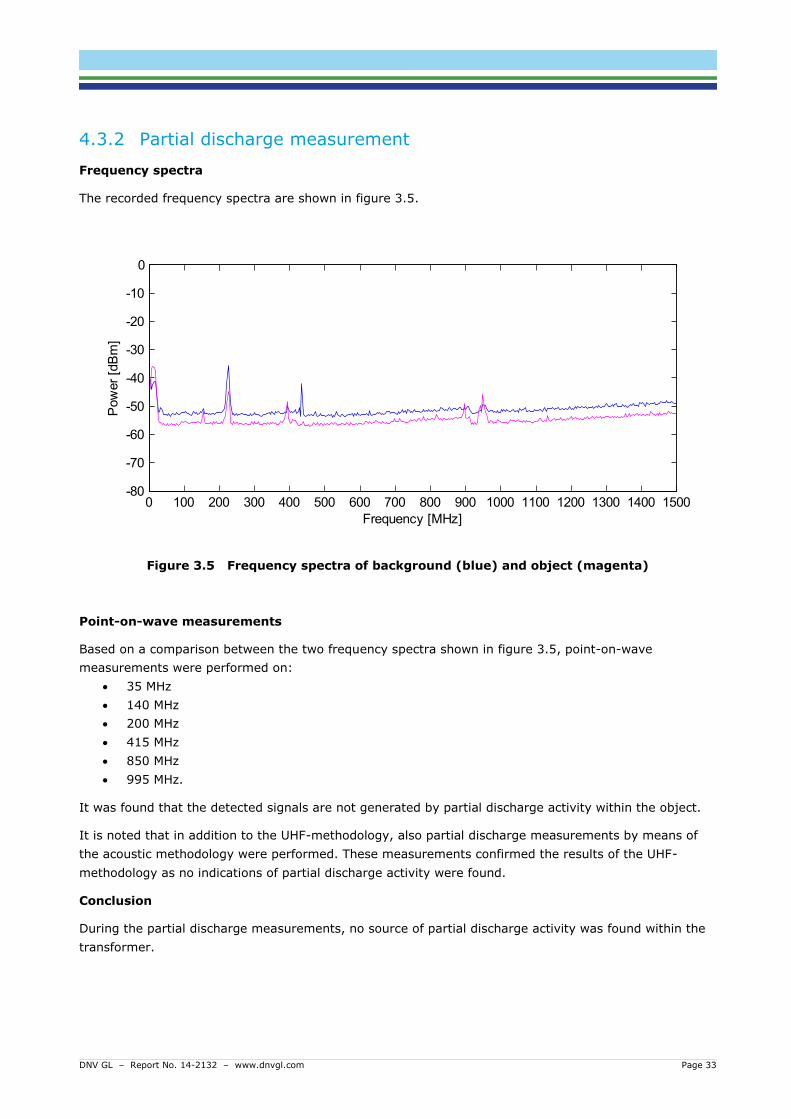
Frequency spectra
The recorded frequency spectra are shown in figure 3.5.
Figure 3.5 Frequency spectra of background (blue) and object (magenta)
Point-on-wave measurements
Based on a comparison between the two frequency spectra shown in figure 3.5, point-on-wave
measurements were performed on:
35 MHz
140 MHz
200 MHz
415 MHz
850 MHz
995 MHz.
It was found that the detected signals are not generated by partial discharge activity within the object.
It is noted that in addition to the UHF-methodology, also partial discharge measurements by means of
the acoustic methodology were performed. These measurements confirmed the results of the UHF-
methodology as no indications of partial discharge activity were found.
Conclusion
During the partial discharge measurements, no source of partial discharge activity was found within the
transformer.
0 100 200 300 400 500 600 700 800 900 1000 1100 1200 1300 1400 1500-80
-70
-60
-50
-40
-30
-20
-10
0
Pow
er
[dB
m]
Frequency [MHz]
DNV GL – Report No. 14-2132 – www.dnvgl.com Page 34
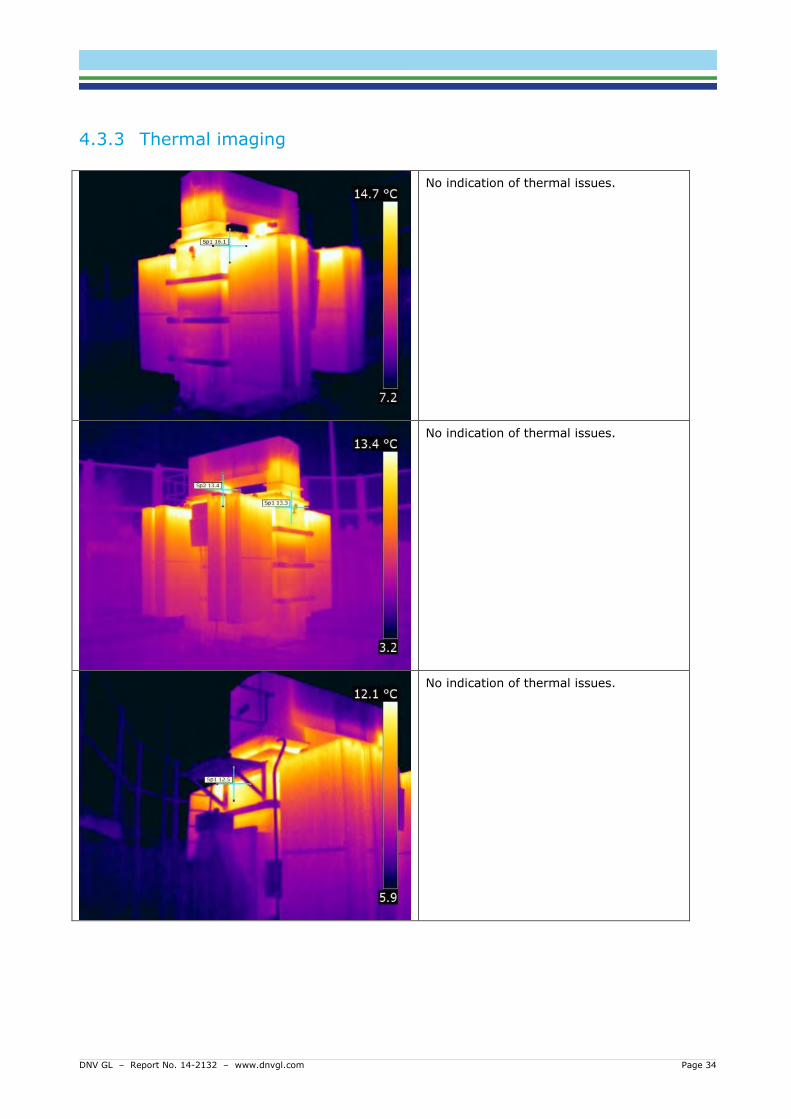
4.3.3 Thermal imaging
No indication of thermal issues.
No indication of thermal issues.
No indication of thermal issues.
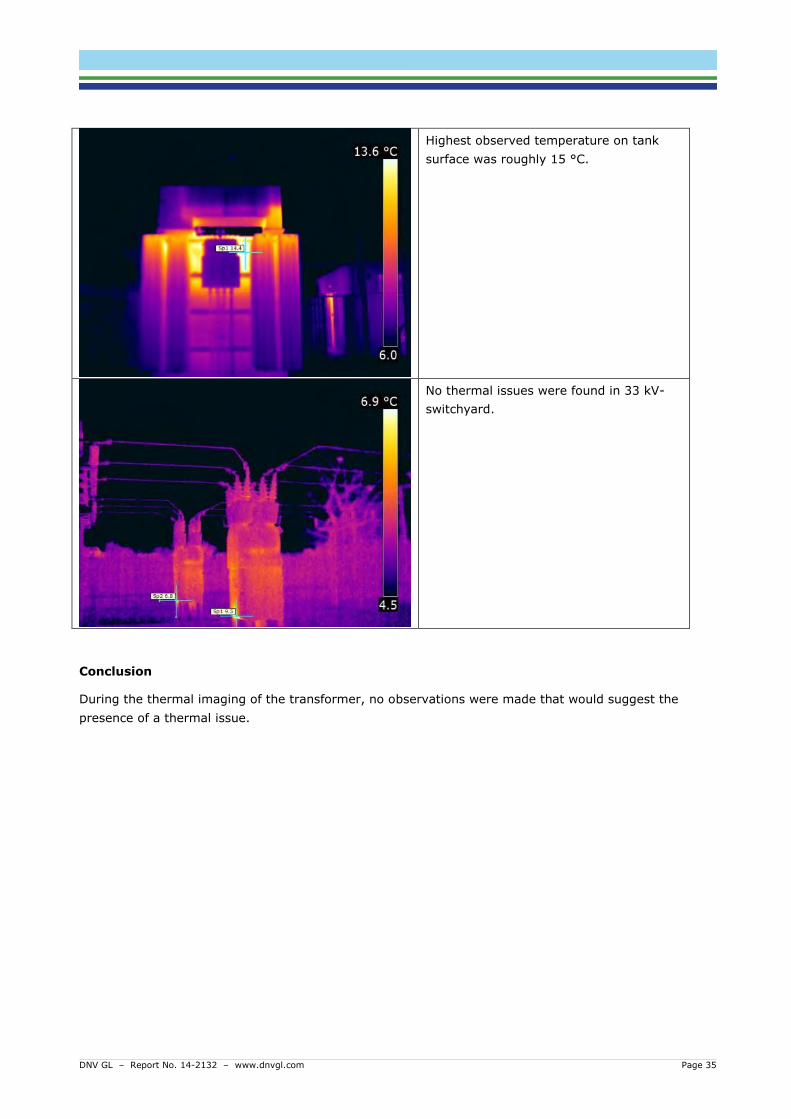
DNV GL – Report No. 14-2132 – www.dnvgl.com Page 35
Highest observed temperature on tank
surface was roughly 15 °C.
No thermal issues were found in 33 kV-
switchyard.
Conclusion
During the thermal imaging of the transformer, no observations were made that would suggest the
presence of a thermal issue.
DNV GL – Report No. 14-2132 – www.dnvgl.com Page 36
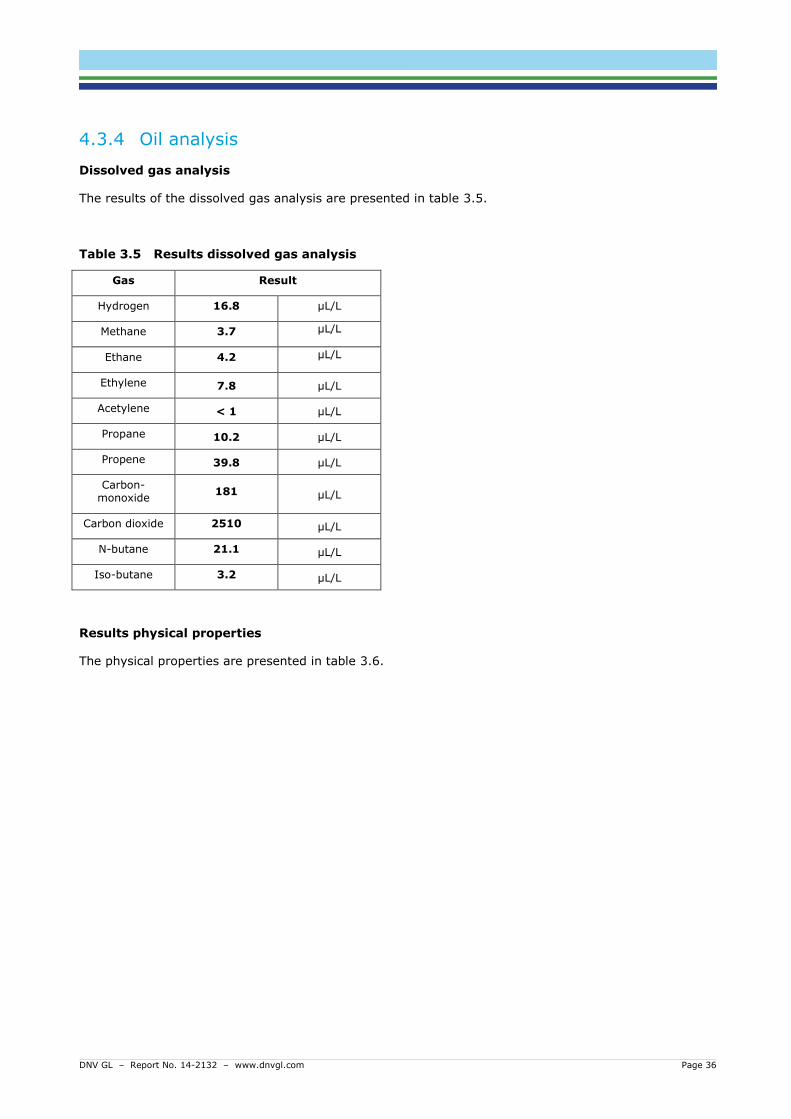
4.3.4 Oil analysis
Dissolved gas analysis
The results of the dissolved gas analysis are presented in table 3.5.
Table 3.5 Results dissolved gas analysis
Gas Result
Hydrogen 16.8 μL/L
Methane 3.7 μL/L
Ethane 4.2 μL/L
Ethylene 7.8 μL/L
Acetylene < 1 μL/L
Propane 10.2 μL/L
Propene 39.8 μL/L
Carbon-monoxide
181 μL/L
Carbon dioxide 2510 μL/L
N-butane 21.1 μL/L
Iso-butane 3.2 μL/L
Results physical properties
The physical properties are presented in table 3.6.
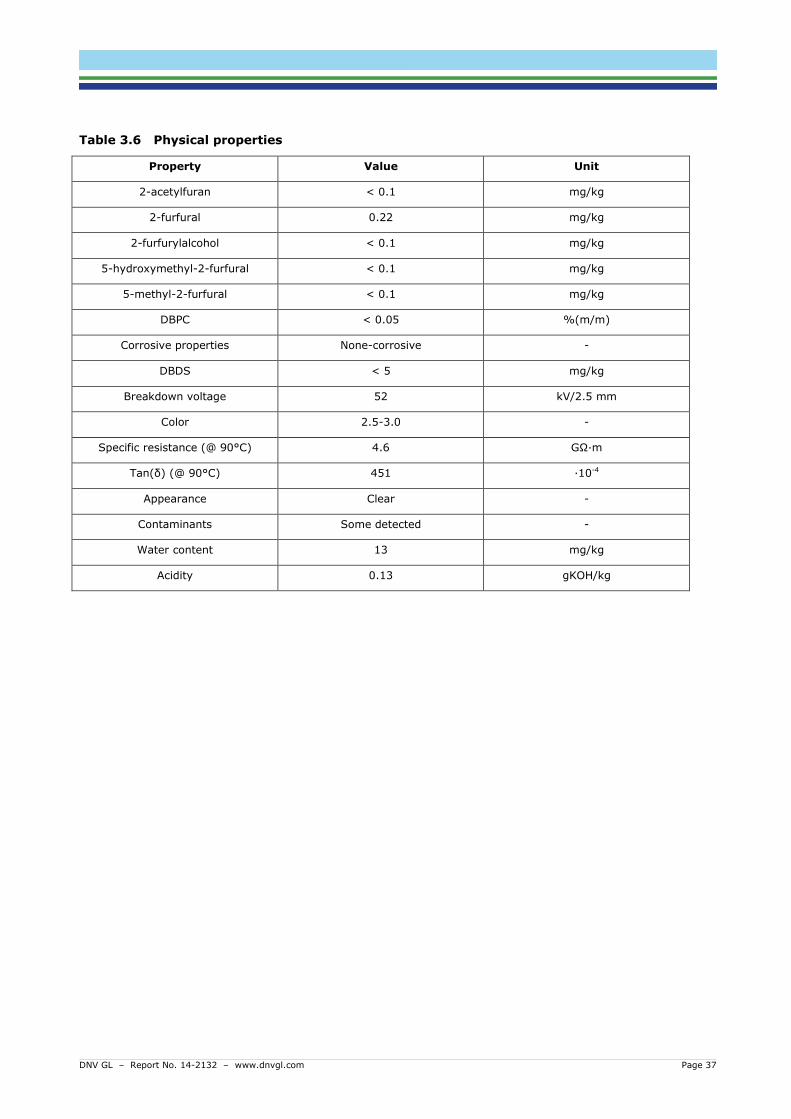
DNV GL – Report No. 14-2132 – www.dnvgl.com Page 37
Table 3.6 Physical properties
Property Value Unit
2-acetylfuran < 0.1 mg/kg
2-furfural 0.22 mg/kg
2-furfurylalcohol < 0.1 mg/kg
5-hydroxymethyl-2-furfural < 0.1 mg/kg
5-methyl-2-furfural < 0.1 mg/kg
DBPC < 0.05 %(m/m)
Corrosive properties None-corrosive -
DBDS < 5 mg/kg
Breakdown voltage 52 kV/2.5 mm
Color 2.5-3.0 -
Specific resistance (@ 90°C) 4.6 GΩ∙m
Tan(δ) (@ 90°C) 451 ∙10-4
Appearance Clear -
Contaminants Some detected -
Water content 13 mg/kg
Acidity 0.13 gKOH/kg
DNV GL – Report No. 14-2132 – www.dnvgl.com Page 38
Conclusion
The composition of the dissolved gasses indicates a normal aging process. DNV GL recommends to
collect a new sample in January 2015 for the analysis on the concentration of dissolved gasses.
The physical properties of the oil meet the requirements of IEC 60422 and can be kept in service.
DNV GL recommends to collect a new sample in January 2016 for the analysis of the physical properties.
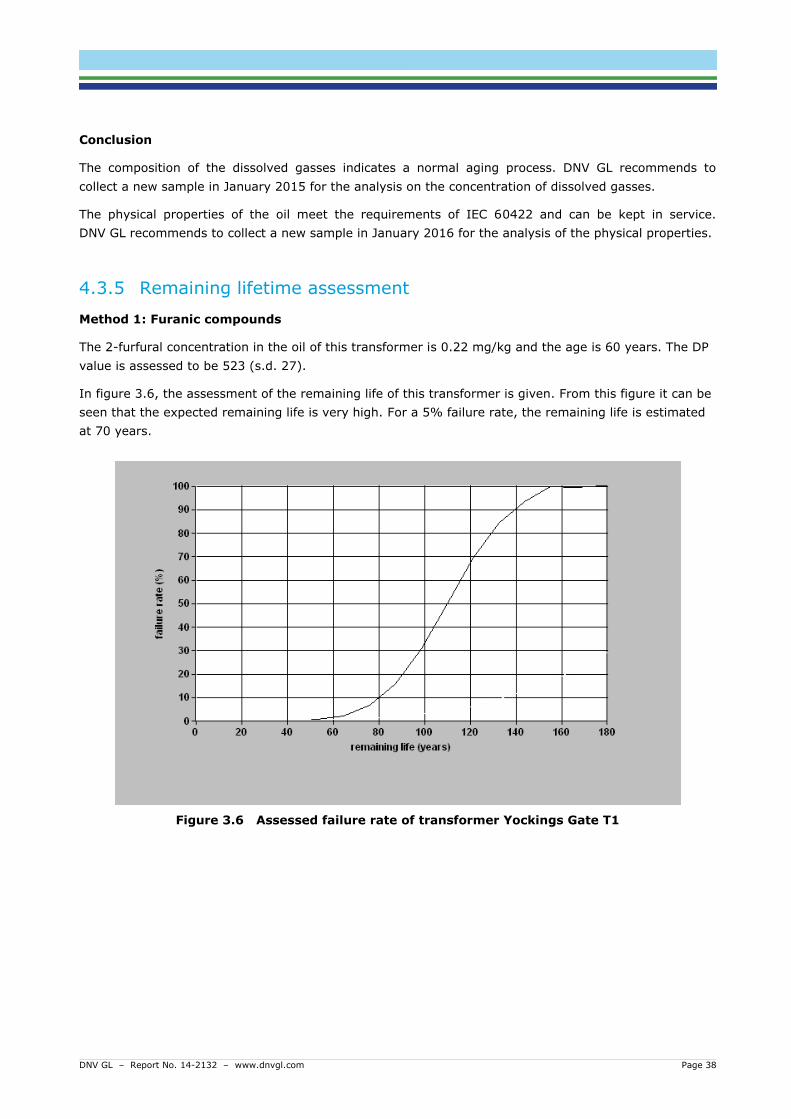
4.3.5 Remaining lifetime assessment
Method 1: Furanic compounds
The 2-furfural concentration in the oil of this transformer is 0.22 mg/kg and the age is 60 years. The DP
value is assessed to be 523 (s.d. 27).
In figure 3.6, the assessment of the remaining life of this transformer is given. From this figure it can be
seen that the expected remaining life is very high. For a 5% failure rate, the remaining life is estimated
at 70 years.
Figure 3.6 Assessed failure rate of transformer Yockings Gate T1
DNV GL – Report No. 14-2132 – www.dnvgl.com Page 39
Method 2: Dynamic loading guide calculations
Based on the results of the dynamic loading guide calculations, the calculated remaining lifetime is as
follows:
Loading based on history: >> 30 years;
Loading equal to 1: > 27 years.
Conclusion
From the remaining life analysis follows no significant ageing. The different analysis methods indicate a
remaining life of 27 years or longer.
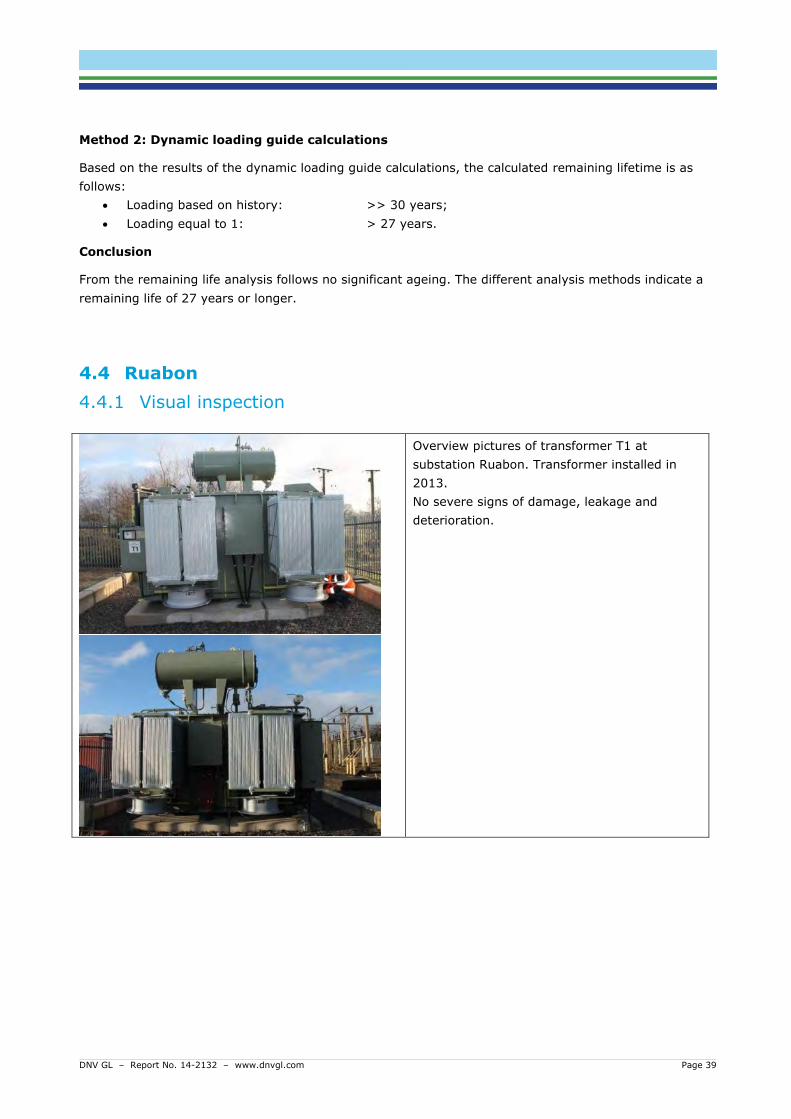
4.4 Ruabon
4.4.1 Visual inspection
Overview pictures of transformer T1 at
substation Ruabon. Transformer installed in
2013.
No severe signs of damage, leakage and
deterioration.
DNV GL – Report No. 14-2132 – www.dnvgl.com Page 40
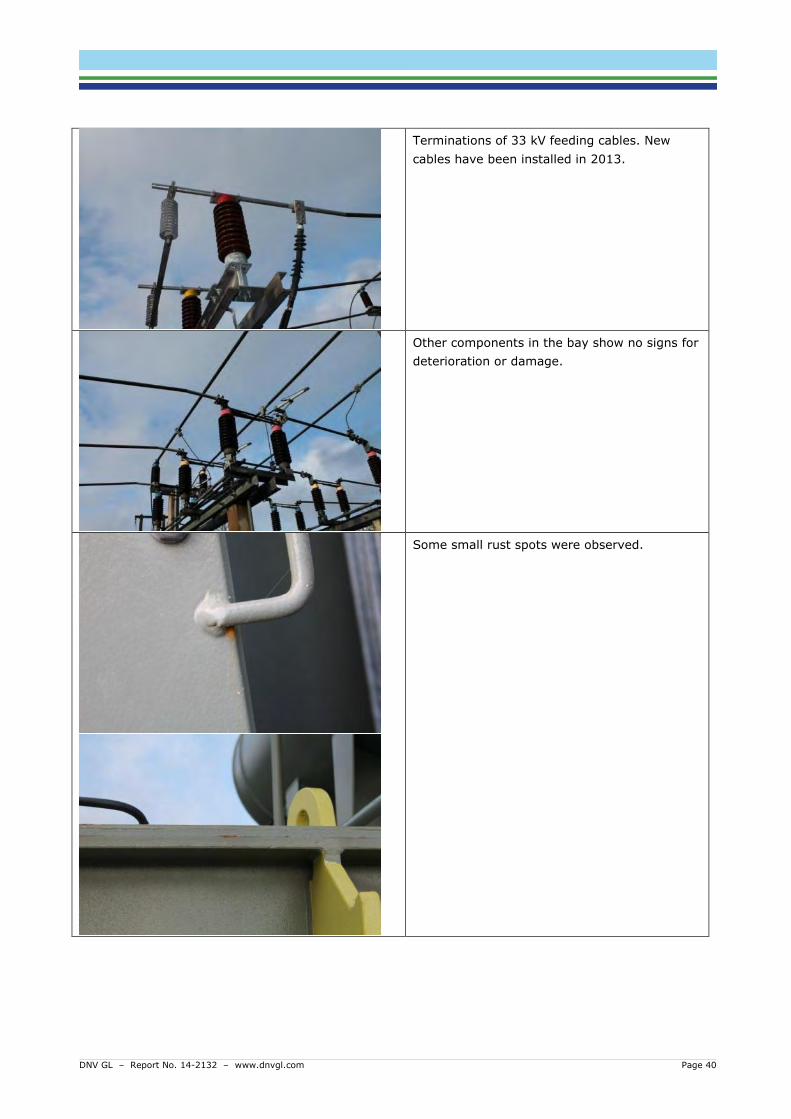
Terminations of 33 kV feeding cables. New
cables have been installed in 2013.
Other components in the bay show no signs for
deterioration or damage.
Some small rust spots were observed.
DNV GL – Report No. 14-2132 – www.dnvgl.com Page 41
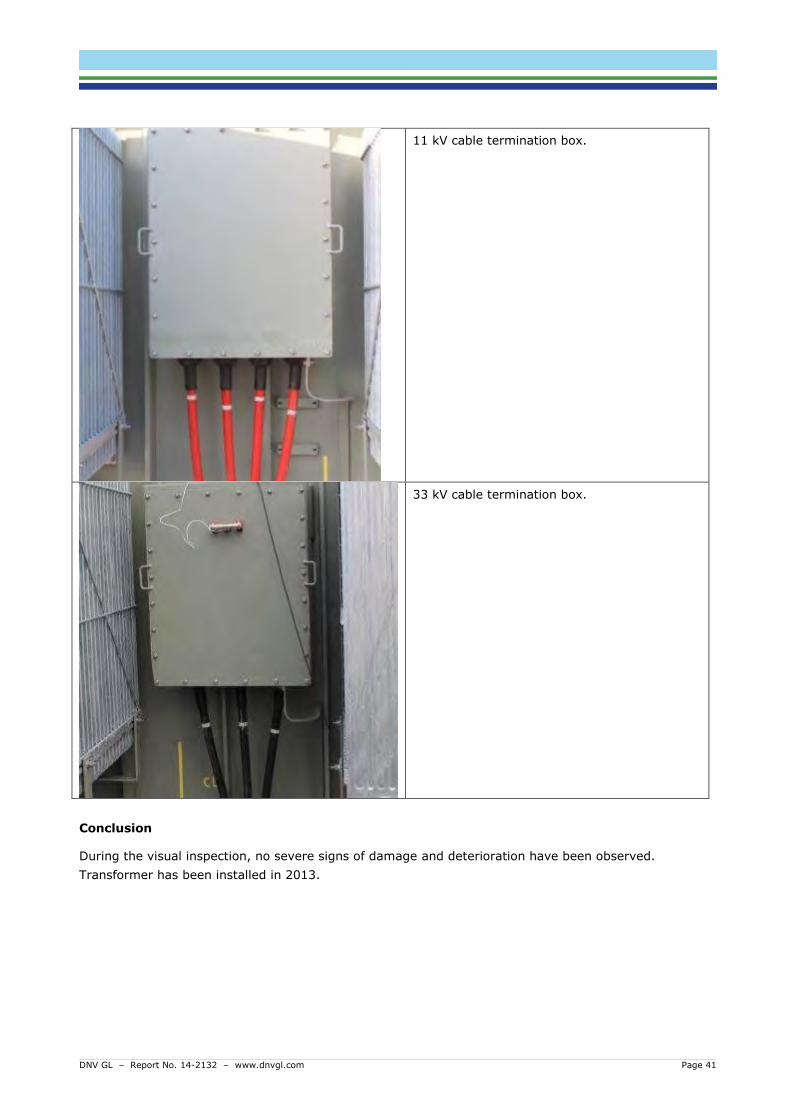
11 kV cable termination box.
33 kV cable termination box.
Conclusion
During the visual inspection, no severe signs of damage and deterioration have been observed.
Transformer has been installed in 2013.
DNV GL – Report No. 14-2132 – www.dnvgl.com Page 42
4.4.2 Partial discharge measurement
Frequency spectra
The recorded frequency spectra are shown in figure 3.7.
Figure 3.7 Frequency spectra of background (blue) and object (green)
Point-on-wave measurements
Based on a comparison between the two frequency spectra shown in figure 3.7, point-on-wave
measurements were performed on:
35 MHz
105 MHz
245 MHz
385 MHz
505 MHz
565 MHz.
At 35 MHz, the following signal was recorded:
0 100 200 300 400 500 600 700 800 900 1000 1100 1200 1300 1400 1500-80
-70
-60
-50
-40
-30
-20
-10
0
Pow
er
[dB
m]
Frequency [MHz]
DNV GL – Report No. 14-2132 – www.dnvgl.com Page 43
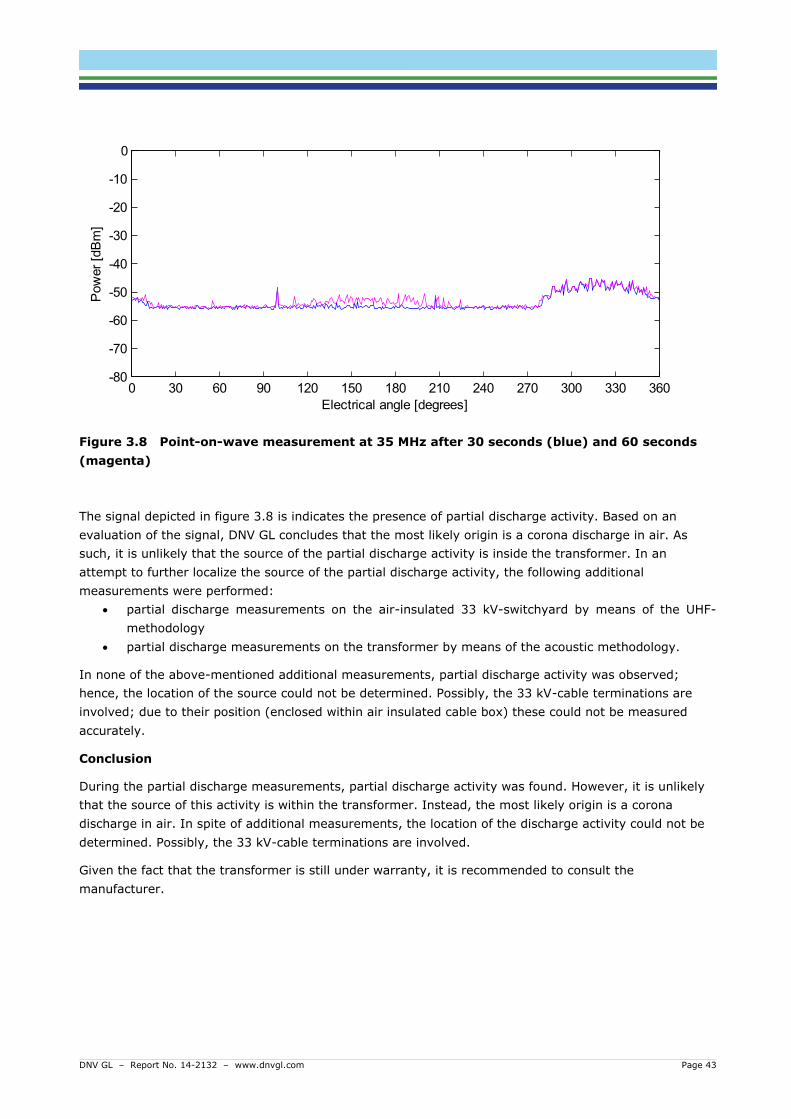
Figure 3.8 Point-on-wave measurement at 35 MHz after 30 seconds (blue) and 60 seconds
(magenta)
The signal depicted in figure 3.8 is indicates the presence of partial discharge activity. Based on an
evaluation of the signal, DNV GL concludes that the most likely origin is a corona discharge in air. As
such, it is unlikely that the source of the partial discharge activity is inside the transformer. In an
attempt to further localize the source of the partial discharge activity, the following additional
measurements were performed:
partial discharge measurements on the air-insulated 33 kV-switchyard by means of the UHF-
methodology
partial discharge measurements on the transformer by means of the acoustic methodology.
In none of the above-mentioned additional measurements, partial discharge activity was observed;
hence, the location of the source could not be determined. Possibly, the 33 kV-cable terminations are
involved; due to their position (enclosed within air insulated cable box) these could not be measured
accurately.
Conclusion
During the partial discharge measurements, partial discharge activity was found. However, it is unlikely
that the source of this activity is within the transformer. Instead, the most likely origin is a corona
discharge in air. In spite of additional measurements, the location of the discharge activity could not be
determined. Possibly, the 33 kV-cable terminations are involved.
Given the fact that the transformer is still under warranty, it is recommended to consult the
manufacturer.
0 30 60 90 120 150 180 210 240 270 300 330 360-80
-70
-60
-50
-40
-30
-20
-10
0
Pow
er
[dB
m]
Electrical angle [degrees]
DNV GL – Report No. 14-2132 – www.dnvgl.com Page 44
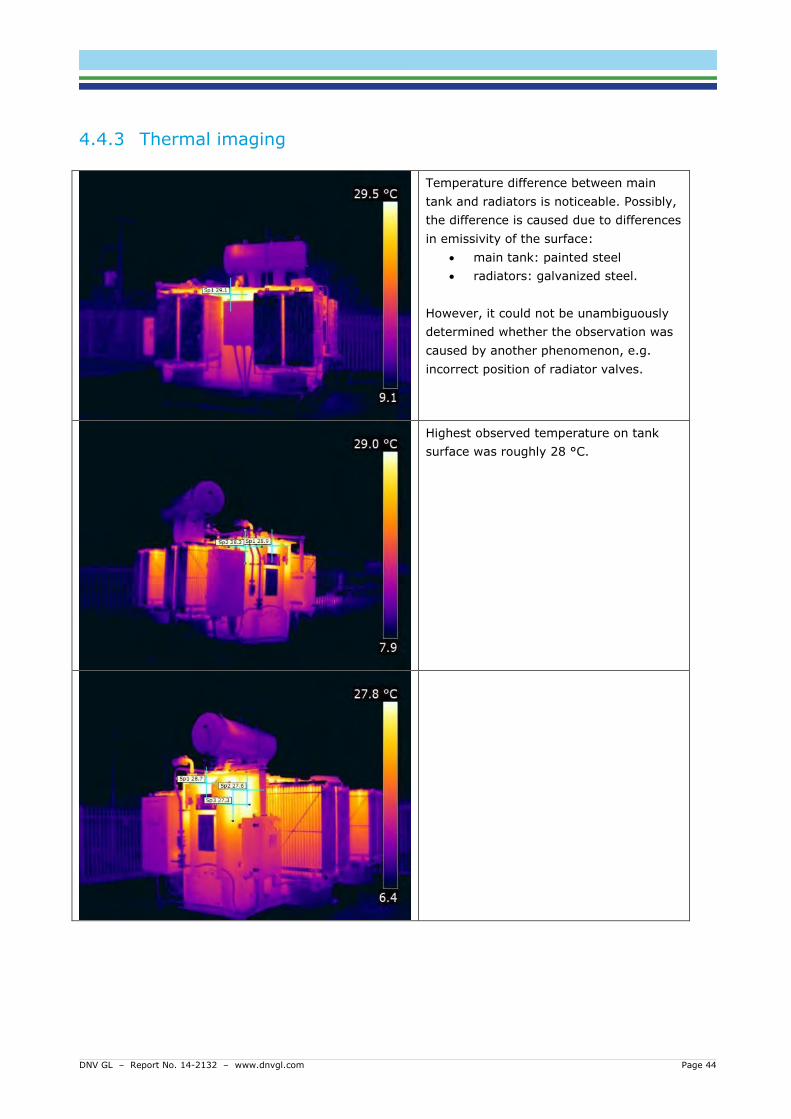
4.4.3 Thermal imaging
Temperature difference between main
tank and radiators is noticeable. Possibly,
the difference is caused due to differences
in emissivity of the surface:
main tank: painted steel
radiators: galvanized steel.
However, it could not be unambiguously
determined whether the observation was
caused by another phenomenon, e.g.
incorrect position of radiator valves.
Highest observed temperature on tank
surface was roughly 28 °C.
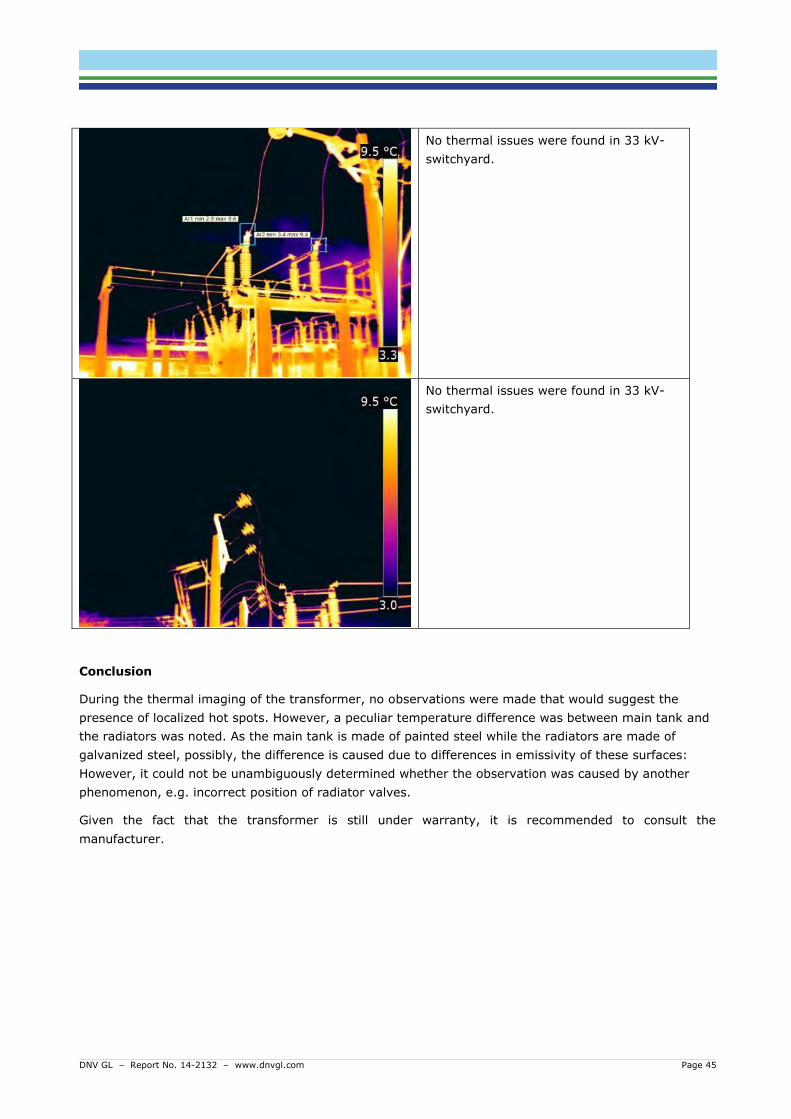
DNV GL – Report No. 14-2132 – www.dnvgl.com Page 45
No thermal issues were found in 33 kV-
switchyard.
No thermal issues were found in 33 kV-
switchyard.
Conclusion
During the thermal imaging of the transformer, no observations were made that would suggest the
presence of localized hot spots. However, a peculiar temperature difference was between main tank and
the radiators was noted. As the main tank is made of painted steel while the radiators are made of
galvanized steel, possibly, the difference is caused due to differences in emissivity of these surfaces:
However, it could not be unambiguously determined whether the observation was caused by another
phenomenon, e.g. incorrect position of radiator valves.
Given the fact that the transformer is still under warranty, it is recommended to consult the
manufacturer.
DNV GL – Report No. 14-2132 – www.dnvgl.com Page 46
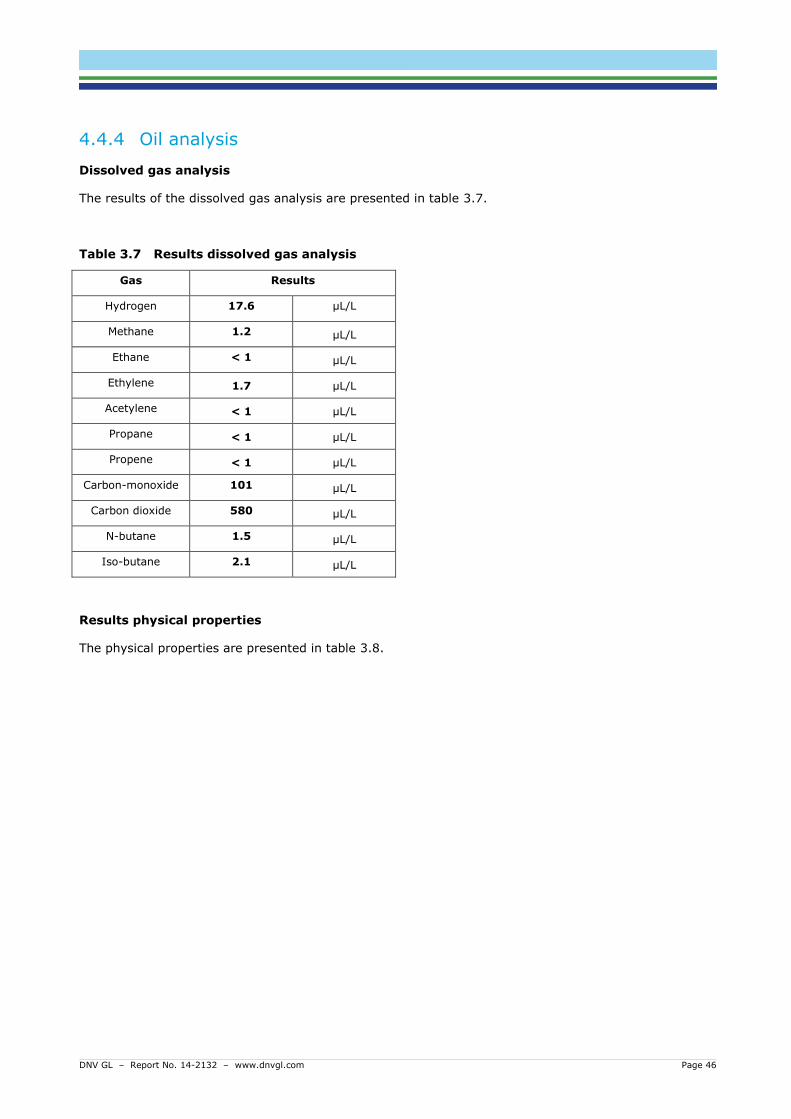
4.4.4 Oil analysis
Dissolved gas analysis
The results of the dissolved gas analysis are presented in table 3.7.
Table 3.7 Results dissolved gas analysis
Gas Results
Hydrogen 17.6 μL/L
Methane 1.2 μL/L
Ethane < 1 μL/L
Ethylene 1.7 μL/L
Acetylene < 1 μL/L
Propane < 1 μL/L
Propene < 1 μL/L
Carbon-monoxide 101 μL/L
Carbon dioxide 580 μL/L
N-butane 1.5 μL/L
Iso-butane 2.1 μL/L
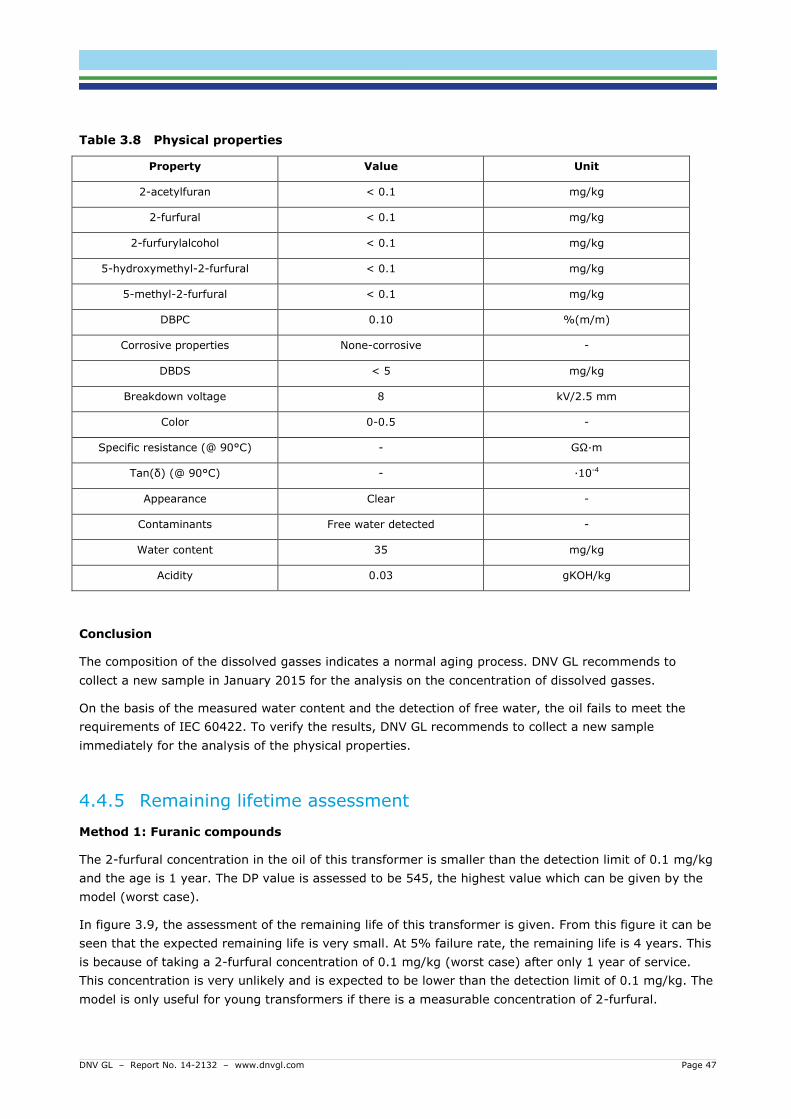
Results physical properties
The physical properties are presented in table 3.8.
DNV GL – Report No. 14-2132 – www.dnvgl.com Page 47
Table 3.8 Physical properties
Property Value Unit
2-acetylfuran < 0.1 mg/kg
2-furfural < 0.1 mg/kg
2-furfurylalcohol < 0.1 mg/kg
5-hydroxymethyl-2-furfural < 0.1 mg/kg
5-methyl-2-furfural < 0.1 mg/kg
DBPC 0.10 %(m/m)
Corrosive properties None-corrosive -
DBDS < 5 mg/kg
Breakdown voltage 8 kV/2.5 mm
Color 0-0.5 -
Specific resistance (@ 90°C) - GΩ∙m
Tan(δ) (@ 90°C) - ∙10-4
Appearance Clear -
Contaminants Free water detected -
Water content 35 mg/kg
Acidity 0.03 gKOH/kg
Conclusion
The composition of the dissolved gasses indicates a normal aging process. DNV GL recommends to
collect a new sample in January 2015 for the analysis on the concentration of dissolved gasses.
On the basis of the measured water content and the detection of free water, the oil fails to meet the
requirements of IEC 60422. To verify the results, DNV GL recommends to collect a new sample
immediately for the analysis of the physical properties.
4.4.5 Remaining lifetime assessment
Method 1: Furanic compounds
The 2-furfural concentration in the oil of this transformer is smaller than the detection limit of 0.1 mg/kg
and the age is 1 year. The DP value is assessed to be 545, the highest value which can be given by the
model (worst case).
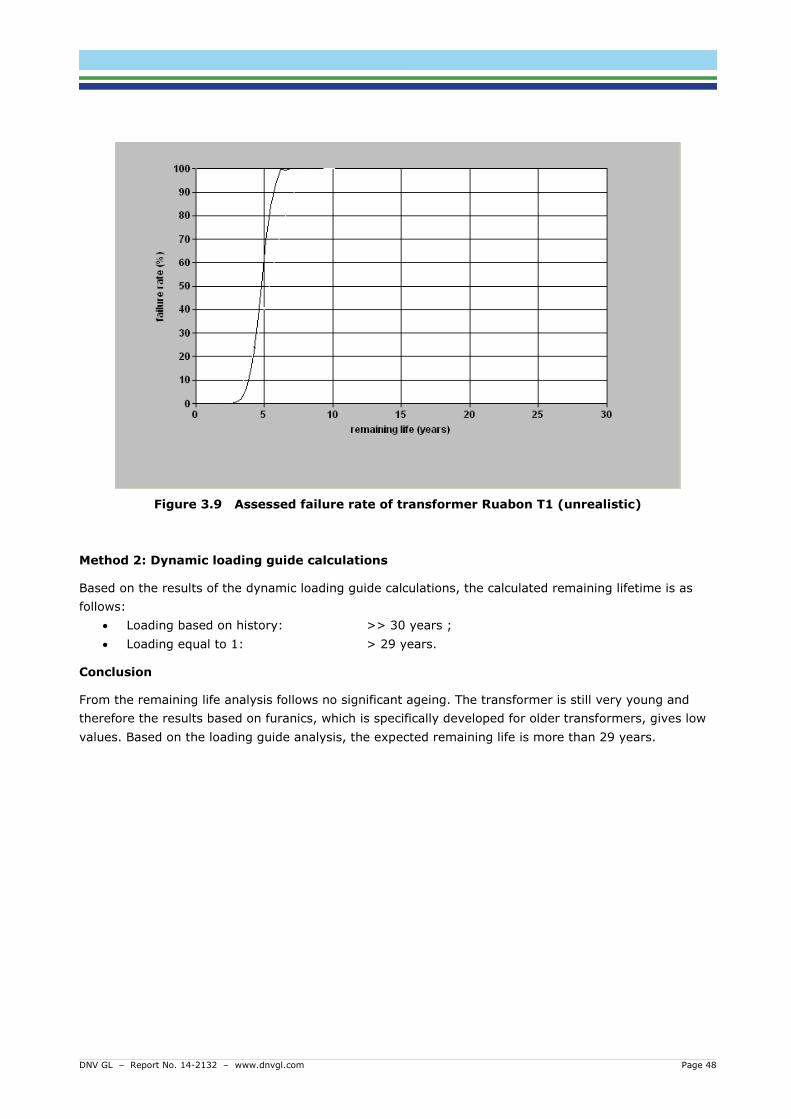
In figure 3.9, the assessment of the remaining life of this transformer is given. From this figure it can be
seen that the expected remaining life is very small. At 5% failure rate, the remaining life is 4 years. This
is because of taking a 2-furfural concentration of 0.1 mg/kg (worst case) after only 1 year of service.
This concentration is very unlikely and is expected to be lower than the detection limit of 0.1 mg/kg. The
model is only useful for young transformers if there is a measurable concentration of 2-furfural.
DNV GL – Report No. 14-2132 – www.dnvgl.com Page 48
Figure 3.9 Assessed failure rate of transformer Ruabon T1 (unrealistic)
Method 2: Dynamic loading guide calculations
Based on the results of the dynamic loading guide calculations, the calculated remaining lifetime is as
follows:
Loading based on history: >> 30 years ;
Loading equal to 1: > 29 years.
Conclusion
From the remaining life analysis follows no significant ageing. The transformer is still very young and
therefore the results based on furanics, which is specifically developed for older transformers, gives low
values. Based on the loading guide analysis, the expected remaining life is more than 29 years.
DNV GL – Report No. 14-2132 – www.dnvgl.com Page 49
4.5 St. Andrews – Transformer 1
4.5.1 Visual inspection
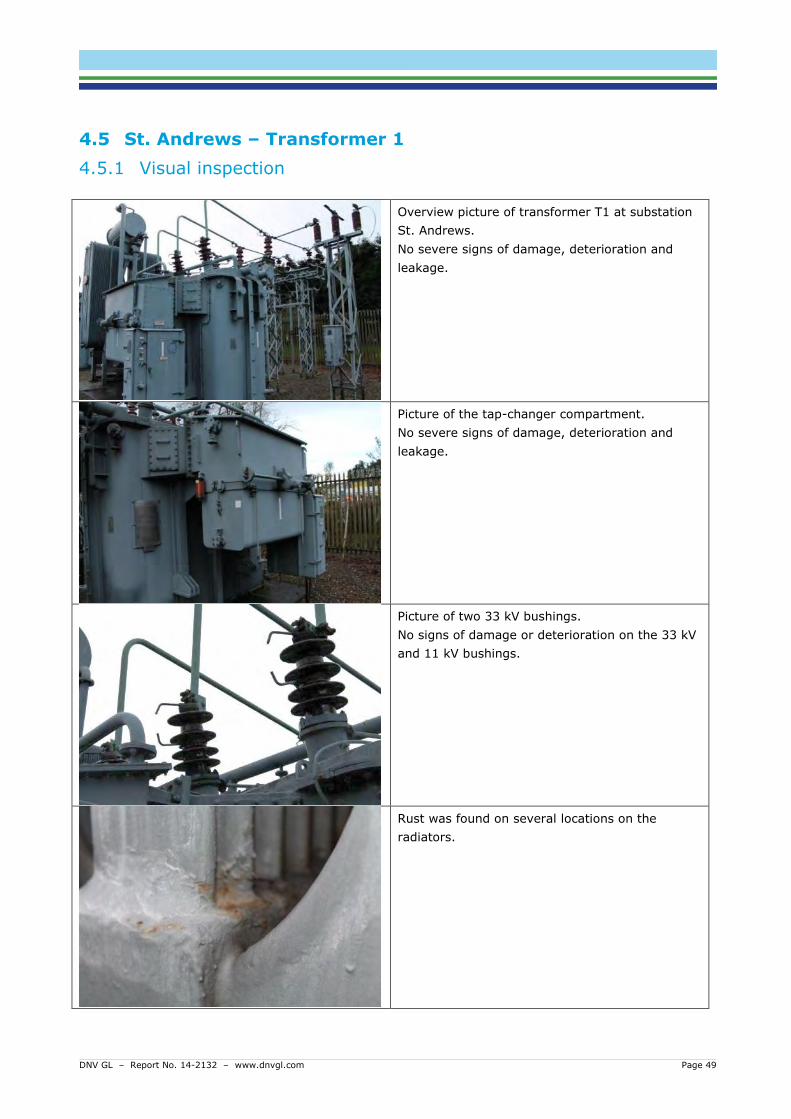
Overview picture of transformer T1 at substation
St. Andrews.
No severe signs of damage, deterioration and
leakage.
Picture of the tap-changer compartment.
No severe signs of damage, deterioration and
leakage.
Picture of two 33 kV bushings.
No signs of damage or deterioration on the 33 kV
and 11 kV bushings.
Rust was found on several locations on the
radiators.
DNV GL – Report No. 14-2132 – www.dnvgl.com Page 50
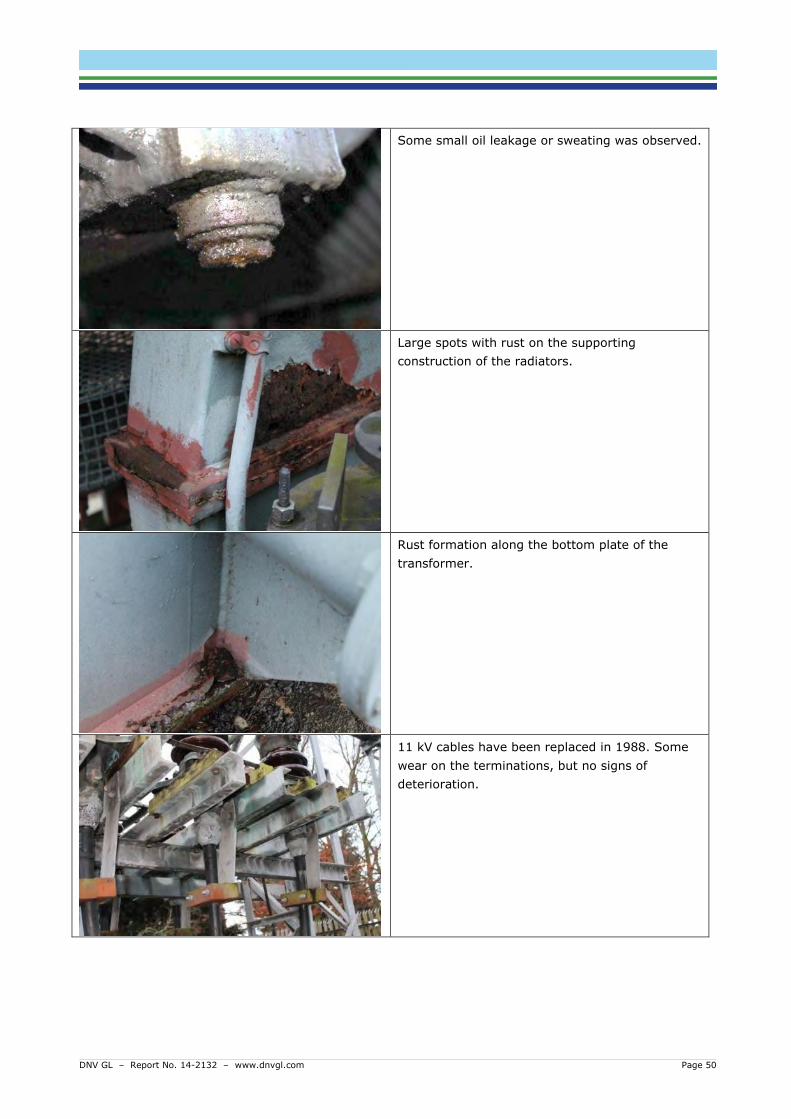
Some small oil leakage or sweating was observed.
Large spots with rust on the supporting
construction of the radiators.
Rust formation along the bottom plate of the
transformer.
11 kV cables have been replaced in 1988. Some
wear on the terminations, but no signs of
deterioration.
DNV GL – Report No. 14-2132 – www.dnvgl.com Page 51
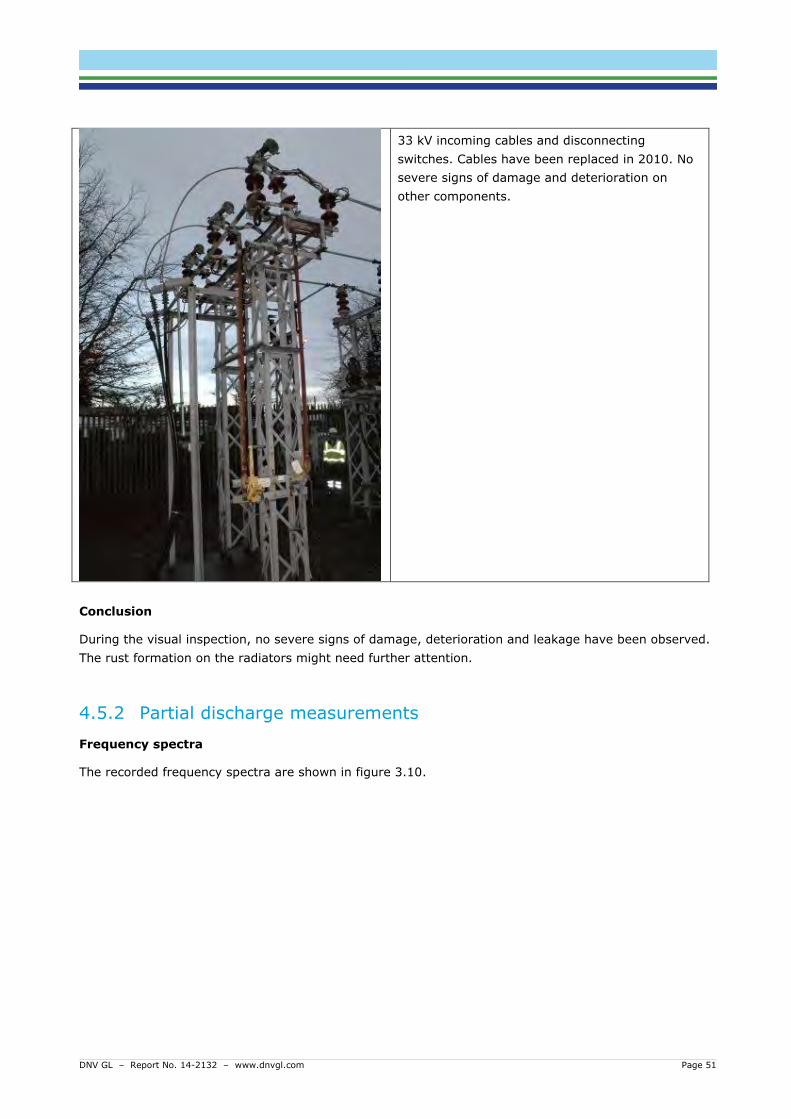
33 kV incoming cables and disconnecting
switches. Cables have been replaced in 2010. No
severe signs of damage and deterioration on
other components.
Conclusion
During the visual inspection, no severe signs of damage, deterioration and leakage have been observed.
The rust formation on the radiators might need further attention.
4.5.2 Partial discharge measurements
Frequency spectra
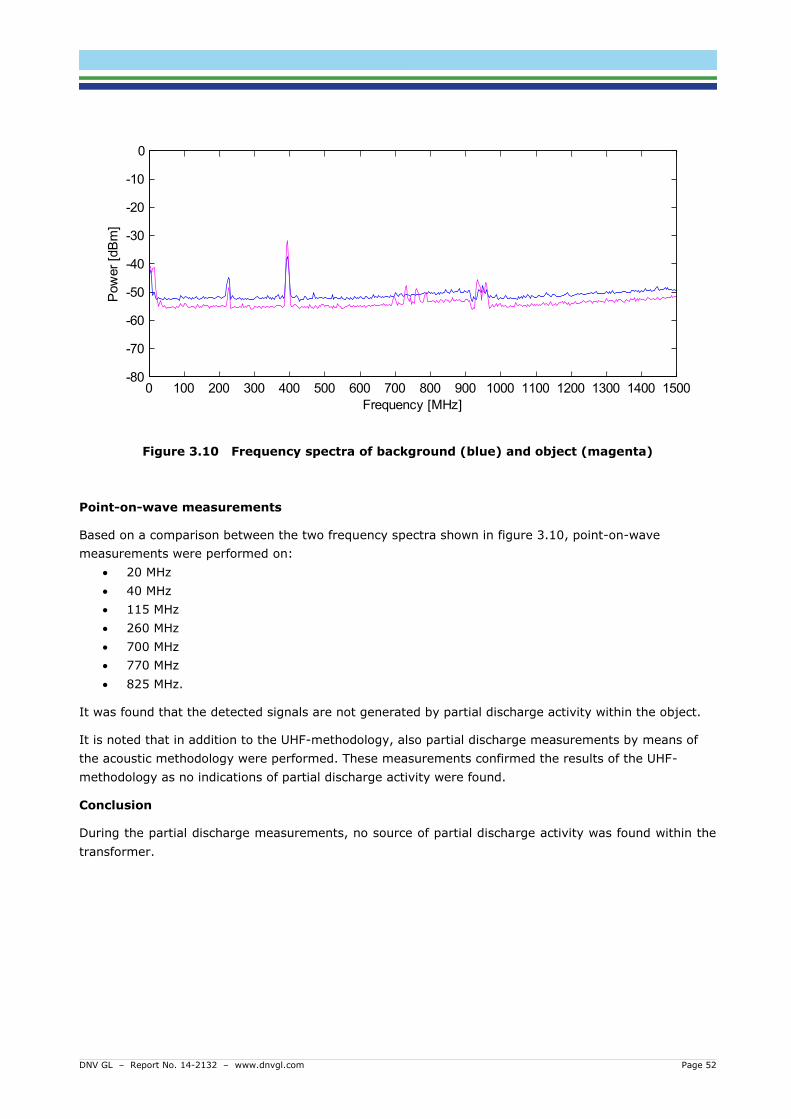
The recorded frequency spectra are shown in figure 3.10.
DNV GL – Report No. 14-2132 – www.dnvgl.com Page 52
Figure 3.10 Frequency spectra of background (blue) and object (magenta)
Point-on-wave measurements
Based on a comparison between the two frequency spectra shown in figure 3.10, point-on-wave
measurements were performed on:
20 MHz
40 MHz
115 MHz
260 MHz
700 MHz
770 MHz
825 MHz.
It was found that the detected signals are not generated by partial discharge activity within the object.
It is noted that in addition to the UHF-methodology, also partial discharge measurements by means of
the acoustic methodology were performed. These measurements confirmed the results of the UHF-
methodology as no indications of partial discharge activity were found.
Conclusion
During the partial discharge measurements, no source of partial discharge activity was found within the
transformer.
0 100 200 300 400 500 600 700 800 900 1000 1100 1200 1300 1400 1500-80
-70
-60
-50
-40
-30
-20
-10
0
Pow
er
[dB
m]
Frequency [MHz]
DNV GL – Report No. 14-2132 – www.dnvgl.com Page 53
4.5.3 Thermal imaging
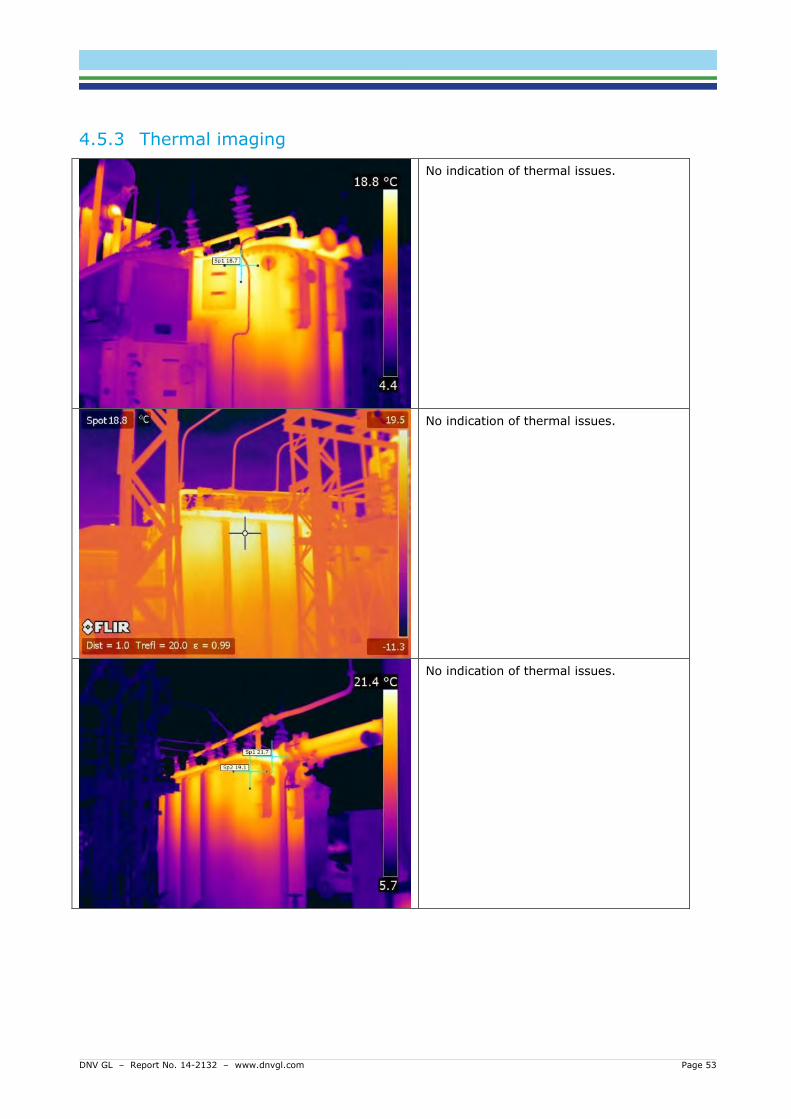
No indication of thermal issues.
No indication of thermal issues.
No indication of thermal issues.
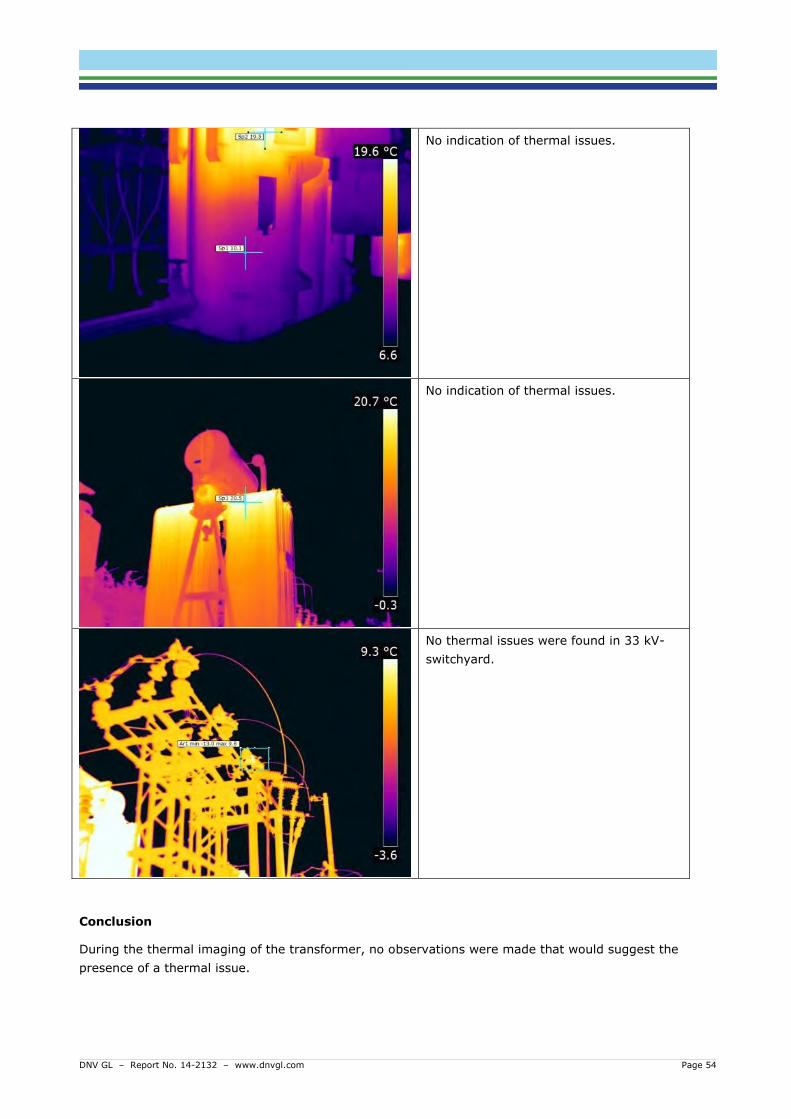
DNV GL – Report No. 14-2132 – www.dnvgl.com Page 54
No indication of thermal issues.
No indication of thermal issues.
No thermal issues were found in 33 kV-
switchyard.
Conclusion
During the thermal imaging of the transformer, no observations were made that would suggest the
presence of a thermal issue.
DNV GL – Report No. 14-2132 – www.dnvgl.com Page 55
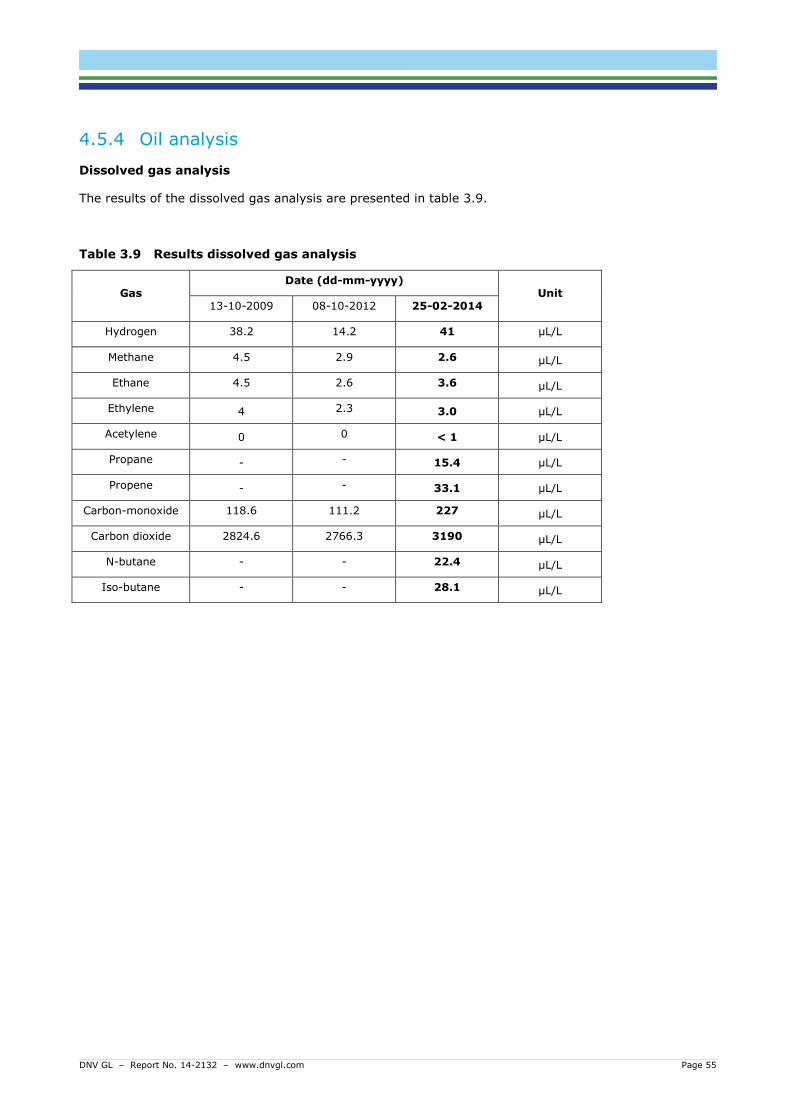
4.5.4 Oil analysis
Dissolved gas analysis
The results of the dissolved gas analysis are presented in table 3.9.
Table 3.9 Results dissolved gas analysis
Gas Date (dd-mm-yyyy)
Unit 13-10-2009 08-10-2012 25-02-2014
Hydrogen 38.2 14.2 41 μL/L
Methane 4.5 2.9 2.6 μL/L
Ethane 4.5 2.6 3.6 μL/L
Ethylene 4 2.3 3.0 μL/L
Acetylene 0 0 < 1 μL/L
Propane - - 15.4 μL/L
Propene - - 33.1 μL/L
Carbon-monoxide 118.6 111.2 227 μL/L
Carbon dioxide 2824.6 2766.3 3190 μL/L
N-butane - - 22.4 μL/L
Iso-butane - - 28.1 μL/L
DNV GL – Report No. 14-2132 – www.dnvgl.com Page 56
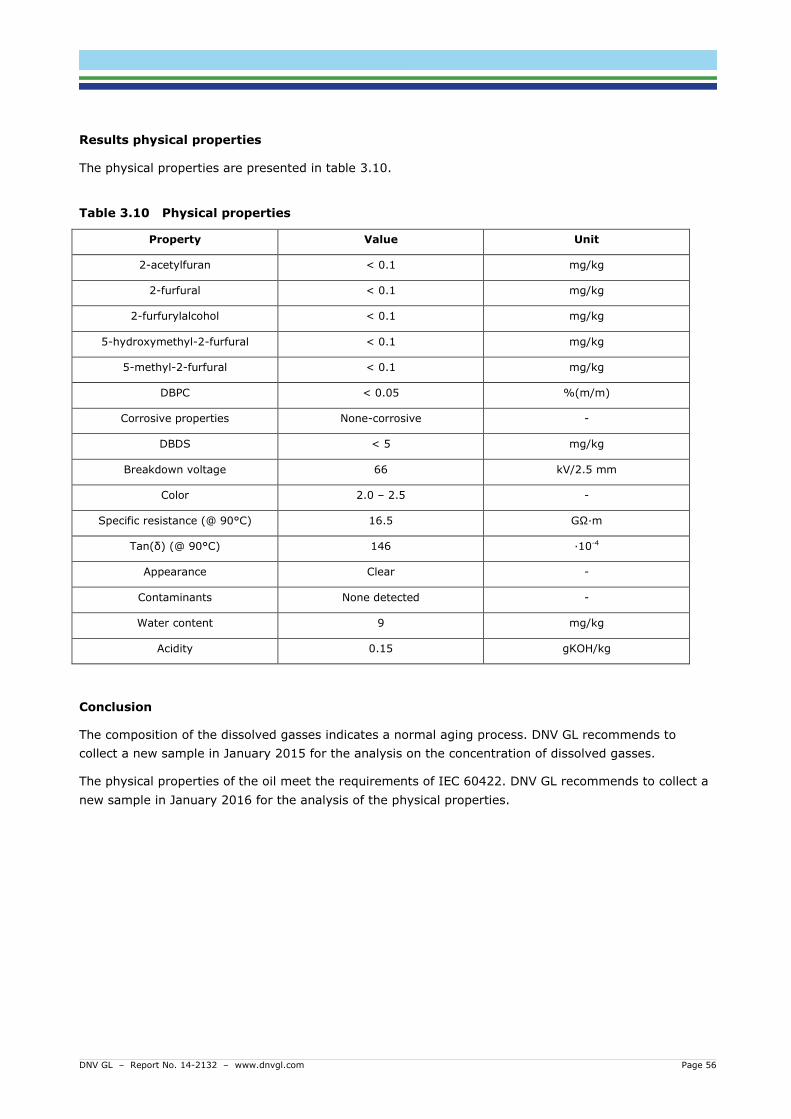
Results physical properties
The physical properties are presented in table 3.10.
Table 3.10 Physical properties
Property Value Unit
2-acetylfuran < 0.1 mg/kg
2-furfural < 0.1 mg/kg
2-furfurylalcohol < 0.1 mg/kg
5-hydroxymethyl-2-furfural < 0.1 mg/kg
5-methyl-2-furfural < 0.1 mg/kg
DBPC < 0.05 %(m/m)
Corrosive properties None-corrosive -
DBDS < 5 mg/kg
Breakdown voltage 66 kV/2.5 mm
Color 2.0 – 2.5 -
Specific resistance (@ 90°C) 16.5 GΩ∙m
Tan(δ) (@ 90°C) 146 ∙10-4
Appearance Clear -
Contaminants None detected -
Water content 9 mg/kg
Acidity 0.15 gKOH/kg
Conclusion
The composition of the dissolved gasses indicates a normal aging process. DNV GL recommends to
collect a new sample in January 2015 for the analysis on the concentration of dissolved gasses.
The physical properties of the oil meet the requirements of IEC 60422. DNV GL recommends to collect a
new sample in January 2016 for the analysis of the physical properties.
DNV GL – Report No. 14-2132 – www.dnvgl.com Page 57
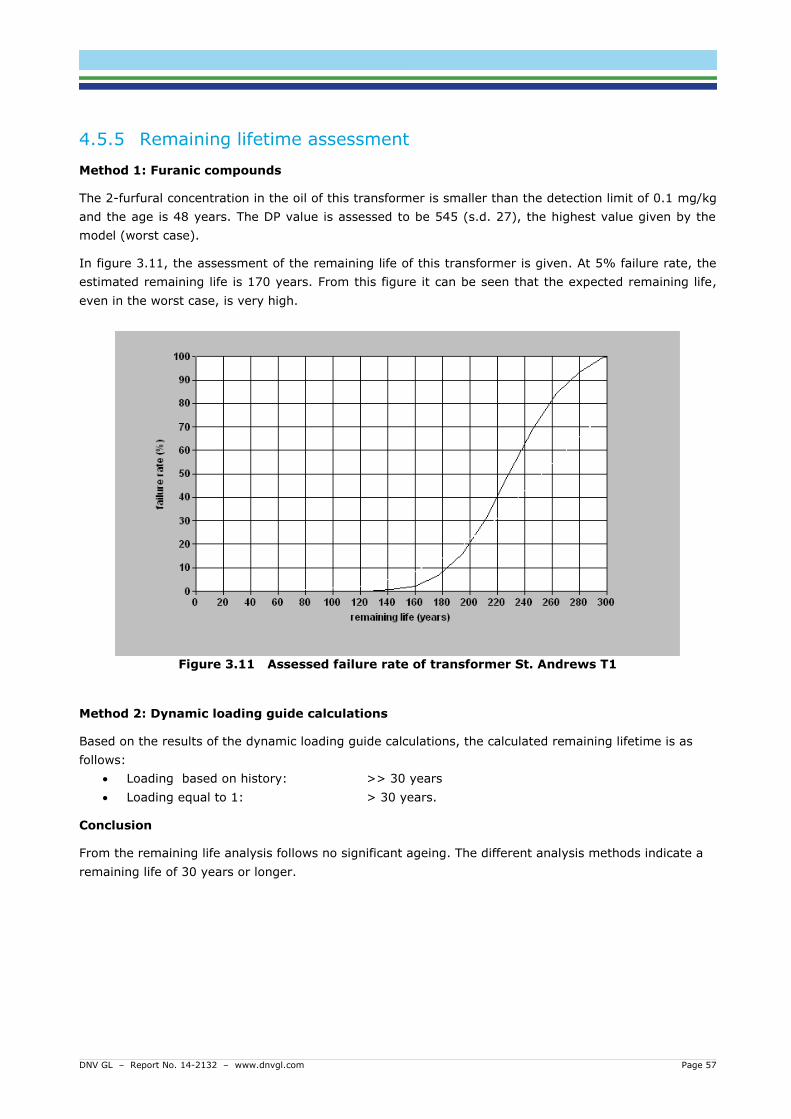
4.5.5 Remaining lifetime assessment
Method 1: Furanic compounds
The 2-furfural concentration in the oil of this transformer is smaller than the detection limit of 0.1 mg/kg
and the age is 48 years. The DP value is assessed to be 545 (s.d. 27), the highest value given by the
model (worst case).
In figure 3.11, the assessment of the remaining life of this transformer is given. At 5% failure rate, the
estimated remaining life is 170 years. From this figure it can be seen that the expected remaining life,
even in the worst case, is very high.
Figure 3.11 Assessed failure rate of transformer St. Andrews T1
Method 2: Dynamic loading guide calculations
Based on the results of the dynamic loading guide calculations, the calculated remaining lifetime is as
follows:
Loading based on history: >> 30 years
Loading equal to 1: > 30 years.
Conclusion
From the remaining life analysis follows no significant ageing. The different analysis methods indicate a
remaining life of 30 years or longer.
DNV GL – Report No. 14-2132 – www.dnvgl.com Page 58
4.6 St. Andrews – Transformer 2
4.6.1 Visual inspection
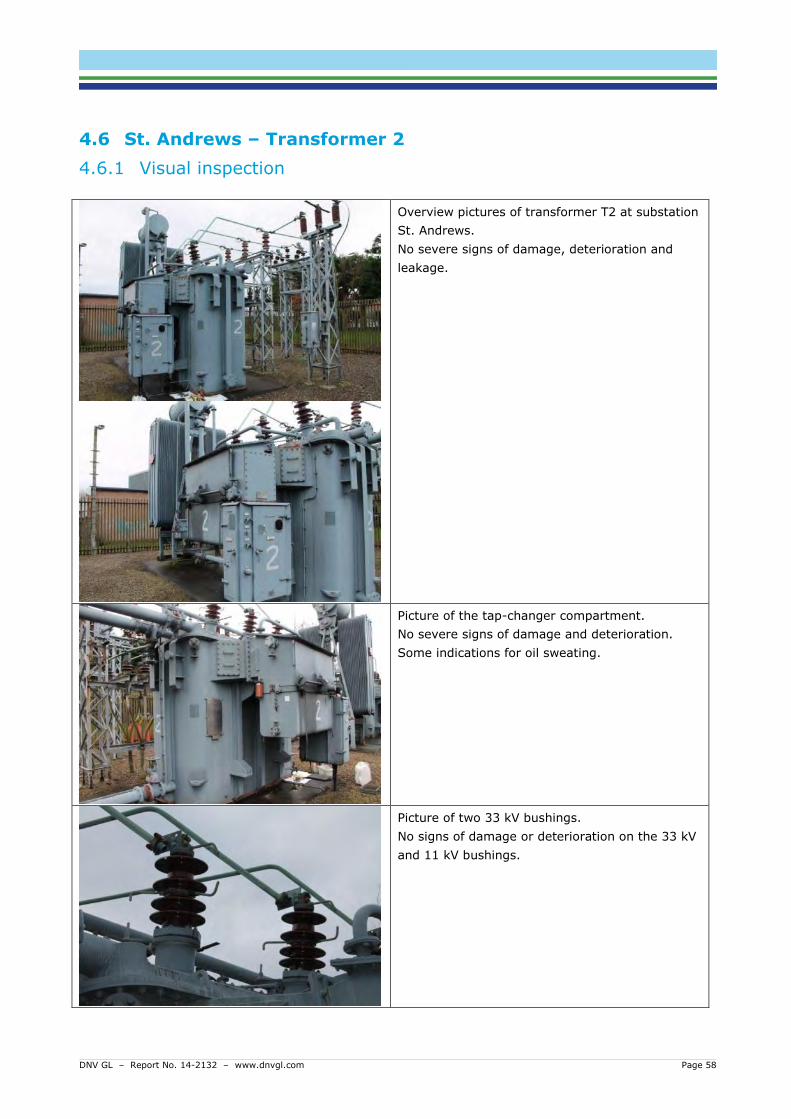
Overview pictures of transformer T2 at substation
St. Andrews.
No severe signs of damage, deterioration and
leakage.
Picture of the tap-changer compartment.
No severe signs of damage and deterioration.
Some indications for oil sweating.
Picture of two 33 kV bushings.
No signs of damage or deterioration on the 33 kV
and 11 kV bushings.
DNV GL – Report No. 14-2132 – www.dnvgl.com Page 59
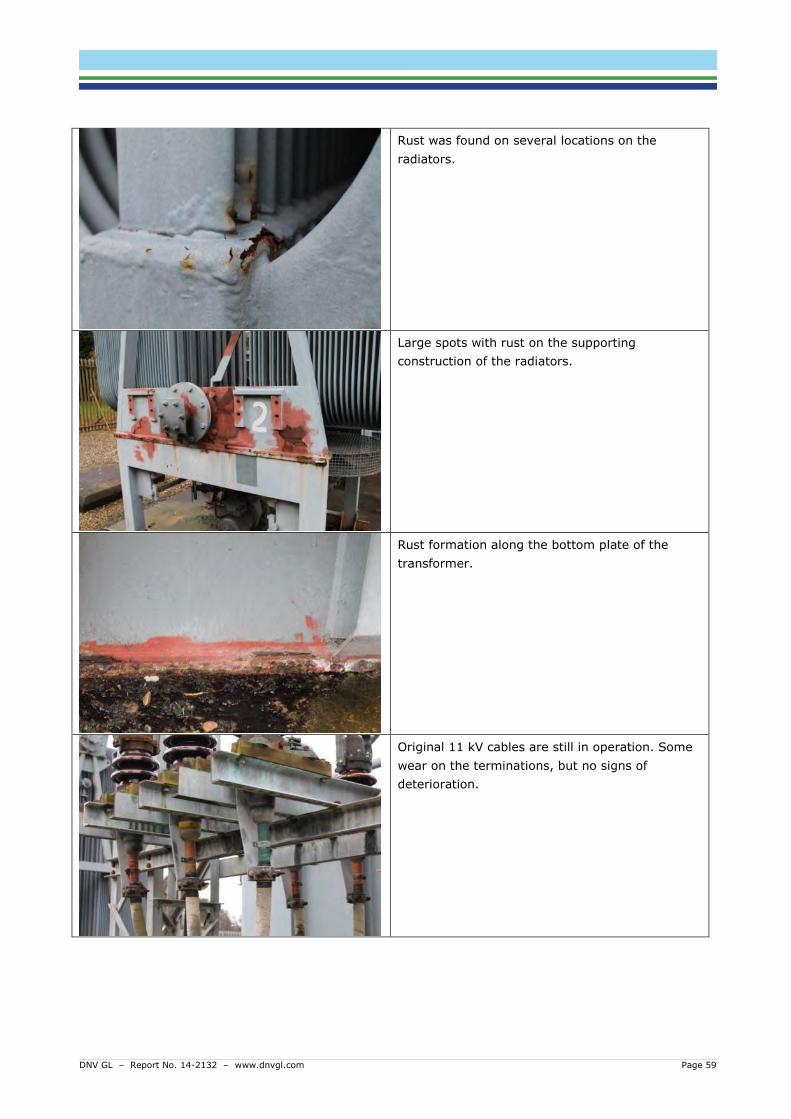
Rust was found on several locations on the
radiators.
Large spots with rust on the supporting
construction of the radiators.
Rust formation along the bottom plate of the
transformer.
Original 11 kV cables are still in operation. Some
wear on the terminations, but no signs of
deterioration.
DNV GL – Report No. 14-2132 – www.dnvgl.com Page 60
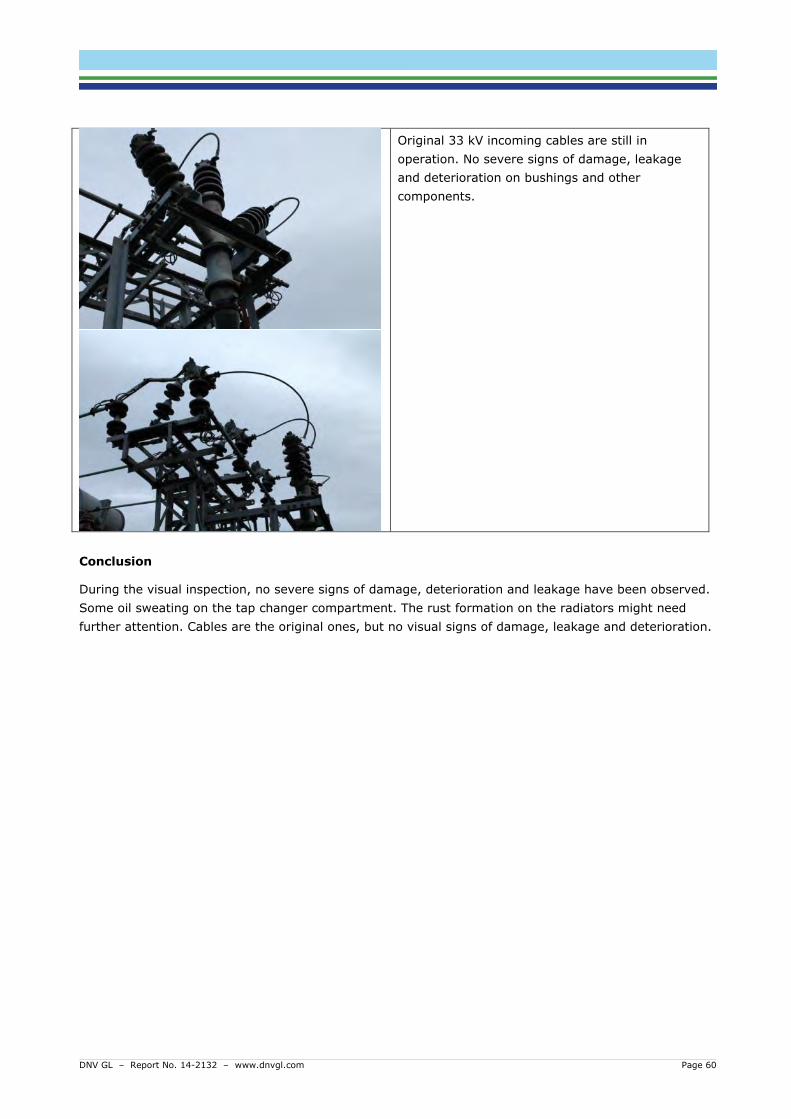
Original 33 kV incoming cables are still in
operation. No severe signs of damage, leakage
and deterioration on bushings and other
components.
Conclusion
During the visual inspection, no severe signs of damage, deterioration and leakage have been observed.
Some oil sweating on the tap changer compartment. The rust formation on the radiators might need
further attention. Cables are the original ones, but no visual signs of damage, leakage and deterioration.
DNV GL – Report No. 14-2132 – www.dnvgl.com Page 61
4.6.2 Partial discharge measurements
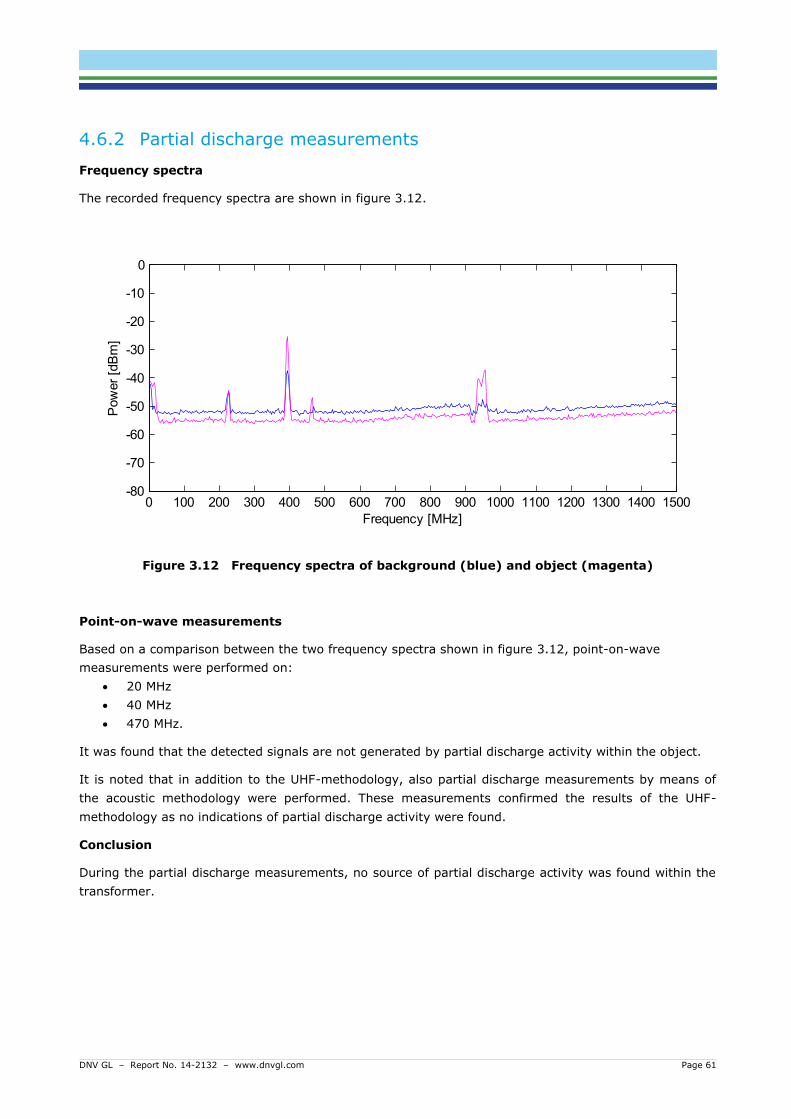
Frequency spectra
The recorded frequency spectra are shown in figure 3.12.
Figure 3.12 Frequency spectra of background (blue) and object (magenta)
Point-on-wave measurements
Based on a comparison between the two frequency spectra shown in figure 3.12, point-on-wave
measurements were performed on:
20 MHz
40 MHz
470 MHz.
It was found that the detected signals are not generated by partial discharge activity within the object.
It is noted that in addition to the UHF-methodology, also partial discharge measurements by means of
the acoustic methodology were performed. These measurements confirmed the results of the UHF-
methodology as no indications of partial discharge activity were found.
Conclusion
During the partial discharge measurements, no source of partial discharge activity was found within the
transformer.
0 100 200 300 400 500 600 700 800 900 1000 1100 1200 1300 1400 1500-80
-70
-60
-50
-40
-30
-20
-10
0
Pow
er
[dB
m]
Frequency [MHz]
DNV GL – Report No. 14-2132 – www.dnvgl.com Page 62
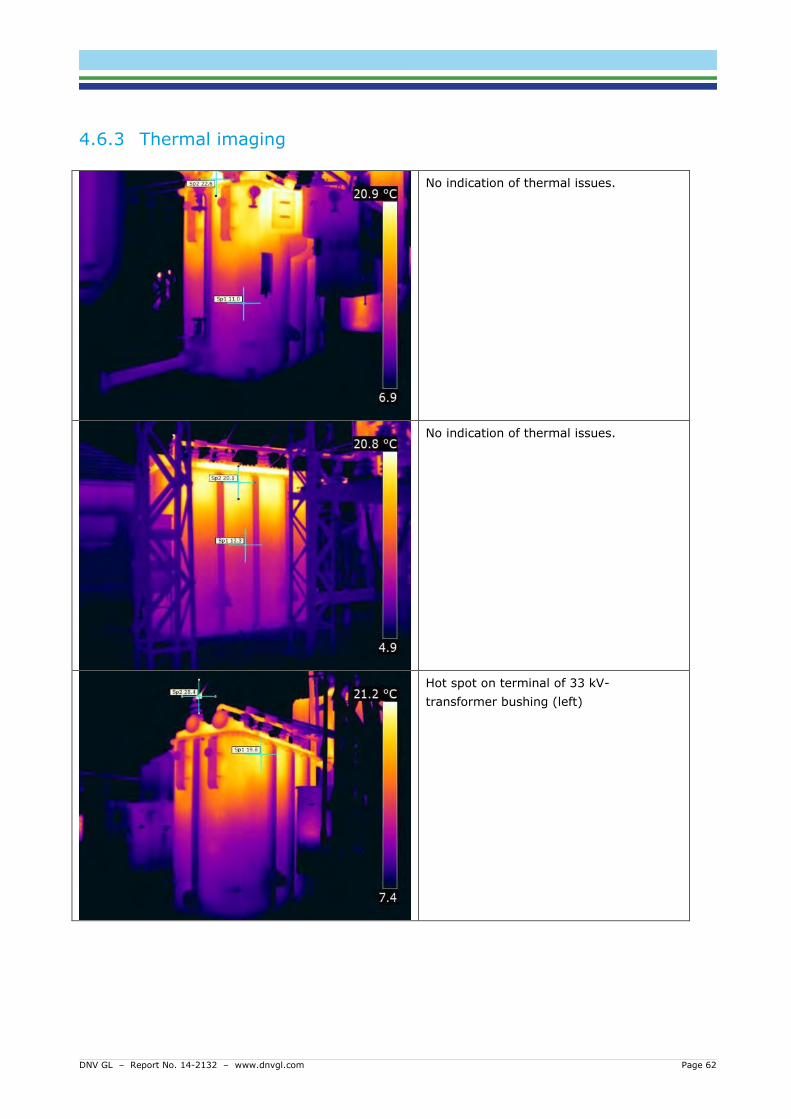
4.6.3 Thermal imaging
No indication of thermal issues.
No indication of thermal issues.
Hot spot on terminal of 33 kV-
transformer bushing (left)
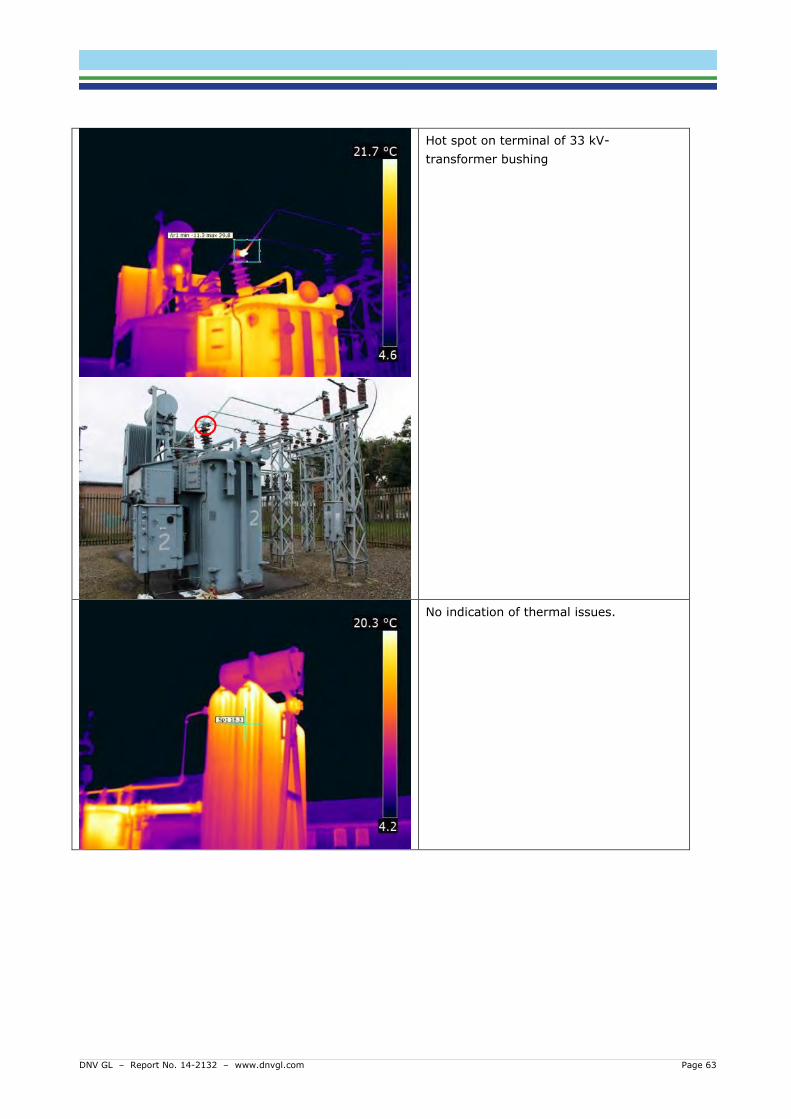
DNV GL – Report No. 14-2132 – www.dnvgl.com Page 63
Hot spot on terminal of 33 kV-
transformer bushing
No indication of thermal issues.
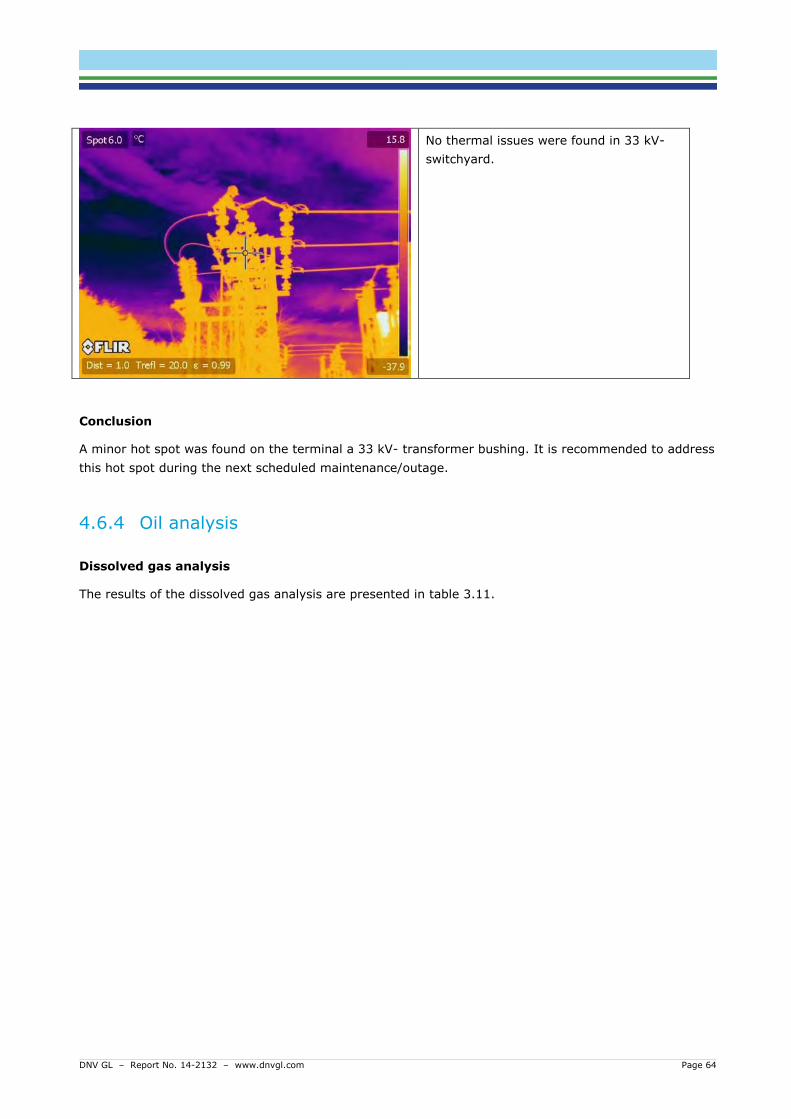
DNV GL – Report No. 14-2132 – www.dnvgl.com Page 64
No thermal issues were found in 33 kV-
switchyard.
Conclusion
A minor hot spot was found on the terminal a 33 kV- transformer bushing. It is recommended to address
this hot spot during the next scheduled maintenance/outage.
4.6.4 Oil analysis
Dissolved gas analysis
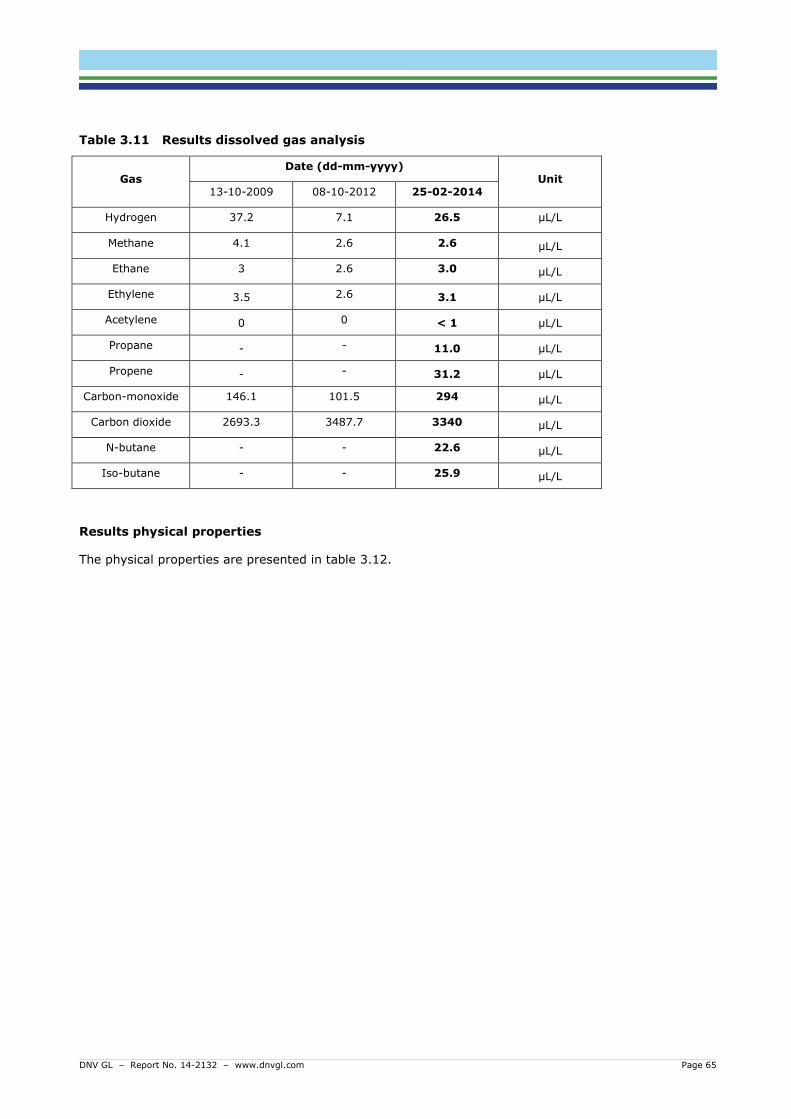
The results of the dissolved gas analysis are presented in table 3.11.
DNV GL – Report No. 14-2132 – www.dnvgl.com Page 65
Table 3.11 Results dissolved gas analysis
Gas Date (dd-mm-yyyy)
Unit 13-10-2009 08-10-2012 25-02-2014
Hydrogen 37.2 7.1 26.5 μL/L
Methane 4.1 2.6 2.6 μL/L
Ethane 3 2.6 3.0 μL/L
Ethylene 3.5 2.6 3.1 μL/L
Acetylene 0 0 < 1 μL/L
Propane - - 11.0 μL/L
Propene - - 31.2 μL/L
Carbon-monoxide 146.1 101.5 294 μL/L
Carbon dioxide 2693.3 3487.7 3340 μL/L
N-butane - - 22.6 μL/L
Iso-butane - - 25.9 μL/L
Results physical properties
The physical properties are presented in table 3.12.
DNV GL – Report No. 14-2132 – www.dnvgl.com Page 66
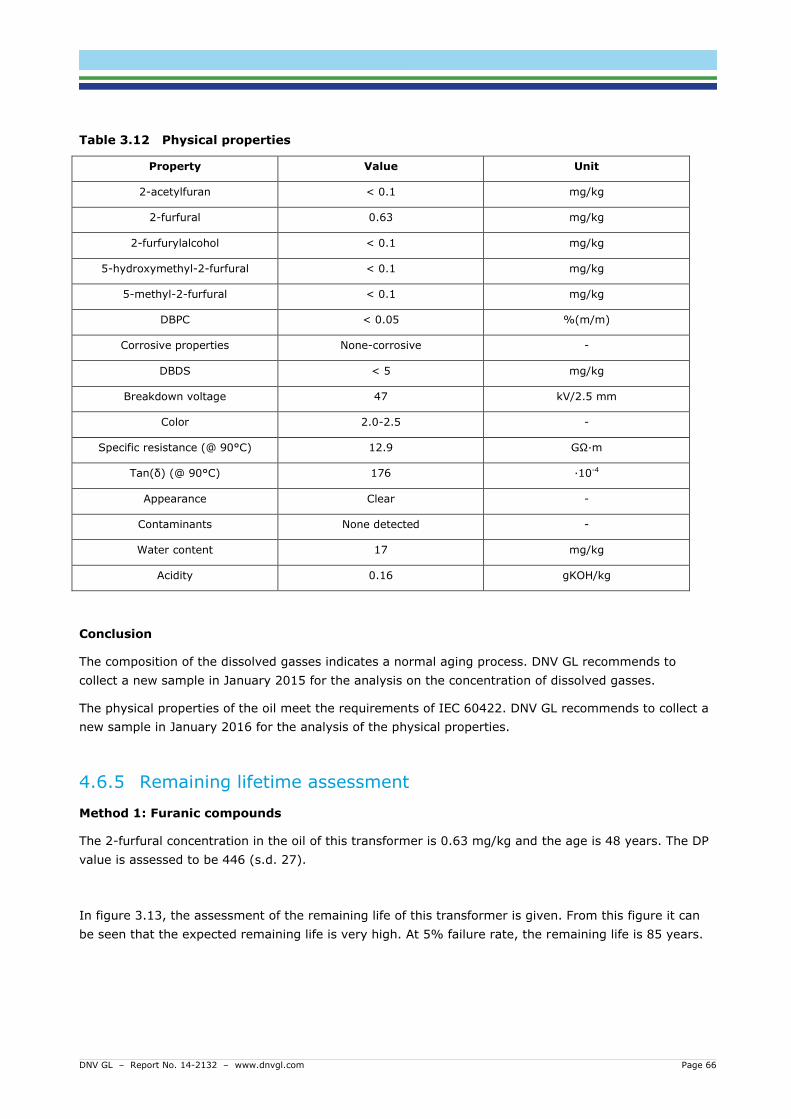
Table 3.12 Physical properties
Property Value Unit
2-acetylfuran < 0.1 mg/kg
2-furfural 0.63 mg/kg
2-furfurylalcohol < 0.1 mg/kg
5-hydroxymethyl-2-furfural < 0.1 mg/kg
5-methyl-2-furfural < 0.1 mg/kg
DBPC < 0.05 %(m/m)
Corrosive properties None-corrosive -
DBDS < 5 mg/kg
Breakdown voltage 47 kV/2.5 mm
Color 2.0-2.5 -
Specific resistance (@ 90°C) 12.9 GΩ∙m
Tan(δ) (@ 90°C) 176 ∙10-4
Appearance Clear -
Contaminants None detected -
Water content 17 mg/kg
Acidity 0.16 gKOH/kg
Conclusion
The composition of the dissolved gasses indicates a normal aging process. DNV GL recommends to
collect a new sample in January 2015 for the analysis on the concentration of dissolved gasses.
The physical properties of the oil meet the requirements of IEC 60422. DNV GL recommends to collect a
new sample in January 2016 for the analysis of the physical properties.
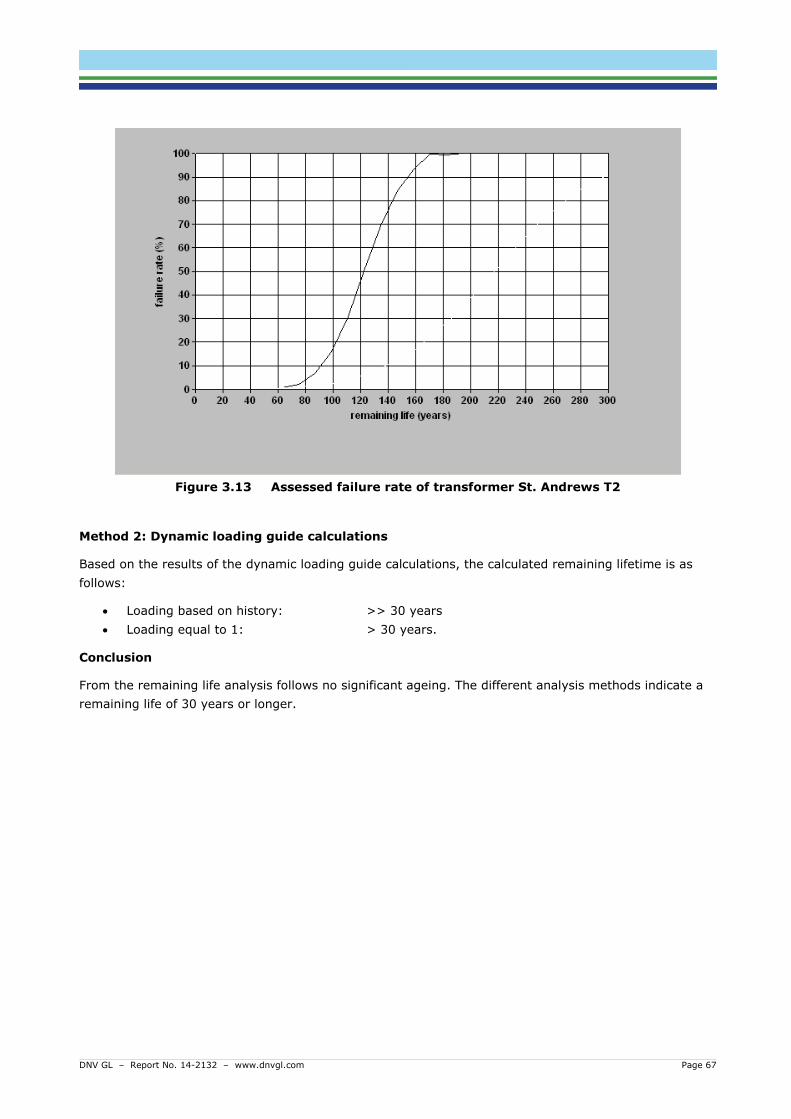
4.6.5 Remaining lifetime assessment
Method 1: Furanic compounds
The 2-furfural concentration in the oil of this transformer is 0.63 mg/kg and the age is 48 years. The DP
value is assessed to be 446 (s.d. 27).
In figure 3.13, the assessment of the remaining life of this transformer is given. From this figure it can
be seen that the expected remaining life is very high. At 5% failure rate, the remaining life is 85 years.
DNV GL – Report No. 14-2132 – www.dnvgl.com Page 67
Figure 3.13 Assessed failure rate of transformer St. Andrews T2
Method 2: Dynamic loading guide calculations
Based on the results of the dynamic loading guide calculations, the calculated remaining lifetime is as
follows:
Loading based on history: >> 30 years
Loading equal to 1: > 30 years.
Conclusion
From the remaining life analysis follows no significant ageing. The different analysis methods indicate a
remaining life of 30 years or longer.
DNV GL – Report No. 14-2132 – www.dnvgl.com Page 68
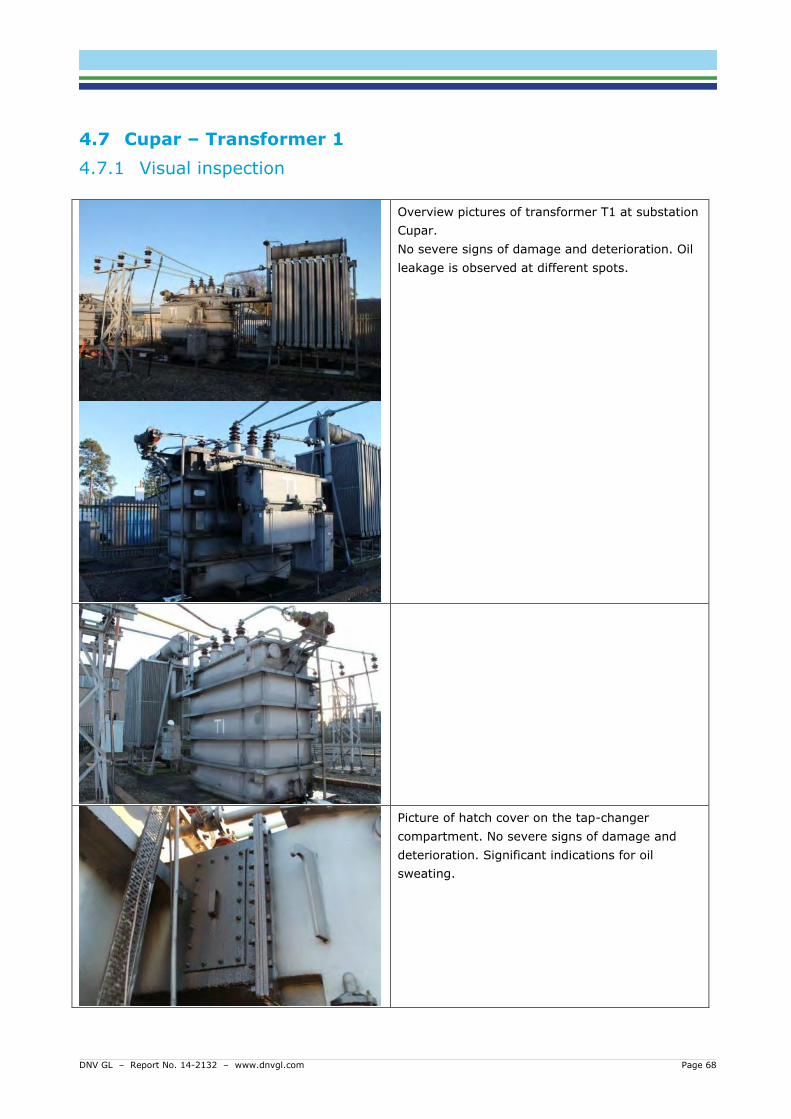
4.7 Cupar – Transformer 1
4.7.1 Visual inspection
Overview pictures of transformer T1 at substation
Cupar.
No severe signs of damage and deterioration. Oil
leakage is observed at different spots.
Picture of hatch cover on the tap-changer
compartment. No severe signs of damage and
deterioration. Significant indications for oil
sweating.
DNV GL – Report No. 14-2132 – www.dnvgl.com Page 69
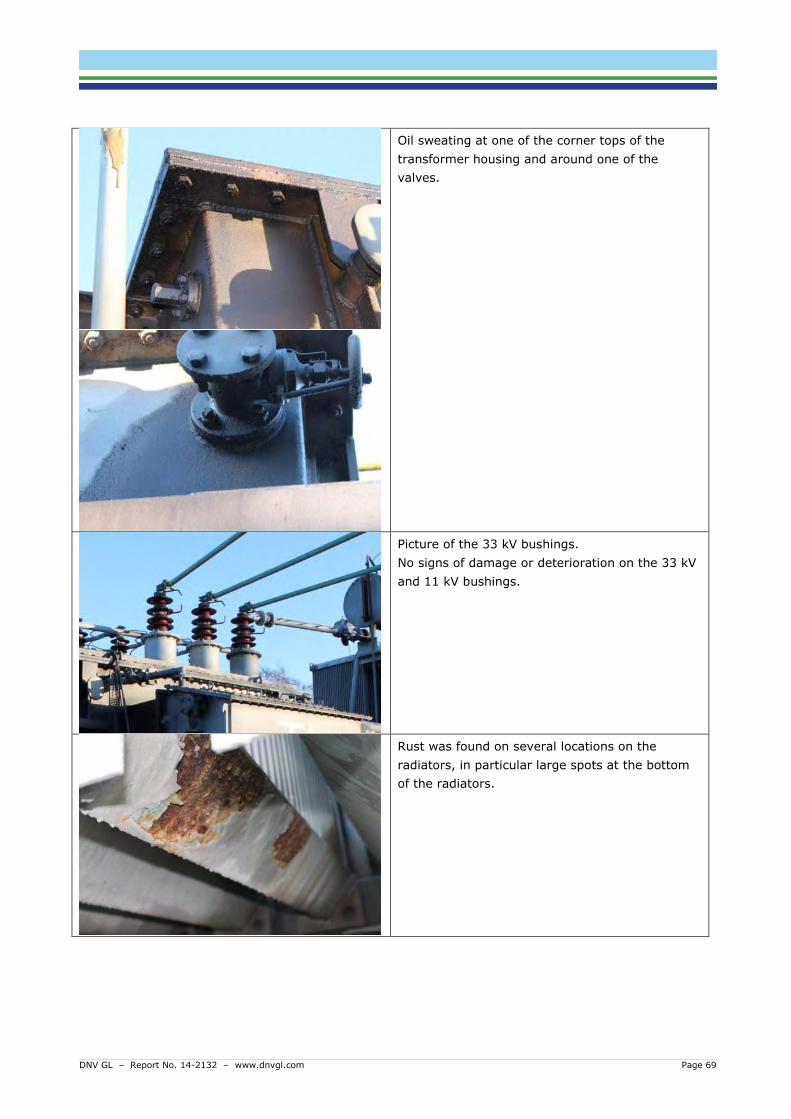
Oil sweating at one of the corner tops of the
transformer housing and around one of the
valves.
Picture of the 33 kV bushings.
No signs of damage or deterioration on the 33 kV
and 11 kV bushings.
Rust was found on several locations on the
radiators, in particular large spots at the bottom
of the radiators.
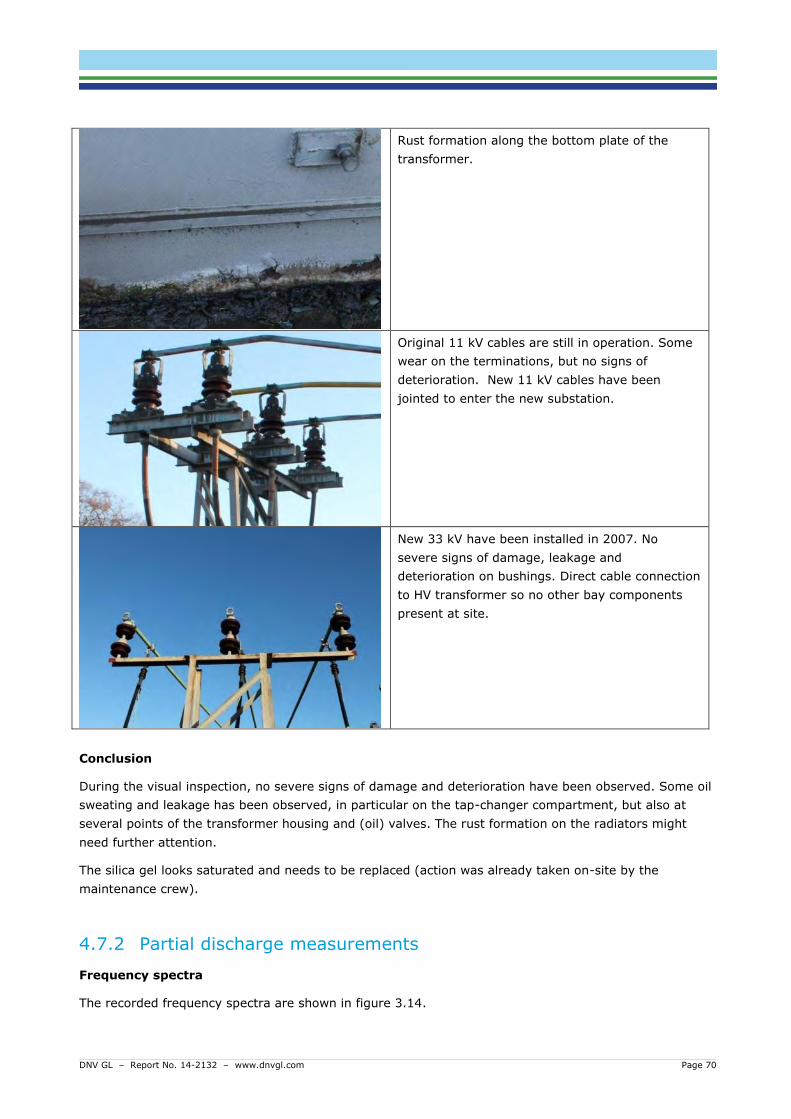
DNV GL – Report No. 14-2132 – www.dnvgl.com Page 70
Rust formation along the bottom plate of the
transformer.
Original 11 kV cables are still in operation. Some
wear on the terminations, but no signs of
deterioration. New 11 kV cables have been
jointed to enter the new substation.
New 33 kV have been installed in 2007. No
severe signs of damage, leakage and
deterioration on bushings. Direct cable connection
to HV transformer so no other bay components
present at site.
Conclusion
During the visual inspection, no severe signs of damage and deterioration have been observed. Some oil
sweating and leakage has been observed, in particular on the tap-changer compartment, but also at
several points of the transformer housing and (oil) valves. The rust formation on the radiators might
need further attention.
The silica gel looks saturated and needs to be replaced (action was already taken on-site by the
maintenance crew).
4.7.2 Partial discharge measurements
Frequency spectra
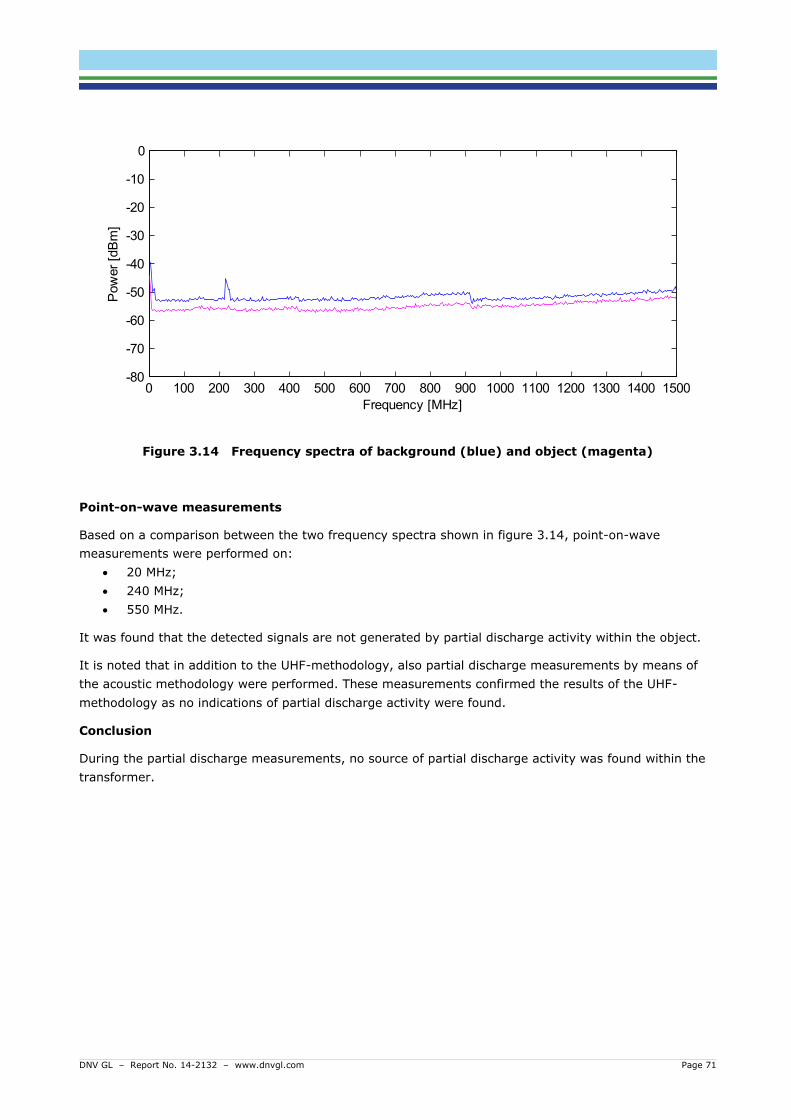
The recorded frequency spectra are shown in figure 3.14.
DNV GL – Report No. 14-2132 – www.dnvgl.com Page 71
Figure 3.14 Frequency spectra of background (blue) and object (magenta)
Point-on-wave measurements
Based on a comparison between the two frequency spectra shown in figure 3.14, point-on-wave
measurements were performed on:
20 MHz;
240 MHz;
550 MHz.
It was found that the detected signals are not generated by partial discharge activity within the object.
It is noted that in addition to the UHF-methodology, also partial discharge measurements by means of
the acoustic methodology were performed. These measurements confirmed the results of the UHF-
methodology as no indications of partial discharge activity were found.
Conclusion
During the partial discharge measurements, no source of partial discharge activity was found within the
transformer.
0 100 200 300 400 500 600 700 800 900 1000 1100 1200 1300 1400 1500-80
-70
-60
-50
-40
-30
-20
-10
0
Pow
er
[dB
m]
Frequency [MHz]
DNV GL – Report No. 14-2132 – www.dnvgl.com Page 72
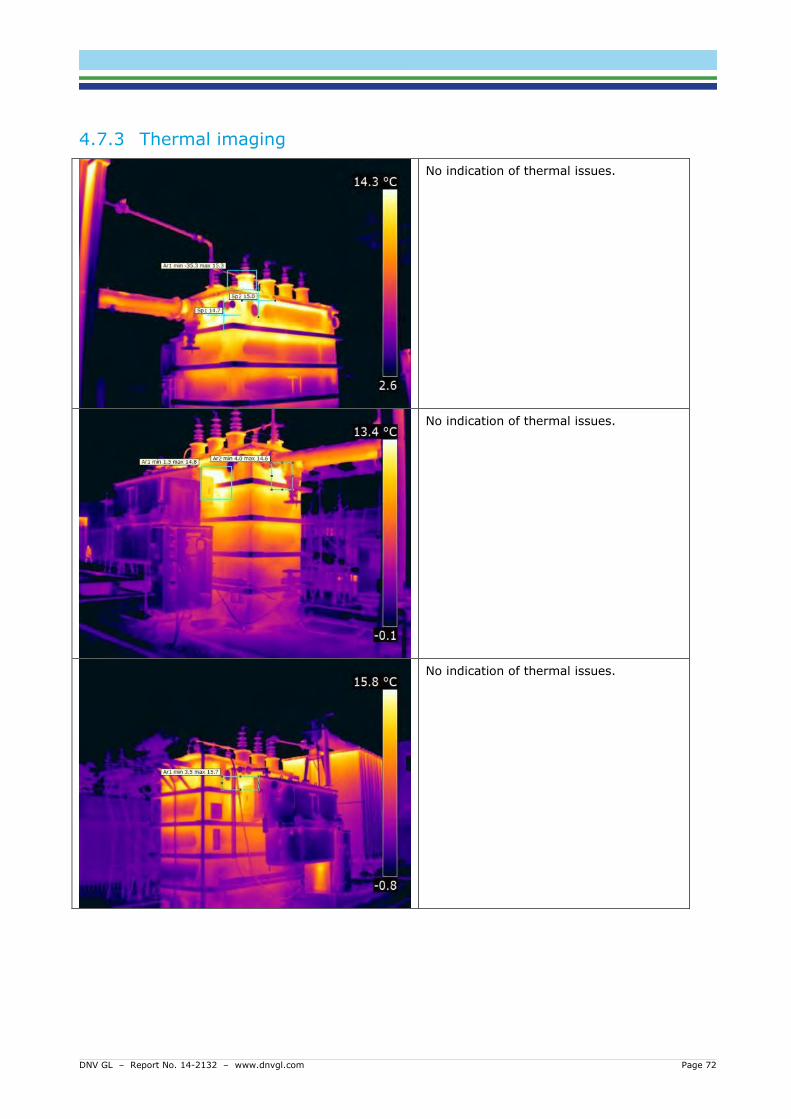
4.7.3 Thermal imaging
No indication of thermal issues.
No indication of thermal issues.
No indication of thermal issues.
DNV GL – Report No. 14-2132 – www.dnvgl.com Page 73
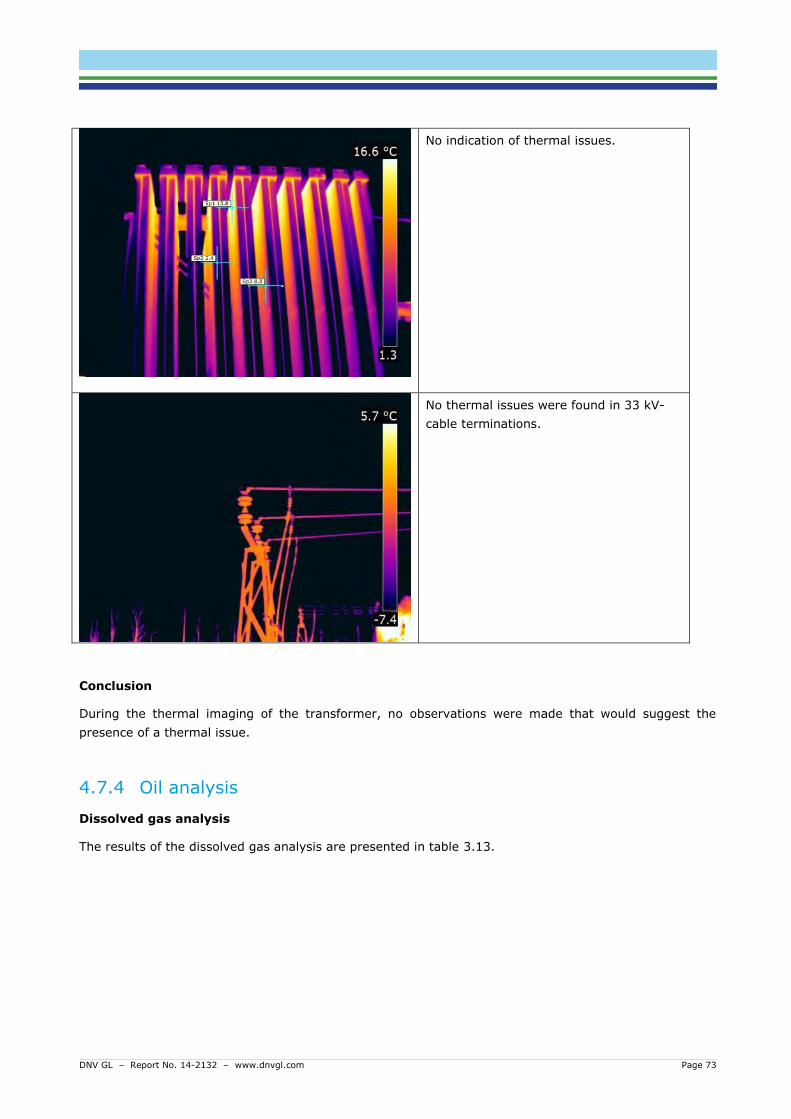
No indication of thermal issues.
No thermal issues were found in 33 kV-
cable terminations.
Conclusion
During the thermal imaging of the transformer, no observations were made that would suggest the
presence of a thermal issue.
4.7.4 Oil analysis
Dissolved gas analysis
The results of the dissolved gas analysis are presented in table 3.13.
DNV GL – Report No. 14-2132 – www.dnvgl.com Page 74
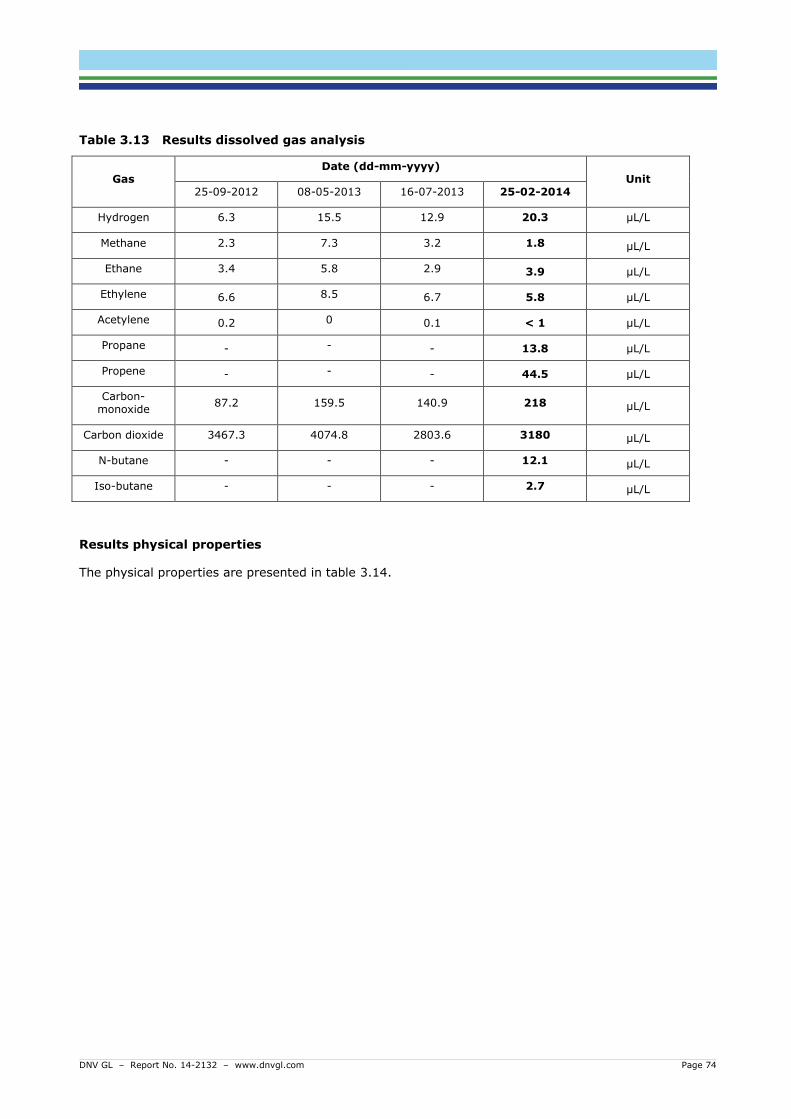
Table 3.13 Results dissolved gas analysis
Gas Date (dd-mm-yyyy)
Unit 25-09-2012 08-05-2013 16-07-2013 25-02-2014
Hydrogen 6.3 15.5 12.9 20.3 μL/L
Methane 2.3 7.3 3.2 1.8 μL/L
Ethane 3.4 5.8 2.9 3.9 μL/L
Ethylene 6.6 8.5 6.7 5.8 μL/L
Acetylene 0.2 0 0.1 < 1 μL/L
Propane - - - 13.8 μL/L
Propene - - - 44.5 μL/L
Carbon-monoxide
87.2 159.5 140.9 218 μL/L
Carbon dioxide 3467.3 4074.8 2803.6 3180 μL/L
N-butane - - - 12.1 μL/L
Iso-butane - - - 2.7 μL/L
Results physical properties
The physical properties are presented in table 3.14.
DNV GL – Report No. 14-2132 – www.dnvgl.com Page 75
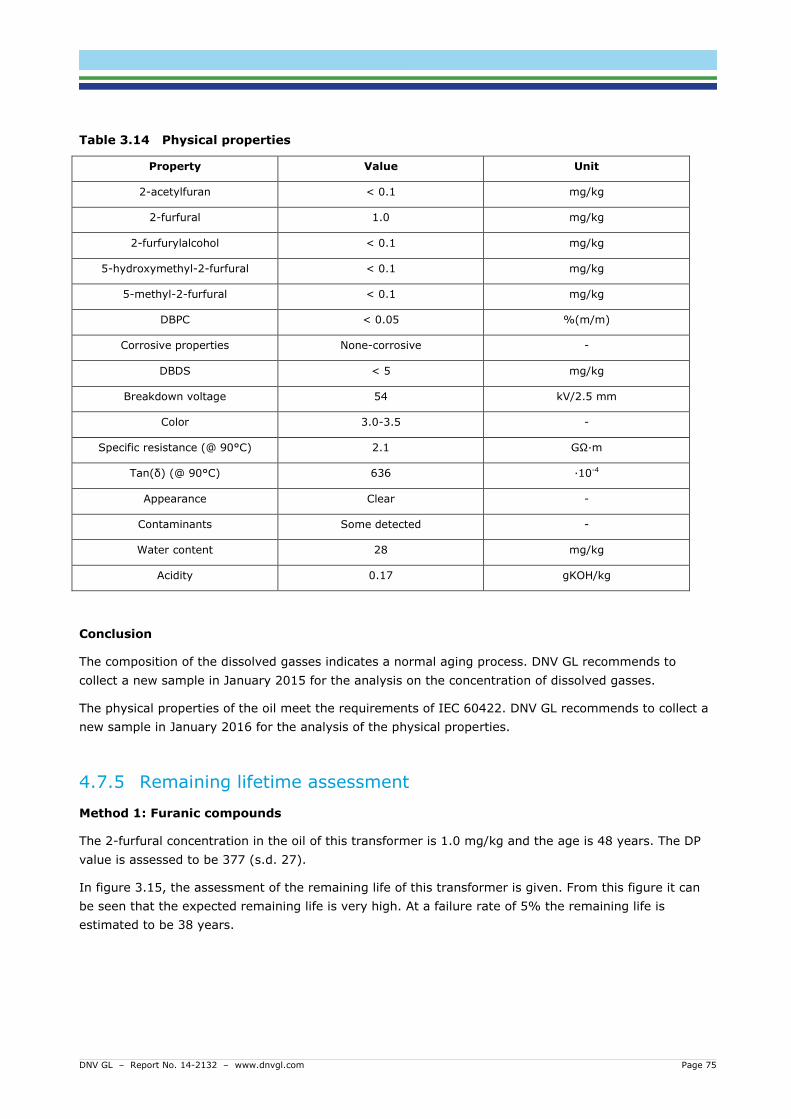
Table 3.14 Physical properties
Property Value Unit
2-acetylfuran < 0.1 mg/kg
2-furfural 1.0 mg/kg
2-furfurylalcohol < 0.1 mg/kg
5-hydroxymethyl-2-furfural < 0.1 mg/kg
5-methyl-2-furfural < 0.1 mg/kg
DBPC < 0.05 %(m/m)
Corrosive properties None-corrosive -
DBDS < 5 mg/kg
Breakdown voltage 54 kV/2.5 mm
Color 3.0-3.5 -
Specific resistance (@ 90°C) 2.1 GΩ∙m
Tan(δ) (@ 90°C) 636 ∙10-4
Appearance Clear -
Contaminants Some detected -
Water content 28 mg/kg
Acidity 0.17 gKOH/kg
Conclusion
The composition of the dissolved gasses indicates a normal aging process. DNV GL recommends to
collect a new sample in January 2015 for the analysis on the concentration of dissolved gasses.
The physical properties of the oil meet the requirements of IEC 60422. DNV GL recommends to collect a
new sample in January 2016 for the analysis of the physical properties.
4.7.5 Remaining lifetime assessment
Method 1: Furanic compounds
The 2-furfural concentration in the oil of this transformer is 1.0 mg/kg and the age is 48 years. The DP
value is assessed to be 377 (s.d. 27).
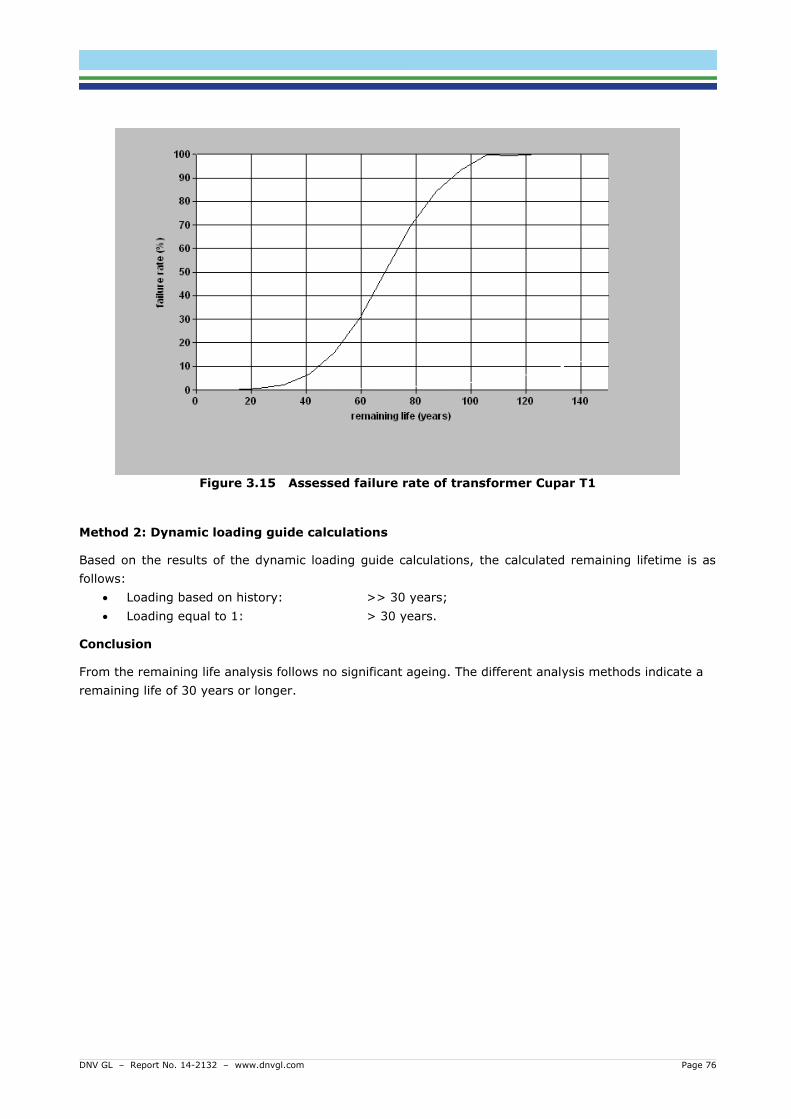
In figure 3.15, the assessment of the remaining life of this transformer is given. From this figure it can
be seen that the expected remaining life is very high. At a failure rate of 5% the remaining life is
estimated to be 38 years.
DNV GL – Report No. 14-2132 – www.dnvgl.com Page 76
Figure 3.15 Assessed failure rate of transformer Cupar T1
Method 2: Dynamic loading guide calculations
Based on the results of the dynamic loading guide calculations, the calculated remaining lifetime is as
follows:
Loading based on history: >> 30 years;
Loading equal to 1: > 30 years.
Conclusion
From the remaining life analysis follows no significant ageing. The different analysis methods indicate a
remaining life of 30 years or longer.
DNV GL – Report No. 14-2132 – www.dnvgl.com Page 77
4.8 Cupar – Transformer 2
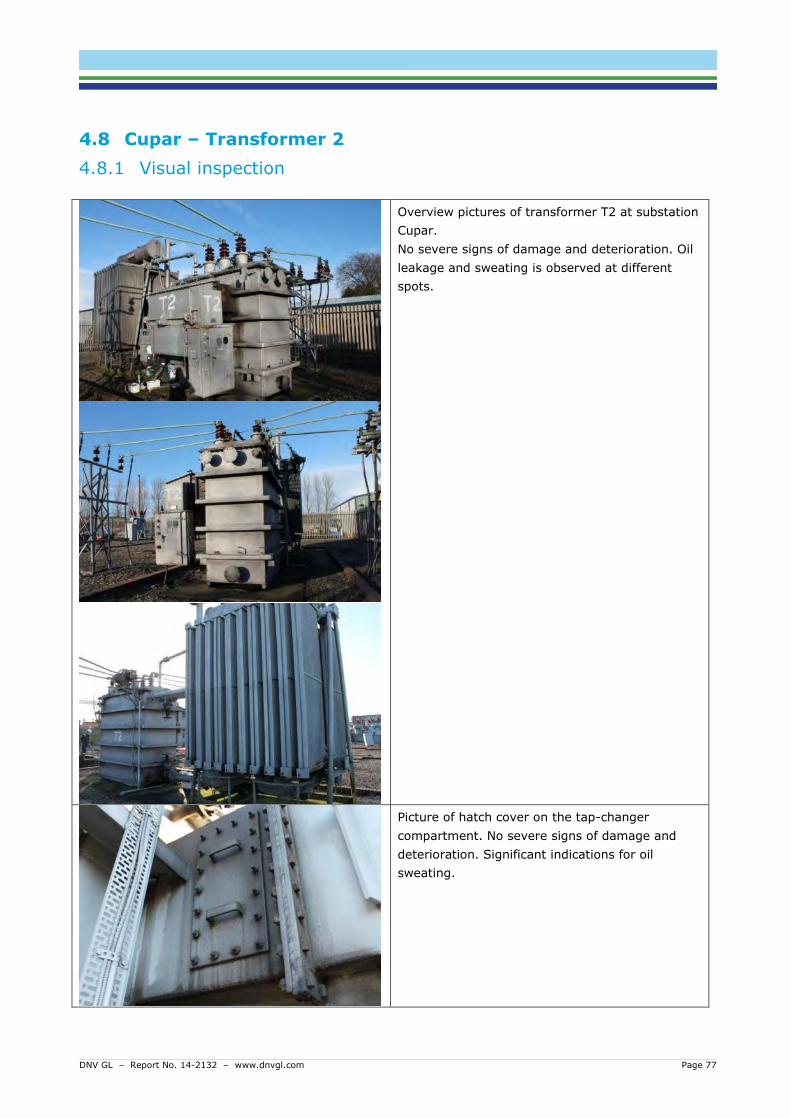
4.8.1 Visual inspection
Overview pictures of transformer T2 at substation
Cupar.
No severe signs of damage and deterioration. Oil
leakage and sweating is observed at different
spots.
Picture of hatch cover on the tap-changer
compartment. No severe signs of damage and
deterioration. Significant indications for oil
sweating.
DNV GL – Report No. 14-2132 – www.dnvgl.com Page 78
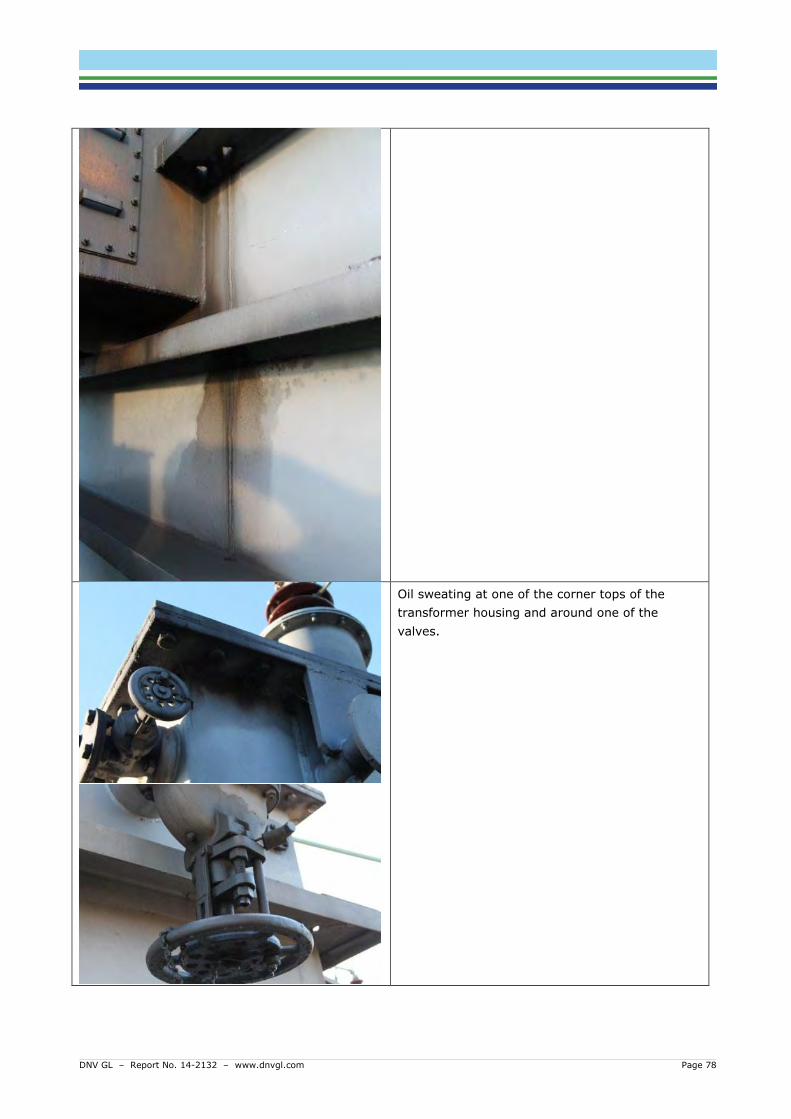
Oil sweating at one of the corner tops of the
transformer housing and around one of the
valves.
DNV GL – Report No. 14-2132 – www.dnvgl.com Page 79
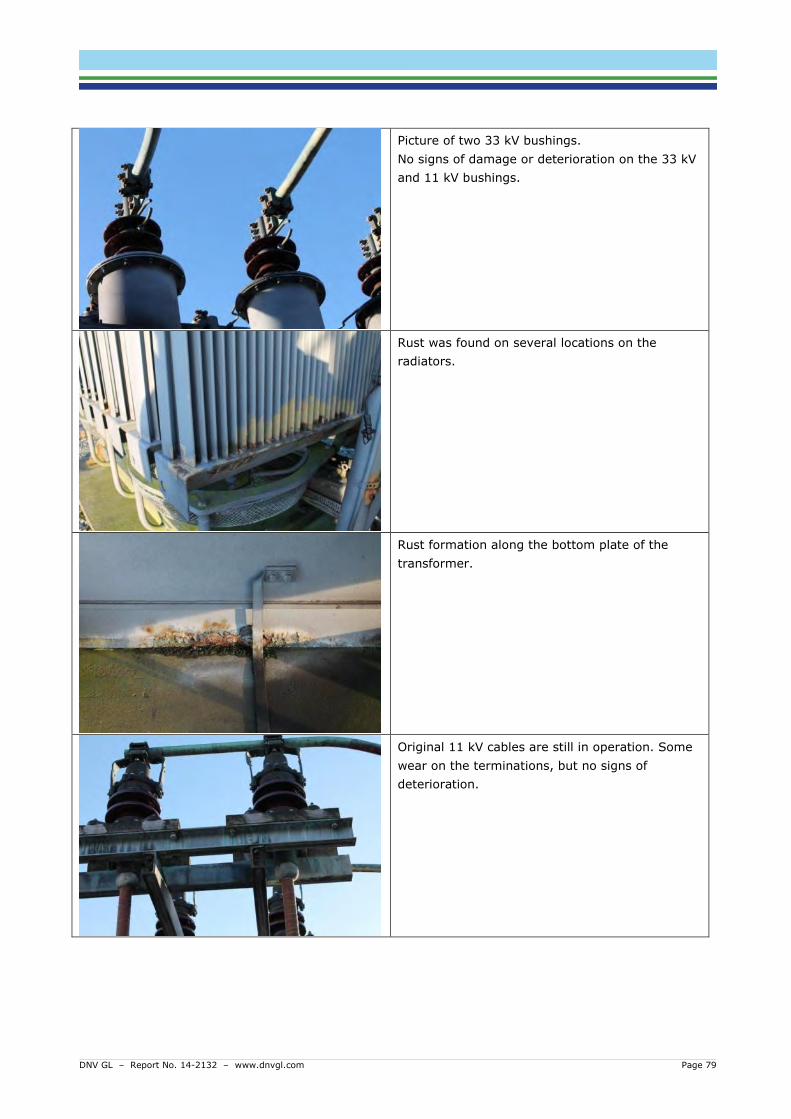
Picture of two 33 kV bushings.
No signs of damage or deterioration on the 33 kV
and 11 kV bushings.
Rust was found on several locations on the
radiators.
Rust formation along the bottom plate of the
transformer.
Original 11 kV cables are still in operation. Some
wear on the terminations, but no signs of
deterioration.
DNV GL – Report No. 14-2132 – www.dnvgl.com Page 80
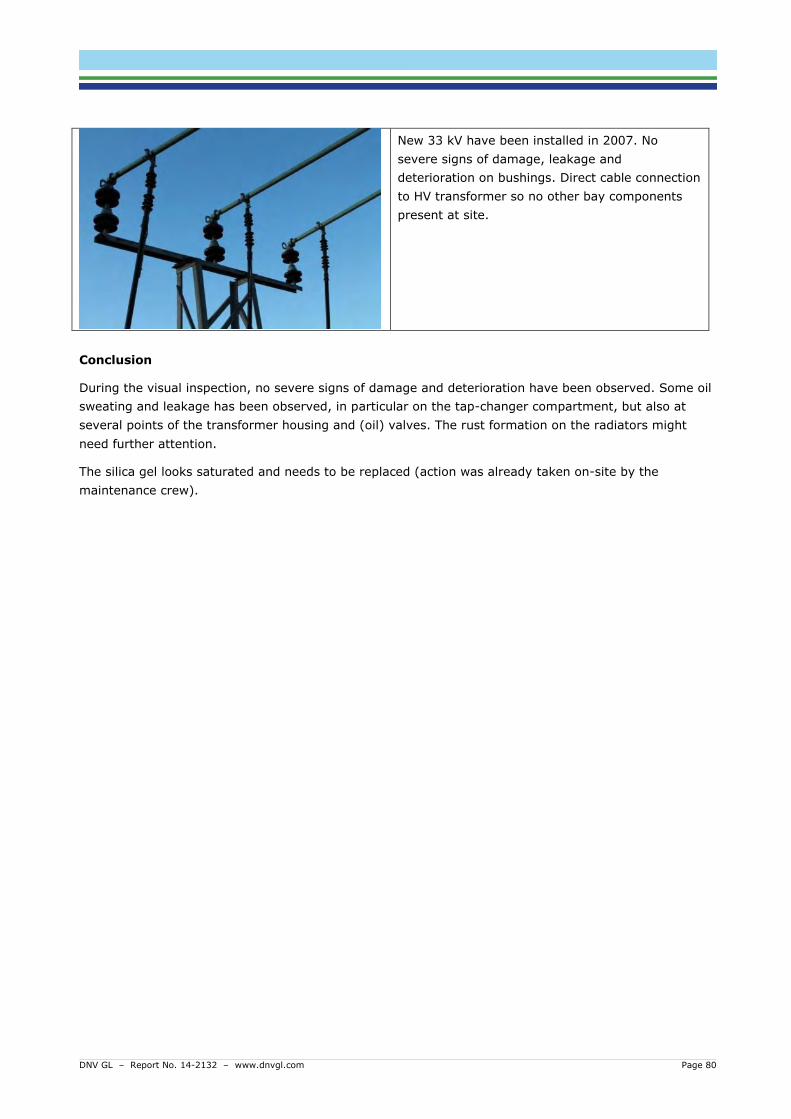
New 33 kV have been installed in 2007. No
severe signs of damage, leakage and
deterioration on bushings. Direct cable connection
to HV transformer so no other bay components
present at site.
Conclusion
During the visual inspection, no severe signs of damage and deterioration have been observed. Some oil
sweating and leakage has been observed, in particular on the tap-changer compartment, but also at
several points of the transformer housing and (oil) valves. The rust formation on the radiators might
need further attention.
The silica gel looks saturated and needs to be replaced (action was already taken on-site by the
maintenance crew).
DNV GL – Report No. 14-2132 – www.dnvgl.com Page 81
4.8.2 Partial discharge measurements
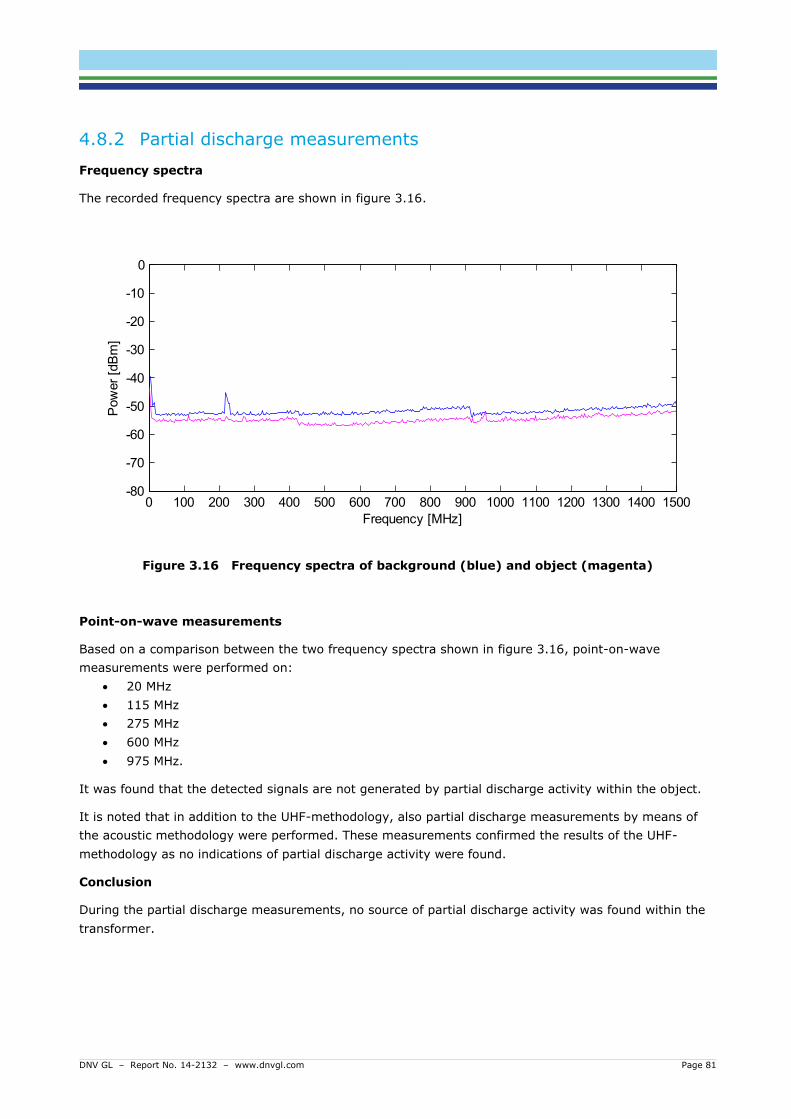
Frequency spectra
The recorded frequency spectra are shown in figure 3.16.
Figure 3.16 Frequency spectra of background (blue) and object (magenta)
Point-on-wave measurements
Based on a comparison between the two frequency spectra shown in figure 3.16, point-on-wave
measurements were performed on:
20 MHz
115 MHz
275 MHz
600 MHz
975 MHz.
It was found that the detected signals are not generated by partial discharge activity within the object.
It is noted that in addition to the UHF-methodology, also partial discharge measurements by means of
the acoustic methodology were performed. These measurements confirmed the results of the UHF-
methodology as no indications of partial discharge activity were found.
Conclusion
During the partial discharge measurements, no source of partial discharge activity was found within the
transformer.
0 100 200 300 400 500 600 700 800 900 1000 1100 1200 1300 1400 1500-80
-70
-60
-50
-40
-30
-20
-10
0
Pow
er
[dB
m]
Frequency [MHz]
DNV GL – Report No. 14-2132 – www.dnvgl.com Page 82
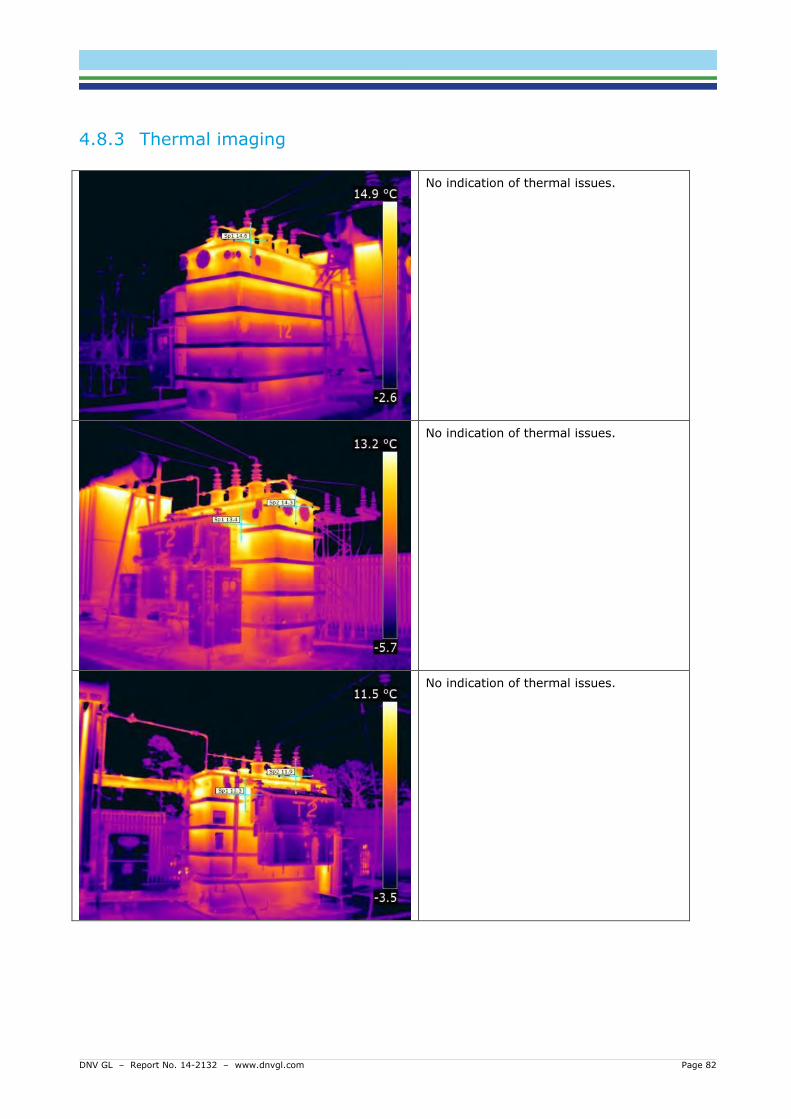
4.8.3 Thermal imaging
No indication of thermal issues.
No indication of thermal issues.
No indication of thermal issues.
DNV GL – Report No. 14-2132 – www.dnvgl.com Page 83
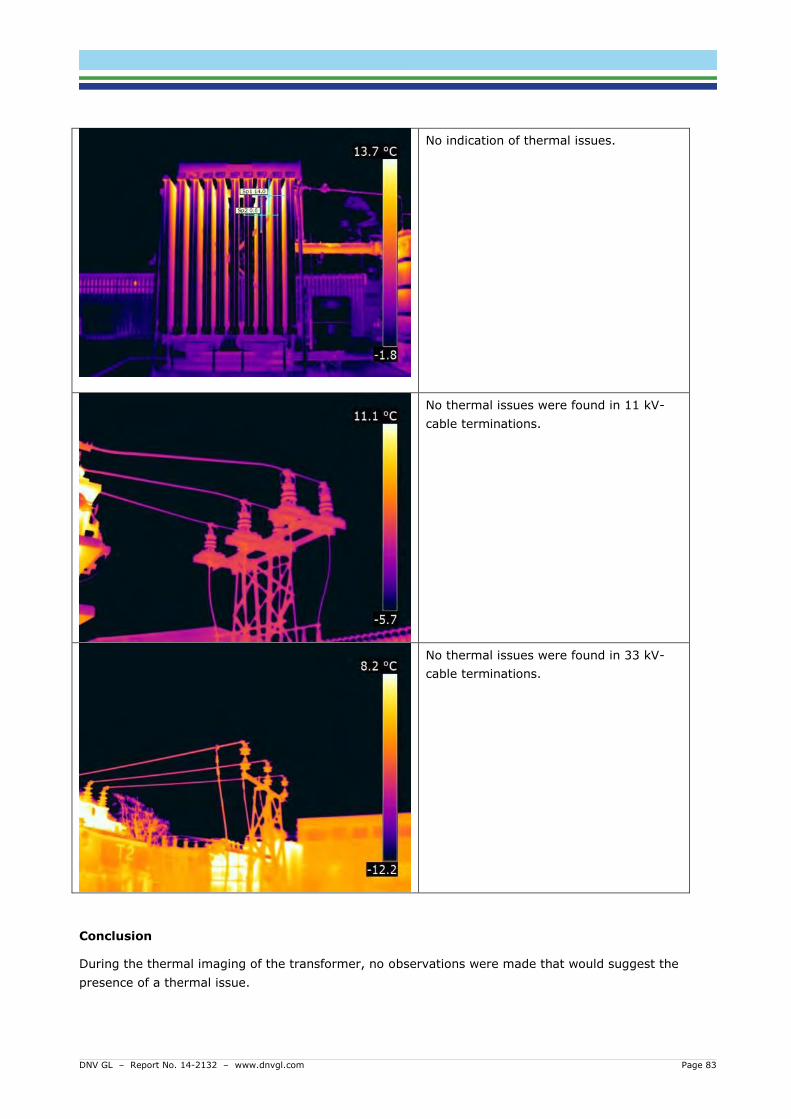
No indication of thermal issues.
No thermal issues were found in 11 kV-
cable terminations.
No thermal issues were found in 33 kV-
cable terminations.
Conclusion
During the thermal imaging of the transformer, no observations were made that would suggest the
presence of a thermal issue.
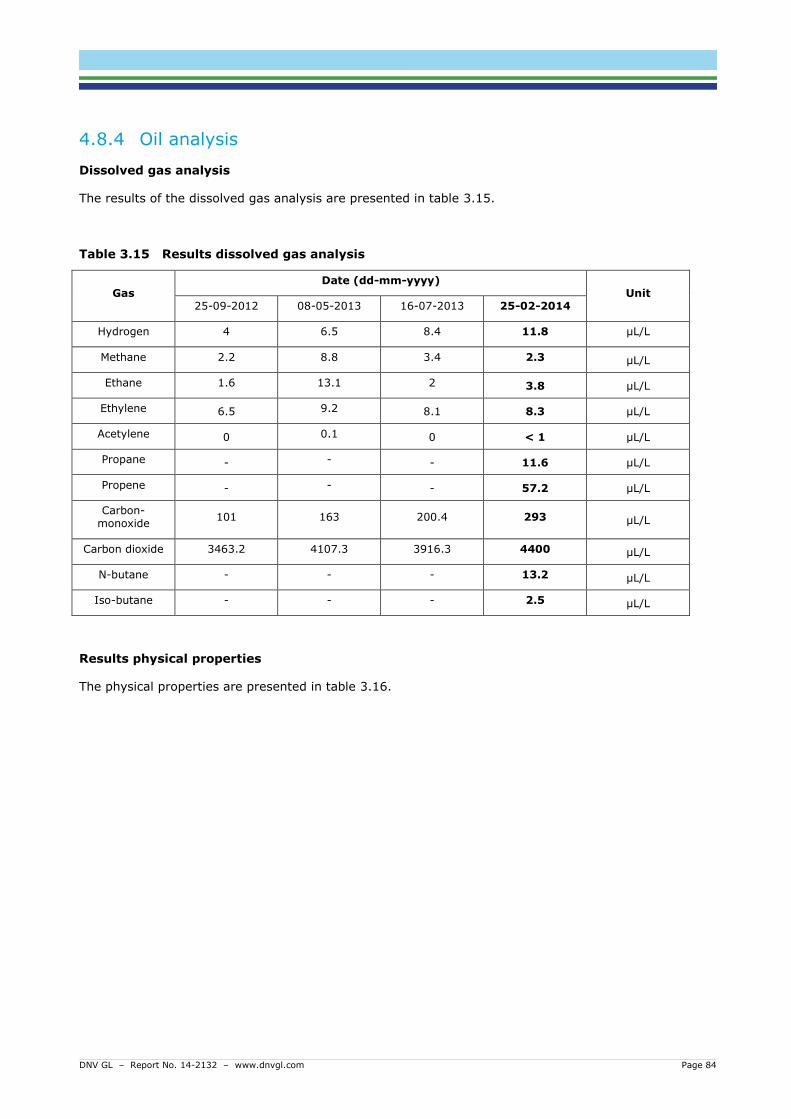
DNV GL – Report No. 14-2132 – www.dnvgl.com Page 84
4.8.4 Oil analysis
Dissolved gas analysis
The results of the dissolved gas analysis are presented in table 3.15.
Table 3.15 Results dissolved gas analysis
Gas Date (dd-mm-yyyy)
Unit 25-09-2012 08-05-2013 16-07-2013 25-02-2014
Hydrogen 4 6.5 8.4 11.8 μL/L
Methane 2.2 8.8 3.4 2.3 μL/L
Ethane 1.6 13.1 2 3.8 μL/L
Ethylene 6.5 9.2 8.1 8.3 μL/L
Acetylene 0 0.1 0 < 1 μL/L
Propane - - - 11.6 μL/L
Propene - - - 57.2 μL/L
Carbon-monoxide
101 163 200.4 293 μL/L
Carbon dioxide 3463.2 4107.3 3916.3 4400 μL/L
N-butane - - - 13.2 μL/L
Iso-butane - - - 2.5 μL/L
Results physical properties
The physical properties are presented in table 3.16.
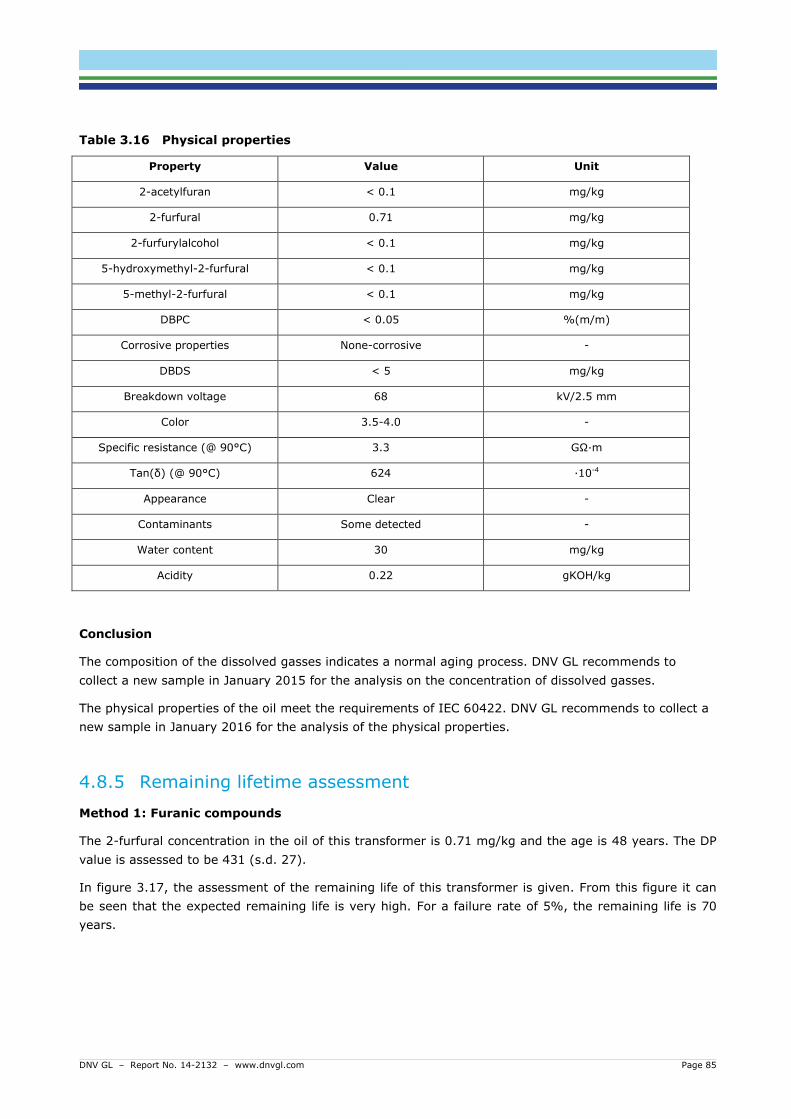
DNV GL – Report No. 14-2132 – www.dnvgl.com Page 85
Table 3.16 Physical properties
Property Value Unit
2-acetylfuran < 0.1 mg/kg
2-furfural 0.71 mg/kg
2-furfurylalcohol < 0.1 mg/kg
5-hydroxymethyl-2-furfural < 0.1 mg/kg
5-methyl-2-furfural < 0.1 mg/kg
DBPC < 0.05 %(m/m)
Corrosive properties None-corrosive -
DBDS < 5 mg/kg
Breakdown voltage 68 kV/2.5 mm
Color 3.5-4.0 -
Specific resistance (@ 90°C) 3.3 GΩ∙m
Tan(δ) (@ 90°C) 624 ∙10-4
Appearance Clear -
Contaminants Some detected -
Water content 30 mg/kg
Acidity 0.22 gKOH/kg
Conclusion
The composition of the dissolved gasses indicates a normal aging process. DNV GL recommends to
collect a new sample in January 2015 for the analysis on the concentration of dissolved gasses.
The physical properties of the oil meet the requirements of IEC 60422. DNV GL recommends to collect a
new sample in January 2016 for the analysis of the physical properties.
4.8.5 Remaining lifetime assessment
Method 1: Furanic compounds
The 2-furfural concentration in the oil of this transformer is 0.71 mg/kg and the age is 48 years. The DP
value is assessed to be 431 (s.d. 27).
In figure 3.17, the assessment of the remaining life of this transformer is given. From this figure it can
be seen that the expected remaining life is very high. For a failure rate of 5%, the remaining life is 70
years.
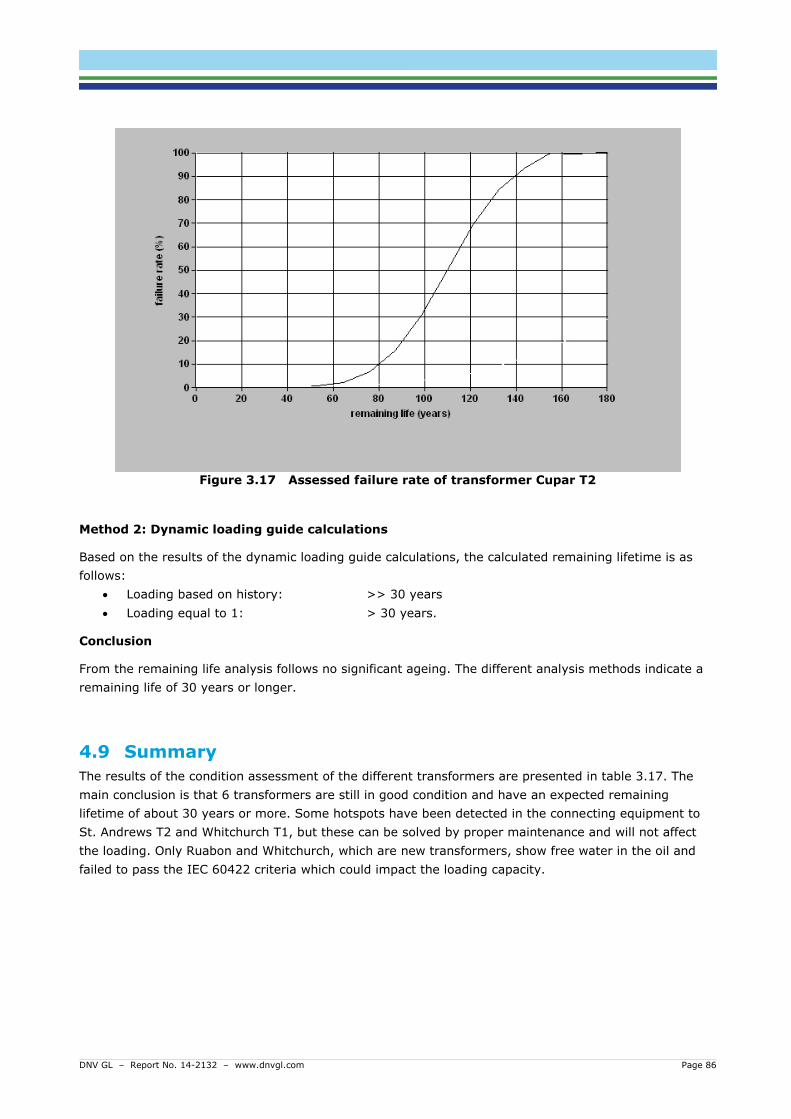
DNV GL – Report No. 14-2132 – www.dnvgl.com Page 86
Figure 3.17 Assessed failure rate of transformer Cupar T2
Method 2: Dynamic loading guide calculations
Based on the results of the dynamic loading guide calculations, the calculated remaining lifetime is as
follows:
Loading based on history: >> 30 years
Loading equal to 1: > 30 years.
Conclusion
From the remaining life analysis follows no significant ageing. The different analysis methods indicate a
remaining life of 30 years or longer.
4.9 Summary
The results of the condition assessment of the different transformers are presented in table 3.17. The
main conclusion is that 6 transformers are still in good condition and have an expected remaining
lifetime of about 30 years or more. Some hotspots have been detected in the connecting equipment to
St. Andrews T2 and Whitchurch T1, but these can be solved by proper maintenance and will not affect
the loading. Only Ruabon and Whitchurch, which are new transformers, show free water in the oil and
failed to pass the IEC 60422 criteria which could impact the loading capacity.
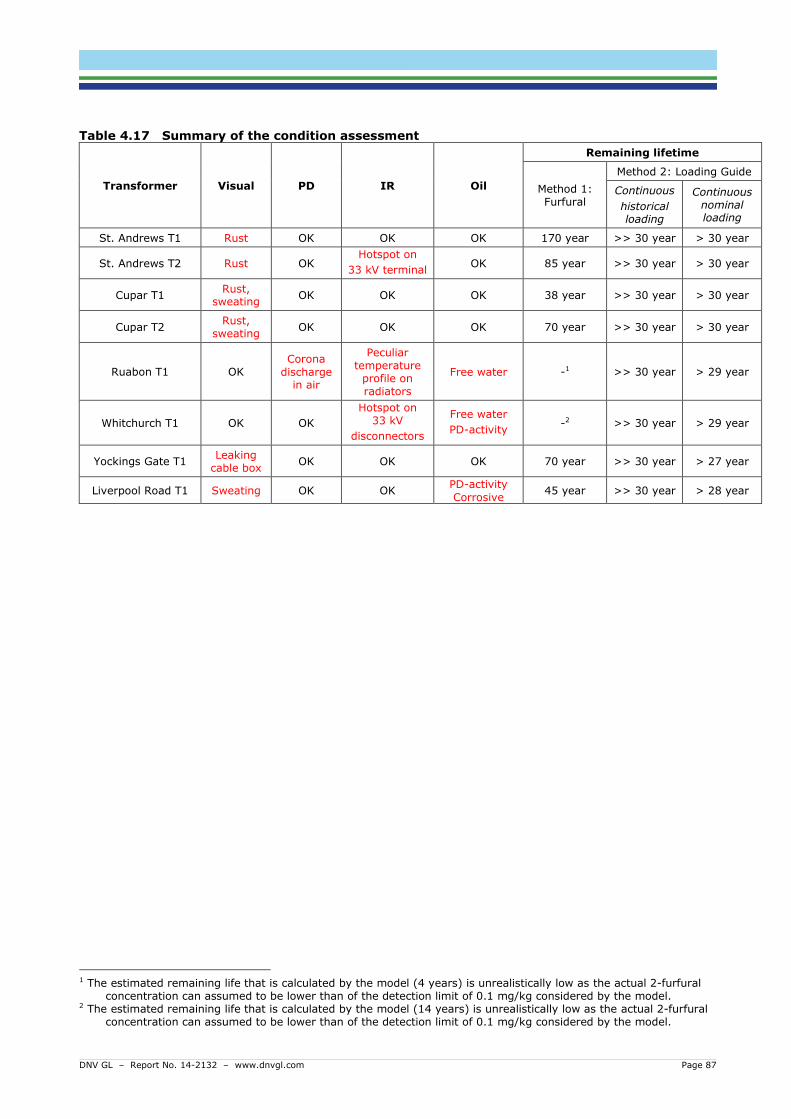
DNV GL – Report No. 14-2132 – www.dnvgl.com Page 87
Table 4.17 Summary of the condition assessment
Transformer Visual PD IR Oil
Remaining lifetime
Method 1: Furfural
Method 2: Loading Guide
Continuous
historical loading
Continuous nominal loading
St. Andrews T1 Rust OK OK OK 170 year >> 30 year > 30 year
St. Andrews T2 Rust OK Hotspot on
33 kV terminal OK 85 year >> 30 year > 30 year
Cupar T1 Rust,
sweating OK OK OK 38 year >> 30 year > 30 year
Cupar T2 Rust,
sweating OK OK OK 70 year >> 30 year > 30 year
Ruabon T1 OK Corona
discharge in air
Peculiar temperature
profile on radiators
Free water -1 >> 30 year > 29 year
Whitchurch T1 OK OK
Hotspot on 33 kV
disconnectors
Free water
PD-activity -2 >> 30 year > 29 year
Yockings Gate T1 Leaking
cable box OK OK OK 70 year >> 30 year > 27 year
Liverpool Road T1 Sweating OK OK PD-activity
Corrosive 45 year >> 30 year > 28 year
1 The estimated remaining life that is calculated by the model (4 years) is unrealistically low as the actual 2-furfural
concentration can assumed to be lower than of the detection limit of 0.1 mg/kg considered by the model. 2 The estimated remaining life that is calculated by the model (14 years) is unrealistically low as the actual 2-furfural
concentration can assumed to be lower than of the detection limit of 0.1 mg/kg considered by the model.
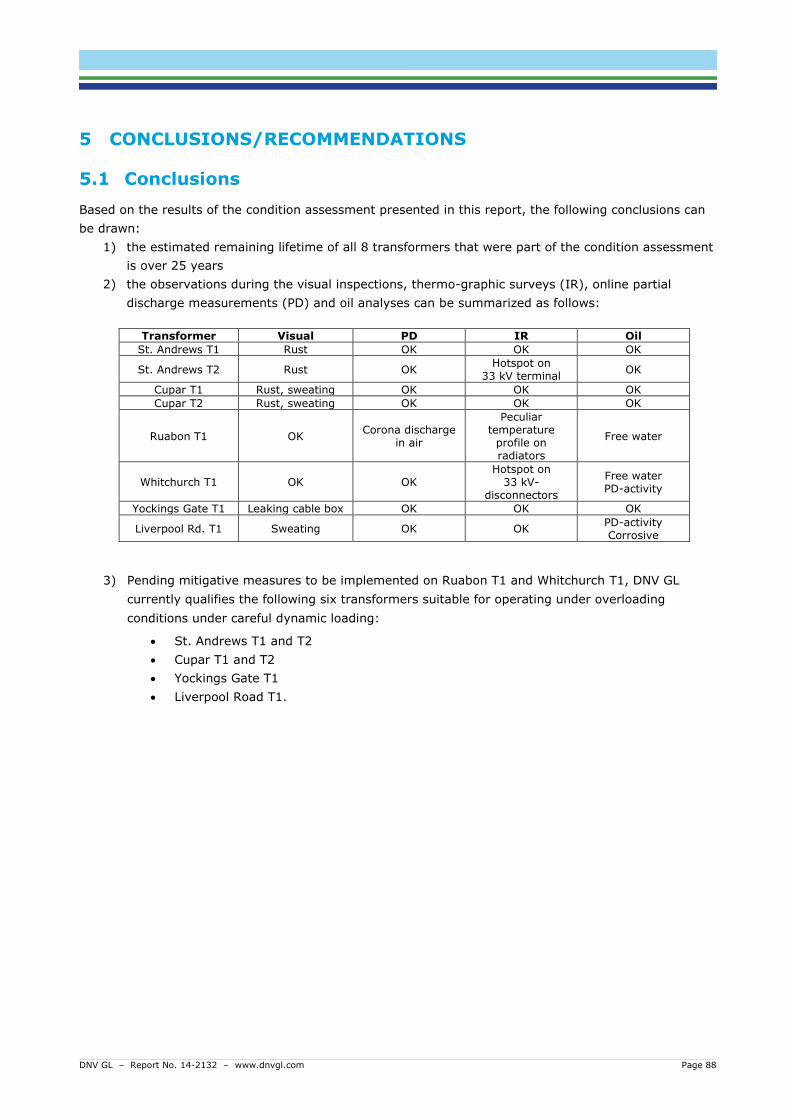
DNV GL – Report No. 14-2132 – www.dnvgl.com Page 88
5 CONCLUSIONS/RECOMMENDATIONS
5.1 Conclusions
Based on the results of the condition assessment presented in this report, the following conclusions can
be drawn:
1) the estimated remaining lifetime of all 8 transformers that were part of the condition assessment
is over 25 years
2) the observations during the visual inspections, thermo-graphic surveys (IR), online partial
discharge measurements (PD) and oil analyses can be summarized as follows:
Transformer Visual PD IR Oil
St. Andrews T1 Rust OK OK OK
St. Andrews T2 Rust OK Hotspot on
33 kV terminal OK
Cupar T1 Rust, sweating OK OK OK
Cupar T2 Rust, sweating OK OK OK
Ruabon T1 OK Corona discharge
in air
Peculiar temperature
profile on radiators
Free water
Whitchurch T1 OK OK Hotspot on
33 kV-disconnectors
Free water PD-activity
Yockings Gate T1 Leaking cable box OK OK OK
Liverpool Rd. T1 Sweating OK OK PD-activity Corrosive
3) Pending mitigative measures to be implemented on Ruabon T1 and Whitchurch T1, DNV GL
currently qualifies the following six transformers suitable for operating under overloading
conditions under careful dynamic loading:
St. Andrews T1 and T2
Cupar T1 and T2
Yockings Gate T1
Liverpool Road T1.
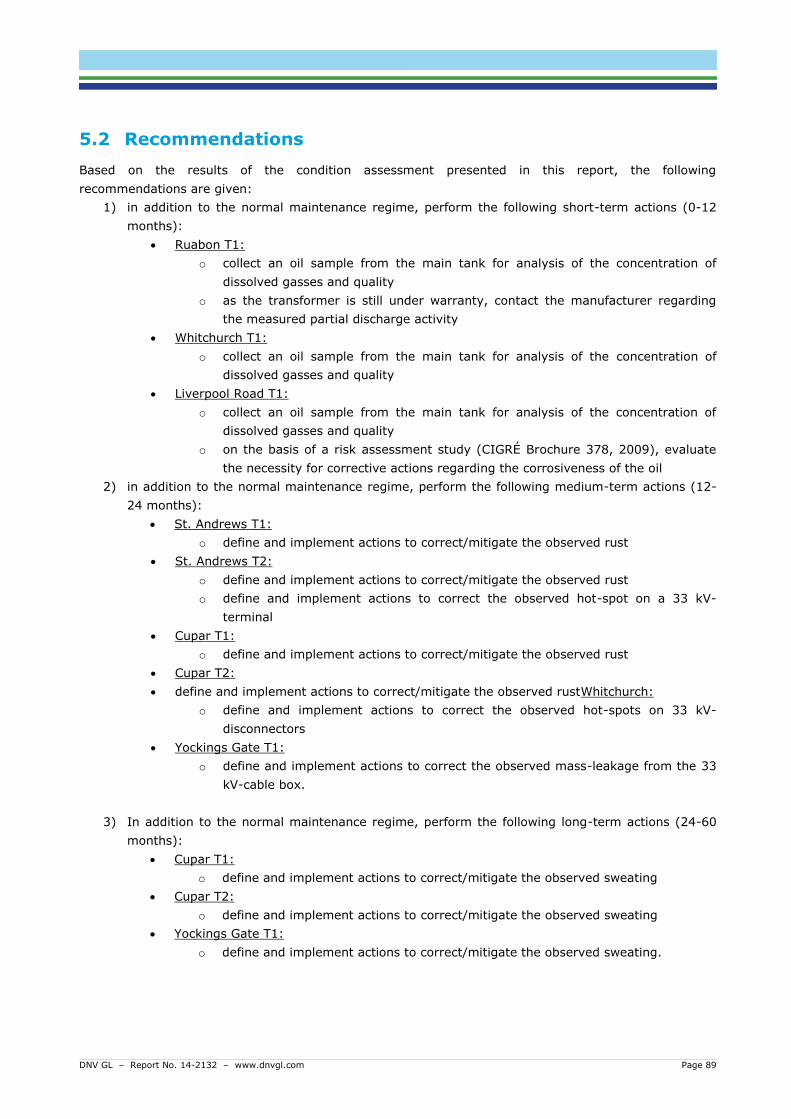
DNV GL – Report No. 14-2132 – www.dnvgl.com Page 89
5.2 Recommendations
Based on the results of the condition assessment presented in this report, the following
recommendations are given:
1) in addition to the normal maintenance regime, perform the following short-term actions (0-12
months):
Ruabon T1:
o collect an oil sample from the main tank for analysis of the concentration of
dissolved gasses and quality
o as the transformer is still under warranty, contact the manufacturer regarding
the measured partial discharge activity
Whitchurch T1:
o collect an oil sample from the main tank for analysis of the concentration of
dissolved gasses and quality
Liverpool Road T1:
o collect an oil sample from the main tank for analysis of the concentration of
dissolved gasses and quality
o on the basis of a risk assessment study (CIGRÉ Brochure 378, 2009), evaluate
the necessity for corrective actions regarding the corrosiveness of the oil
2) in addition to the normal maintenance regime, perform the following medium-term actions (12-
24 months):
St. Andrews T1:
o define and implement actions to correct/mitigate the observed rust
St. Andrews T2:
o define and implement actions to correct/mitigate the observed rust
o define and implement actions to correct the observed hot-spot on a 33 kV-
terminal
Cupar T1:
o define and implement actions to correct/mitigate the observed rust
Cupar T2:
define and implement actions to correct/mitigate the observed rustWhitchurch:
o define and implement actions to correct the observed hot-spots on 33 kV-
disconnectors
Yockings Gate T1:
o define and implement actions to correct the observed mass-leakage from the 33
kV-cable box.
3) In addition to the normal maintenance regime, perform the following long-term actions (24-60
months):
Cupar T1:
o define and implement actions to correct/mitigate the observed sweating
Cupar T2:
o define and implement actions to correct/mitigate the observed sweating
Yockings Gate T1:
o define and implement actions to correct/mitigate the observed sweating.

About DNV GL Driven by our purpose of safeguarding life, property and the environment, DNV GL enables organizations to advance the safety and sustainability of their business. We provide classification and technical
assurance along with software and independent expert advisory services to the maritime, oil and gas, and energy industries. We also provide certification services to customers across a wide range of industries. Operating in more than 100 countries, our 16,000 professionals are dedicated to helping our customers make the world safer, smarter and greener.


![Digital Asset Management - Overload Capacity of Power ......2.1 Recommended thermal characteristics for exponential equations, [6] . . . . . . .13 2.2 Transformer dynamic thermal rating](https://img.pdfslide.us/doc/110x75/612183b59acd5b0a49086c69/digital-asset-management-overload-capacity-of-power-21-recommended-thermal.jpg)