Embed Size (px)
Citation preview

Real-time Synchrophasor Analytics: Data Quality Monitoring and Anomaly Detection
Le XieAssociate Professor
Department of Electrical and Computer EngineeringTexas A&M University([email protected])
PSERC WebinarMarch 7, 2017
1

Acknowledgements: Research Team
• Support from PSERC (Project S-71)
• S-71 Research Team:• Prof. Mani Venkatasubramanian (Washington State University)• Prof. P. R. Kumar (Texas A&M University)
• Students: • Dr. Yang Chen (now with PJM)• Ms. Meng Wu
2

Acknowledgements: Industry Advisors
• Aftab Alam, California ISO• Frankie Zhang, ISO-New
England• Chaitanya A. Baone, GE
Global Research• Santosh Veda, GE Global
Research• Paul T. Myrda, EPRI• Liang Min, LLNL• Mahendra Patel, EPRI• Giuseppe Stanciulescu,
BC Hydro
• Vijay Sukhavasi, Alstom• Gurudatha Pai, Alstom• Jay Ramamurthy, Entergy• Yingchen Zhang, NREL• Prashant Kansal, AEP• Harvey Scribner, SPP • Jay Caspary, SPP• Xiaoming Feng, ABB• Floyd Galvan, Entergy• Naim Logic, SRP• Alan Engelmann, ComEd
3

Presentation Outline
• Introduction
• Part I: PMU Dimensionality Reduction & Early Event Detection
• Part II: Real-Time Detection of Low-Quality PMU Measurements
• Concluding Remarks
4
PMU Challenges Our Research
Dimensionality reduction of PMU measurements.
Real-time data-driven PMU bad data detection.
High dimensionality: Tennessee Valley Authority (TVA) 120 PMUs produces 36GB data per day.
State-of-the-art: primarily offline, post-event analysis.
High Bad Data Ratio: Typical PMU bad data ratio in California ISO ranges from 10% to 17% (in 2011).
Online data-driven PMU-based early event detection.
Motivation of This Work
• [8] N. Dahal, R. King, and V. Madani, “Online dimension reduction of synchrophasor data,” 2012.• [9] M. Patel, S. Aivaliotis, E. Ellen et al., “Real-time application of synchrophasors for improving reliability,” 2010.• [5] California ISO, “Five year synchrophasor plan,” California ISO, Tech. Rep., Nov 2011.
55
Presentation Outline
• Introduction
• Part I: PMU Dimensionality Reduction & Early Event Detection
• Part II: Real-Time Detection of Low-Quality PMU Measurements
• Concluding Remarks
6
0 100 200 300 400 500 600 700 800 900 1000 11001.01
1.015
1.02
1.025
1.03
1.035Voltage Magnitude Profile for ERCOT Data
Time (Sec)
Vol
tage
Mag
nitu
de (p
.u.)
V1V2
V3
V4
V5
V6V7
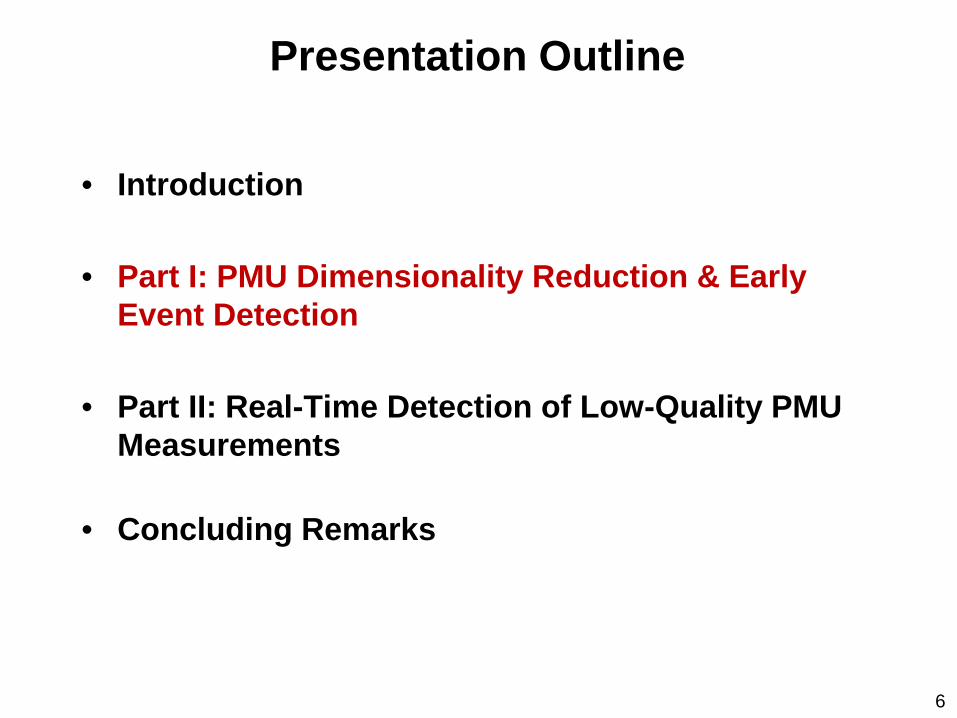
Raw PMU Data from Texas
Bus Frequency Profile of ERCOT Data. Voltage Magnitude Profile of ERCOT Data.
0 100 200 300 400 500 600 700 800 900 1000 11000.995
0.996
0.997
0.998
0.999
1
1.001Bus Frequency Profile for ERCOT Data
Time (Sec)
Bus
Fre
quen
cy (p
.u.)
ω1
ω2
ω3
ω4
ω5
ω6
ω7
No system topology, no system model. Total number of PMUs: 7.
7• [6] L. Xie, Y. Chen, and P. R. Kumar, “Dimensionality Reduction of Synchrophasor Data for Early Event Detection: Linearized Analysis,” IEEE Tran. Power Systems, 2014.
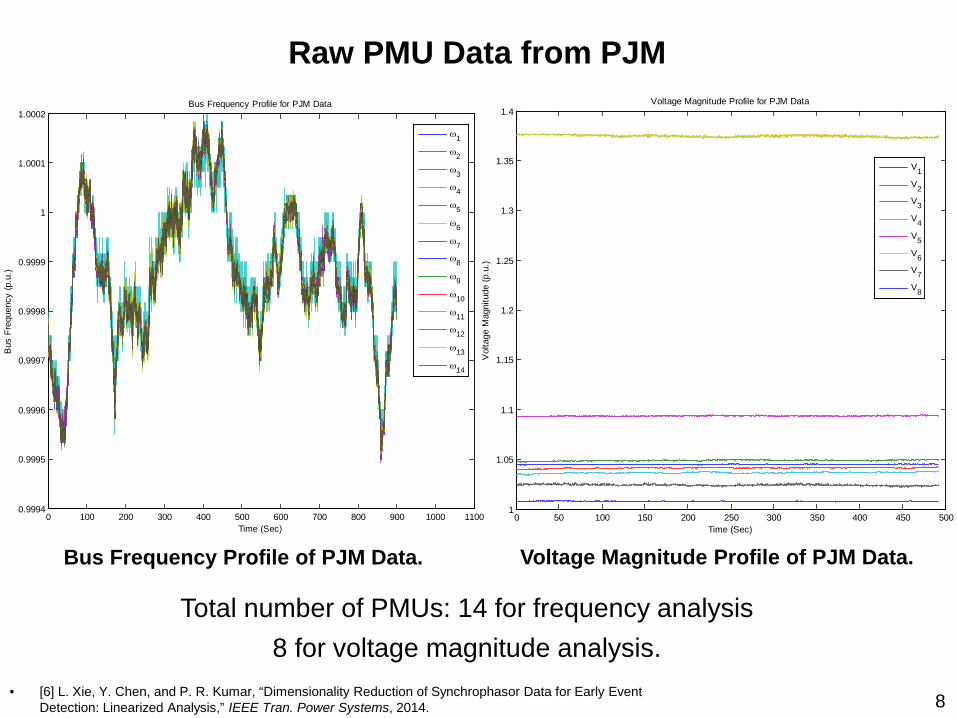
Raw PMU Data from PJM
0 50 100 150 200 250 300 350 400 450 5001
1.05
1.1
1.15
1.2
1.25
1.3
1.35
1.4Voltage Magnitude Profile for PJM Data
Time (Sec)
Vol
tage
Mag
nitu
de (p
.u.)
V1
V2V3
V4
V5
V6V7
V8
0 100 200 300 400 500 600 700 800 900 1000 11000.9994
0.9995
0.9996
0.9997
0.9998
0.9999
1
1.0001
1.0002Bus Frequency Profile for PJM Data
Time (Sec)
Bus
Fre
quen
cy (p
.u.)
ω1
ω2
ω3
ω4
ω5
ω6
ω7
ω8
ω9
ω10
ω11
ω12
ω13
ω14
Bus Frequency Profile of PJM Data. Voltage Magnitude Profile of PJM Data.
Total number of PMUs: 14 for frequency analysis8 for voltage magnitude analysis.
8• [6] L. Xie, Y. Chen, and P. R. Kumar, “Dimensionality Reduction of Synchrophasor Data for Early Event Detection: Linearized Analysis,” IEEE Tran. Power Systems, 2014.
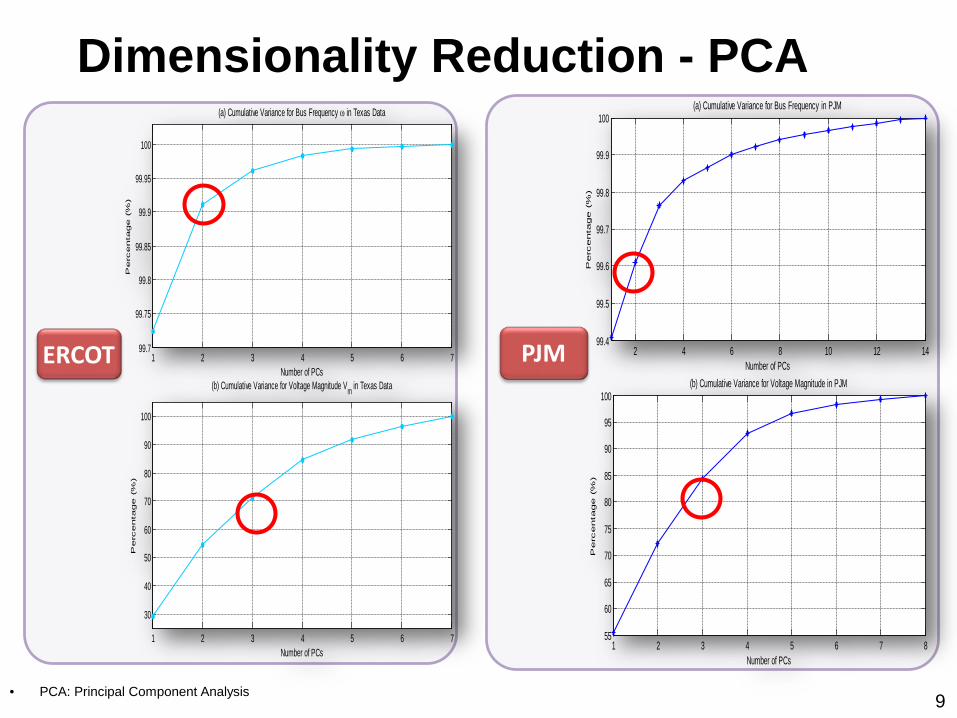
Dimensionality Reduction - PCA
ERCOT 1 2 3 4 5 6 799.7
99.75
99.8
99.85
99.9
99.95
100
Number of PCs
Perc
enta
ge (
%)
(a) Cumulative Variance for Bus Frequency ω in Texas Data
1 2 3 4 5 6 7
30
40
50
60
70
80
90
100
Number of PCs
Perc
enta
ge (
%)
(b) Cumulative Variance for Voltage Magnitude Vm in Texas Data
PJM 2 4 6 8 10 12 1499.4
99.5
99.6
99.7
99.8
99.9
100
Number of PCs
Perc
enta
ge (
%)
(a) Cumulative Variance for Bus Frequency in PJM
1 2 3 4 5 6 7 855
60
65
70
75
80
85
90
95
100
Number of PCs
Perc
enta
ge (
%)
(b) Cumulative Variance for Voltage Magnitude in PJM
9• PCA: Principal Component Analysis
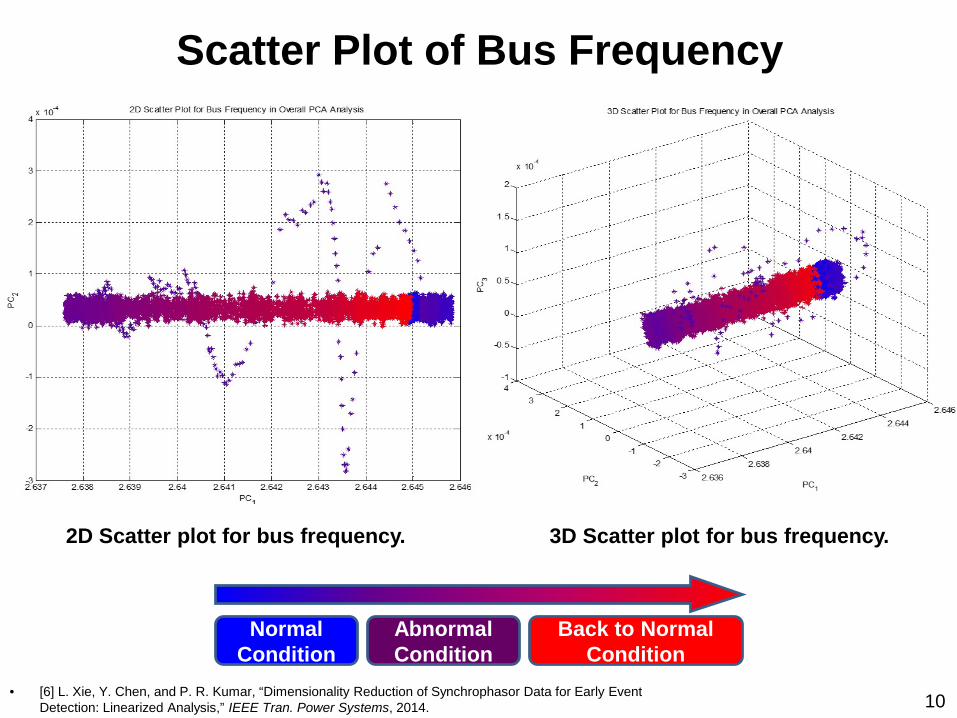
Scatter Plot of Bus Frequency
2D Scatter plot for bus frequency. 3D Scatter plot for bus frequency.
Normal Condition
Abnormal Condition
Back to Normal Condition
10• [6] L. Xie, Y. Chen, and P. R. Kumar, “Dimensionality Reduction of Synchrophasor Data for Early Event Detection: Linearized Analysis,” IEEE Tran. Power Systems, 2014.
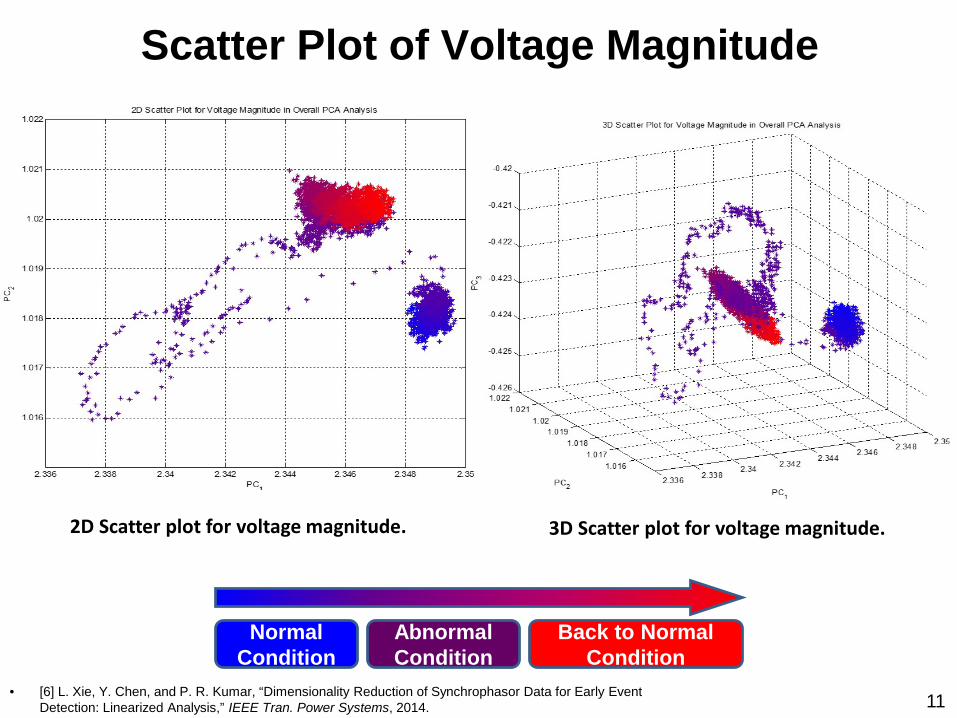
Scatter Plot of Voltage Magnitude
2D Scatter plot for voltage magnitude. 3D Scatter plot for voltage magnitude.
Normal Condition
Abnormal Condition
Back to Normal Condition
11• [6] L. Xie, Y. Chen, and P. R. Kumar, “Dimensionality Reduction of Synchrophasor Data for Early Event Detection: Linearized Analysis,” IEEE Tran. Power Systems, 2014.
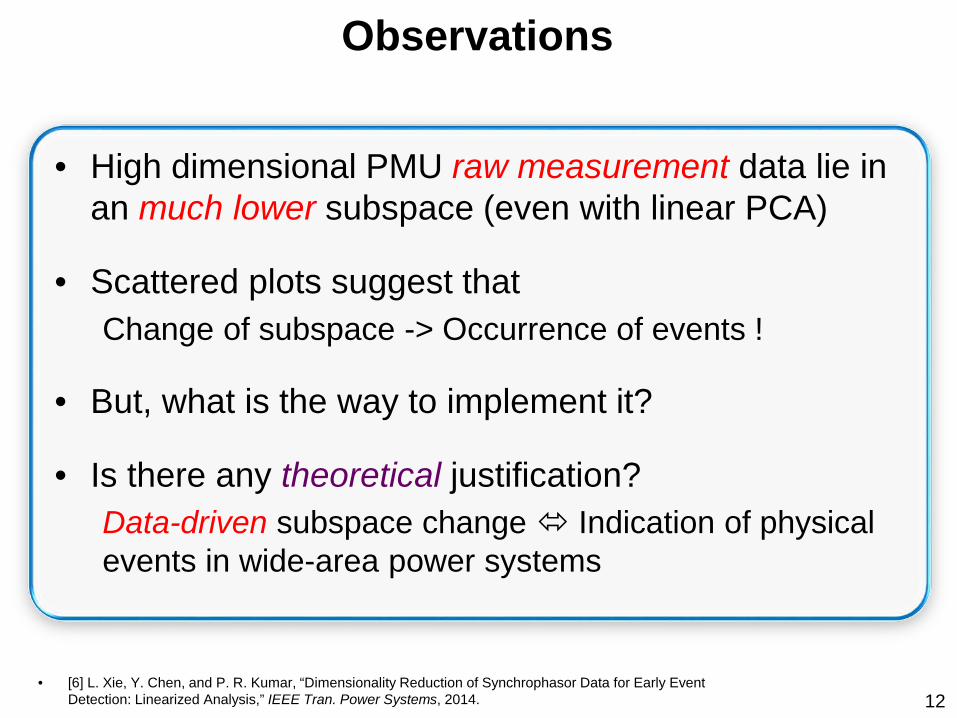
Observations
• High dimensional PMU raw measurement data lie in an much lower subspace (even with linear PCA)
• Scattered plots suggest that Change of subspace -> Occurrence of events !
• But, what is the way to implement it?
• Is there any theoretical justification? Data-driven subspace change Indication of physical events in wide-area power systems
• [6] L. Xie, Y. Chen, and P. R. Kumar, “Dimensionality Reduction of Synchrophasor Data for Early Event Detection: Linearized Analysis,” IEEE Tran. Power Systems, 2014. 12
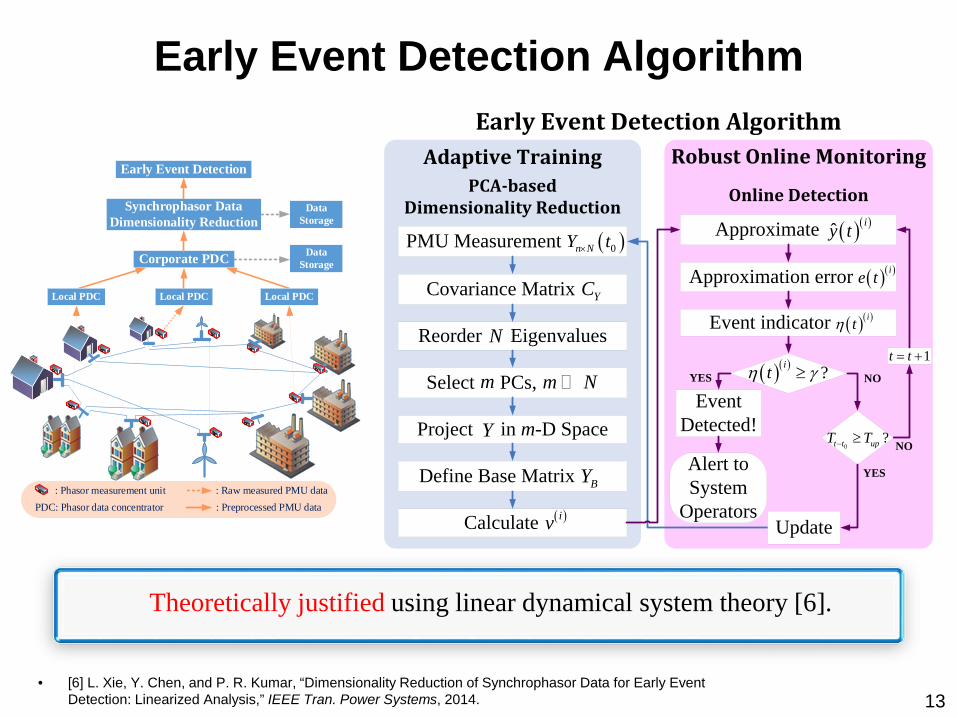
Corporate PDC DataStorage
Synchrophasor DataDimensionality Reduction
DataStorage
Early Event Detection
: Phasor measurement unitPDC: Phasor data concentrator
: Raw measured PMU data: Preprocessed PMU data
Local PDC Local PDCLocal PDC
Early Event Detection Algorithm
Adaptive TrainingPCA-based
Dimensionality Reduction
Robust Online Monitoring
Online Detection
PMU Measurement sfdfffa
Covariance Matrix ga
Reorder va Eigenvalues
Select fa PCs, ggagga
Project jfj in m-D Space
Define Base Matrix ags
Calculate sh
Approximate grffs
Approximation error gfsgf
Event indicator grss
Alert toSystem
Operators
( )0n NY t×
YC
BY
( )iv
N
m m N
( )( )ˆ iy t
( )( )ie t
( )( )itη
YES
1t t= +
NOY
Early Event Detection Algorithm
( )( ) ?itη γ≥
EventDetected!
0?t t upT T− ≥
NO
YES
Update
Theoretically justified using linear dynamical system theory [6].
• [6] L. Xie, Y. Chen, and P. R. Kumar, “Dimensionality Reduction of Synchrophasor Data for Early Event Detection: Linearized Analysis,” IEEE Tran. Power Systems, 2014. 13
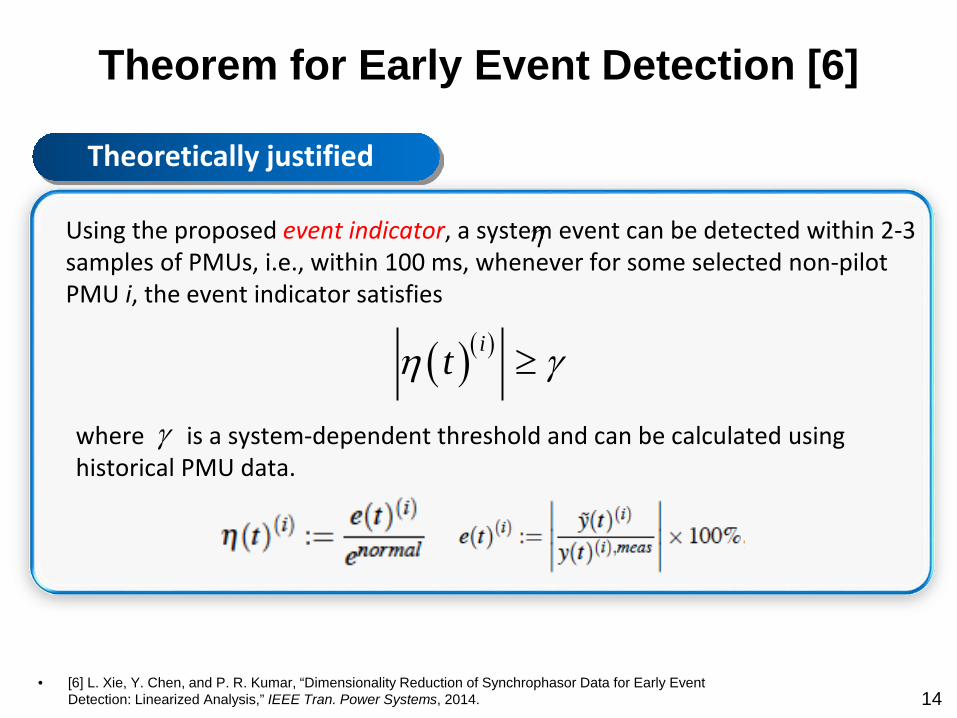
Theorem for Early Event Detection [6]
Using the proposed event indicator, a system event can be detected within 2-3 samples of PMUs, i.e., within 100 ms, whenever for some selected non-pilot PMU i, the event indicator satisfies
( )( )itη γ≥
where is a system-dependent threshold and can be calculated using historical PMU data.
γ
η
Theoretically justified
14• [6] L. Xie, Y. Chen, and P. R. Kumar, “Dimensionality Reduction of Synchrophasor Data for Early Event
Detection: Linearized Analysis,” IEEE Tran. Power Systems, 2014.
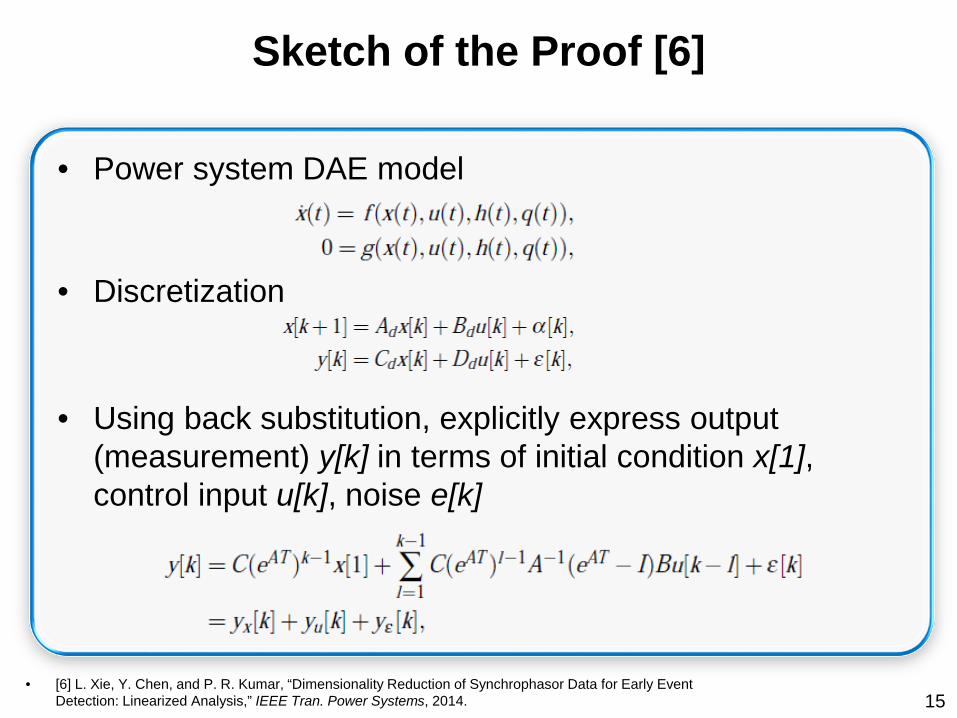
Sketch of the Proof [6]
• Power system DAE model
• Discretization
• Using back substitution, explicitly express output (measurement) y[k] in terms of initial condition x[1], control input u[k], noise e[k]
• [6] L. Xie, Y. Chen, and P. R. Kumar, “Dimensionality Reduction of Synchrophasor Data for Early Event Detection: Linearized Analysis,” IEEE Tran. Power Systems, 2014. 15
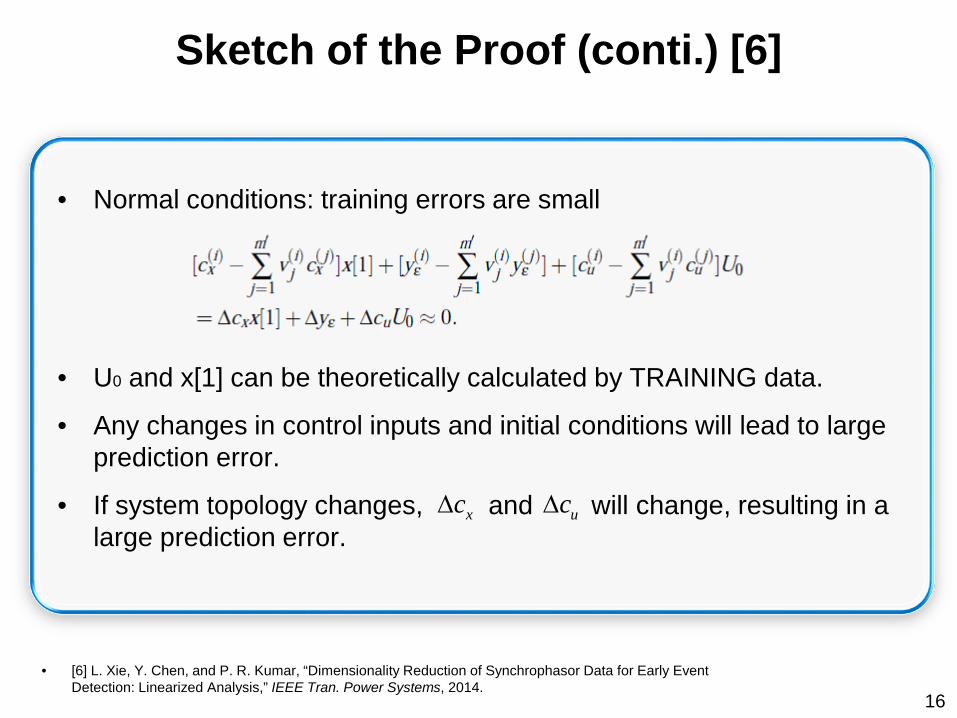
Sketch of the Proof (conti.) [6]
• Normal conditions: training errors are small
• U0 and x[1] can be theoretically calculated by TRAINING data.
• Any changes in control inputs and initial conditions will lead to large prediction error.
• If system topology changes, and will change, resulting in a large prediction error.
xc∆ uc∆
• [6] L. Xie, Y. Chen, and P. R. Kumar, “Dimensionality Reduction of Synchrophasor Data for Early Event Detection: Linearized Analysis,” IEEE Tran. Power Systems, 2014.
16
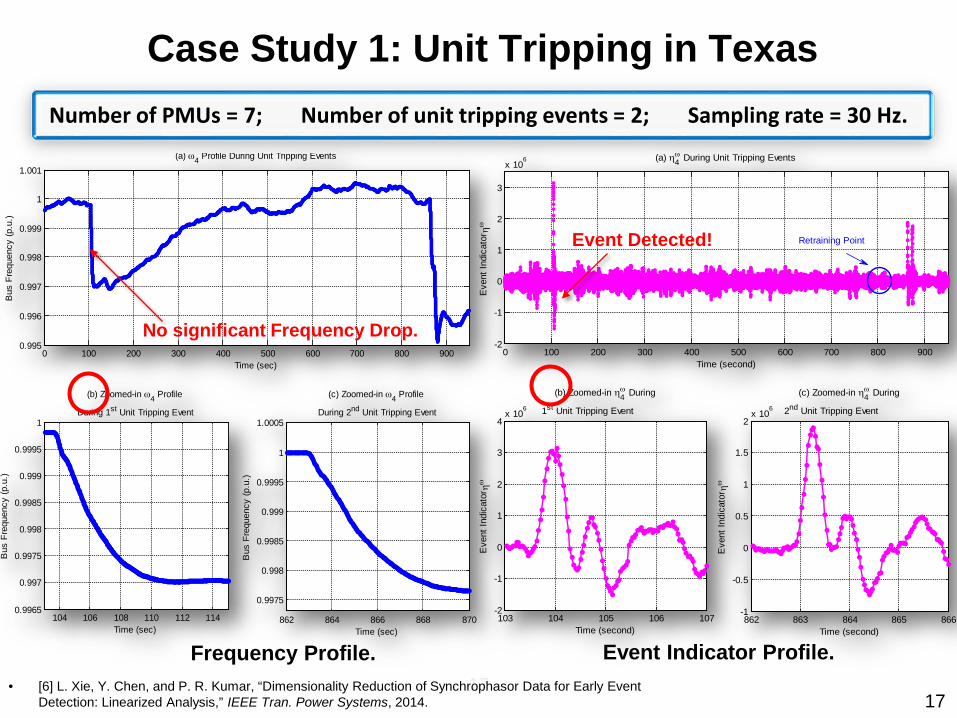
Frequency Profile. Event Indicator Profile.
0 100 200 300 400 500 600 700 800 9000.995
0.996
0.997
0.998
0.999
1
1.001
Time (sec)
Bus
Fre
quen
cy (p
.u.)
(a) ω4 Profile During Unit Tripping Events
104 106 108 110 112 1140.9965
0.997
0.9975
0.998
0.9985
0.999
0.9995
1
Time (sec)
Bus
Fre
quen
cy (p
.u.)
(b) Zoomed-in ω4 Profile
During 1st Unit Tripping Event
862 864 866 868 870
0.9975
0.998
0.9985
0.999
0.9995
1
1.0005
Time (sec)
Bus
Fre
quen
cy (p
.u.)
(c) Zoomed-in ω4 Profile
During 2nd Unit Tripping Event
0 100 200 300 400 500 600 700 800 900-2
-1
0
1
2
3
x 106
Time (second)
Even
t Ind
icat
or ηω
(a) ηω4 During Unit Tripping Events
103 104 105 106 107-2
-1
0
1
2
3
4x 10
6
Time (second)
Even
t Ind
icat
or ηω
(b) Zoomed-in ηω4 During
1st Unit Tripping Event
862 863 864 865 866-1
-0.5
0
0.5
1
1.5
2x 10
6
Time (second)
Even
t Ind
icat
or ηω
(c) Zoomed-in ηω4 During
2nd Unit Tripping Event
Retraining Point
Number of PMUs = 7; Number of unit tripping events = 2; Sampling rate = 30 Hz.
Event Detected!
No significant Frequency Drop.
17
Case Study 1: Unit Tripping in Texas
17• [6] L. Xie, Y. Chen, and P. R. Kumar, “Dimensionality Reduction of Synchrophasor Data for Early Event
Detection: Linearized Analysis,” IEEE Tran. Power Systems, 2014.
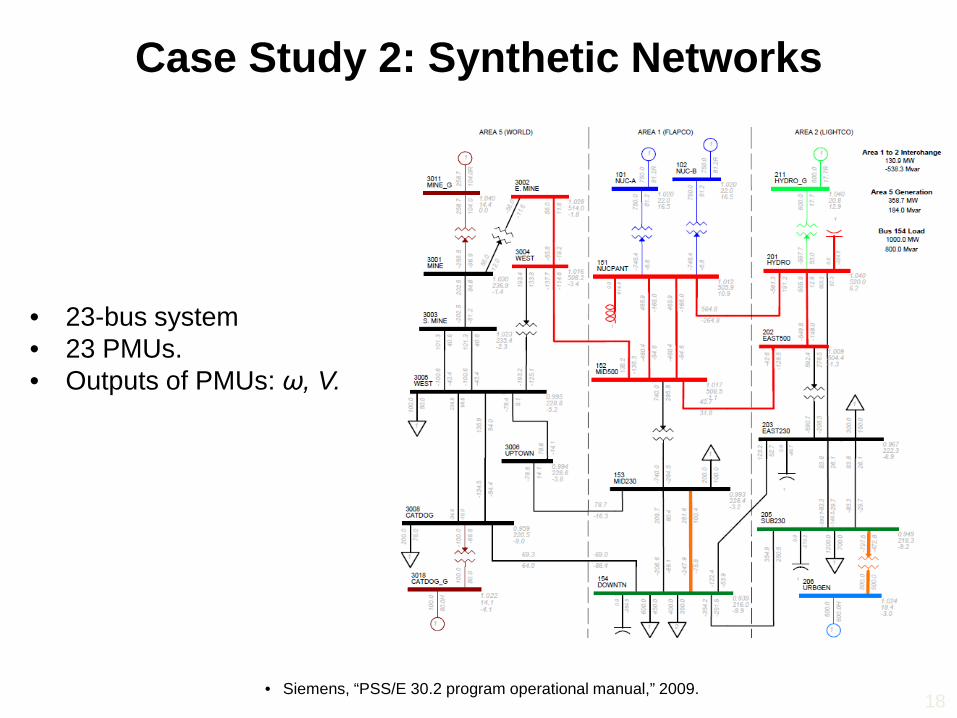
Case Study 2: Synthetic Networks
• 23-bus system• 23 PMUs.• Outputs of PMUs: ω, V.
• Siemens, “PSS/E 30.2 program operational manual,” 2009.18
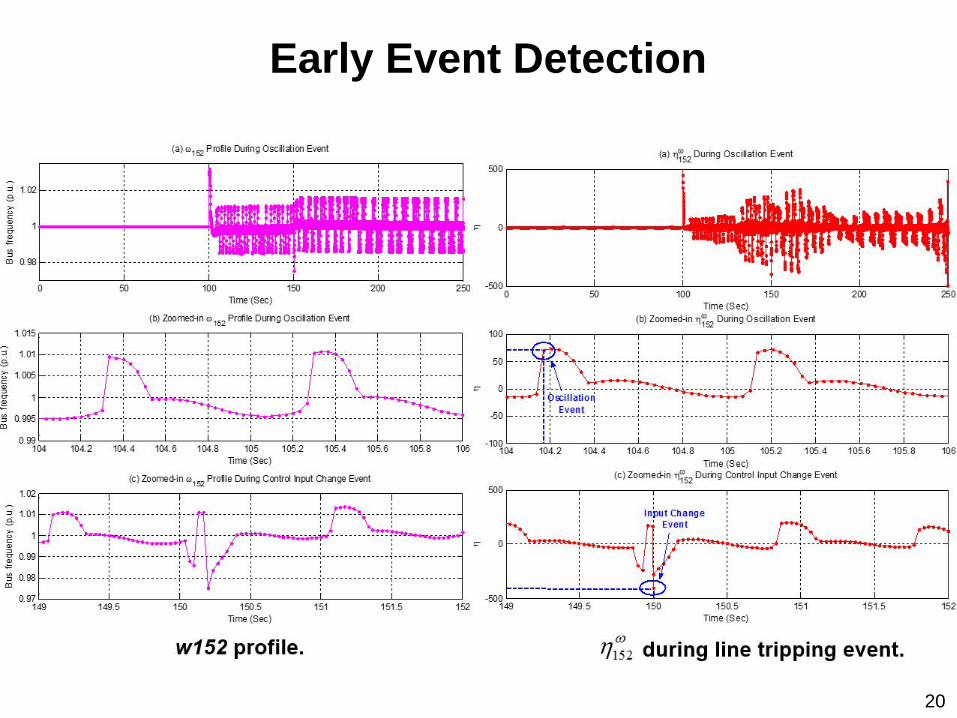
19
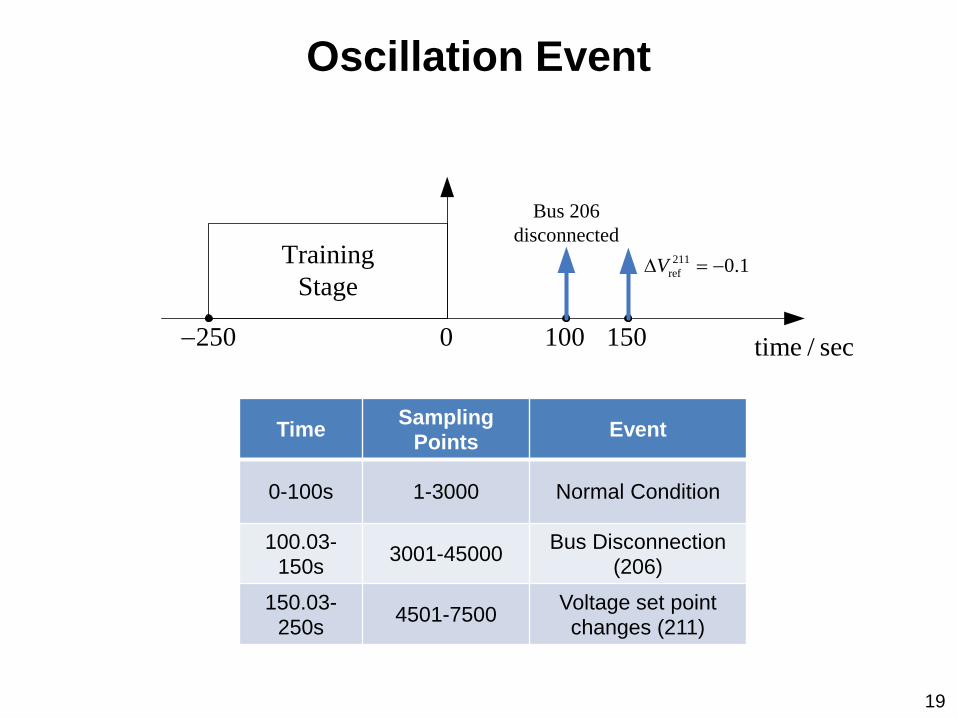
Time SamplingPoints Event
0-100s 1-3000 Normal Condition
100.03-150s 3001-45000 Bus Disconnection
(206)150.03-
250s 4501-7500 Voltage set point changes (211)
Oscillation Event
time / sec250− 0 100 150
Bus 206 disconnected
TrainingStage
211ref 0.1V∆ = −
20
Early Event Detection
Potential Benefits of The Algorithm
• How EARLY is the proposed algorithm?Proposed Method: potentially within a few samples(<0.1 seconds)
• Most Oscillation monitoring system (OMS) needs 10 sec to detect the oscillation.
• No system topology, no system model.
• Ongoing work: event classification and localization.
21• [6] L. Xie, Y. Chen, and P. R. Kumar, “Dimensionality Reduction of Synchrophasor Data for Early Event
Detection: Linearized Analysis,” IEEE Tran. Power Systems, 2014.
Presentation Outline
• Introduction
• Part I: PMU Dimensionality Reduction & Early Event Detection
• Part II: Real-Time Detection of Low-Quality PMU Measurements
• Concluding Remarks
22
23
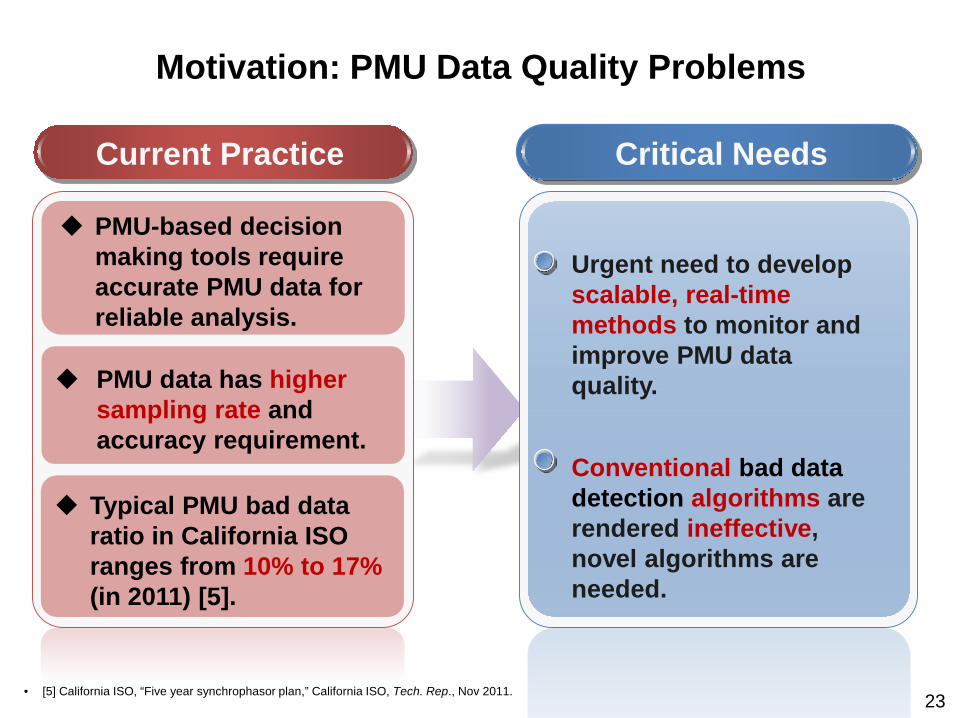
Current Practice Critical Needs
Urgent need to develop scalable, real-time methods to monitor and improve PMU data quality.
Conventional bad data detection algorithms are rendered ineffective, novel algorithms are needed.
PMU-based decision making tools requireaccurate PMU data for reliable analysis.
PMU data has higher sampling rate and accuracy requirement.
Typical PMU bad data ratio in California ISO ranges from 10% to 17% (in 2011) [5].
Motivation: PMU Data Quality Problems
• [5] California ISO, “Five year synchrophasor plan,” California ISO, Tech. Rep., Nov 2011.
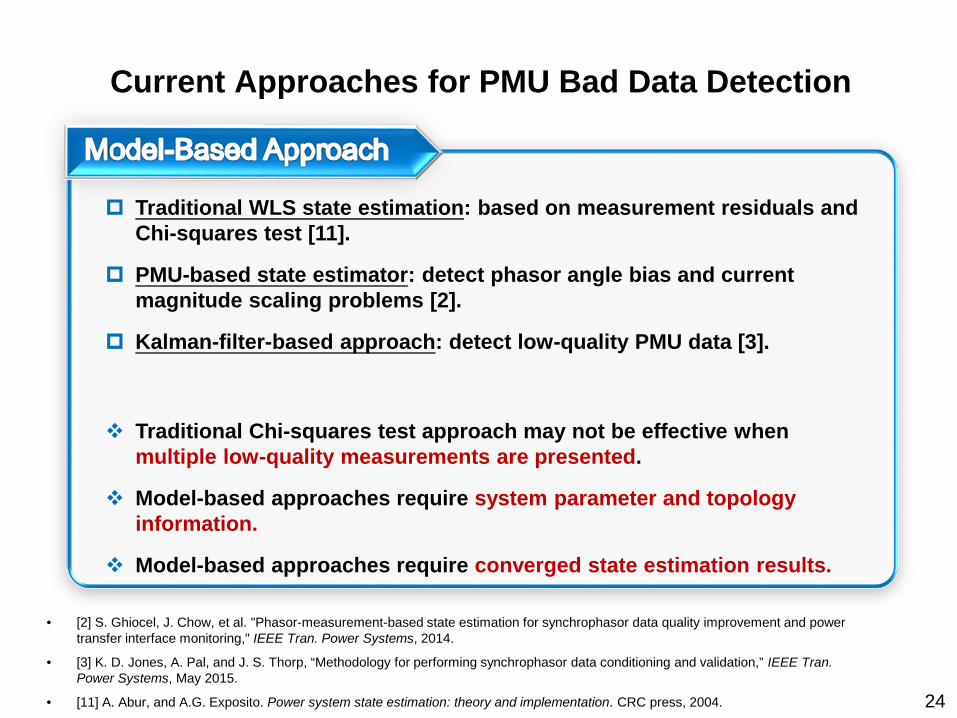
Current Approaches for PMU Bad Data Detection
24
Traditional WLS state estimation: based on measurement residuals and Chi-squares test [11].
PMU-based state estimator: detect phasor angle bias and current magnitude scaling problems [2].
Kalman-filter-based approach: detect low-quality PMU data [3].
Traditional Chi-squares test approach may not be effective when multiple low-quality measurements are presented.
Model-based approaches require system parameter and topology information.
Model-based approaches require converged state estimation results.
• [2] S. Ghiocel, J. Chow, et al. "Phasor-measurement-based state estimation for synchrophasor data quality improvement and power transfer interface monitoring," IEEE Tran. Power Systems, 2014.
• [3] K. D. Jones, A. Pal, and J. S. Thorp, “Methodology for performing synchrophasor data conditioning and validation,” IEEE Tran. Power Systems, May 2015.
• [11] A. Abur, and A.G. Exposito. Power system state estimation: theory and implementation. CRC press, 2004.
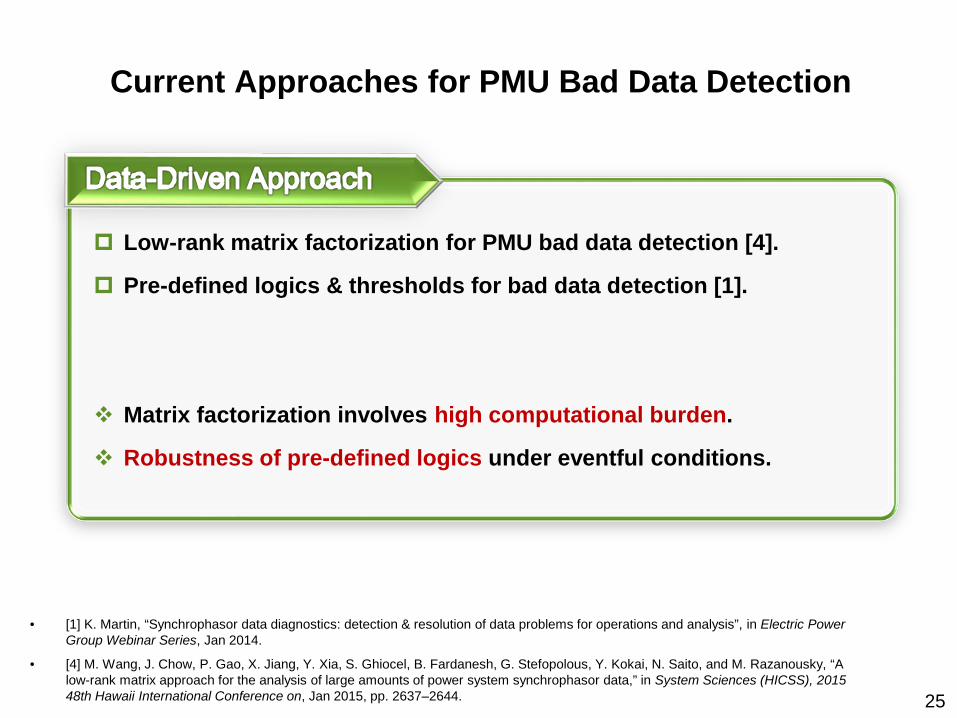
Current Approaches for PMU Bad Data Detection
25
Low-rank matrix factorization for PMU bad data detection [4].
Pre-defined logics & thresholds for bad data detection [1].
Matrix factorization involves high computational burden.
Robustness of pre-defined logics under eventful conditions.
• [1] K. Martin, “Synchrophasor data diagnostics: detection & resolution of data problems for operations and analysis”, in Electric Power Group Webinar Series, Jan 2014.
• [4] M. Wang, J. Chow, P. Gao, X. Jiang, Y. Xia, S. Ghiocel, B. Fardanesh, G. Stefopolous, Y. Kokai, N. Saito, and M. Razanousky, “A low-rank matrix approach for the analysis of large amounts of power system synchrophasor data,” in System Sciences (HICSS), 2015 48th Hawaii International Conference on, Jan 2015, pp. 2637–2644.
26
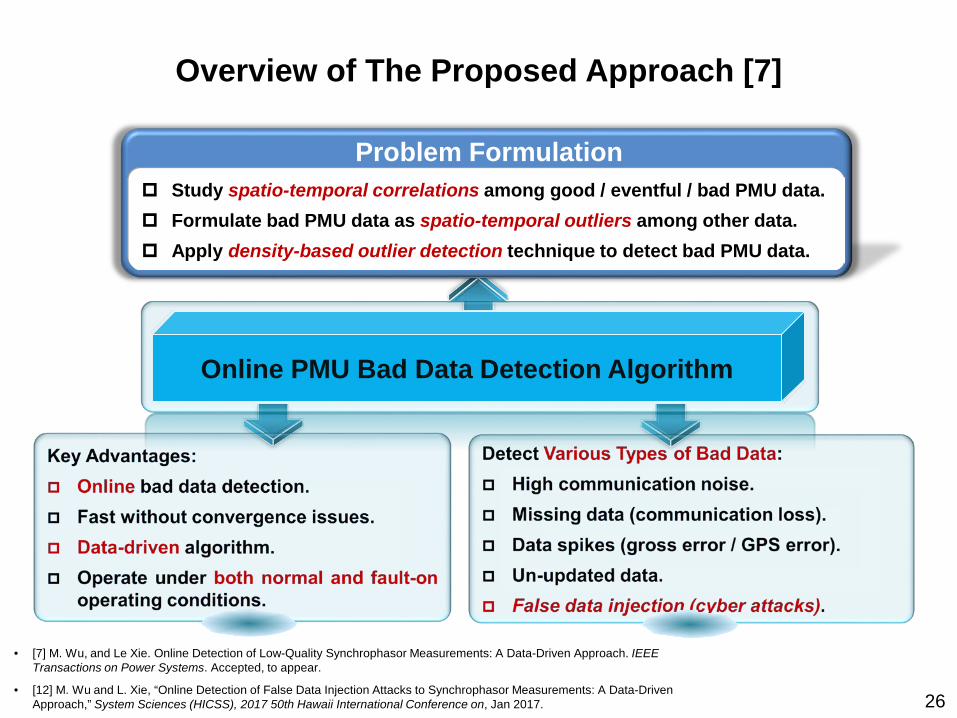
Overview of The Proposed Approach [7]
Online PMU Bad Data Detection Algorithm
Problem Formulation Study spatio-temporal correlations among good / eventful / bad PMU data. Formulate bad PMU data as spatio-temporal outliers among other data. Apply density-based outlier detection technique to detect bad PMU data.
• [7] M. Wu, and Le Xie. Online Detection of Low-Quality Synchrophasor Measurements: A Data-Driven Approach. IEEE Transactions on Power Systems. Accepted, to appear.
• [12] M. Wu and L. Xie, “Online Detection of False Data Injection Attacks to Synchrophasor Measurements: A Data-Driven Approach,” System Sciences (HICSS), 2017 50th Hawaii International Conference on, Jan 2017.
27
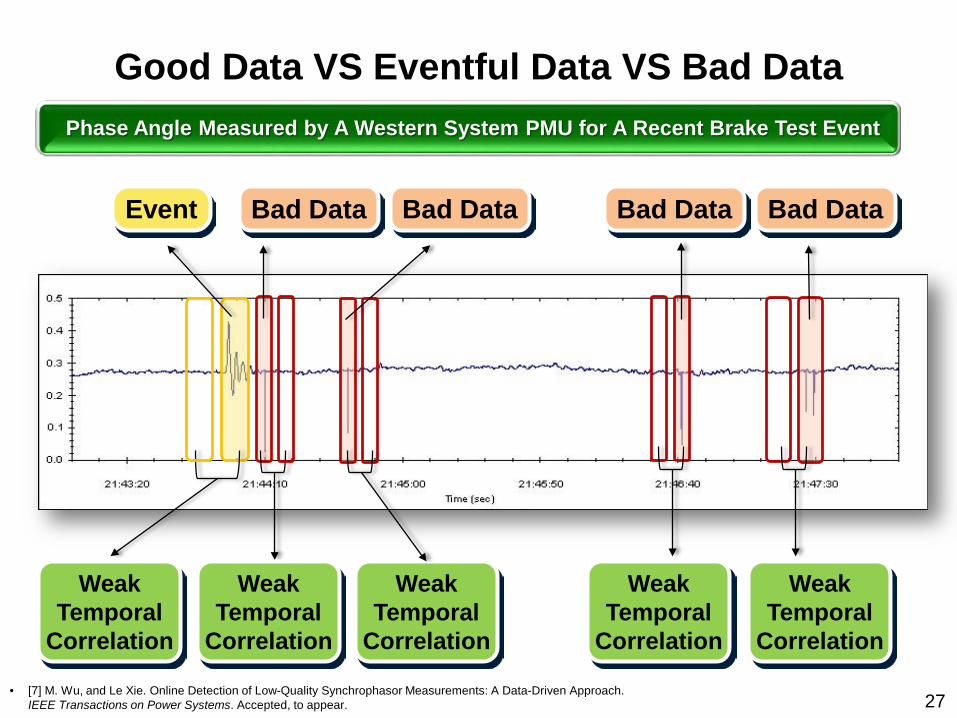
Good Data VS Eventful Data VS Bad DataPhase Angle Measured by A Western System PMU for A Recent Brake Test Event
Event Bad DataBad Data
WeakTemporal
Correlation
Bad DataBad Data
WeakTemporal
Correlation
WeakTemporal
Correlation
WeakTemporal
Correlation
WeakTemporal
Correlation
• [7] M. Wu, and Le Xie. Online Detection of Low-Quality Synchrophasor Measurements: A Data-Driven Approach. IEEE Transactions on Power Systems. Accepted, to appear.
28
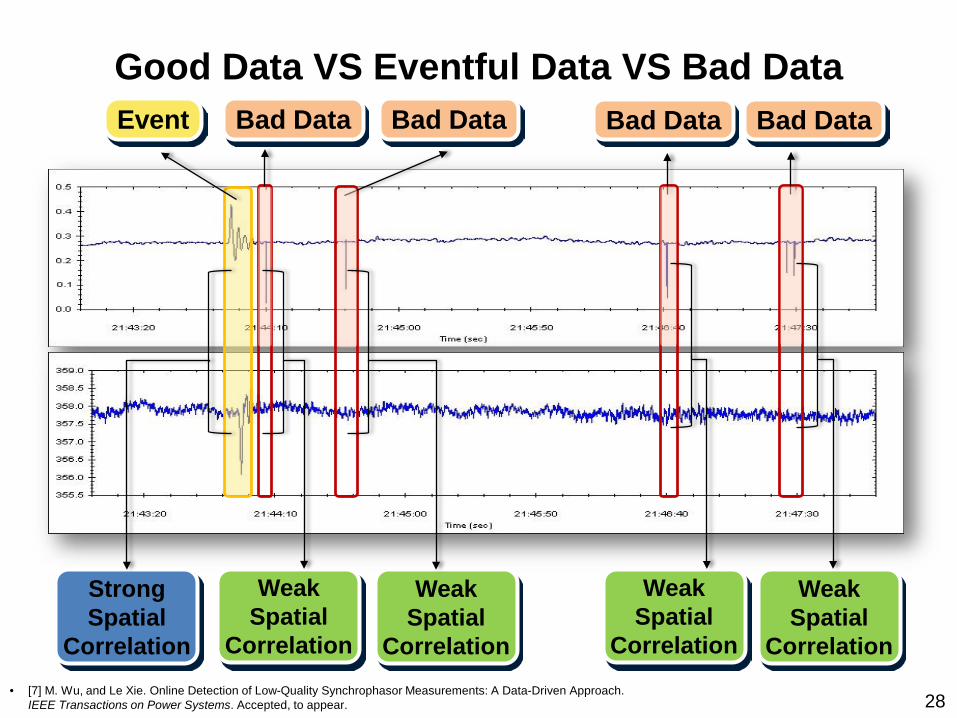
Good Data VS Eventful Data VS Bad DataEvent Bad DataBad Data Bad DataBad Data
WeakSpatial
Correlation
WeakSpatial
Correlation
WeakSpatial
Correlation
WeakSpatial
Correlation
StrongSpatial
Correlation• [7] M. Wu, and Le Xie. Online Detection of Low-Quality Synchrophasor Measurements: A Data-Driven Approach.
IEEE Transactions on Power Systems. Accepted, to appear.
29
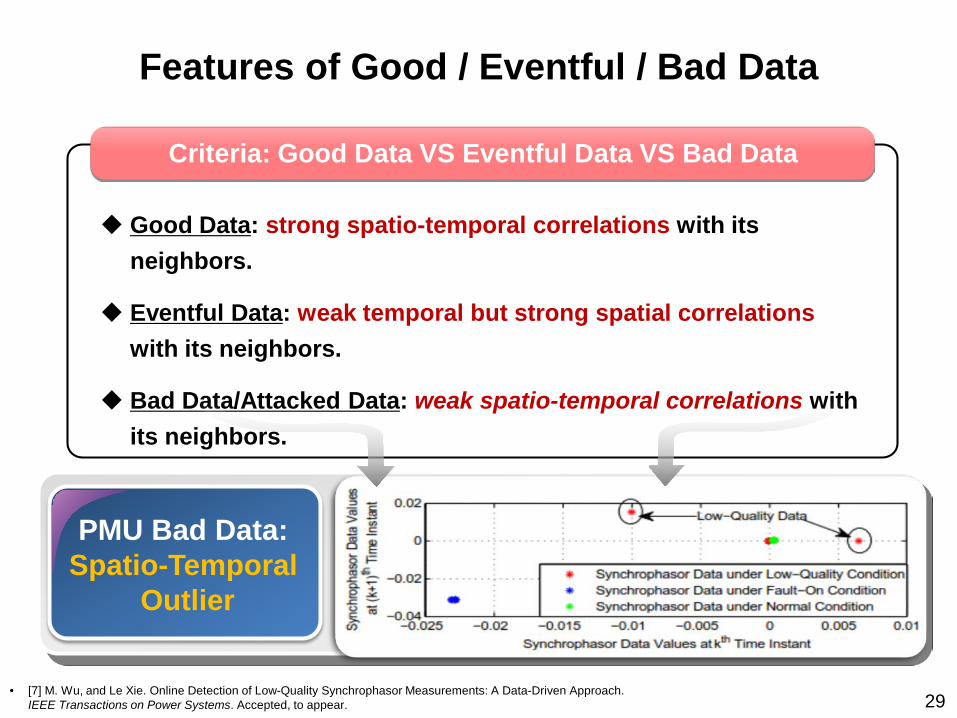
Features of Good / Eventful / Bad Data
PMU Bad Data: Spatio-Temporal
Outlier
Criteria: Good Data VS Eventful Data VS Bad Data
Good Data: strong spatio-temporal correlations with its neighbors.
Eventful Data: weak temporal but strong spatial correlations with its neighbors.
Bad Data/Attacked Data: weak spatio-temporal correlations with its neighbors.
• [7] M. Wu, and Le Xie. Online Detection of Low-Quality Synchrophasor Measurements: A Data-Driven Approach. IEEE Transactions on Power Systems. Accepted, to appear.
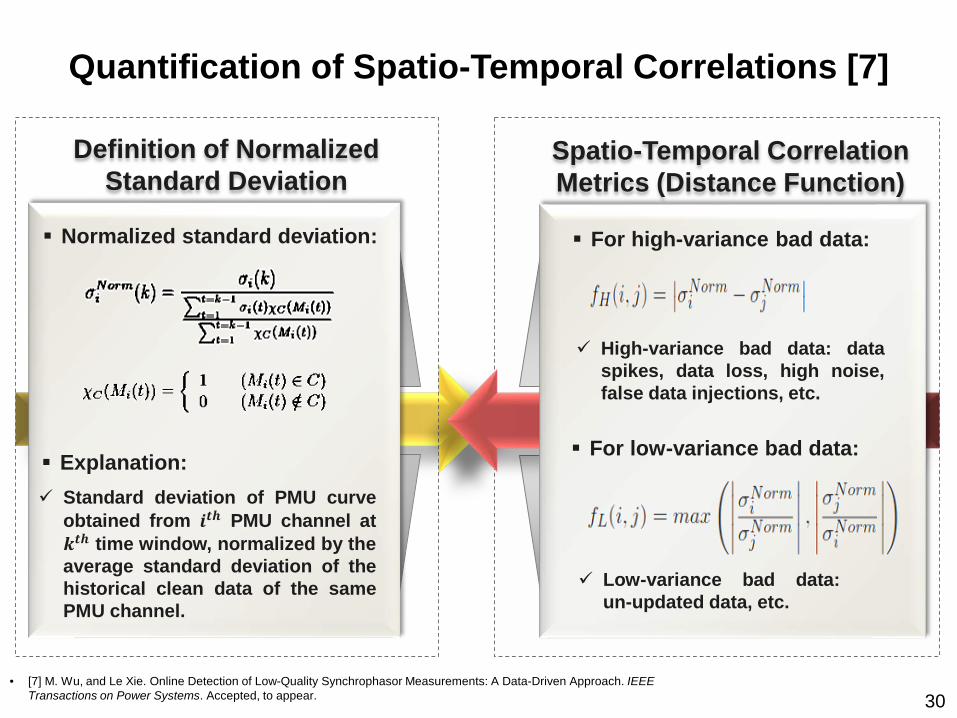
Quantification of Spatio-Temporal Correlations [7]
30
Definition of Normalized Standard Deviation
Normalized standard deviation:
Explanation:
Spatio-Temporal Correlation Metrics (Distance Function)
Standard deviation of PMU curveobtained from 𝒊𝒊𝒕𝒕𝒕𝒕 PMU channel at𝒌𝒌𝒕𝒕𝒕𝒕 time window, normalized by theaverage standard deviation of thehistorical clean data of the samePMU channel.
For high-variance bad data:
For low-variance bad data:
Low-variance bad data:un-updated data, etc.
High-variance bad data: dataspikes, data loss, high noise,false data injections, etc.
• [7] M. Wu, and Le Xie. Online Detection of Low-Quality Synchrophasor Measurements: A Data-Driven Approach. IEEE Transactions on Power Systems. Accepted, to appear.
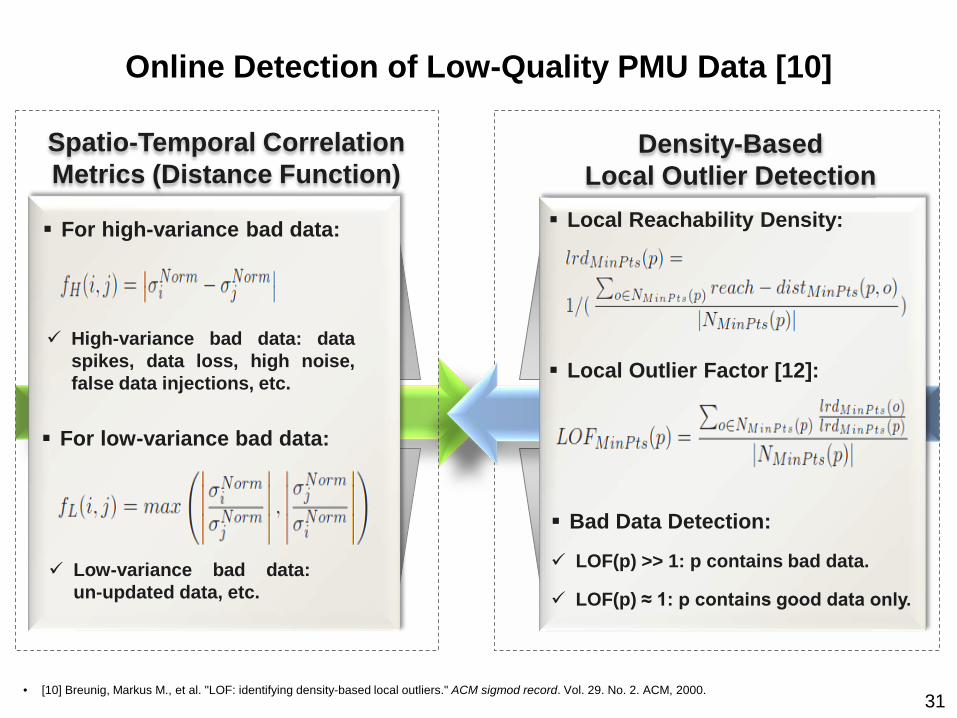
Online Detection of Low-Quality PMU Data [10]
31
Spatio-Temporal Correlation Metrics (Distance Function)
For high-variance bad data:
For low-variance bad data:
Density-Based Local Outlier Detection
Local Outlier Factor [12]:
Local Reachability Density:
Bad Data Detection:
LOF(p) >> 1: p contains bad data.
LOF(p) ≈ 1: p contains good data only. Low-variance bad data:
un-updated data, etc.
High-variance bad data: dataspikes, data loss, high noise,false data injections, etc.
• [10] Breunig, Markus M., et al. "LOF: identifying density-based local outliers." ACM sigmod record. Vol. 29. No. 2. ACM, 2000.
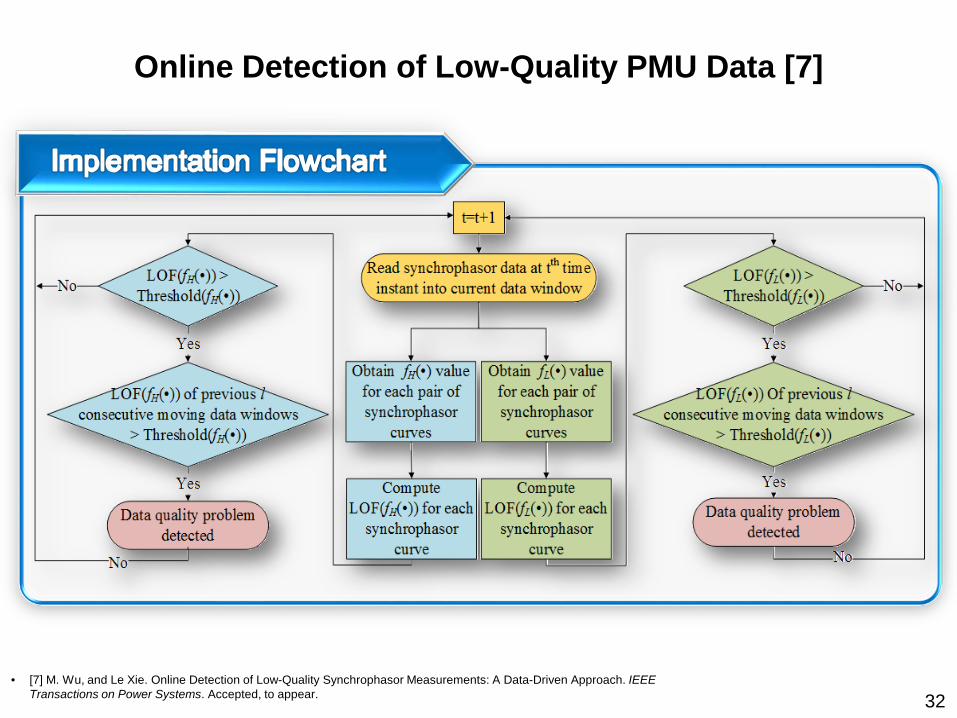
Online Detection of Low-Quality PMU Data [7]
32• [7] M. Wu, and Le Xie. Online Detection of Low-Quality Synchrophasor Measurements: A Data-Driven Approach. IEEE
Transactions on Power Systems. Accepted, to appear.
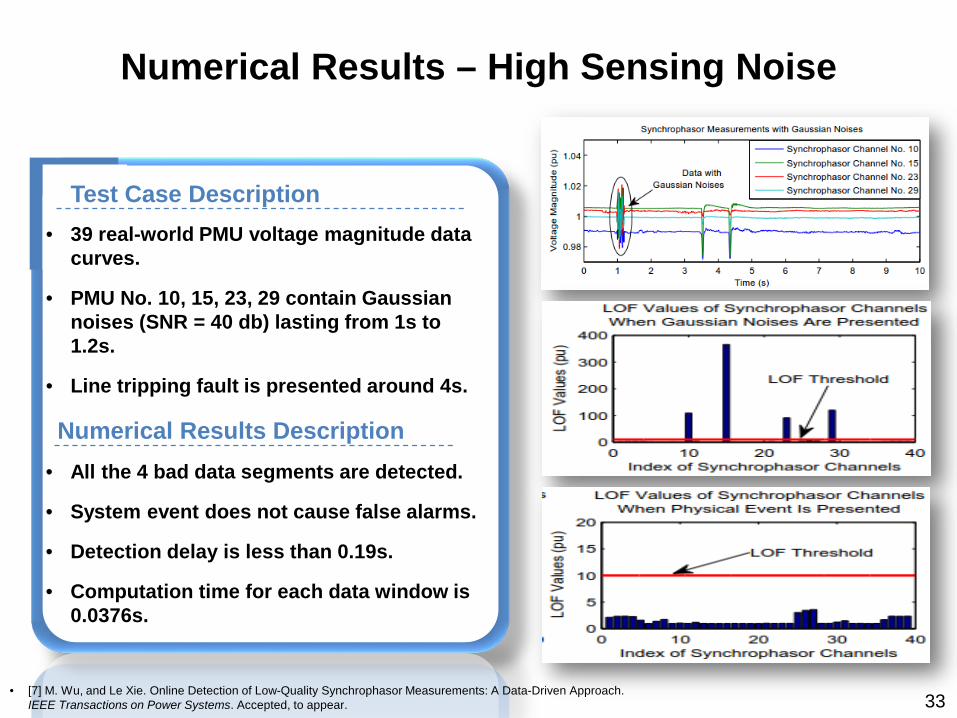
Numerical Results – High Sensing Noise
33
Test Case Description• 39 real-world PMU voltage magnitude data
curves.
• PMU No. 10, 15, 23, 29 contain Gaussian noises (SNR = 40 db) lasting from 1s to 1.2s.
• Line tripping fault is presented around 4s.
Numerical Results Description• All the 4 bad data segments are detected.
• System event does not cause false alarms.
• Detection delay is less than 0.19s.
• Computation time for each data window is 0.0376s.
• [7] M. Wu, and Le Xie. Online Detection of Low-Quality Synchrophasor Measurements: A Data-Driven Approach. IEEE Transactions on Power Systems. Accepted, to appear.
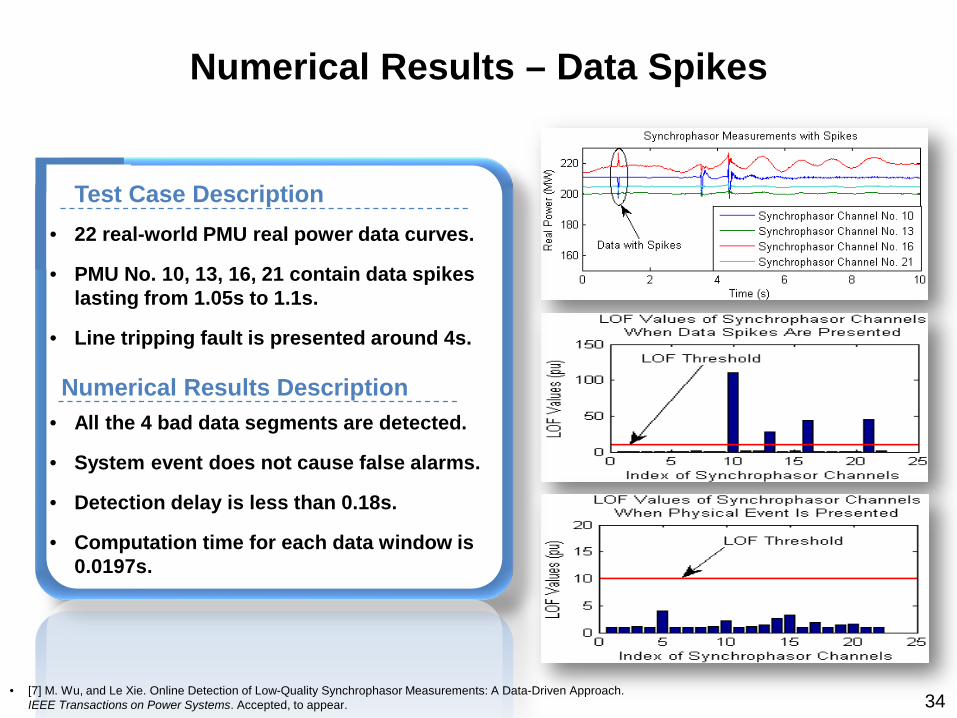
Numerical Results – Data Spikes
34
Test Case Description• 22 real-world PMU real power data curves.
• PMU No. 10, 13, 16, 21 contain data spikes lasting from 1.05s to 1.1s.
• Line tripping fault is presented around 4s.
Numerical Results Description• All the 4 bad data segments are detected.
• System event does not cause false alarms.
• Detection delay is less than 0.18s.
• Computation time for each data window is 0.0197s.
• [7] M. Wu, and Le Xie. Online Detection of Low-Quality Synchrophasor Measurements: A Data-Driven Approach. IEEE Transactions on Power Systems. Accepted, to appear.
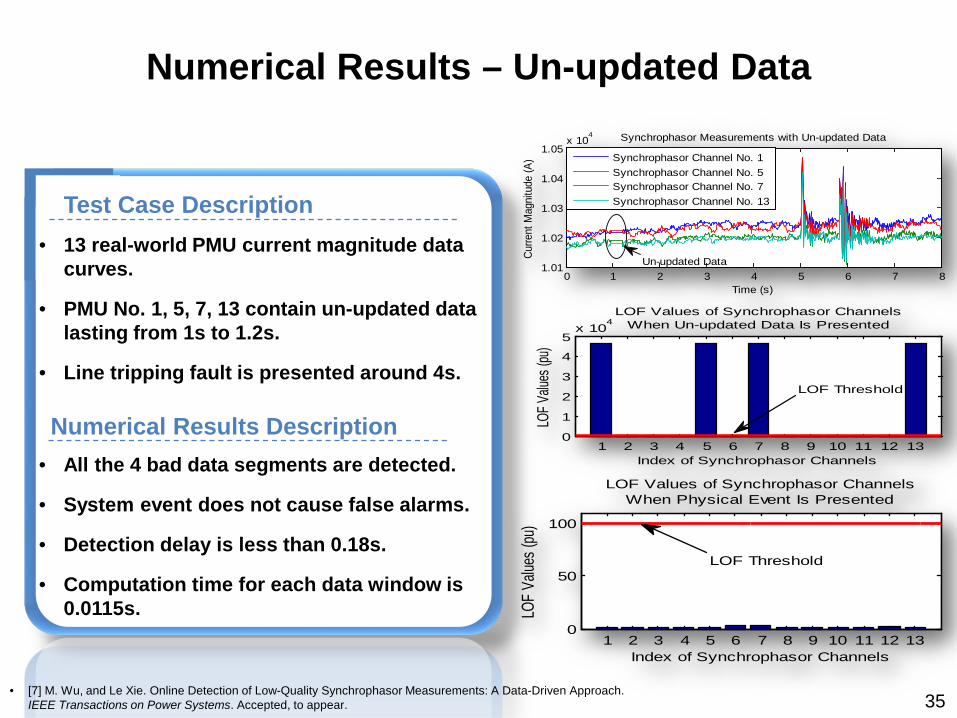
Numerical Results – Un-updated Data
35
Test Case Description• 13 real-world PMU current magnitude data
curves.
• PMU No. 1, 5, 7, 13 contain un-updated data lasting from 1s to 1.2s.
• Line tripping fault is presented around 4s.
Numerical Results Description• All the 4 bad data segments are detected.
• System event does not cause false alarms.
• Detection delay is less than 0.18s.
• Computation time for each data window is 0.0115s.
1 2 3 4 5 6 7 8 9 10 11 12 130
1
2
3
4
5x 10
4
Index of Synchrophasor Channels
LOF V
alues
(pu)
LOF Values of Synchrophasor ChannelsWhen Un-updated Data Is Presented
LOF Threshold
1 2 3 4 5 6 7 8 9 10 11 12 130
50
100
Index of Synchrophasor Channels
LOF V
alues
(pu)
LOF Values of Synchrophasor ChannelsWhen Physical Event Is Presented
LOF Threshold
0 1 2 3 4 5 6 7 81.01
1.02
1.03
1.04
1.05x 10
4
Time (s)
Curre
nt M
agni
tude
(A)
Synchrophasor Measurements with Un-updated Data
Synchrophasor Channel No. 1Synchrophasor Channel No. 5Synchrophasor Channel No. 7Synchrophasor Channel No. 13
Un-updated Data
• [7] M. Wu, and Le Xie. Online Detection of Low-Quality Synchrophasor Measurements: A Data-Driven Approach. IEEE Transactions on Power Systems. Accepted, to appear.
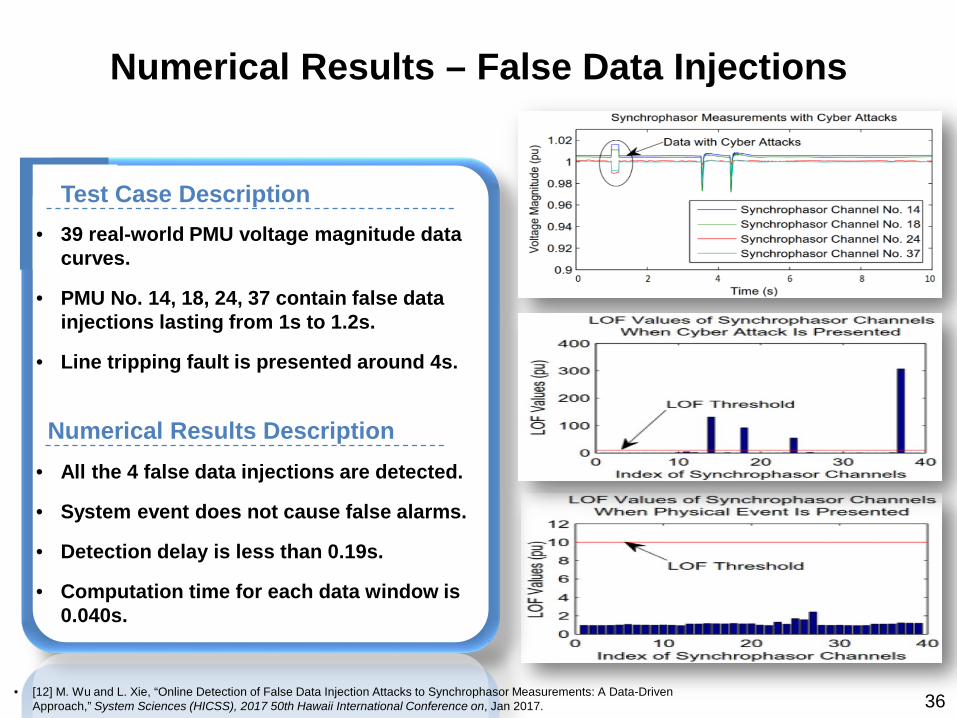
Numerical Results – False Data Injections
36
Test Case Description• 39 real-world PMU voltage magnitude data
curves.
• PMU No. 14, 18, 24, 37 contain false data injections lasting from 1s to 1.2s.
• Line tripping fault is presented around 4s.
Numerical Results Description• All the 4 false data injections are detected.
• System event does not cause false alarms.
• Detection delay is less than 0.19s.
• Computation time for each data window is 0.040s.
• [12] M. Wu and L. Xie, “Online Detection of False Data Injection Attacks to Synchrophasor Measurements: A Data-Driven Approach,” System Sciences (HICSS), 2017 50th Hawaii International Conference on, Jan 2017.
37
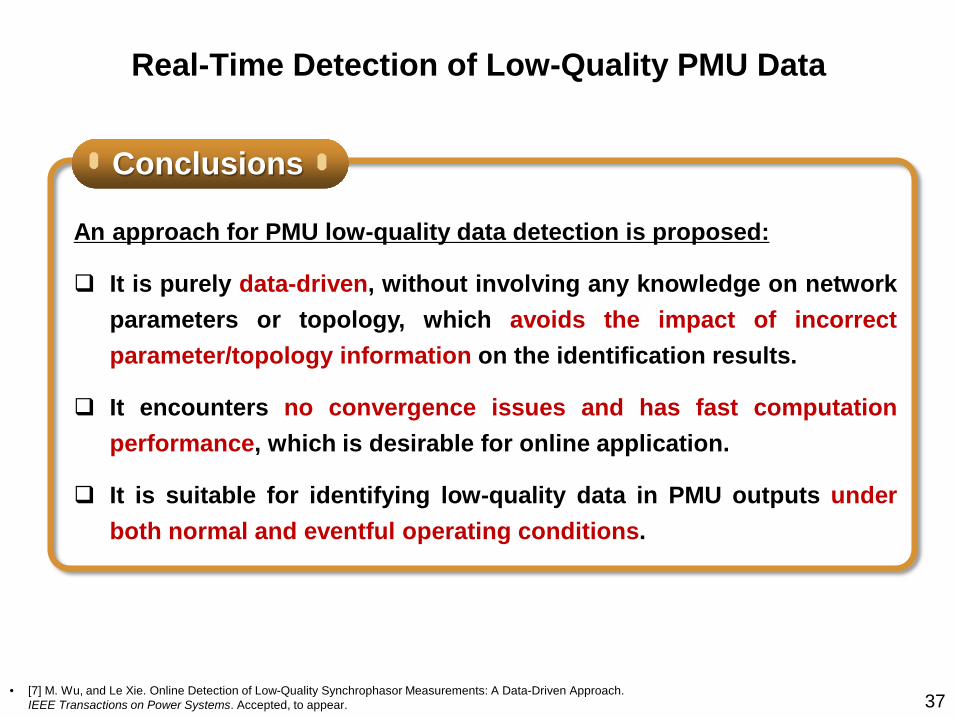
Real-Time Detection of Low-Quality PMU Data
Conclusions
An approach for PMU low-quality data detection is proposed:
It is purely data-driven, without involving any knowledge on networkparameters or topology, which avoids the impact of incorrectparameter/topology information on the identification results.
It encounters no convergence issues and has fast computationperformance, which is desirable for online application.
It is suitable for identifying low-quality data in PMU outputs underboth normal and eventful operating conditions.
• [7] M. Wu, and Le Xie. Online Detection of Low-Quality Synchrophasor Measurements: A Data-Driven Approach. IEEE Transactions on Power Systems. Accepted, to appear.
Presentation Outline
• Introduction
• Part I: PMU Dimensionality Reduction & Early Event Detection
• Part II: Real-Time Detection of Low-Quality PMU Measurements
• Concluding Remarks
38
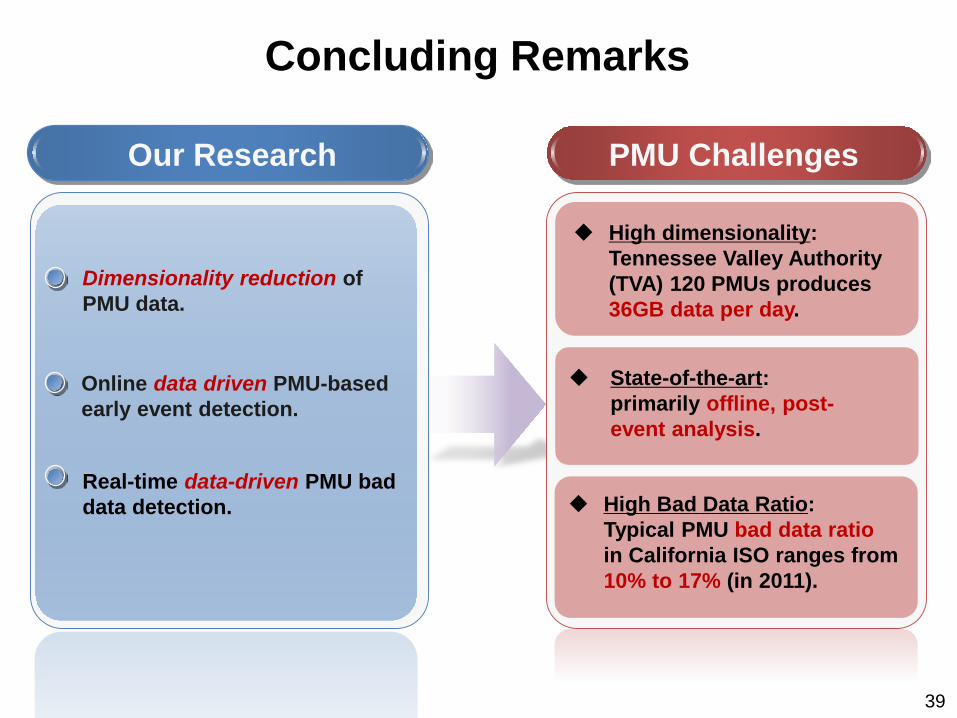
Concluding Remarks
PMU Challenges
High dimensionality: Tennessee Valley Authority (TVA) 120 PMUs produces 36GB data per day.
State-of-the-art: primarily offline, post-event analysis.
High Bad Data Ratio: Typical PMU bad data ratio in California ISO ranges from 10% to 17% (in 2011).
Our Research
Dimensionality reduction of PMU data.
Real-time data-driven PMU bad data detection.
Online data driven PMU-based early event detection.
39
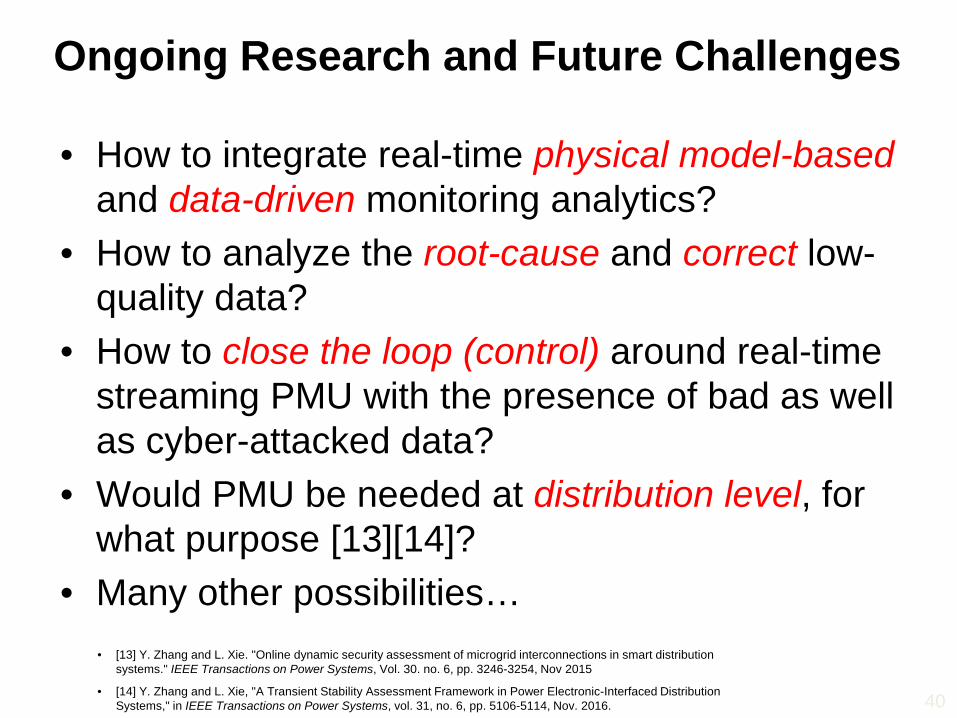
Ongoing Research and Future Challenges
• How to integrate real-time physical model-basedand data-driven monitoring analytics?
• How to analyze the root-cause and correct low-quality data?
• How to close the loop (control) around real-time streaming PMU with the presence of bad as well as cyber-attacked data?
• Would PMU be needed at distribution level, for what purpose [13][14]?
• Many other possibilities…
40
• [13] Y. Zhang and L. Xie. "Online dynamic security assessment of microgrid interconnections in smart distribution systems." IEEE Transactions on Power Systems, Vol. 30. no. 6, pp. 3246-3254, Nov 2015
• [14] Y. Zhang and L. Xie, "A Transient Stability Assessment Framework in Power Electronic-Interfaced Distribution Systems," in IEEE Transactions on Power Systems, vol. 31, no. 6, pp. 5106-5114, Nov. 2016.
References
[1] K. Martin, “Synchrophasor data diagnostics: detection & resolution of data problems for operations and analysis”, in Electric Power Group Webinar Series, Jan 2014.
[2] S. Ghiocel, J. Chow, et al. "Phasor-measurement-based state estimation for synchrophasor data quality improvement and power transfer interface monitoring," IEEE Tran. Power Systems, 2014.
[3] K. D. Jones, A. Pal, and J. S. Thorp, “Methodology for performing synchrophasor data conditioning and validation,” IEEE Tran. Power Systems, May 2015.
[4] M. Wang, J. Chow, P. Gao, X. Jiang, Y. Xia, S. Ghiocel, B. Fardanesh, G. Stefopolous, Y. Kokai, N. Saito, and M. Razanousky, “A low-rank matrix approach for the analysis of large amounts of power system synchrophasor data,” in System Sciences (HICSS), 2015 48th Hawaii International Conference on, Jan 2015, pp. 2637–2644.
[5] California ISO, “Five year synchrophasor plan,” California ISO, Tech. Rep., Nov 2011.
[6] L. Xie, Y. Chen, and P. R. Kumar, “Dimensionality Reduction of Synchrophasor Data for Early Event Detection: Linearized Analysis,” IEEE Tran. Power Systems, 2014.
[7] M. Wu, and Le Xie. Online Detection of Low-Quality Synchrophasor Measurements: A Data-Driven Approach. IEEE Transactions on Power Systems. Accepted, to appear.
[8] N. Dahal, R. King, and V. Madani, “Online dimension reduction of synchrophasor data,” Transmission and Distribution Conference and Exposition (T&D), 2012 IEEE PES.
[9] M. Patel, S. Aivaliotis, E. Ellen et al., “Real-time application of synchrophasors for improving reliability,” 2010.
[10] M.M. Breunig, et al. "LOF: identifying density-based local outliers." ACM sigmod record. Vol. 29. No. 2. ACM, 2000.
[11] A. Abur, and A.G. Exposito. Power system state estimation: theory and implementation. CRC press, 2004.
[12] M. Wu and L. Xie, “Online Detection of False Data Injection Attacks to Synchrophasor Measurements: A Data-Driven Approach,” System Sciences (HICSS), 2017 50th Hawaii International Conference on, Jan 2017.
[13] Y. Zhang and L. Xie. "Online dynamic security assessment of microgrid interconnections in smart distribution systems." IEEE Transactions on Power Systems 30.6 (2015): 3246-3254.
[14] Y. Zhang and L. Xie, "A Transient Stability Assessment Framework in Power Electronic-Interfaced Distribution Systems," in IEEE Transactions on Power Systems, vol. 31, no. 6, pp. 5106-5114, Nov. 2016.
41