Embed Size (px)
Citation preview
1
REAL TIME PCR
SYBR GREEN

2
THE PROBLEM
• NEED TO QUANTITATE DIFFERENCES IN mRNA EXPRESSION
• SMALL AMOUNTS OF mRNA– LASER CAPTURE– SMALL AMOUNTS OF TISSUE– PRIMARY CELLS– PRECIOUS REAGENTS

3
THE PROBLEM
• QUANTITATION OF mRNA– northern blotting– ribonuclease protection assay– in situ hybridization– PCR
• most sensitive• can discriminate closely related mRNAs• technically simple• but difficult to get truly quantitative results using
conventional PCR

4
NORTHERN
target gene
internal control geneactin, GAPDH, RPLP0 etc
control expt
Corrected fold increase = 10/2 = 5
Ratio target gene in experimental/control = fold change in target genefold change in reference gene

5
CYCLE NUMBER AMOUNT OF DNA0 11 22 43 84 165 326 647 1288 2569 512
10 1,02411 2,04812 4,09613 8,19214 16,38415 32,76816 65,53617 131,07218 262,14419 524,28820 1,048,57621 2,097,15222 4,194,30423 8,388,60824 16,777,21625 33,554,43226 67,108,86427 134,217,72828 268,435,45629 536,870,91230 1,073,741,82431 1,400,000,00032 1,500,000,00033 1,550,000,00034 1,580,000,000

6
0200000000400000000600000000800000000
1000000000120000000014000000001600000000
0 5 10 15 20 25 30 35
PCR CYCLE NUMBERA
MO
UN
T O
F D
NA
110
1001000
10000100000
100000010000000
1000000001000000000
10000000000
0 5 10 15 20 25 30 35
PCR CYCLE NUMBER
AM
OU
NT
OF
DN
A
CYCLE NUMBER AMOUNT OF DNA0 11 22 43 84 165 326 647 1288 2569 512
10 1,02411 2,04812 4,09613 8,19214 16,38415 32,76816 65,53617 131,07218 262,14419 524,28820 1,048,57621 2,097,15222 4,194,30423 8,388,60824 16,777,21625 33,554,43226 67,108,86427 134,217,72828 268,435,45629 536,870,91230 1,073,741,82431 1,400,000,00032 1,500,000,00033 1,550,000,00034 1,580,000,000

7
0 5 10 15 20 25 30 35
PCR CYCLE NUMBER
AM
OU
NT
OF
DN
A

8
0 5 10 15 20 25 30 35
PCR CYCLE NUMBERA
MO
UN
T O
F D
NA

9
Linear ~20 to ~1500

10
Linear ~20 to ~1500
11
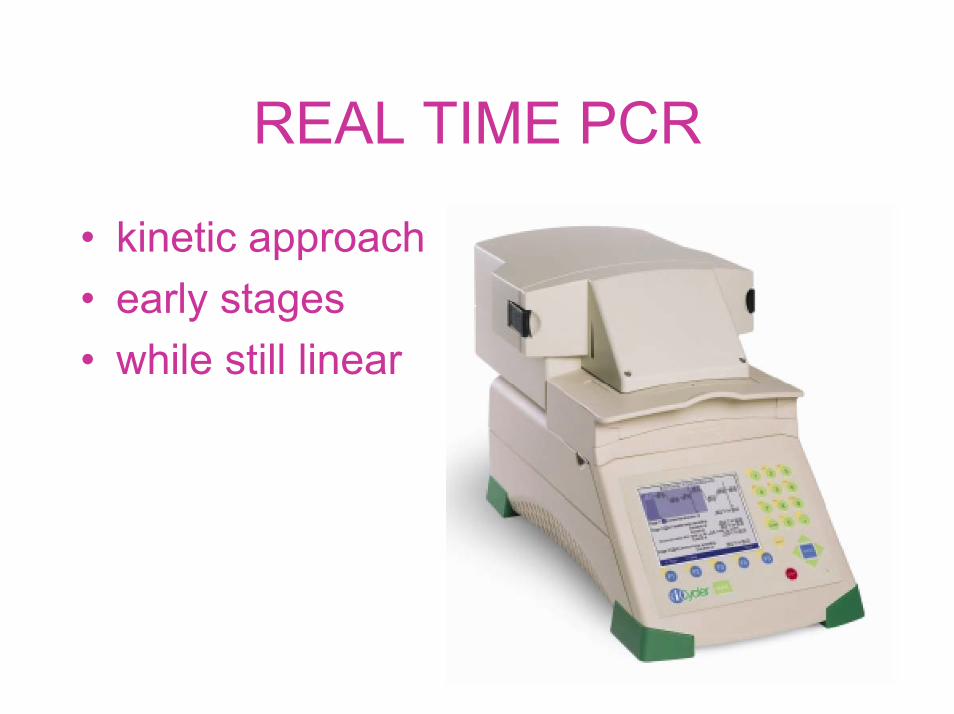
REAL TIME PCR
• kinetic approach• early stages• while still linear
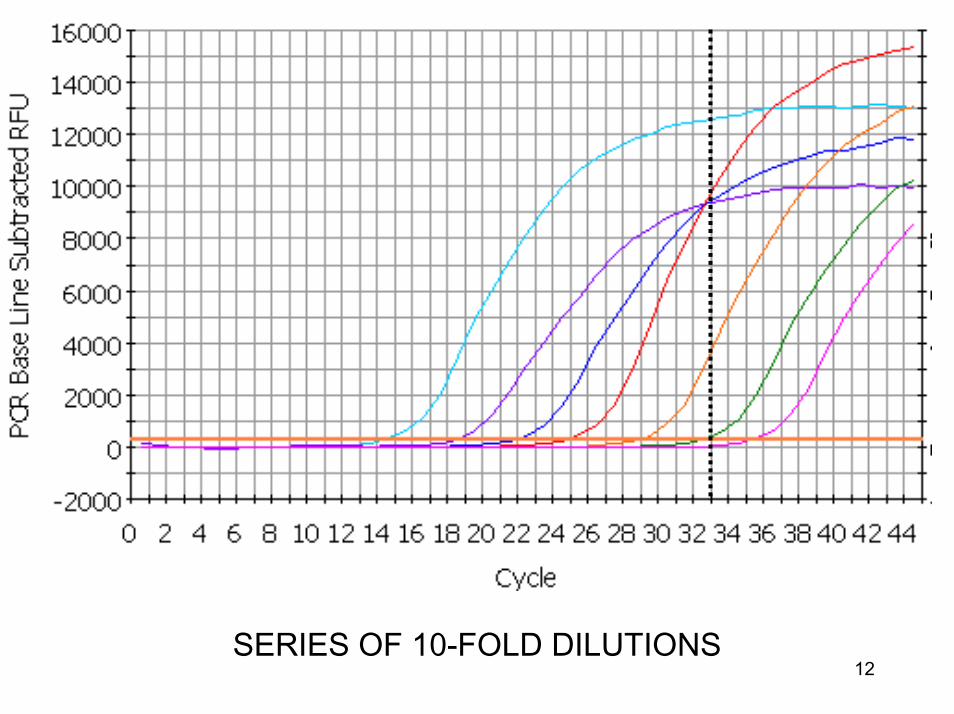
12SERIES OF 10-FOLD DILUTIONS

13

14

15
threshold
Ct
SERIES OF 10-FOLD DILUTIONS

16
threshold = 300

17
threshold

18
STANDARD CURVE METHOD

19
dilutions target DNA
dilutions reference DNA
triplicates cDNA
triplicates cDNA
targetprimers
referenceprimers
Standard curve method

20
NORTHERN
target gene
internal control geneactin, GAPDH, RPLP0 etc
Ratio experimental/control = fold change in target genefold change in reference gene
control expt
Dilution curve target gene
‘copy number’ target gene experimental
‘copy number’ target gene control
fold change in target gene= copy number experimentalcopy number control

21
Dilution curve reference gene
‘copy number’ reference gene experimental
‘copy number’ reference gene control
NORTHERN
target gene
internal control geneactin, GAPDH, RPLP0 etc
Ratio experimental/control = fold change in target genefold change in reference gene
control expt

22
PFAFFL METHOD
– M.W. Pfaffl, Nucleic Acids Research 2001 29:2002-2007

23
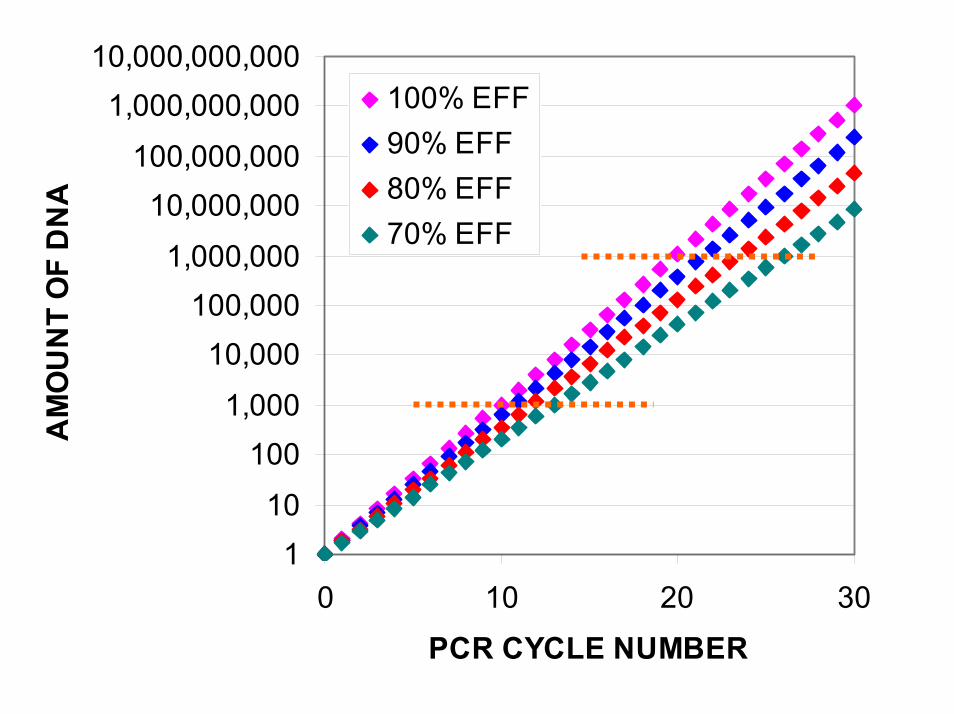
EFFECTS OF EFFICIENCY

24
CYCLE AMOUNT OF DNA AMOUNT OF DNA AMOUNT OF DNA AMOUNT OF DNA100% EFFICIENCY 90% EFFICIENCY 80% EFFICIENCY 70% EFFICIENCY
0 1 1 1 11 2 2 2 22 4 4 3 33 8 7 6 54 16 13 10 85 32 25 19 146 64 47 34 247 128 89 61 418 256 170 110 709 512 323 198 11910 1,024 613 357 20211 2,048 1,165 643 34312 4,096 2,213 1,157 58313 8,192 4,205 2,082 99014 16,384 7,990 3,748 1,68415 32,768 15,181 6,747 2,86216 65,536 28,844 12,144 4,86617 131,072 54,804 21,859 8,27218 262,144 104,127 39,346 14,06319 524,288 197,842 70,824 23,90720 1,048,576 375,900 127,482 40,64221 2,097,152 714,209 229,468 69,09222 4,194,304 1,356,998 413,043 117,45623 8,388,608 2,578,296 743,477 199,67624 16,777,216 4,898,763 1,338,259 339,44925 33,554,432 9,307,650 2,408,866 577,06326 67,108,864 17,684,534 4,335,959 981,00727 134,217,728 33,600,615 7,804,726 1,667,71128 268,435,456 63,841,168 14,048,506 2,835,10929 536,870,912 121,298,220 25,287,311 4,819,68630 1,073,741,824 230,466,618 45,517,160 8,193,466
AFTER 1 CYCLE100% = 2.00x90% = 1.90x80% = 1.80x70% = 1.70x

25
CYCLE AMOUNT OF DNA AMOUNT OF DNA AMOUNT OF DNA AMOUNT OF DNA100% EFFICIENCY 90% EFFICIENCY 80% EFFICIENCY 70% EFFICIENCY
0 1 1 1 11 2 2 2 22 4 4 3 33 8 7 6 54 16 13 10 85 32 25 19 146 64 47 34 247 128 89 61 418 256 170 110 709 512 323 198 11910 1,024 613 357 20211 2,048 1,165 643 34312 4,096 2,213 1,157 58313 8,192 4,205 2,082 99014 16,384 7,990 3,748 1,68415 32,768 15,181 6,747 2,86216 65,536 28,844 12,144 4,86617 131,072 54,804 21,859 8,27218 262,144 104,127 39,346 14,06319 524,288 197,842 70,824 23,90720 1,048,576 375,900 127,482 40,64221 2,097,152 714,209 229,468 69,09222 4,194,304 1,356,998 413,043 117,45623 8,388,608 2,578,296 743,477 199,67624 16,777,216 4,898,763 1,338,259 339,44925 33,554,432 9,307,650 2,408,866 577,06326 67,108,864 17,684,534 4,335,959 981,00727 134,217,728 33,600,615 7,804,726 1,667,71128 268,435,456 63,841,168 14,048,506 2,835,10929 536,870,912 121,298,220 25,287,311 4,819,68630 1,073,741,824 230,466,618 45,517,160 8,193,466
AFTER 1 CYCLE100% = 2.00x90% = 1.90x80% = 1.80x70% = 1.70x
AFTER N CYCLES:fold increase = (efficiency)n

26
0
200,000,000
400,000,000
600,000,000
800,000,000
1,000,000,000
1,200,000,000
0 10 20 30
PCR CYCLE NUMBER
AM
OU
NT
OF
DN
A
100% EFF90% EFF80% EFF70% EFF
110
1001,000
10,000100,000
1,000,00010,000,000
100,000,0001,000,000,000
10,000,000,000
0 10 20 30
PCR CYCLE NUMBER
AM
OU
NT
OF
DN
A
100% EFF90% EFF80% EFF70% EFF
CYCLE AMOUNT OF DNA AMOUNT OF DNA AMOUNT OF DNA AMOUNT OF DNA100% EFFICIENCY 90% EFFICIENCY 80% EFFICIENCY 70% EFFICIENCY
0 1 1 1 11 2 2 2 22 4 4 3 33 8 7 6 54 16 13 10 85 32 25 19 146 64 47 34 247 128 89 61 418 256 170 110 709 512 323 198 11910 1,024 613 357 20211 2,048 1,165 643 34312 4,096 2,213 1,157 58313 8,192 4,205 2,082 99014 16,384 7,990 3,748 1,68415 32,768 15,181 6,747 2,86216 65,536 28,844 12,144 4,86617 131,072 54,804 21,859 8,27218 262,144 104,127 39,346 14,06319 524,288 197,842 70,824 23,90720 1,048,576 375,900 127,482 40,64221 2,097,152 714,209 229,468 69,09222 4,194,304 1,356,998 413,043 117,45623 8,388,608 2,578,296 743,477 199,67624 16,777,216 4,898,763 1,338,259 339,44925 33,554,432 9,307,650 2,408,866 577,06326 67,108,864 17,684,534 4,335,959 981,00727 134,217,728 33,600,615 7,804,726 1,667,71128 268,435,456 63,841,168 14,048,506 2,835,10929 536,870,912 121,298,220 25,287,311 4,819,68630 1,073,741,824 230,466,618 45,517,160 8,193,466
27
110
1001,000
10,000100,000
1,000,00010,000,000
100,000,0001,000,000,000
10,000,000,000
0 10 20 30PCR CYCLE NUMBER
AM
OU
NT
OF
DN
A100% EFF90% EFF80% EFF70% EFF
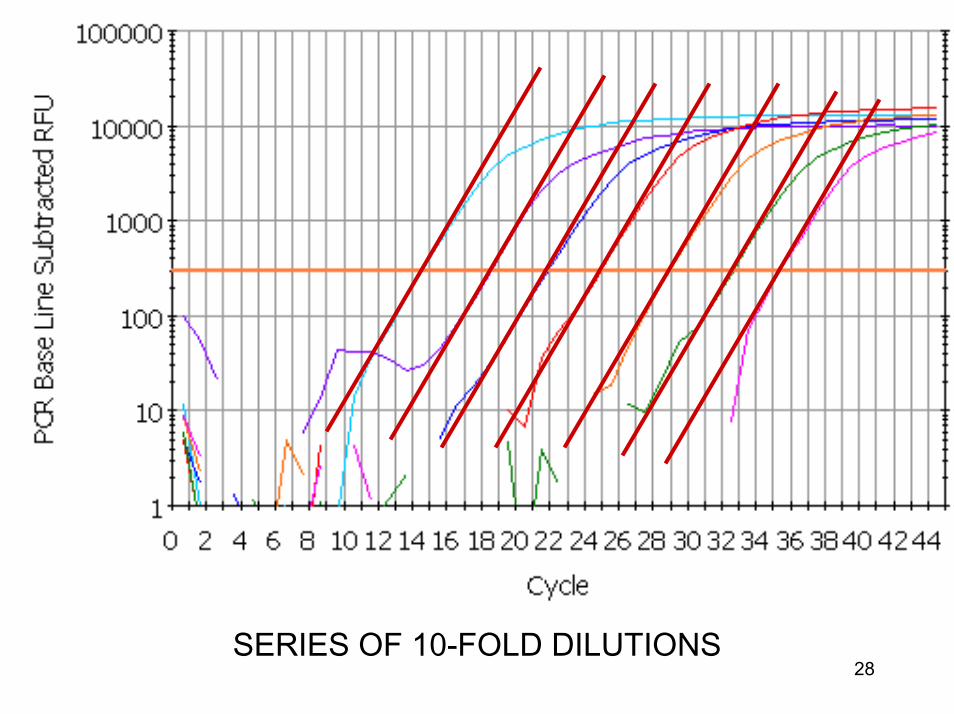
28SERIES OF 10-FOLD DILUTIONS

29
threshold

30
QUALITY CONTROL -EFFICIENCY CURVES
• use pcr baseline subtraction (not curve fitting default option)
• set the threshold manually to lab standard• check all melting curves are ok• check slopes parallel in log view• delete samples if multiple dilutions cross line
together (usually at dilute end of curve)• delete samples if can detect amplification at
cycle 10 or earlier• make sure there are 5 or more points• check correlation coefficient more than 1.990

31

32
QUALITY CONTROL -EFFICIENCY CURVES
• use pcr baseline subtraction (not curve fitting default option)
• set the threshold manually to lab standard• check all melting curves are ok• check slopes parallel in log view• delete samples if multiple dilutions cross line
together (usually at dilute end of curve)• delete samples if can detect amplification at
cycle 10 or earlier• make sure there are 5 or more points• check correlation coefficient more than 0.990

33
PFAFFL METHOD
M.W. Pfaffl, Nucleic Acids Research 2001 29:2002-2007
NORTHERN
target gene
internal control geneactin, GAPDH, RPLP0 etc
ratio = fold increase in target genefold increase in reference gene

34
targetprimers
triplicates cDNA
referenceprimerstriplicates cDNA

35
IL1-b con
IL1-b vit
RPLP0 vit
RPLP0 con

36
IL1-b con
IL1-b vit
AFTER N CYCLES: increase = (efficiency)n
av =18.03 av =29.63
IL1-beta
AFTER N CYCLES: increase = (1.93)29.63-18.03 =1.9311.60 = 2053 fold increase

37
RPLP0 vit
RPLP0 con
AFTER N CYCLES: increase = (efficiency)n
RPLP0
av =19.80
av =19.93
AFTER N CYCLES: increase = (1.87)19.93-19.80 =1.870.13 = 1.08 fold increase

38
IL1-b con
IL1-b vit
AFTER N CYCLES: increase = (efficiency)n
increase = (1.93)29.63-18.03 =1.9311.60 = 2053 fold increase
av =18.03 av =29.63
IL1-beta
RPLP0 vit
RPLP0 con
AFTER N CYCLES: increase = (efficiency)n
increase = (1.87)19.93-19.80 =1.870.13 = 1.08 fold increase
RPLP0
ratio = change in IL1-B = 2053/1.08 = 1901change in RPLP0
ratio = (Etarget )∆Ct target (control-treated)
(Eref )∆Ct ref (control-treated)

39
∆∆Ct EFFICIENCY METHOD
APPROXIMATION METHOD

40
IL1-b con
IL1-b vit
RPLP0 vit
RPLP0 con

41
IL1-b con
IL1-b vit
RPLP0 vit
RPLP0 con

42
IL1-b con
RPLP0 con
av =19.93 av =29.63
control ∆ Ct = target - ref
∆ Ct = 9.70
IL1-b vit
RPLP0 vit
av =19.80
av =18.03
Difference = ∆Ct-∆Ct= ∆∆Ct= 9.70-(-1.7)= 11.40
experiment ∆ Ct = target - ref
∆ Ct = -1.7

43
∆∆Ct = 11.40 for IL1-beta
• If efficiency is 100% then– Fold change = 211.40 = 2702
• Efficiency for IL1-beta is 93%– Fold change = 1.9311.40 = 1800
• Pfaffl equation corrected for RPLP0 efficiency – Fold change = 1901

44
RED: 83% efficiencyPURPLE: 93% efficiency
SERIAL 10-FOLD DILUTIONS

45
RED: 94% efficiencyPURPLE: 94% efficiency
SERIAL 10-FOLD DILUTIONS

46
∆∆Ct EFFICIENCY METHOD
• assumes – minimal correction for the standard gene, or– that standard and target have similar efficiencies
• 2 ∆∆Ct variant assumes efficiencies are both 100%
• approximation method, but need to validate that assumptions are reasonably correct - do dilution curves to check ∆Cts don’t change
• The only extra information needed for the Pfaffl method is the reference gene efficiency, little more work than validating the approximation method

47
SPECIAL THANKS TO • Dr. Joyce Nair-Menon and Lei Li for the use
of their real-time PCR results
• Anyone who has ever discussed their real-time PCR results with me
• NEI - EY12711 for the money