Embed Size (px)
Citation preview

REAL TIME MONITORING OF DISTRIBUTION NETWORKS
USING INTERNET BASED PMU
by
Akanksha Eknath Pachpinde
A Thesis submitted to the Faculty of the Graduate School of the University at Buffalo, State
University of New York in partial fulfillment of the requirements for the degree of
(Master of Science)
Department of Electrical Engineering

ii
Acknowledgements
It is with immense gratitude that I acknowledge the support and help of my advisor, Dr.
HyungSeon Oh, who continually and convincingly conveyed a spirit of adventure in regard to this
research and his teaching. I would like to thank my committee members, Dr. Albert Titus and Dr.
Jonathan Bird for their guidance and persistent help without which this dissertation would not have been
possible.
I am grateful to the faculty of University at Buffalo, SUNY and my fellow Buffalo Energy
Science and Technology group members for the immense learning opportunities. I will remain deeply
indebted to my parents Dr. Swati Pachpinde and Dr. Eknath Pachpinde, my siblings and dear friends for
their continued love and support.
iii
Abstract
Measurement of synchrophasors can open up new avenues for improved control and
stability of the power system. Phasor Measurement Unit (PMU) can measure positive sequence
voltages and currents along with frequency and rate of change of frequency. They can directly
measure the state of the system thus eliminating the need for state estimation altogether, if the
system is completely observable. For this to become reality a large number of PMUs need to be
deployed that would call for large upfront investments. Another possibility to ensure large scale
deployment of PMUs, is to find ways to make the technology more affordable.
Conventional PMUs which use global positioning system (GPS) for time synchronization
have some limitations. This thesis proposes a novel concept of PMU using network time protocol
(NTP) to synchronize the local oscillators of all the PMU. NTP is an attractive alternative as it
uses existing LAN lines for internet communication and the existing infrastructure and has time
accuracy in milli-seconds (lower than that of GPS). It does not require, however, any major
infrastructural changes. It is thus suitable for monitoring systems that do not require very precise
time stamping. We claim that a distribution network is an ideal candidate for such PMUs.
Currently distribution networks have sparse monitoring by supervisory control and data
acquisition (SCADA) system which has time synchronization window of 2-3 seconds.
This conceptual PMU is elaborated in the following text and its feasibility is evaluated.
Comparative measurement accuracy and cost of this PMU is discussed in detail in comparison
with the conventional PMUs. The new PMU offers significant benefits in terms of monitoring
and controlling the distribution network. One application considered in this study is fault-
location detection.
iv
List of Figures
Figure 1: Convention for synchrophasor representation. Taken and modified from Ref [17]. ........... 9
Figure 2: A sinusoid with a frequency is observed. The phase angle Φ increases uniformly in
relation to the frequency difference, (f – f0) ...................................................................................... 10
Figure 3: Generic block diagram of PMU ......................................................................................... 11
Figure 4: Typical synchrophasor installation at substation ............................................................... 12
Figure 5: Internet based PMU block diagram ................................................................................... 17
Figure 6. Diagrammatic depiction of NTP strata .............................................................................. 18
Figure 7: Example of Synchronization Topologies of NTP clocks ................................................... 19
Figure 8: Measuring Delay and Offset .............................................................................................. 19
Figure 9: Network Time Protocol ...................................................................................................... 20
Figure 10: Generic block diagram of Gadget Box ............................................................................ 22
Figure 11: Block diagram of the prototype design for the proposed PMU ....................................... 23
Figure 12: A distribution network substations with amount of monitoring present .......................... 27
Figure. 13. Format for files transmitted from and to PMUs. The numbers below the boxes indicate
length of the word in bytes. ............................................................................................................... 28
Figure 14. Offsets between the local clock and the PPS GPS ........................................................... 30
Figure 15: A single-line-to-ground fault on phase A ........................................................................ 39
Figure 16: Search for possible fault locations ................................................................................... 40
Figure 17: One-line diagram for a 14-Bus distribution feeder with two measurement points at
Bus-1 and Bus-5, respectively .......................................................................................................... 40

v
List of Tables
Table 1: Cost breakdown of the prototype of internet based PMU………………………23

vi
Table of Contents
Acknowledgements _________________________________________________________________ ii
Abstract __________________________________________________________________________ iii
List of Figures _____________________________________________________________________ iv
Chapter 1. Introduction _____________________________________________________________ 1
Chapter 2. Background and Literature Survey __________________________________________ 3
2.1 Development in PMU technology over the years__________________________________ 3
2.2 Applications of PMU in Power systems _________________________________________ 4
2.2.1 State estimation____________________________________________________________ 4
2.2.2 Power system protection _____________________________________________________ 5
2.2.3 Power system control _______________________________________________________ 7
Chapter 3. Theory of conventional PMU _______________________________________________ 8
3.1 Synchrophasors ____________________________________________________________ 8
3.2 Generic model of PMU _____________________________________________________ 10
3.3 Overview of synchrophasor standard _________________________________________ 13
Chapter 4. New conceptual internet based PMU ________________________________________ 15
4.1 Concept of the internet based PMU ___________________________________________ 16
4.2 Interfacing NTP with PMU __________________________________________________ 17
4.2.1 Obtaining time-stamps ___________________________________________________ 19
4.2.2 Obtaining PPS from NTP _________________________________________________ 20
4.3. Design of Prototype ________________________________________________________ 22
Chapter 5. Evaluation of the proposed PMU versus conventional PMU ____________________ 26
5.1 Introduction ______________________________________________________________ 26
vii
5.2 Comparing conventional and proposed PMU performance _______________________ 27
5.2.1. Time synchronization accuracy ____________________________________________ 27
5.2.2. Measurement accuracy ___________________________________________________ 32
Chapter 6. Applications and future prospects __________________________________________ 36
6.1 Applications of proposed PMU _______________________________________________ 36
6.2 Future prospects of the proposed PMU ________________________________________ 41
References _______________________________________________________________________ 43

1
Chapter 1. Introduction
Power demand is increasing enormously and the power system is not equipped to
accommodate this change. The availability of reliable electric power supplies is an essential
precondition for the functioning of modern economies [1]. The U.S. Department of Energy plans
to address this challenge of growing energy demand by promoting distributed energy resources
and renewable energy integration. Its Renewable and Distributed Systems Integration (RDSI)
program recently selected nine projects to demonstrate 15% peak-load reduction on a distribution
feeder by integration of distributed generation [2].
The amount of variable renewable generation is also expected to grow considerably as
policy and regulations on greenhouse gas emissions are developed and implemented by federal
authorities, individual states and provinces throughout North America [3]. Maintaining bulk
power system reliability in such a scenario will be challenging in the near future. Protection-
system misoperations, particularly incorrect settings and circuit breaker failure have been listed
amongst the most impactful causes for initiating system disturbances creating major stability
issues [3].
Real-time monitoring at all levels of the power grid will play a significant role in
addressing the situation. Phasor measurement unit (PMU) can provide voltages and currents
along with frequency and rate of change of frequency in real-time with high precision and
accuracy. It has the potential to improve system controls, event analysis, fault detection and
determining the location of fault through situation awareness tools and monitoring capability. It
can also provide tools for supervising the protection equipment to prevent false trips and its
2
consequences. With this information, control and protection of the power system can be
significantly improved.
The Department of Energy anticipates that once all of the Recovery Act (2009)
synchrophasor projects have been completed, there will be at least 1,043 networked PMUs in
place (compared to 166 in 2010) [4]. This number is insignificant compared to the extensive
transmission network in the US. To utilize all the benefits of this technology, it is necessary to
deploy PMUs at a large scale that would make the network completely observable. PMUs are
required at approximately one-third of the Buses to obtain complete observability [5]. However,
their integration costs are too high to deploy them on a large scale. This high cost is closely
related to time-synchronization itself and to install infrastructure for communication.
The thesis proposes a novel idea for an alternative design of PMU by using existing
technologies such as the time distribution network of the internet and phase locked loops (PLLs).
It eliminates the need to have a dedicated communication network for time distribution but banks
on the existing network provided by the internet. The proposed PMU would be suitable for real-
time monitoring of distribution networks for its low costs and the non-necessity of a new
infrastructure for communication.
An overview of conventional PMU and the guidelines provided by the synchrophasor
standard are discussed in Chapter 2 and 3 followed by the concept of the proposed internet based
PMU in Chapter 4. The evaluation of this proposed PMU in comparison with conventional PMU
and overview of its applications in distribution network are considered in Chapters 5 and 6.
3
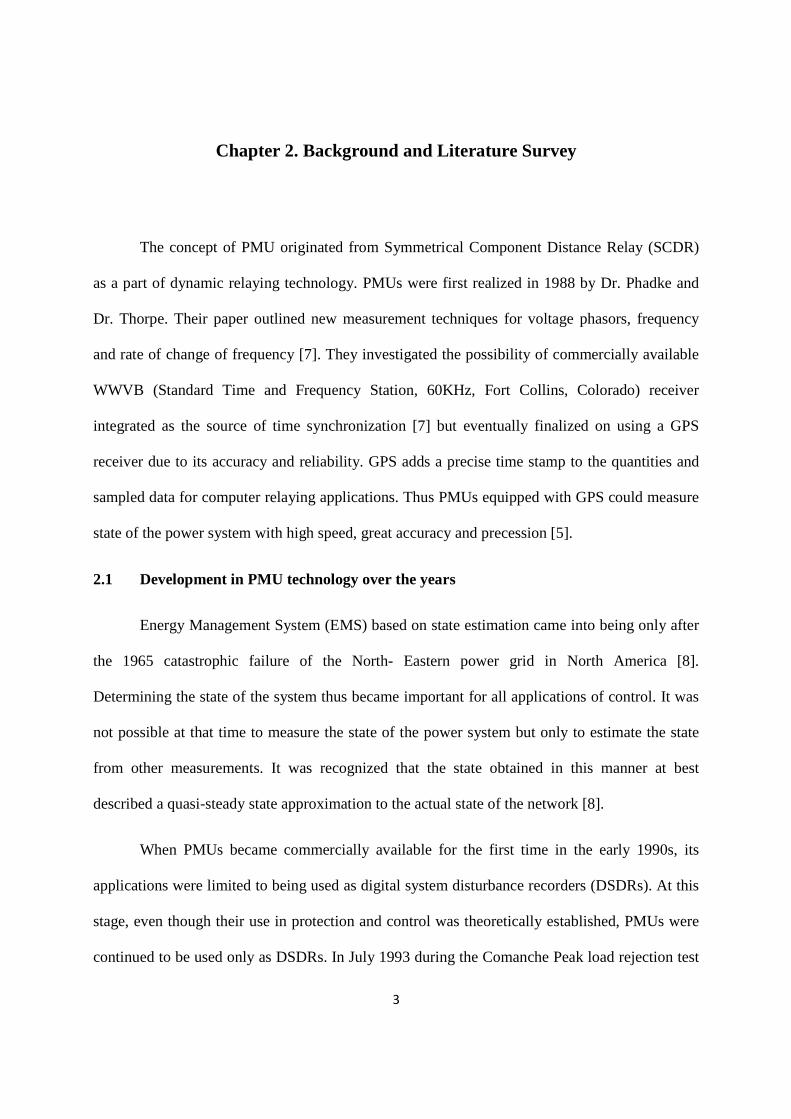
Chapter 2. Background and Literature Survey
The concept of PMU originated from Symmetrical Component Distance Relay (SCDR)
as a part of dynamic relaying technology. PMUs were first realized in 1988 by Dr. Phadke and
Dr. Thorpe. Their paper outlined new measurement techniques for voltage phasors, frequency
and rate of change of frequency [7]. They investigated the possibility of commercially available
WWVB (Standard Time and Frequency Station, 60KHz, Fort Collins, Colorado) receiver
integrated as the source of time synchronization [7] but eventually finalized on using a GPS
receiver due to its accuracy and reliability. GPS adds a precise time stamp to the quantities and
sampled data for computer relaying applications. Thus PMUs equipped with GPS could measure
state of the power system with high speed, great accuracy and precession [5].
2.1 Development in PMU technology over the years
Energy Management System (EMS) based on state estimation came into being only after
the 1965 catastrophic failure of the North- Eastern power grid in North America [8].
Determining the state of the system thus became important for all applications of control. It was
not possible at that time to measure the state of the power system but only to estimate the state
from other measurements. It was recognized that the state obtained in this manner at best
described a quasi-steady state approximation to the actual state of the network [8].
When PMUs became commercially available for the first time in the early 1990s, its
applications were limited to being used as digital system disturbance recorders (DSDRs). At this
stage, even though their use in protection and control was theoretically established, PMUs were
continued to be used only as DSDRs. In July 1993 during the Comanche Peak load rejection test
4
in Texas, frequency measurements revealed the presence of an electromechanical wave
propagating through the system. Such data recordings led to the development of the Frequency
Monitoring Network (FNET) that shed light on many revelations about these electromechanical
waves [9].
After the blackouts of 1996 and 2003, PMU technology was highly encouraged for use
in all utilities. This led to the creation of the Eastern Interconnection Phasor Project (EIPP), now
known as North American Synchrophasor Project (NASPI). The EIPP performed the first real-
time wide-area monitoring in the United States. PMUs are expensive and their costs depend on
the utility, location, and availability of communication channels.
The need for real-time monitoring of power system has led to increased deployment of
PMUs increased in the United States. In China, about 400 PMUs were installed at the substations
and power plants of 500KV and 330KV voltage levels by 2007 [10]. According to the 11th five-
year plan for the Chinese power grid of China, all substations operating above 300kV will have
PMU monitoring. India and other European countries are also keenly pursuing PMU technology.
2.2 Applications of PMU in Power systems
PMUs have been in use for a long time as DSDR in wide area monitoring. This section
provides a general overview of other applications of PMU technology mainly in state estimation,
protection and control.
2.2.1 State Estimation

5
State estimation of the system is performed today from the measurements of power
injection, voltage values from transformers, etc. This estimation algorithm is based on the
assumption that the state of the power system remains static when scanning takes place. The
system can look completely different by the time the state is estimated. This estimated state is
used as the input data for many other calculations and applications like economic dispatch,
automatic generation control, automatic voltage control etc.
PMU has the capability to directly measure the state of the system i.e. voltage at all the
Buses equipped with PMUs. If the entire system becomes observable by PMU measurements,
the need for state estimation would be eliminated altogether. However, the high costs of PMU
and large network of Buses makes it practically impossible to introduce PMU technology into
the power systems, at least in the near future. Therefore, the need arises for algorithms to
combine the measurements of PMU and existing monitoring systems such as SCADA systems
for combined state estimation [12, 13].
2.2.2 Power system protection
Every line has distance protection of different levels. Zone 1 relays are present at each
end of the line and protect 80% of the line. Zone 2 protects 100% of the line and about 20% of
the adjoining line. Zone 3 covers 100% of the line and more than 50% of the adjoining line. This
means these relays protect the connected line also to some extent and thus act as backup
protection for the lines. Backup relays used for providing Zone 2 and Zone 3 protection are
prone to false tripping. This can be catastrophic for a system operating on the edge of its stability
limits. PMUs at Buses where relays are connected can act as supervisory systems. If the relays
see a fault but none of the PMUs indicate it, then it can be ruled out as a false trigger.

6
Transients occurring in the system may cause the generator to loose synchronization, but
it is important to determine if this is temporary or permanent. Out-of-step relays are designed to
perform this detection and also to take appropriate tripping and blocking decisions. These relays
are set according to transient analysis. With new lines being added to the system, theses relays
tend to malfunction in highly interconnected systems. Adaptive Out-of-step Protection tries to
keep readjusting the relay settings dynamically. A reliable prediction algorithm should be
developed to provide the stable–unstable classification of an evolving swing in a reasonable time
[9, 14]. This is a developing field and much work needs to be done in this respect.
There are two ways in which the relay can fail to protect the system. It trips when it
should not (a false trip) or it does not trip when it should trip. Two types of reliability have been
designated as “security” and “dependability” respectively [9]. The system more secure if some or
the other relay always clears fault but leads to increased number of false trips. The system is
more dependable if relays operate conservatively and only clear faults that are seen with
certainty. The protection system of today is more secure than dependable. We can maintain the
balance between security and dependability with PMU data which allows the process to be
adaptive.
Loss of mains is a term describing a situation when one or more generator unit gets
separated from the system and is also called as islanding. Loss of mains can be detected more
accurately by using the phase angle difference method. Anti-islanding techniques based on the
rate of change of phase angle (ROCOPA) are being explored. PMUs can be implemented at
distributed generation (DG) terminals (or at a strategic location within a potentially islanded
section of network) to provide high-precision measurements of frequency and voltage angle to
facilitate detection [15].

7
2.2.3 Power system control
With real time data, power system control finds significant benefit. Control can now be
based on remote quantities. Wide-area measurements allow the system to control insecure
situations without employing continuous feedback [14]. In the case of such situations, control
actions like reconfiguring the network to ensure the demand is met or curtailed can be taken
remotely. Reference [16] describes the incorporation of synchrophasor measurements into new
system integrity protection schemes (SIPS). PMU measurements enhance robustness of the
system by retaining local control signals while additionally providing supervisory signals. Such a
redundancy in the system control would be indispensable for fine control of the system even
remotely and a big step towards a smarter grid.

8
Chapter 3. Theory of conventional PMU
A thorough study of conventional PMU technology is essential to lay the foundation for
the proposed concept of PMU. Understanding the limitations and challenges of conventional
PMUs provide motivation and room for improvement. The chapter also discusses the
synchrophasor standard to understand the quality of output from any PMU.
3.1 Synchrophasors
A phasor is an analytical and time-invariant representation of a sinusoidal wave. It is
commonly used for AC power system analysis. If the sinusoidal Equation is represented in
Equation (3.1):
)(cos)( φω += tXtx m (3.1)
This can be represented in phasor form as:
irmjm XjXj
Xe
XX +=+== )sin(cos
22φφφ (3.2)
Here, Xm /√2 is the root mean square value of the waveform and φ is the phase angle.
Phasors represent a sinusoidal waveform taking into consideration the phase difference of
the measured waveform with respect to a predefined reference so that two waveforms are
directly compared with respect to the same reference. Synchrophasors use coordinated universal
time (UTC) as an absolute time reference. If UTC is used as a reference for all phasor
measurements globally then these measurements can directly be compared irrespective of the
locations of sampling.

9
The synchrophasor representation of the signal x(t) in Equation (3.1) is the value X in
Equation (3.2) where φ is the instantaneous phase angle relative to a cosine function at the
nominal system frequency synchronized to UTC [17]. One pulse per second signal (PPS)
generated by some very precise clocks which trace UTC is used as reference for sampling the
waveform.
Figure 1: Convention for synchrophasor representation. Taken and modified from Ref [17].
Figure 1 illustrates how PPS signal is used as a reference to measure phasors. If the PPS
signal coincides with the peak of the measured waveform, the phase difference is zero hence the
phasor representation becomes:
2mX
X = (3.3)
For the second case, where the phase difference between the reference peak and the
measured signal peak is 60 degrees, the phasor representation is given by:
3
2
Π−=
jm e
XX (3.4)
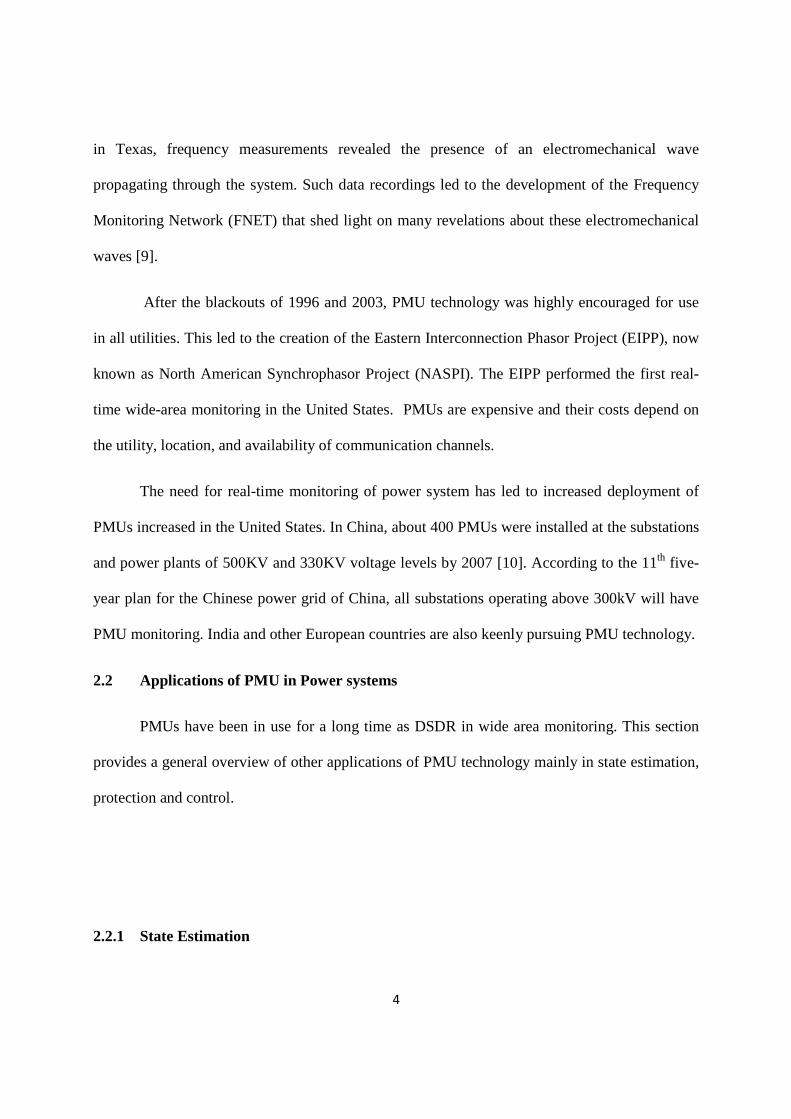
A power system hardly operates
f0 and f < 2f0, where f0 is the fundamental frequency of a sinusoidal wave,
will have a constant magnitude. H
X2, X3, … Xn, …} will change uniformly at a rate
in Figure 2 [5, 17].
Figure 2: A sinusoid with a frequency is observed. The phase angle
relation to the frequency difference, (
3.2 Generic model of PMU
This section will talk about how
generic form of a conventional PMU. Since
important to understand such a
frequency and rate of change of frequency (ROCOF),
stamped very accurately in a PMU. Th
different PMUs, irrespective of the time delay in transferring the data
complete snapshot of the system at any given time.
10
A power system hardly operates at its fundamental or nominal frequency.
is the fundamental frequency of a sinusoidal wave,
constant magnitude. However, the phase angles of the sequence of phasors {
} will change uniformly at a rate of 2π (f – f0) T0, where T
2: A sinusoid with a frequency is observed. The phase angle Φ increases uniformly in
relation to the frequency difference, (f – f0) [17]
Generic model of PMU
This section will talk about how a PMU measures synchrophasors and will describe
generic form of a conventional PMU. Since different types of PMUs are manufactured
important to understand such a generic model. PMU can measure synchrophasor along with the
frequency and rate of change of frequency (ROCOF), and the measurements are
stamped very accurately in a PMU. Thus it is possible to align measurements coming from
irrespective of the time delay in transferring the data, and
complete snapshot of the system at any given time.
frequency. If frequency f ≠
is the fundamental frequency of a sinusoidal wave, the observed phasor
the phase angles of the sequence of phasors {X0, X1,
T0 = 1/ f0 and, as shown
increases uniformly in
PMU measures synchrophasors and will describe a
are manufactured, it is
PMU can measure synchrophasor along with the
the measurements are also time
measurements coming from
, and to index the data for a

Figure 3: Generic block diagram of PMU
As shown in Figure 3
components using instrument
hardwired to the Bus or the line
All three phase measurements of current and voltages are used to derive positive, negative and
zero sequence components. The a
power of the signal without distorting the waveform.
filtering them using anti-aliasing filter.
sampling frequency in order to satisfy the Nyquist criterion
used for a higher sampling rate,
downconvert the higher sampling rate to lower, thus providing digital anti
digital filters are less sensitive to temperatur
relative magnitudes of the different signals are practically unchanged
conditions [5].
11
3: Generic block diagram of PMU [5]
Figure 3, the measured analog inputs are stepped down for
instrument transformers, typically within the range of ±10 volts
or the line from which waveform is collected for measurement
All three phase measurements of current and voltages are used to derive positive, negative and
The attenuator is a physical component that is used
signal without distorting the waveform. These signals are then c
aliasing filter. The cut-off frequency of these filters is less than half the
sampling frequency in order to satisfy the Nyquist criterion [5]. Higher cut
a higher sampling rate, in such case a digital decimation filter may be used to
convert the higher sampling rate to lower, thus providing digital anti
sensitive to temperature variations so that the phase angle differences and
relative magnitudes of the different signals are practically unchanged
stepped down for electronic
, typically within the range of ±10 volts. These are
for measurement (Figure 4).
All three phase measurements of current and voltages are used to derive positive, negative and
that is used to reduce the
These signals are then conditioned by
off frequency of these filters is less than half the
ut-off frequency may be
n such case a digital decimation filter may be used to
convert the higher sampling rate to lower, thus providing digital anti-aliasing [5]. These
the phase angle differences and
relative magnitudes of the different signals are practically unchanged at various weather

12
Figure 4: Typical synchrophasor installation at substation [18]
GPS provides a 1 PPS waveform received anywhere on earth within 1µs of each other.
Time precision of nanoseconds may be achieved using GPS. These pulses are used to
synchronize the local oscillator to sample the analog input in the Analog-to-Digital (ADC)
converter. The sampling rate is determined by the local oscillator. Oversampling the data helps
determine the phasor with better precision as the estimation accuracy increases. GPS also
provides a time stamp to the measurements evaluated using the microprocessor. These time
stamps make it possible to index and align the data coming from various PMUs. The time-stamps
are created from two of the signals derived from the GPS receiver.
The phasor is evaluated and time-stamped in the microprocessor unit. This data is then
communicated to a common Phasor Data Concentrator (PDC) that is the next hierarchical unit of
PMU architecture. At the PDC level, the data is time aligned, and system state is determined and
necessary control actions initiated.

13
The communication requirements of a network of PMUs depend on the rate of sampling
to determine the bandwidth of communication required. The data acquired from PMU may be
made compact instead of raw data being reported. At PDC level the snapshot of the system can
be observed and critical control actions initiated.
3.3 Overview of synchrophasor standard
The IEEE Std C37.118.1™-2011 standard defines synchrophasors, frequency, and
ROCOF measurements under all operating conditions [17]. It also provides format of time tag
and other synchronization requirements for implementing PMUs. According to this standard, the
performance of a PMU can be estimated by the reliability and accuracy of its time source capable
of tracing coordinated universal time (UTC). The time tag provided should clearly trace UTC
and indicate time as well as quality of measurement of time.
The standard requires value of total vector error (TVE), frequency error (FE), and
ROCOF error (RFE) to be within the required limits set by the standard. TVE is given by:
22
22
))(())((
))()('())()('()(
nXnX
nXnXnXnXnTVE
ir
iirr
+−+−
= (3.5)
Here, X’r(n) and X’i(n) are the estimated value of real and imaginary component of the
phasor and Xr(n) and Xi(n) are the theoretical values of the input signal at the instants of time (n)
[17]. The allowable limit for TVE is 1% which translates to a phase error of 0.57 degrees (0.01
radian) by itself and a time error of ±26 µs for a 60Hz system and ±31 µs for a 50Hz system [17].
The maximum allowable FE is 0.005Hz in steady state. Frequency measurement error is
given by:

14
measuredtrue ffFE −== (3.6)
ROCOF is affected by the instability of the time source and can be given by:
REF= = df
dt
true
− df
dt
measured
(3.7)
The synchrophasor, frequency and rate of change of frequency are measured at the same
instance and reported at a constant rate.
15
Chapter 4. New conceptual internet based PMU
GPS is integrated in conventional PMUs for providing precise time synchronization. This
requires all the remote units to be located in points from where at least four GPS satellites must
be seen at every moment [20, 21]. Additionally, in terms of capacity for communication, the
GPS system itself cannot provide communication capability for PMU. Therefore, additional
infrastructure is required for communication between devices [20]. An alternative method is to
use a communication network to distribute time like the Precision Time Protocol (PTP) [20- 25].
This is achieved by using a network of dedicated time servers which communicate with each
other via messages to synchronize time. PTP was introduced in IEEE 1588- 2002, but requires
that the substation be upgraded in accordance with the IEC 61850 standards. It is not always
economically and physically viable to do so because of the dedicated hardware required solely
for time distribution purposes.
Both designs yield high precision and high resolution in time measurements that are
necessary for monitoring the status of transmission networks. A PMU with a lower precision in
time measurements might be acceptable for distribution networks. Our objective is to design a
PMU having lower cost but accurate enough to monitor distribution networks. We realize that it
is important to maintain high resolution rather than high precision in the time measurements. The
main blocks or components of the proposed internet based PMUs are discussed in the following
section along with the overview of the concept. The subsequent sections will talk about the
mechanism to synchronize time using NTP in detail and the requirements of the same in terms of
16
hardware and software. The time synchronization accuracies and the mathematical analysis
justifying the use of such system in distribution networks is also discussed.
4.1 Concept of the internet based PMU
While the proposed PMU replaces GPS time with internet time, the working of the
system remains essentially identical to that of conventional PMUs. Measured analog inputs are
collected from the secondary of the instrument transformers. These signals are then conditioned
using anti-aliasing filters to satisfy the Nyquist criterion as in a conventional PMU. NTP over the
internet network will now provide one PPS. This signal will lock the local oscillator to UTC time
and improve synchronization of the master or reference clock with the local oscillator. A method
to obtain PPS signal is by the addition of a hardware component called a “gadget box” that can
be connected to the PLL. The gadget box is capable of receiving a PPS signal from GPS present
at the server level via the ethernet/internet network. The various methods to obtain the PPS
signal using NTP are described in detail in the subsequent sections. Time stamps are provided
by NTP network, and the time tagging of data takes place in the microprocessor after the data is
sampled and phasors are calculated.
A local clock signal of high frequency acts as the reference for sampling the analog
signal in ADCs with high sampling rate. Oversampling leads to more accurate phasor estimation
[5]. Here oversampling is done mainly to compensate for the low (as compared to GPS)
synchronization accuracy of NTP system.

Figure 5: Internet based PMU block diagram
The phasor data obtained from ADC is processed in the microprocessor unit and
magnitude, phase, frequency and rate of change of frequency of the signal is gained and time
stamped and may be further stored and communicated as necessary
4.2 Interfacing NTP with PMU
We require two features
conventional PMU time-stamps are obtained from the GPS using two signals, the measurement
made by the precise clocks present on these satellites and PPS signal generate
NTP has a network of servers used to distribute time.
There are two types of clocks present in NTP, the master clock or reference clock and the
slave clock or end device clock.
atomic or radio clock. This reference clock is called
17
: Internet based PMU block diagram
phasor data obtained from ADC is processed in the microprocessor unit and
magnitude, phase, frequency and rate of change of frequency of the signal is gained and time
and may be further stored and communicated as necessary.
ith PMU
features from the NTP network: Time-stamps and PPS signal. In a
stamps are obtained from the GPS using two signals, the measurement
made by the precise clocks present on these satellites and PPS signal generate
NTP has a network of servers used to distribute time.
There are two types of clocks present in NTP, the master clock or reference clock and the
slave clock or end device clock. The reference clock is typically a very precise clock
atomic or radio clock. This reference clock is called Stratum 0 and is connected to other servers
phasor data obtained from ADC is processed in the microprocessor unit and
magnitude, phase, frequency and rate of change of frequency of the signal is gained and time
stamps and PPS signal. In a
stamps are obtained from the GPS using two signals, the measurement
made by the precise clocks present on these satellites and PPS signal generated by these clocks.
There are two types of clocks present in NTP, the master clock or reference clock and the
The reference clock is typically a very precise clock, such as
tratum 0 and is connected to other servers
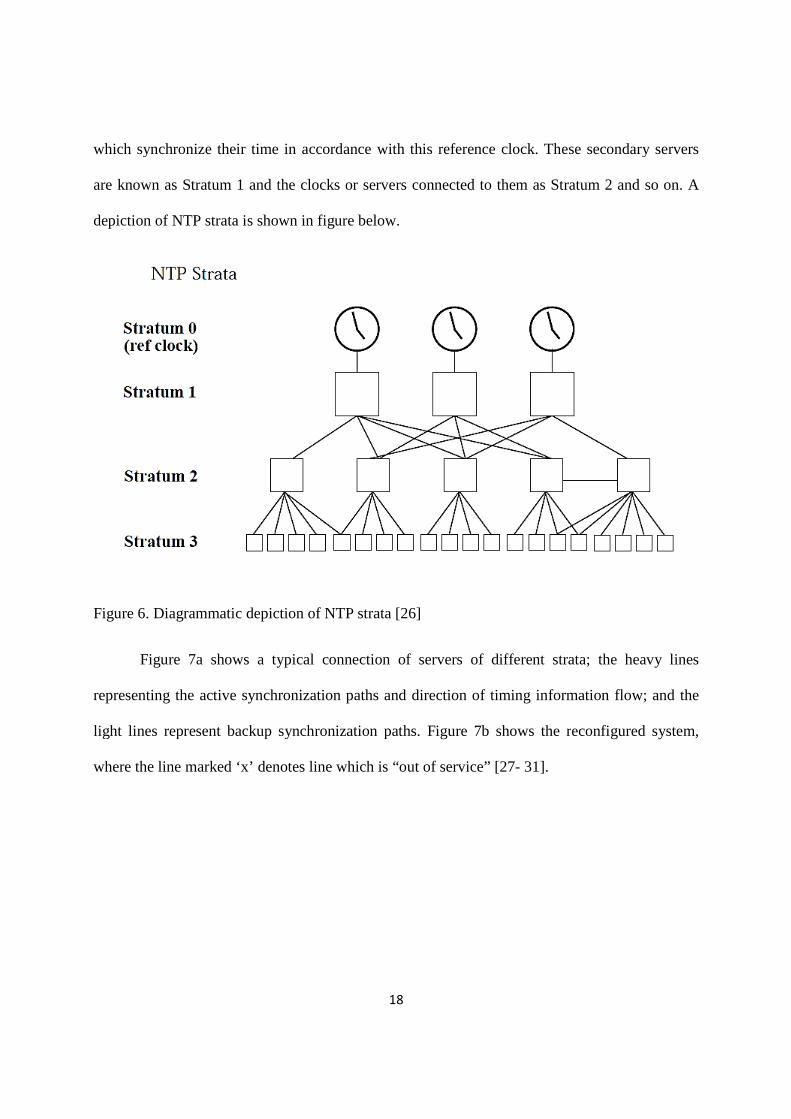
which synchronize their time in
are known as Stratum 1 and the clocks or servers connected t
depiction of NTP strata is shown in figure below.
Figure 6. Diagrammatic depiction of NTP strata
Figure 7a shows a typical connection of servers of different strata
representing the active synchronization paths and direction of timing information flow
light lines represent backup synchronization paths
where the line marked ‘x’ denotes line which is
18
which synchronize their time in accordance with this reference clock. These secondary servers
tratum 1 and the clocks or servers connected to them as S
depiction of NTP strata is shown in figure below.
. Diagrammatic depiction of NTP strata [26]
a typical connection of servers of different strata
synchronization paths and direction of timing information flow
light lines represent backup synchronization paths. Figure 7b shows the r
denotes line which is “out of service” [27- 31].
this reference clock. These secondary servers
Stratum 2 and so on. A
a typical connection of servers of different strata; the heavy lines
synchronization paths and direction of timing information flow; and the
b shows the reconfigured system,
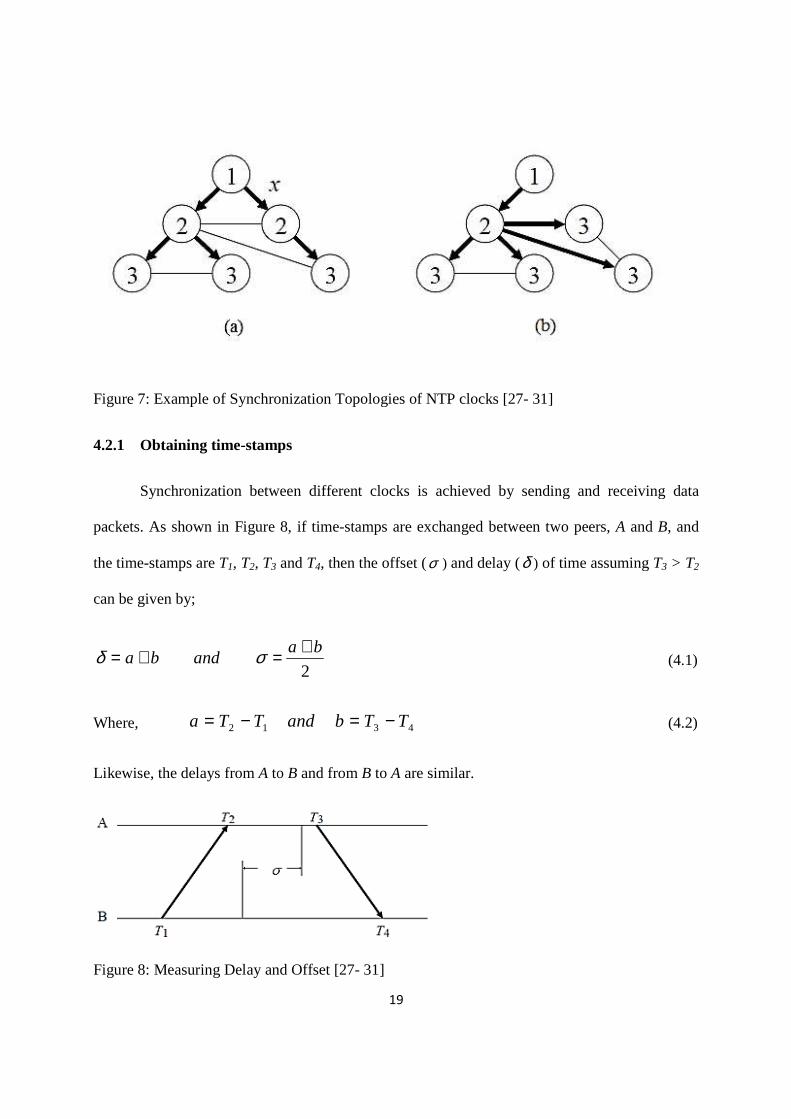
Figure 7: Example of Synchronization Topologies of NTP clocks
4.2.1 Obtaining time-stamps
Synchronization between different clocks is achieved by sending and receiving
packets. As shown in Figure 8
the time-stamps are T1, T2, T3
can be given by;
andba =+= σδ
Where, 12 TTa −=
Likewise, the delays from A to
Figure 8: Measuring Delay and Offset
19
Example of Synchronization Topologies of NTP clocks [27- 31]
stamps
Synchronization between different clocks is achieved by sending and receiving
igure 8, if time-stamps are exchanged between two peers,
and T4, then the offset (σ ) and delay (δ ) of time assuming
2
ba +=
43 TTband −=
to B and from B to A are similar.
: Measuring Delay and Offset [27- 31]
Synchronization between different clocks is achieved by sending and receiving data
stamps are exchanged between two peers, A and B, and
of time assuming T3 > T2
(4.1)
(4.2)

20
Each NTP message includes the latest three timestamps T1, T2 and T3, while the fourth
timestamp T4 is determined upon arrival of the message. Thus, both peers A and B can
independently calculate delay and offset. Numerous clocks are available to be synchronized to
the system clock but a clock-selection algorithm determines which clocks have the best accuracy.
These offsets from a system of peers are combined using weighted-average and act as input to
the PLL circuit.
Figure 9: Network Time Protocol from Ref. [27]
In the PLL the combined effects of the filtering, selection and combining operations are
to produce a phase-correction term, which is processed by the loop filter to control the voltage-
controlled oscillator (VCO) frequency. The VCO furnishes the phase (timing) reference to
produce the timestamps used in all timing calculations [27- 31]. The voltage controlled oscillator
is the system clock in the end device. Figure 9 shows a schematic overview of the system.
4.2.2 Obtaining PPS from NTP
A PPS signal is essential to maintain the synchronization between our system and
absolute time. With the loss of PPS signal the system clock may drift away from UTC and error
in time will get accumulated. A PPS signal can be obtained by using only NTP software or a
combination of hardware and software. One method is to use the ASCII timecode which requires
21
only software and can provide PPS with accuracy of 1ms. ASCII timecode can be interfaced with
PLL and a local oscillator using RS-232 or RS-422 interface. For the PPS signal to be interfaced
with PLL some bridge will be required that converts data according to the RS232 protocol, to the
form required by PLL. The accuracy of ASCII timecode might not be acceptable for our PMU.
We propose to use a combination of hardware and software that can provide better accuracies.
The proposed PMU uses ‘gadget box’ to provide the PPS synchronization signal. It can
be used to synchronize the NTP time to one PPS signal generated by any master clock, either
GPS or the radio clock present at the sever level. This PPS signal helps to align the slave time
and maintain synchronization with the reference clock. The combination of PLL, NTP and
gadget box can provide precision control of the local oscillator within 1µs [27].
The NTP host can derive the time of the day, and day of the month from peers but the
PPS signal helps it remove jitter and is thus essential for better synchronization [27- 31]. In
version 4 of NTP, NTPD allows end users to specify up to 9 NTP servers to synchronize from
and it classifies the servers according to their stratum. This provides a way to maintain
synchronization with other PMUs in the network even of the absolute time synchronization is
lost [20]. So even without the time-stamps we can make synchronized measurements and use a
counter or some other method to index the data.
A PPS signal may also be derived from the IRIG- B signal produced by numerous radio
clocks. Inter-Range Instrumentation Group (IRIG) signal was developed to synchronize
instrumentation recorders in the early days of the U.S. space program. The result can always be
relied on to within 128 µs [27- 31].

4.2.2.1 Gadget Box
The gadget box includes a level converter and pulse generator that turns the PPS signal
on-time transition into a valid character. The character generated for each PPS pulse is
intercepted by the clock facility and a
block diagram of the gadget box is shown in figure below.
Figure 10: Generic block diagram of Gadget Box
The audio output of a shortwave radio usually tuned to C
acts as the synchronization reference input for the system. This signal is then conditioned using
bandpass filters to avoid aliasing effects. A TTL (Transistor Transistor Logic) pulse of specific
width is generated (commonly the width is 26µs)
(Electronic Industries Alliance) converter circuit i.e. EIA level converter, EIA
which can then be directly used as the PPS signal
characteristics of drivers and r
local networks and communications channels
4.3. Design of Prototype
A prototype being designed
Dr. HyungSeon Oh, Dr. Albert Titus
in its initial stages and will help to give a rough idea of the system being proposed.
22
The gadget box includes a level converter and pulse generator that turns the PPS signal
time transition into a valid character. The character generated for each PPS pulse is
y the clock facility and a time-stamp inserted in the data stream [
block diagram of the gadget box is shown in figure below.
Figure 10: Generic block diagram of Gadget Box
The audio output of a shortwave radio usually tuned to CHU at 3330, 7335 or 14670KHz
acts as the synchronization reference input for the system. This signal is then conditioned using
bandpass filters to avoid aliasing effects. A TTL (Transistor Transistor Logic) pulse of specific
width is generated (commonly the width is 26µs) from this signal. Using a TTL to EIA
(Electronic Industries Alliance) converter circuit i.e. EIA level converter, EIA
which can then be directly used as the PPS signal [33]. EIA is a standard defining the electrical
characteristics of drivers and receivers of signals. It enables the configuration of inexpensive
etworks and communications channels.
designed at University at Buffalo, SUNY as a collaborative effort by
Dr. HyungSeon Oh, Dr. Albert Titus and their graduate students is presented here. The design is
its initial stages and will help to give a rough idea of the system being proposed.
The gadget box includes a level converter and pulse generator that turns the PPS signal
time transition into a valid character. The character generated for each PPS pulse is
stamp inserted in the data stream [27]. The generic
HU at 3330, 7335 or 14670KHz
acts as the synchronization reference input for the system. This signal is then conditioned using
bandpass filters to avoid aliasing effects. A TTL (Transistor Transistor Logic) pulse of specific
Using a TTL to EIA
(Electronic Industries Alliance) converter circuit i.e. EIA level converter, EIA output is obtained
. EIA is a standard defining the electrical
enables the configuration of inexpensive
at University at Buffalo, SUNY as a collaborative effort by
and their graduate students is presented here. The design is
its initial stages and will help to give a rough idea of the system being proposed.
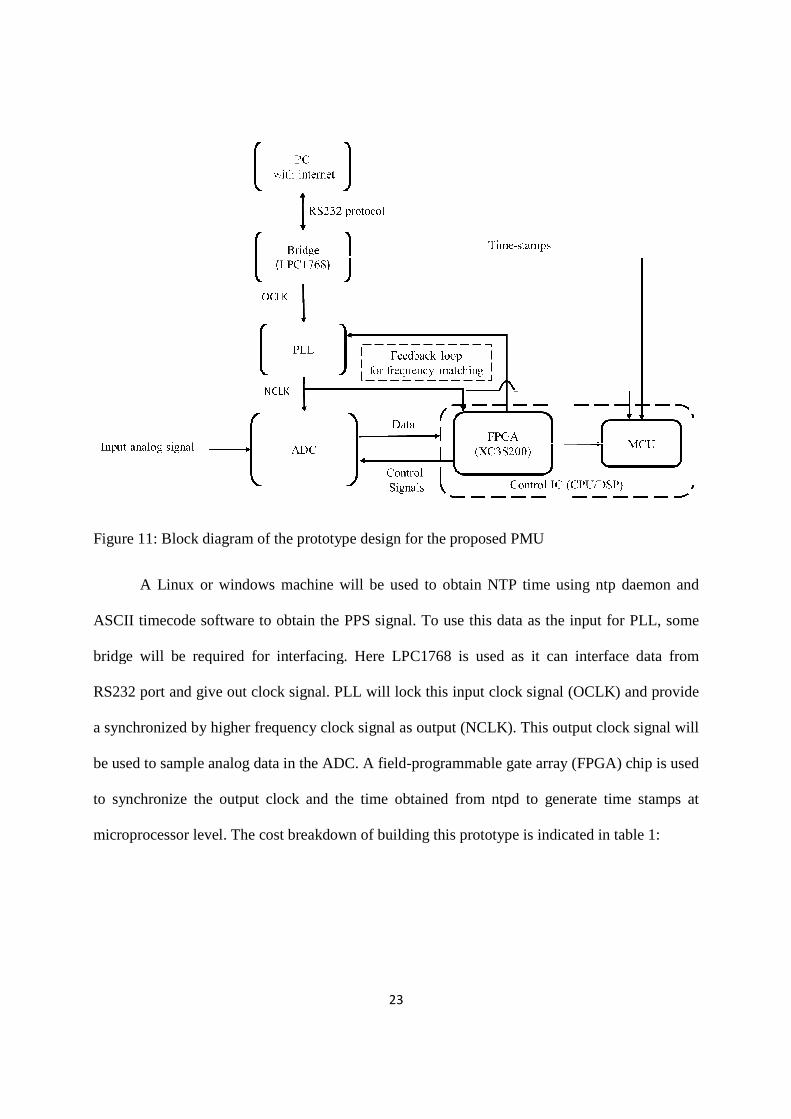
Figure 11: Block diagram of the prototype design for the proposed PMU
A Linux or windows machine will be used to obtain NTP time using ntp
ASCII timecode software to obtain
bridge will be required for interfacing. Here LPC1768 is used as it can interface
RS232 port and give out clock signal. PLL will lock this input clock signal (OCLK) and provide
a synchronized by higher frequency clock signal as output (NCLK). This output clock signal will
be used to sample analog data in the ADC
to synchronize the output clock and the time obtained from ntpd to generate time stamps at
microprocessor level. The cost breakdown of building this prototype is
23
: Block diagram of the prototype design for the proposed PMU
A Linux or windows machine will be used to obtain NTP time using ntp
ASCII timecode software to obtain the PPS signal. To use this data as the input for PLL, some
bridge will be required for interfacing. Here LPC1768 is used as it can interface
RS232 port and give out clock signal. PLL will lock this input clock signal (OCLK) and provide
a synchronized by higher frequency clock signal as output (NCLK). This output clock signal will
d to sample analog data in the ADC. A field-programmable gate array (FPGA) chip is used
to synchronize the output clock and the time obtained from ntpd to generate time stamps at
The cost breakdown of building this prototype is indicated in table 1
A Linux or windows machine will be used to obtain NTP time using ntp daemon and
o use this data as the input for PLL, some
bridge will be required for interfacing. Here LPC1768 is used as it can interface data from
RS232 port and give out clock signal. PLL will lock this input clock signal (OCLK) and provide
a synchronized by higher frequency clock signal as output (NCLK). This output clock signal will
ammable gate array (FPGA) chip is used
to synchronize the output clock and the time obtained from ntpd to generate time stamps at
indicated in table 1:
24
Component Estimated Cost ($)
ASCII timecode software (for 1 client) 50
LPC1768 (100pin, 3.3V) 6 to 10
PLL 3 to 7
ADC 6 to 20
FPGA 20
Microprocessor unit (16bit, 25MHz) 10
Gadget Box
CHU radio receiver
Bandpass filter (2000 ± 500Hz)
TTL pulse generator (74LS123)
EIA level converter (ICL232)
Modem (DB25 female DCE)
Resistors, Capacitors, LEDs
130
70
1
3
50
1 to 5
Memory (8GB) 70
Total Estimated cost 446
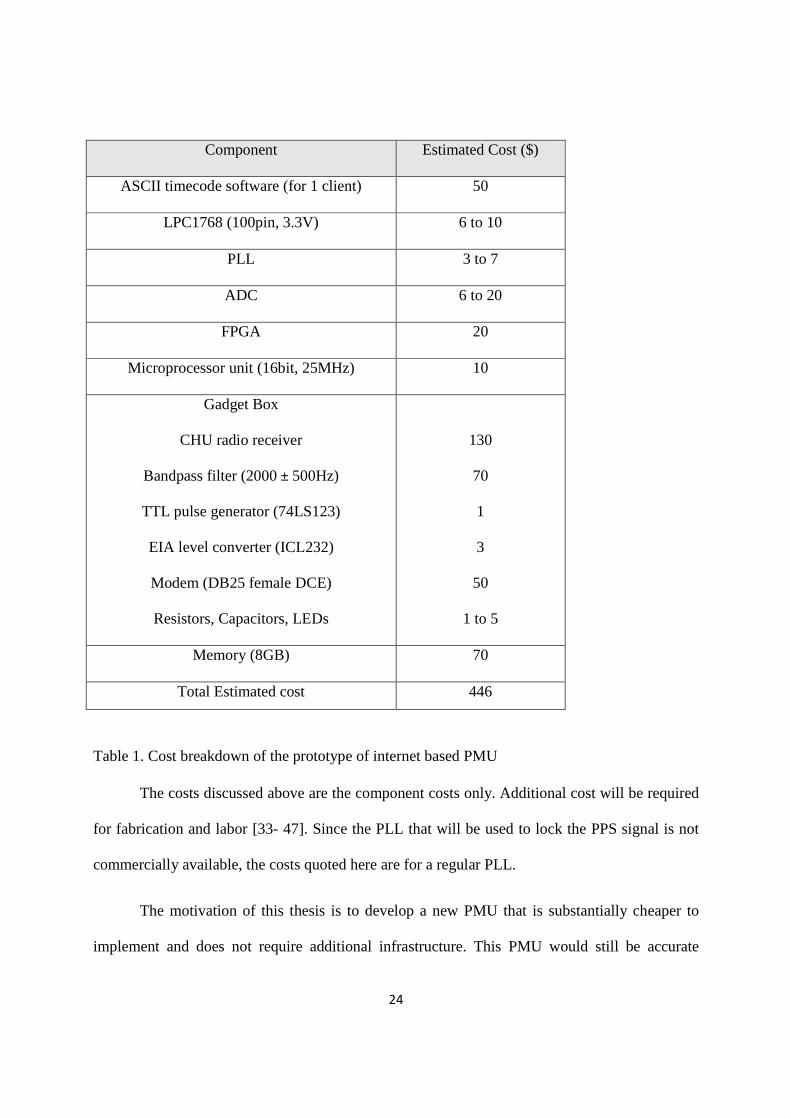
Table 1. Cost breakdown of the prototype of internet based PMU
The costs discussed above are the component costs only. Additional cost will be required
for fabrication and labor [33- 47]. Since the PLL that will be used to lock the PPS signal is not
commercially available, the costs quoted here are for a regular PLL.
The motivation of this thesis is to develop a new PMU that is substantially cheaper to
implement and does not require additional infrastructure. This PMU would still be accurate

25
enough to be used in distribution networks. Chapter 5 will establish clear goals and methods for
systematically evaluating the performance of the internet based PMU. The proposed PMU will
be compared with the conventional PMU based on the requirements of the synchrophasor
standard described in this chapter and monitoring requirements of the distribution networks.
26
Chapter 5. Evaluation of the proposed PMU versus conventional PMU
5.1 Introduction
A low cost PMU solution was proposed in the preceding chapter. This proposed PMU
banks on the existing network of NTP servers for time synchronization thus largely bringing
down the cost of the required communication infrastructure. NTP has been in use for a long time,
and the performance is nearly perfect for the PMU time synchronization. Using NTP, it is not
necessary to add or change any major construction and equipment. The common time
synchronization equipment can have the interface for NTP, and the cost is very low.
The precision provided by NTP synchronization however, might not be sufficient for
monitoring of transmission networks. Distribution network on the other hand has SCADA
monitoring only at HV/MV substations i.e. primary substation and only Boolean data from
sectionalizers etc. at secondary substations [32]. Figure 12 shows a typical distributions network.
In SCADA, data is not synchronized at all but rather sent over a window of a couple of
seconds and assumed to be synchronized. Therefore, NTP would be an attractive solution for
real-time monitoring as it is better than SCADA, and close to the performance in conventional
PMU but with considerably lower costs.
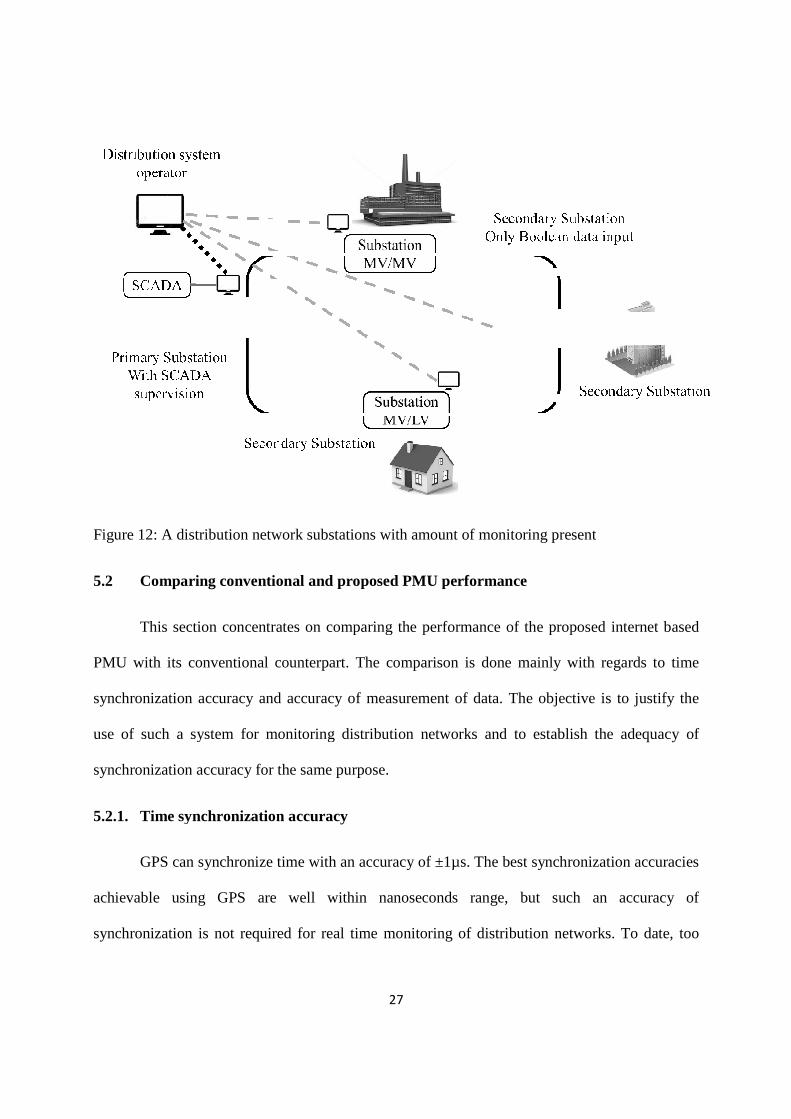
Figure 12: A distribution network substations with amount of monitoring present
5.2 Comparing conventional and proposed PMU performance
This section concentrates on comparing the performance of the proposed internet
PMU with its conventional counterpart
synchronization accuracy and accuracy
use of such a system for monitoring distribution networks and
synchronization accuracy for the same
5.2.1. Time synchronization
GPS can synchronize tim
achievable using GPS are well within nanoseconds range
synchronization is not required for real time monitoring of distribution networks.
27
: A distribution network substations with amount of monitoring present
conventional and proposed PMU performance
concentrates on comparing the performance of the proposed internet
PMU with its conventional counterpart. The comparison is done mainly with regards to time
synchronization accuracy and accuracy of measurement of data. The objective is to justify the
system for monitoring distribution networks and to establish the
synchronization accuracy for the same purpose.
ime synchronization accuracy
GPS can synchronize time with an accuracy of ±1µs. The best synchronization accuracies
achievable using GPS are well within nanoseconds range, but such
synchronization is not required for real time monitoring of distribution networks.
: A distribution network substations with amount of monitoring present
concentrates on comparing the performance of the proposed internet based
. The comparison is done mainly with regards to time
of measurement of data. The objective is to justify the
to establish the adequacy of
1µs. The best synchronization accuracies
such an accuracy of
synchronization is not required for real time monitoring of distribution networks. To date, too
much emphasis has been put on the
varied needs.
GPS provides very precise timestamps
files. The Header file is a human readable file
the data and he may wish to share it.
with fixed formats. The data files
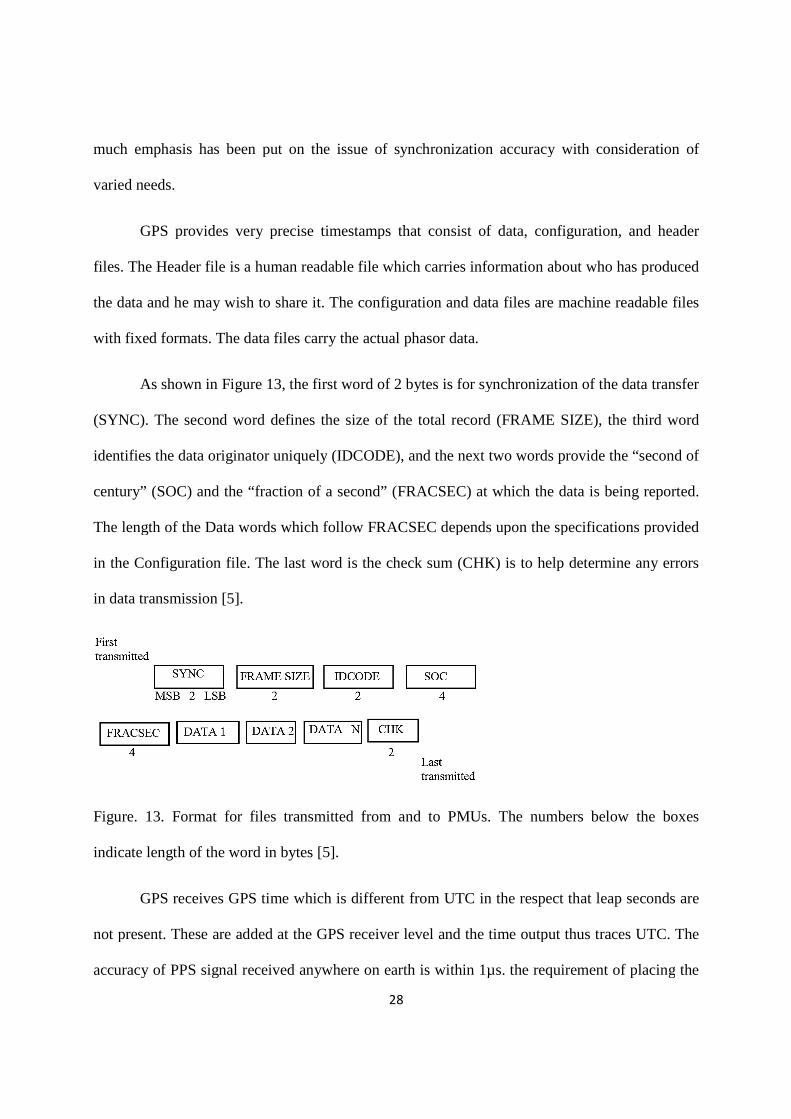
As shown in Figure 13
(SYNC). The second word defines the size of the total record
identifies the data originator uniquely
century” (SOC) and the “fraction of a second” (FRACSEC) at which the data is being reported.
The length of the Data words which follow FRACSEC depends upon the specifications provided
in the Configuration file. The last word is the check sum
in data transmission [5].
Figure. 13. Format for files transmitted from and to PMUs.
indicate length of the word in bytes [5].
GPS receives GPS time which
not present. These are added at the GPS receiver level and the time output thus traces UTC. The
accuracy of PPS signal received anywhere on earth is within 1µ
28
s been put on the issue of synchronization accuracy
GPS provides very precise timestamps that consist of data, configuration, and header
files. The Header file is a human readable file which carries information about who has produced
the data and he may wish to share it. The configuration and data files are machine readable files
formats. The data files carry the actual phasor data.
3, the first word of 2 bytes is for synchronization of the data transfer
. The second word defines the size of the total record (FRAME SIZE)
identifies the data originator uniquely (IDCODE), and the next two words provide the “second of
century” (SOC) and the “fraction of a second” (FRACSEC) at which the data is being reported.
The length of the Data words which follow FRACSEC depends upon the specifications provided
e. The last word is the check sum (CHK) is to help determine any errors
. Format for files transmitted from and to PMUs. The numbers below the boxes
indicate length of the word in bytes [5].
GPS receives GPS time which is different from UTC in the respect that leap seconds are
not present. These are added at the GPS receiver level and the time output thus traces UTC. The
accuracy of PPS signal received anywhere on earth is within 1µs. the requirement of placing
curacy with consideration of
consist of data, configuration, and header
which carries information about who has produced
ata files are machine readable files
bytes is for synchronization of the data transfer
(FRAME SIZE), the third word
, and the next two words provide the “second of
century” (SOC) and the “fraction of a second” (FRACSEC) at which the data is being reported.
The length of the Data words which follow FRACSEC depends upon the specifications provided
to help determine any errors
The numbers below the boxes
is different from UTC in the respect that leap seconds are
not present. These are added at the GPS receiver level and the time output thus traces UTC. The
requirement of placing the

29
GPS receiver at a location from which at least 4 satellites are visible is not feasible in some
cases. This is a limiting factor on the use of GPS receiver.
Another hindrance for using GPS on a large scale is the communication requirement of
GPS as it does not have communication capabilities. Instead, it has to be integrated with some
communication network and having a dedicated communication system ensures better accuracy
but introduces extensive monetary and time investments. The report on DOE experience with
Recovery Act Synchrophasor Projects confirms that, in terms of other equipment needed for
synchrophasor systems, other than the PMUs and PDCs, the greatest amounts spent by any one
project thus far were $15,000,000 on communications systems [4].
NTP also provides time stamps in SOC and fraction of second information in the form of
a 64-bit unsigned fixed-point number, with the integer part in the first 32-bit and the fraction part
in the last 32 bits and interpreted in standard seconds relative to UTC [28]. When a message
arrives, the time from the local clock of the computer interface is transferred to the time-stamp
variable. The quality of the time signal generated on the computer interface thus depends on the
quality of internal computer clock [51]. It also depends on the type of internet connection, the
congestion present in network, but not necessarily the stratum that is used for synchronization.
Algorithms can help decrease the latency in picking up the time signal that is received via
NTP [51]. The maximum resolution of an NTP time stamp is about 200 ps (about the time it
takes an electrical pulse to travel through 2 cm of copper wire), so the ultimate accuracy of NTP
is likely to be limited by hardware and latency concerns, rather than by the NTP protocol [26].
The NTP system consists of a network of primary and secondary time servers, clients,
and interconnecting transmission paths. A primary time server is directly synchronized to a
primary reference source which is very accurate. The sec
and choose the most accurate and reliable system of servers to obtain time.
NTP protocol is continuously improving in terms of time synchronization accuracy. A
series of incremental improvements in system hardware a
significantly better accuracy and stability. These improvements include novel interfacing
techniques and operating system features [
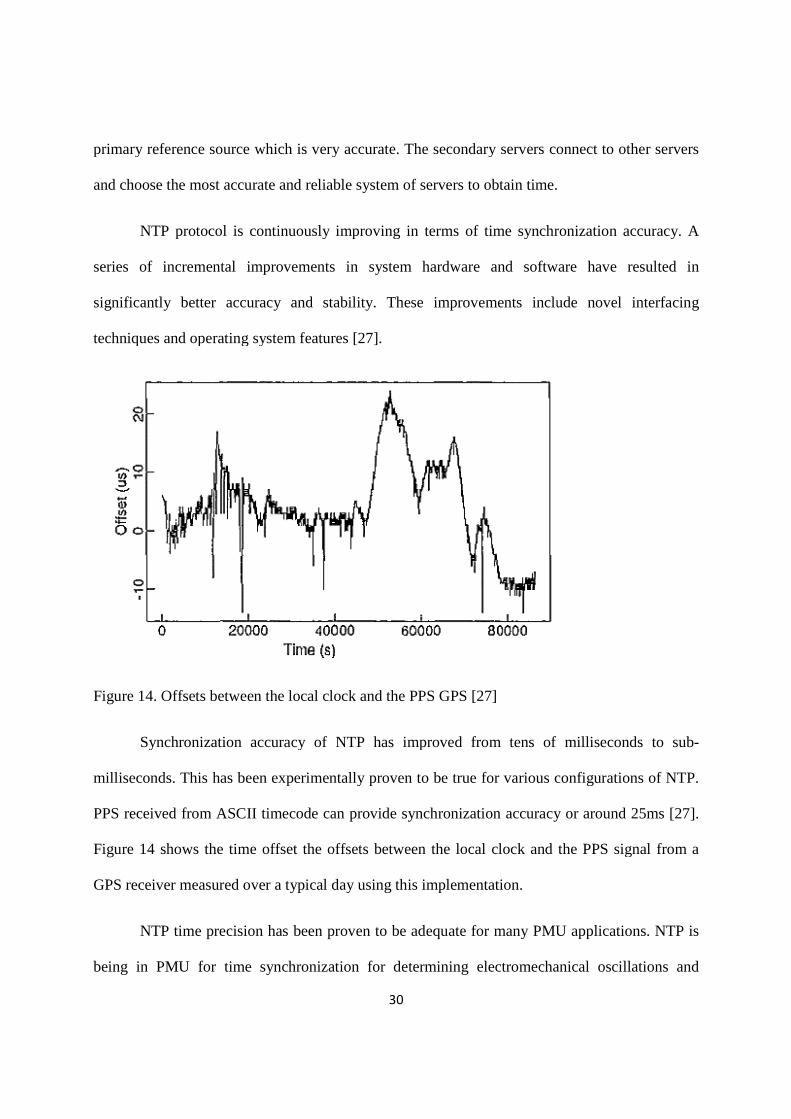
Figure 14. Offsets between the local clock and the PPS GPS
Synchronization accuracy
milliseconds. This has been experimentally proven to be true for various configurations of NTP
PPS received from ASCII timecode can provide synchronization accuracy or around 25
Figure 14 shows the time offset the offsets between the local clock and the PPS signal from a
GPS receiver measured over a typical day using this implementation.
NTP time precision has
being in PMU for time synchronization
30
primary reference source which is very accurate. The secondary servers connect to other servers
and choose the most accurate and reliable system of servers to obtain time.
NTP protocol is continuously improving in terms of time synchronization accuracy. A
series of incremental improvements in system hardware and software have resulted in
y better accuracy and stability. These improvements include novel interfacing
techniques and operating system features [27].
. Offsets between the local clock and the PPS GPS [27]
ynchronization accuracy of NTP has improved from tens of milliseconds to sub
This has been experimentally proven to be true for various configurations of NTP
PPS received from ASCII timecode can provide synchronization accuracy or around 25
shows the time offset the offsets between the local clock and the PPS signal from a
receiver measured over a typical day using this implementation.
has been proven to be adequate for many PMU applications
being in PMU for time synchronization for determining electromechanical oscillations and
ondary servers connect to other servers
and choose the most accurate and reliable system of servers to obtain time.
NTP protocol is continuously improving in terms of time synchronization accuracy. A
nd software have resulted in
y better accuracy and stability. These improvements include novel interfacing
has improved from tens of milliseconds to sub-
This has been experimentally proven to be true for various configurations of NTP.
PPS received from ASCII timecode can provide synchronization accuracy or around 25ms [27].
shows the time offset the offsets between the local clock and the PPS signal from a
many PMU applications. NTP is
for determining electromechanical oscillations and

31
frequency measurements [52- 53]. For observing frequency in wide area, six PMUs have been
setup and synchronized via NTP (software only version) and the measured frequency is also sent
to a common location using the internet.
Many experiments have been conducted to test and calibrate the expected accuracy of
NTP over normal local area network (LAN) and wide area network (WAN) connections [27-
31]. In these experiments the PPS obtained from GPS is compared to one which is obtained
using NTP. The results of few such experiments by David Mills are mentioned below [27]:
1. The offset i.e. time error between PPS generated by GPS and obtained via NTP was
measured for a particular primary server with over 400 clients being supported using
NTP version 3. Some of the clients had intense computational and cryptographic
requirements. The results showed that synchronization could be maintained within 400µs.
2. The offset between two primary servers was measured. These represent typical a system
which is generally used. One of the servers was a dedicated time server while other was
multi-functional. Occasional spikes of 1ms were seen, but these would be taken care of at
the PLL end.
3. The results of an experiment in which the primary and secondary server offset was
measured show that the maximum offset was 2.5ms.
This data, as well as from several other experiments shows that using only software NTP
can provide synchronization in tens of milliseconds. With the addition of hardware such as a
gadget box for the PPS much better accuracies can be achieved. However, NTP version 4
provides the option of choosing the servers for synchronization. 9 or less servers can be chosen.
This gives an opportunity to connect all the PMUs to the same set of servers for lower mutual
offset. Also, in case of loss of absolute time, the PMUs would still be synchronized.
32
Using the gadget box along with NTP software and PLL can provide accuracies in the µs
range. The accuracy of time-stamps obtained in such an arrangement is 20-30 µs [27]. However,
it was claimed that this configuration might yield 1 µs accuracy in time-stamps [27]. This
accuracy is assumed for the mathematical analysis in the following section.
5.2.2. Measurement accuracy
Transmission networks have a dense network of SCADA present for monitoring. The
data received from SCADA along with other information is run through a state estimation
algorithm and the quasi state of the system is determined. This information is now used as an
input for various other applications. On the other hand, SCADA is present very sparsely in
distribution networks. This minimal data along with Boolean data coming from fault indicators,
sectionalizers and remote switches is uploaded at the control center. The control operator now
takes actions manually against an information log. These actions are thus taken very
conservatively to ensure that the system is not overloaded.
The purpose of PMU would be different in transmission and distribution networks. In
transmission network, the need of PMU arises mainly to measure the state of the system, or
improve state estimation and control. This would require PMUs with very high synchronization
precision like the one provided by conventional PMU. The purpose of PMU in distribution
networks however would be mainly for situational awareness, fault location detection and so on.
For these purposes, the PMU need not to be so precise in time synchronization. The proposed
PMU accuracies would be adequate for distribution networks.
The real and reactive power flow from Bus i to Bus k can be given by:
)sincos( ikikikikkiik BGVVP θθ += (1)

33
kiik
ikikikikkii BGVVQ
θθθ
θθ
−=
−=
where
)cossin(
(2)
Where Pik and Qik is the real and reactive power flow between ith Bus and kth Bus, Gik is
conductance and Bik susceptance between the i th and kth Bus, Vi and Vk respective voltage
magnitudes and θ i and θ k respective phase angles at i and k Bus.
Suppose that the error in estimates of the real and reactive power flow over a line
connecting Bus i and k are δPik and δQik respectively; the error in measurement of the power
angle difference θ ik =θi −θk is δθik; and δt is the error in measurement of time. Then, simplifying
and rearranging the Equations gives us:
( )( ) ( )
ik
ik
ik
ik
ikikik
ik
ikikik
ikikik
ik
ik
G
B
ttG
Bt
tt
tGB
GB
P
P
=
∂∂≅
∂∂−≤
++−=
α
δθδθαθδδ
δθθ
θδ
tan where
2
tantan1
tan
(5.3)
A Taylor’s series expansion is applied to approximate the tangent function, and we
truncate higher order terms, i.e.,
( ) ( ) ik
ikik
ik
ik
ik
ikik
ikik G
B
G
B
G
B
ik
21h.o.t
cos
1tantan
2
2
0
2≤
++≅+
−−−=−
=
θθθα
ααθθ
(5.4)
Note that θik is very close to zero in the power system operation, and typical values for
Gik/Bik are in the range of 0.5 - 1.
Similarly, based on the observation;
34
( )
( ) ( ) ttB
Gt
tt
tGB
GB
Q
Q ik
ik
ikikik
ik
ikikik
ikikik
ik
ik δθδθαθδδ
δθθ
θδ∂
∂≅∂
∂+≤+
−= 2cot
tan
tan1 (5.5)
And
( ) ( ) ik
ikik
ik
ik
ik
ikik
ikik B
G
B
G
B
G
ik
21h.o.t
sin
1cotcot
2
2
0
2≤
+−≅+
+−=+
=
θθαθ
ααθθ
(5.6)
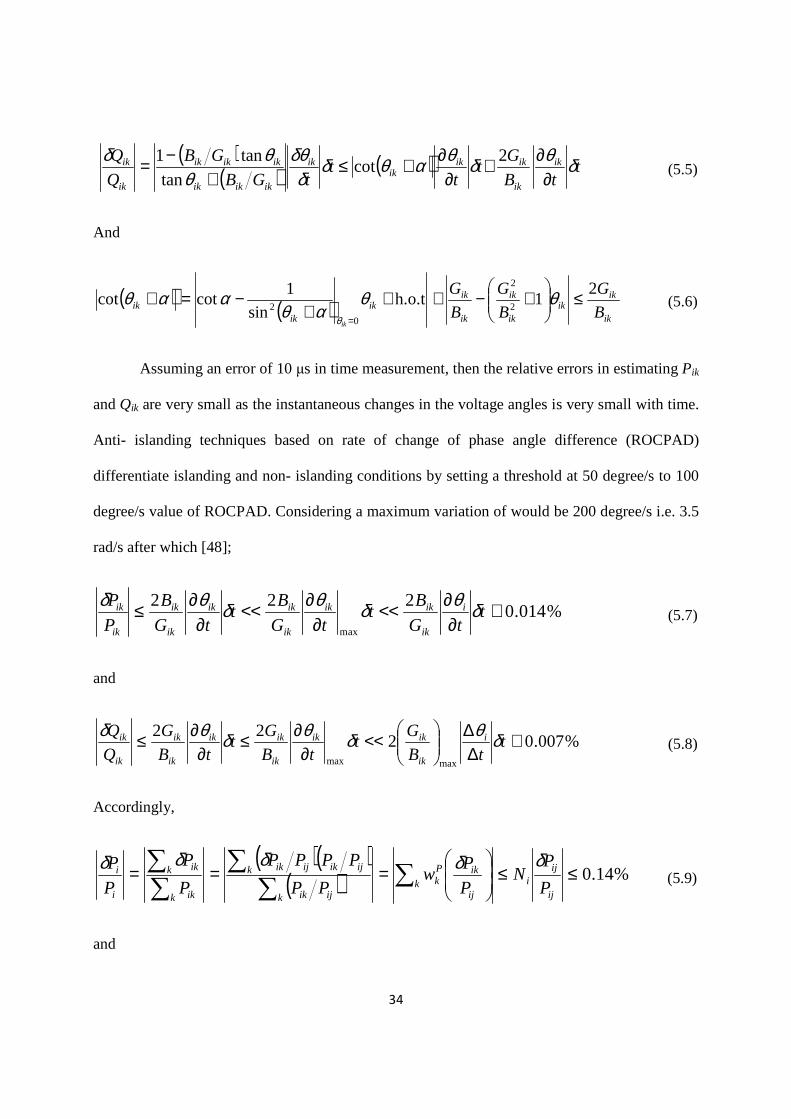
Assuming an error of 10 µs in time measurement, then the relative errors in estimating Pik
and Qik are very small as the instantaneous changes in the voltage angles is very small with time.
Anti- islanding techniques based on rate of change of phase angle difference (ROCPAD)
differentiate islanding and non- islanding conditions by setting a threshold at 50 degree/s to 100
degree/s value of ROCPAD. Considering a maximum variation of would be 200 degree/s i.e. 3.5
rad/s after which [48];
%014.0222
max
≅∂
∂<<∂
∂<<∂
∂≤ ttG
Bt
tG
Bt
tG
B
P
P i
ik
ikik
ik
ikik
ik
ik
ik
ik δθδθδθδ (5.7)
and
%007.0222
maxmax
≅∆
∆
<<
∂∂≤
∂∂≤ t
tB
Gt
tB
Gt
tB
G
Q
Q i
ik
ikik
ik
ikik
ik
ik
ik
ik δθδθδθδ (5.8)
Accordingly,
( )( )( ) %14.0≤≤
=== ∑
∑∑
∑∑
ij
ijik
ij
ikPk
k ijik
k ijikijik
k ik
k ik
i
i
P
PN
P
Pw
PP
PPPP
P
P
P
P δδδδδ (5.9)
and

35
( )( )( ) %07.0≤≤
=== ∑
∑∑
∑∑
ij
ijik
ij
ikQk
k ijik
k ijikijik
k ik
k ik
i
i
Q
QN
Q
Qw
QQQQ
Q
Q
Q
Q δδδδδ (5.10)
where j = argmaxk
Pik
Pij
, wk
P =Pik Pij
Pik Pij( )k∑, wk
Q =Qik Qij
Qik Qij( )k∑; (5.11)
Also, Ni is the number of the lines connected to Bus i, for a distribution network Ni ≤ 10 unless
Bus i is a feeder.
Note that these upper bounds are significantly overestimated. The most significant
overestimate comes from the upper bound replacing the rate of voltage angle difference between
two Buses with the rate of voltage angle at a Bus. According to the current operation policy of
distribution network (radial topology and uni-directional power flow from a feeder to sinks), the
rate of voltage angle difference is much smaller than that of voltage angle. Therefore, these
values are extreme cases but remain so small as to be still acceptable in distribution monitoring.
36
Chapter 6. Applications and future prospects
6.1 Applications of proposed PMU
Real time monitoring in distribution networks can help to significantly reduce congestion
by monitoring the line flows continuously and making it easier to use lines to their maximum
capacity [54]. With the increasing amount of solar photovoltaics (PV) and rooftop wind turbines
being integrated into the grid, the penetration level of distributed generation steadily increases.
Real time monitoring in such scenarios can go a long way to strengthen the stability of the
system by helping to observe and allocate real as well as reactive power in a better way.
Moreover, distribution network topology is not constant and keeps on getting reconfigured. This
reconfiguration occurs automatically in the case of faults or is assumed to carry out maintenance
or repair work. PMUs can help reconfigure the network efficiently by making the network
parameters visible.
One immediate application of this PMU is to detect faults and fault location. Currently,
fault detection relies heavily on a phone-call from end-consumers. Needless to say, this method
involves a lot of ambiguity and is highly inefficient and time consuming. While many techniques
exist for fault location detection for transmission lines, these cannot be applied to distribution
network due to the inherent difference in topologies between transmission and distribution
networks. Another reason is that most of fault location detection techniques are knowledge based
often rely on external information such as SCADA alarms, substation and feeder switch status,
feeder measurements, load voltage sensors, etc. In distribution systems, measurements are
37
usually only available at the substation and information about the operation of feeder protective
devices is normally unknown [55].
Having a PMU at every node would make the system completely observable and make
way for utilization of many of the fault detection techniques in the distribution network. The
method discussed in [55] provides an accurate means to determine fault location in distribution
networks. The diagnostic scheme involves three steps: signal processing, fault location and fault
diagnosis. Signal processing refers to the step of estimating the phasors. This step can now be
eliminated as phasors can be directly measured using PMU. Fault location refers to the step of
performing fault distance calculations, estimating the range of faults and fault diagnosis is the
identification of fault location and ranking of fault [55].
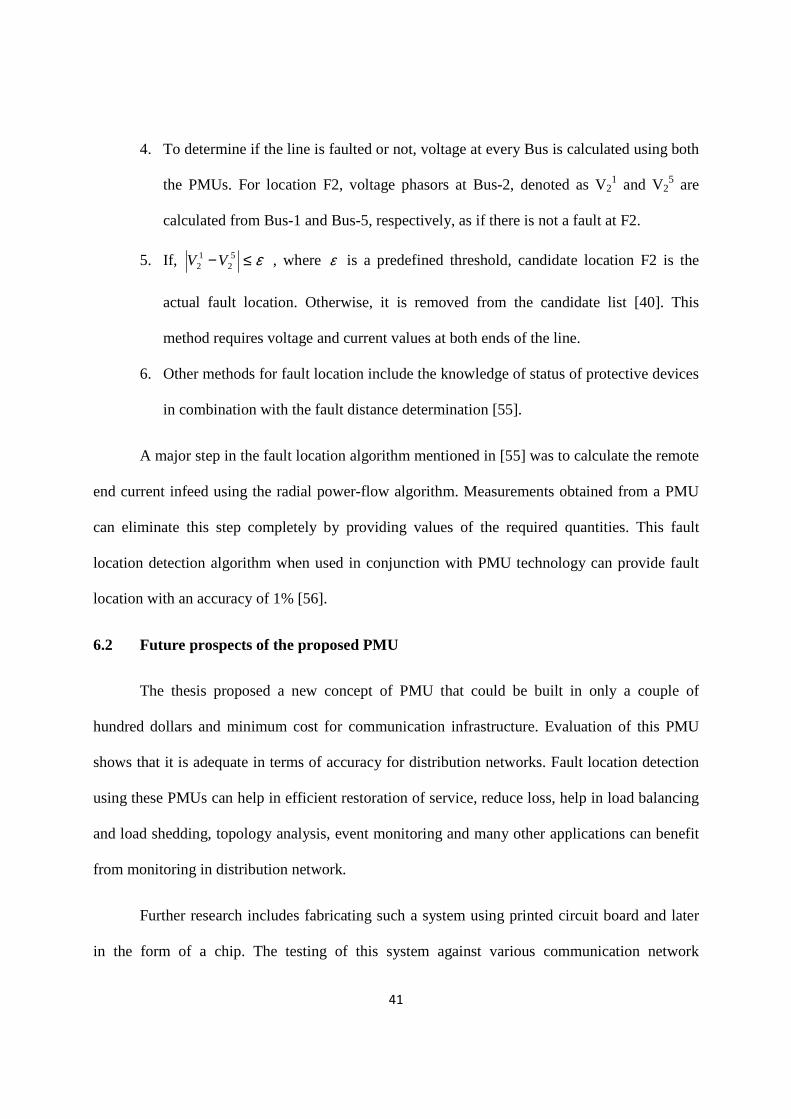
Consider a single line-to-ground fault on phase A as shown in Figure 15. Allowing for
the mutual couplings among different phases, the following relationship exists for the faulty
phase,
ffcacbabaaaa RIIZIZIZDV +++= )( (6.1)
where, D is the fault distance, If is the fault current, Rf is the fault resistance, Zaa is self-
impedance of phase a, Zab is mutual-impedance between phase a and b, and Zac is mutual-
impedance between phase a and c.
The fault current will be equal to:
'aaf III −= (6.2)
Here, Ia’ is the remote infeed current and is a function of Va’, Vb’and Vc’.

38
From Equation (6.1) and (6.2);
faacacbabaaaa RIIIZIZIZDV )'()( −+++= (6.3)
Separating the real and imaginary parts of Equation (6.3), we get;
)(
)(
'ra
raf
ic
iac
rc
rac
ib
iab
rb
rab
ia
iaa
ra
raa
ra
IIR
IZIZIZIZIZIZDV
−+
−+−+−= (6.4)
and
)(
)(
'ia
iaf
rc
iac
ic
rac
rb
iab
ib
rab
ra
iaa
ia
raa
ia
IIR
IZIZIZIZIZIZDV
−+
+++++= (6.5)
Equations (6.4) and (6.5) can be written in matrix form as:
−+++++−−+−+−
=
fia
ia
rc
iac
ic
rac
rb
iab
ib
rab
ra
iaa
ia
raa
ra
ra
ic
iac
rc
rac
ib
iab
rb
rab
ia
iaa
ra
raa
ia
ra
R
D
IIIZIZIZIZIZIZ
IIIZIZIZIZIZIZ
V
V
)()(
)()(
'
' (6.6)
Here the superscript ‘r’ denotes the real component and ‘i’ denotes the imaginary component.
Solving Equations (6.4) and (6.5) simultaneously, the value of D and Rf can be calculated.

Figure 15: A single-line
Combining the algorithm for fault distance from [
mentioned in [40], the complete process of detecting and locating fault
system is observable using PMUs
1. From the measurement of currents
With the known fault current, the fault distance and the fault resistance can be
calculated by separating
the two resulting real
2. Once the fault distance is calculated, the search begins by assuming the line directly
connected to be faulty.
line, the search moves on
on. By traversing the network in a certain sequence, all possible fault locations can be
identified [55]. An example is illustrated
39
line-to-ground fault on phase A [55]
Combining the algorithm for fault distance from [55] and the method for fault location
the complete process of detecting and locating fault (with the assumption that
system is observable using PMUs) can be summarized in the steps below:
From the measurement of currents Ia and Ia’ obtained from the PMU,
With the known fault current, the fault distance and the fault resistance can be
calculated by separating Equation (6.1) into real and imaginary part
the two resulting real Equations as shown in Equation (6.4) and (
Once the fault distance is calculated, the search begins by assuming the line directly
connected to be faulty. However, if the fault distance is greater than the
line, the search moves on to the lines connected to the receiving end of
on. By traversing the network in a certain sequence, all possible fault locations can be
An example is illustrated in Figure 16.
method for fault location
(with the assumption that
obtained from the PMU, I f is calculated.
With the known fault current, the fault distance and the fault resistance can be
1) into real and imaginary parts and then solving
4) and (6.5).
Once the fault distance is calculated, the search begins by assuming the line directly
f the fault distance is greater than the length of this
receiving end of the line and so
on. By traversing the network in a certain sequence, all possible fault locations can be
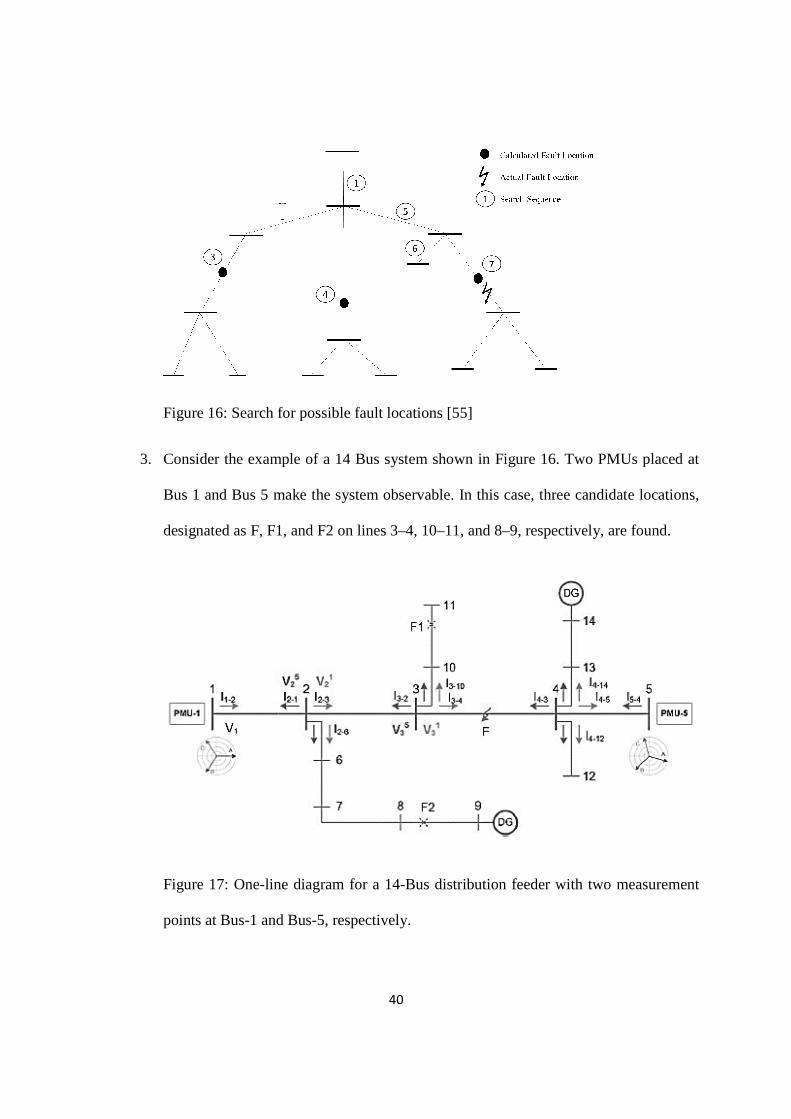
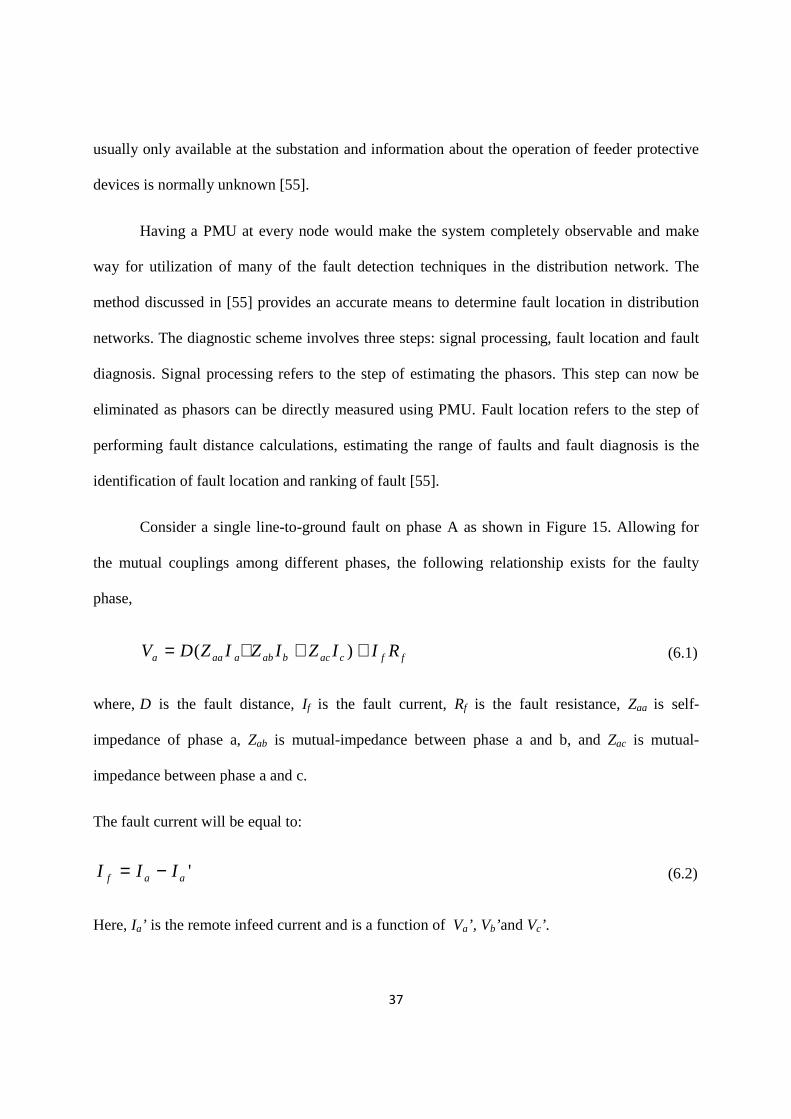
Figure 16: Search for possible fault l
3. Consider the example of
Bus 1 and Bus 5 make the system observable. In this case, three candidate locations,
designated as F, F1, and F2 on line
Figure 17: One-line diagram for a 14
points at Bus-1 and
40
: Search for possible fault locations [55]
example of a 14 Bus system shown in Figure 16. Two PMUs placed at
5 make the system observable. In this case, three candidate locations,
designated as F, F1, and F2 on lines 3–4, 10–11, and 8–9, respectively, are found
line diagram for a 14-Bus distribution feeder with two measurement
1 and Bus-5, respectively.
. Two PMUs placed at
5 make the system observable. In this case, three candidate locations,
9, respectively, are found.
distribution feeder with two measurement
41
4. To determine if the line is faulted or not, voltage at every Bus is calculated using both
the PMUs. For location F2, voltage phasors at Bus-2, denoted as V21 and V2
5 are
calculated from Bus-1 and Bus-5, respectively, as if there is not a fault at F2.
5. If, ε≤− 52
12 VV , where ε is a predefined threshold, candidate location F2 is the
actual fault location. Otherwise, it is removed from the candidate list [40]. This
method requires voltage and current values at both ends of the line.
6. Other methods for fault location include the knowledge of status of protective devices
in combination with the fault distance determination [55].
A major step in the fault location algorithm mentioned in [55] was to calculate the remote
end current infeed using the radial power-flow algorithm. Measurements obtained from a PMU
can eliminate this step completely by providing values of the required quantities. This fault
location detection algorithm when used in conjunction with PMU technology can provide fault
location with an accuracy of 1% [56].
6.2 Future prospects of the proposed PMU
The thesis proposed a new concept of PMU that could be built in only a couple of
hundred dollars and minimum cost for communication infrastructure. Evaluation of this PMU
shows that it is adequate in terms of accuracy for distribution networks. Fault location detection
using these PMUs can help in efficient restoration of service, reduce loss, help in load balancing
and load shedding, topology analysis, event monitoring and many other applications can benefit
from monitoring in distribution network.
Further research includes fabricating such a system using printed circuit board and later
in the form of a chip. The testing of this system against various communication network
42
topologies, under faults etc. would provide clarity and better understanding of the system. The
dedicated communication need of PMU is mainly because of accuracy and cyber security
reasons.
The synchrophasor system proposed in the thesis is satisfactory in terms of accuracy
needed for distribution networks. As the system becomes more dependent on the communication
infrastructure, it also becomes vulnerable to cyber-security attacks. Published results have
identified some cyber-attacks which utilize malicious data injection to compromise the state
estimator data and the counter-measures taken [57]. Many research papers discuss various
methods of detecting and protecting the synchrophasor system from cyber-attacks [57- 59]. Due
to the specific nature of data provided by PMUs, it is crucial that strategies be developed for
preemptive, real-time detection and post- attack analysis. This could open new doors for the use
of commonly used communication infrastructure in PMU technology making it more affordable.
The future smart grids will require significantly large number of PMUs for the benefits
outlined above. For achieving the goal, customizing PMU according to the application and
requirements will provide a good solution.

43
References
1. Schramm, Gunter. "Electric power in developing countries: status, problems,
prospects." Annual review of energy 15.1 (1990): 307-333, 1990.
2. “Enhancing the Smart Grid: Integrating Clean Distributed and Renewable
Generation”,
http://energy.gov/sites/prod/files/oeprod/DocumentsandMedia/RDSI_fact_sheet-
090209.pdf, September, 2009.
3. “2013 Annual Report”, North American Electric Reliability Corporation,
http://www.nerc.com/news/Headlines%20DL/NERC%202013%20Annual%20Report
_final_web.pdf, February 2014.
4. “Synchrophasor Technologies and their Deployment in the Recovery Act Smart Grid
Programs”, US Department of Energy Report, August 2013.
5. Phadke, Arun G., and John Samuel Thorp. Synchronized phasor measurements and
their applications. Springer, 2008.
6. Adamiak, Mark, Bogdan Kasztenny, and William Premerlani. "Synchrophasors:
definition, measurement, and application." Proceedings of the 59th Annual Georgia
Tech Protective Relaying, Atlanta, GA, 2005.
7. Phadke, A.G.; Thorp, J.S.; Adamiak, M.G., "A New Measurement Technique for
Tracking Voltage Phasors, Local System Frequency, and Rate of Change of
Frequency," Power Apparatus and Systems, IEEE Transactions on , vol.PAS-102,
no.5, pp.1025,1038, May 1983.

44
8. Phadke, A.G.; Thorp, J.S., "HISTORY AND APPLICATIONS OF PHASOR
MEASUREMENTS," Power Systems Conference and Exposition, 2006. PSCE '06.
2006 IEEE PES , vol., no., pp.331,335, Oct. 29 2006-Nov. 1 2006.
9. De La Ree, J.; Centeno, V.; Thorp, J.S.; Phadke, A.G., "Synchronized Phasor
Measurement Applications in Power Systems," Smart Grid, IEEE Transactions on ,
vol.1, no.1, pp.20,27, June 2010.
10. Phadke, A.G.; de Moraes, R.M., "The Wide World of Wide-area
Measurement," Power and Energy Magazine, IEEE , vol.6, no.5, pp.52,65,
September-October 2008.
11. De La Ree, J.; Centeno, V.; Thorp, J.S.; Phadke, A.G., "Synchronized Phasor
Measurement Applications in Power Systems," Smart Grid, IEEE Transactions on ,
vol.1, no.1, pp.20,27, June 2010
12. Fang Chen; Xueshan Han; Zhiyuan Pan; Li Han, "State estimation model and
algorithm including PMU," Electric Utility Deregulation and Restructuring and
Power Technologies, 2008. DRPT 2008. Third International Conference on , vol.,
no., pp.1097,1102, 6-9 April 2008.
13. Hui Xue; Qing-quan Jia; Ning Wang; Zhi-qian Bo; Hai-tang Wang; Hong-xia Ma, "A
Dynamic State Estimation method with PMU and SCADA measurement for power
systems," Power Engineering Conference, 2007. IPEC 2007. International, vol., no.,
pp.848,853, 3-6 Dec. 2007.
14. Thorp, J.S.; Phadke, A.G.; Horowitz, S.H.; Begovic, M.M., "Some applications of
phasor measurements to adaptive protection," Power Systems, IEEE Transactions on,
vol.3, no.2, pp.791, 798, May 1988.

45
15. Ding, Feng; Booth, C.D., "Protection and stability assessment in future distribution
networks using PMUs," Developments in Power Systems Protection, 2012. DPSP
2012. 11th International Conference on , vol., no., pp.1,6, 23-26 April 2012.
16. V. Madani, E. Taylor, D. Erwin, A. Meklin, and M. Adamik, “High speed control
scheme to prevent instability of a large multi-unit power plant,” presented at the
Clemson Power System Conf., Clemson, SC, Mar. 13–16, 2007.
17. IEEE Standard for Synchrophasor Measurements for Power Systems, IEEE Standard
C37.118.1-2011 (Revision of IEEE Standard C37.118- 2005).
18. “Executive Report On the State of Synchrophasors in the USA”, ESTA International
LLC, November 2011.
19. Premerlani, W.; Kasztenny, B.; Adamiak, M., "Development and Implementation of a
Synchrophasor Estimator Capable of Measurements Under Dynamic
Conditions," Power Delivery, IEEE Transactions on , vol.23, no.1, pp.109,123, Jan.
2008 .
20. Qin Lijun; Zheng Shenrui; Guo Qing; Hao Cuijuan, "Feasibility study of PMU based
on IEEE 1588," Electric Utility Deregulation and Restructuring and Power
Technologies (DRPT), 2011 4th International Conference on , vol., no., pp.922,925,
6-9 July 2011.
21. Pallarés-López, V.; Moreno-Muñoz, A.; Torrellas, M.P.; García, I.M.M.; de la Rosa,
J.-J.G., "A experimental IEEE1588-BASED system for synchronized phasor
measurement in electric subestation," Industrial Electronics and Applications
(ICIEA), 2010 the 5th IEEE Conference on , vol., no., pp.942,947, 15-17 June 2010
46
22. Pallares-Lopez, V.; Moreno-Munoz, A.; Gonzalez-Redondo, M.; Real-Calvo, R.;
Garcia, I.M.; de Castro, A.G.; Perez, F.D.; de la Rosa, J.-J.G., "Deterministic Ethernet
synchronism with PTP-base system for synchrophasor in Smart Grid," Compatibility
and Power Electronics (CPE), 2011 7th International Conference-Workshop , vol.,
no., pp.22,27, 1-3 June 2011.
23. Amelot, J.; Fletcher, J.; Anand, D.; Vasseur, C.; Li-Baboud, Y.; Moyne, J., "An IEEE
1588 time synchronization testbed for assessing power distribution
requirements," Precision Clock Synchronization for Measurement Control and
Communication (ISPCS), 2010 International IEEE Symposium on , vol., no.,
pp.13,18, Sept. 27 2010-Oct. 1 2010.
24. Amelot, J.; Stenbakken, G., "Testing phasor measurement units using IEEE 1588
precision time protocol," Precision Electromagnetic Measurements (CPEM), 2012
Conference on, vol., no., pp.230,231, 1-6 July 2012.
25. Lixia, M.; Benigni, A.; Flammini, A.; Muscas, C.; Ponci, F.; Monti, A., "A software-
only PTP synchronization for power system state estimation with
PMUs," Instrumentation and Measurement Technology Conference (I2MTC), 2011
IEEE , vol., no., pp.1,6, 10-12 May 2011.
26. Deeths, David, Glenn Brunette, and Sun BluePrints. "Using NTP to Control and
Synchronize System Clocks-Part I: Introduction to NTP." Sun Microsystems, Inc
2001.
27. Mills, D .L., “Modelling and analysis of computer network clocks”, Electrical
Engineering Department Report 92-5-2, University of Delaware, May 1992, 29 pp.

47
28. Mills, D .L., “Network Time Protocol (Version 3) specification, implementation and
analysis.”, DARPA Network Working Group Report RFC -1305, University of
Delaware, March 1992, 113 pp .
29. Mills, David L. "Precision synchronization of computer network clocks." ACM
SIGCOMM Computer Communication Review 24.2, pp 28-43, 1994.
30. Mills, David L. "Internet time synchronization: the network time protocol."
Communications, IEEE Transactions on 39.10, pp 1482-1493, 1991.
31. Mills, David, Jim Martin, Jack Burbank, and William Kasch. "Network time protocol
version 4: Protocol and algorithms specification." IETF RFC5905, June 2010.
32. Lei Wang; Fernandez, J.; Burgett, J.; Conners, R.W.; Yilu Liu, "An evaluation of
network time protocol for clock synchronization in wide area measurements," Power
and Energy Society General Meeting - Conversion and Delivery of Electrical Energy
in the 21st Century, 2008 IEEE , vol., no., pp.1,5, 20-24 July 2008.
33. David L. Mills, “Gadget Box PPS Level Converter and CHU Modem”, [Online];
available at: http://doc.ntp.org/3-5.93e/gadget.html.
34. “SPECTRACOM NetClock Price List 3-1-9”, Spectracom website, [Online];
available at: https://www.google.com/url?q=http://www.cybercomminc.com/state-
contracts/Other_OEM_Price_Sheets/Spectracom/SPECTRACOM%2520NetClock%2
520Price%2520List%25203-1-
09.xls&sa=U&ei=QDZHU9znKcbbyQHM5oGYDA&ved=0CAUQFjAA&client=inte
rnal-uds-cse&usg=AFQjCNEionfHVvQXOSbyvEU7bTkgBBXCHw, 2013.
35. “lpc1768 price and stock”, findchips website, [Online]; available at:
http://www.findchips.com/search/lpc1768.
48
36. “Micropower Phase Lock Loop DIP-16”, Jameco Electronics website, [Online];
available at: http://www.jameco.com/1/1/194-cd4046-micropower-phase-locked-loop-
dip-16-4000-series.html
37. “Products for MSP430 Ultra-Low Power 16-bit MCUs”, Texas Instruments website,
[Online]; available at: http://www.ti.com/lsds/ti/microcontroller/16-
bit_msp430/products.page
38. “Embedded - FPGAs (Field Programmable Gate Array)”, Digi-Key Corporation
website, [Online]; available at: http://www.digikey.com/product-search/en/integrated-
circuits-ics/embedded-fpgas-field-programmable-gate-array/2556262?k=spartan
39. “Products for MSP430 Ultra-Low Power 16-bit MCUs”, Texas Instruments website,
[Online]; available at: http://www.ti.com/lsds/ti/microcontroller/16-
bit_msp430/products.page.
40. “Mechanical Dynamics, the Swing Equation, Units”, Iowa State University website,
[Online]; available at: http://home.eng.iastate.edu/~jdm/ee554/SwingEquation.pdf
41. David L. Mills, “Gadget Box PPS Level Converter and CHU Modem”, [Online];
available at: http://doc.ntp.org/3-5.93e/gadget.html
42. “74ls123 price and stock”, findchips website, [Online]; available at:
http://www.findchips.com/search/74ls123
43. “icl232 price and stock”, findchips website, [Online]; available at:
http://www.findchips.com/search/icl232
44. “Corsair 8GB (1x8GB) DDR3 1333MHz (PC3 10666) Laptop Memory
(CMSO8GX3M1A1333C9)”, Amazon website, [Online]; available at:
49
http://www.amazon.com/Corsair-1x8GB-Laptop-Memory-
CMSO8GX3M1A1333C9/dp/B005T63BEM
45. “Modem Protocols Bell 103”, idealo.co.uk website, [Online]; available at:
http://www.idealo.co.uk/cat/3253F461237/modems.html
46. “Shortwave receiver”, Amazon website, [Online]; available at:
http://www.amazon.com/gp/product/B004H9C4JK/ref=as_li_tf_tl?ie=UTF8&camp=
1789&creative=9325&creativeASIN=B004H9C4JK&linkCode=as2&tag=swlcom01
-20
47. “Texscan 5BC110/2.0KK Band Pass Filter(2KHz), SMA connectors”, Ebay website,
[Online]; available at: http://www.ebay.ca/itm/Texscan-5BC110-2-0KK-Band-Pass-
Filter-2KHz-SMA-connectors-/390403528377
48. Samui, Ankita, and S. R. Samantaray. "Assessment of ROCPAD relay for islanding
detection in distributed generation." Smart Grid, IEEE Transactions on 2.2 (2011):
391-398.
49. Lu-zhao, Li, Zhang Dao-nong, and Dong Yan-tao. "Time synchronization technology
for the smart substations." In Advanced Power System Automation and Protection
(APAP), 2011 International Conference on, vol. 3, pp. 2283-2285. IEEE, 2011.
50. Sebastian, M., O. Devaux, and O. Huet. "Description and benefits of a situation
awareness tool based on a distribution state estimator and adapted to smart grids."
In SmartGrids for Distribution, 2008. IET-CIRED. CIRED Seminar, pp. 1-4. IET,
2008..
51. Dobrogowski, A.; Jessa, M.; Kasznia, M.; Lange, K., "Generation of 1-pps timing
signal controlled by NTP," Frequency Control and the European Frequency and
50
Time Forum (FCS), 2011 Joint Conference of the IEEE International , vol., no.,
pp.1,5, 2-5 May 2011.
52. Malpani, Rohit, Zaheer Abbas, and KShanti Swarup. "High precision frequency
estimation using Internet-based phasor measurement unit." Power Systems, IEEE
Transactions on 25.2, pp. 607, 614, 2010.
53. Salunkhe, Kunal A., and A. M. Kulkarni. "A wide area synchronized frequency
measurement system using network time protocol." 16th National Power System
Conference, Hyderabad. 2010.
54. Sebastian, M., O. Devaux, and O. Huet. "Description and benefits of a situation
awareness tool based on a distribution state estimator and adapted to smart grids."
In SmartGrids for Distribution, 2008. IET-CIRED. CIRED Seminar, pp. 1-4. IET,
2008.
55. Zhu, Jun, David L. Lubkeman, and Adly A. Girgis. "Automated fault location and
diagnosis on electric power distribution feeders." Power Delivery, IEEE Transactions
on 12.2, pp. 801, 809, 1997.
56. Ren, J., S. S. Venkata, and E. Sortomme. "An Accurate Synchrophasor Based Fault
Location Method for Emerging Distribution Systems.", 2014.
57. Y. Liu, P. Ning, and M. K. Reiter, "False data injection attacks against state
estimation in electric power grids," ACM Trans. Information and System Security,
vol. 14, pp. 1-33, (2011).
58. Yang, Y.; McLaughlin, K.; Sezer, S.; Littler, T.; Pranggono, B.; Brogan, P.; Wang,
H.F., "Intrusion Detection System for network security in synchrophasor systems,"

51
Information and Communications Technologies (IETICT 2013), IET International
Conference on, vol., no., pp.246, 252, 27-29 April 2013.
59. M. D. Hadley, J. B. McBride, T. W. Edgar, L. R. O’Neil, and J. D. Johnson,
“Securing wide area measurement systems,” Pacific Northwest Natl. Lab., Tech. Rep.
PNNL-17116, (2007).