Embed Size (px)
Citation preview
Real-Time Intrusion Detection System Using Multi-
agent System
Wathiq Laftah Al-Yaseen, Zulaiha Ali Othman, and Mohd Zakree Ahmad Nazri
Abstract—The growth of network attacks has lengthened
the intrusion detection system’s (IDS) processing time to detect
these attacks. The demand for reducing the processing time has
increased when dealing with real time IDS. Several methods
were proposed, such as improving the algorithm, or improving
the IDS’s architectural design; which includes distributed and
parallel. However, this paper sought to present a Multi-agent
System solution (MAS-IDS) to enhance the performance of IDS
in order to reduce the analysis of the network’s traffic data
processing time when detecting attacks. Numerous works of
MAS improved the accuracy of IDS, however, only a few had
focused on enhancing the processing time of IDS. The number
of analysis agents that can be created in a system depends upon
the size of traffic data and the availability of logical processors
(cores) in the system, without affecting the performance of the
hosts with less targeted time. The conducted experiments
employed the dataset KDDCUP'99. The results illustrated that
MAS-IDS had reduced up to 81% of the processing time in the
analysis procedure when compared to traditional IDS with
maintaining the same accuracy approximately.
Index Terms—Distributed System, Intrusion Detection
System, Multi-agent System, Network Security, Parallel
Processing
I. INTRODUCTION
HE increase of malicious intrusions on computer
networks and information systems has raised the ratio of
risk and violation of computer security policies of
Confidentiality, Integrity and Availability [1, 2]. Intrusion
detection system (IDS) is one of the systems that strives to
detect attacks by analysing events as unauthorised use,
misuse and abuse of networks and computers [3]. Most
researches had focused on the accuracy of detection attacks,
however, the time required to detect these attacks is
currently in high demand due to the increase of network
traffic. Some network-based IDSs drop network packets
without processing due to the fact that these systems do not
have time to process these packets [4]. Consequently, IDS
must be able to detect attacks with less processing time in
order to become real-time IDS. Numerous works were
introduced concerning real-time IDS, such as those of Wang
et al. [5], which depended on the Principal Component
Analysis in the design of their systems. Zali et al. [6] used
the causal approach to propose their real-time IDS;
Sangkatsanee et al. [7] employed different machine learning
techniques with 12 essential features of KDD99 and proved
that the decision tree was the best; Boukerche et al. [8]
Manuscript received November 12, 2015; revised January 11, 2016.
Wathiq Laftah Al-Yaseen, Zulaiha Ali Othman and Mohd Zakree
Ahmad Nazri are with the Data Mining and Optimization Research Group
(DMO), Centre for Artificial Intelligence Technology (CAIT), School of
Computer Science, Faculty of Information Science and Technology,
Universiti Kebangsaan Malaysia (UKM), 43600 Bandar Baru Bangi,
Malaysia. email: [email protected], [email protected],
applied artificial immune and mobile agents to construct
their model; and Amini et al. [9] utilised unsupervised
neural nets to detect known and new attacks in the network
traffic.
The IDS was defined as an anomaly detection system or
misuse detection system. The misuse detection system
identifies known attacks through the use of attack signatures
that were previously saved in the database of the system [9].
The major problem of the misuse system is that every attack
should have a signature entry in the database in order to
compare with the arrived packets; thus, this process
consumes a long time for it to be achieved. The anomaly
detection system identifies the deviation of normal
behaviour in the network and users, therefore, this type of
system must capture data from the network during a period
of time and analyse it. In addition, the IDS can operate in 2
modes: off-line detection and on-line detection [10]. IDS
off-line is the decomposition of periodical information in
network and system logs to identify suspicious activities and
intrusions. IDS on-line captures the arrived traffic data from
the network to process and identify malicious activities [7].
This paper focused on the on-line IDS which analyses the
captured data packets within a very short period of time in
order to not provide any chance of attacks that may damage
the system and deadline [11].
Distributed IDS is more efficient in solving the problems
of centralised IDS because it utilises various sources of
information with greater accuracy in order to reach the goal
of detection attacks [10]. Additionally, distributed systems
have the ability to process the data within less time than
what is normally required by centralised systems due to their
ability to run tasks in parallel. One of these systems is the
Multi-agent System (MAS) which is a type of Artificial
Intelligence System (AIS) that has autonomous and
cooperating agents distributed throughout its system
environment. They carry a number of characteristics such as
situated-ness, autonomy and flexibility [12].
In this paper, it was proposed using MAS to improve the
time of IDS by addressing the attacks with a short
processing time, and establishing MAS as a real-time
system. This paper aimed to construct an anomaly detection
system based on agents to analyse the network data traffic in
parallel so as to reduce the processing time. A few works
regarding MAS which handled attacks and were also
interested in the processing time were [8, 13, 14]. The
method in this research presented a system to accelerate and
facilitate the process of analysing data traffic by using
agents working in parallel, and distributed throughout
various host systems. Moreover, to achieve the goal of
parallel processing in the data analysis, the system had
coordinator agents which divided the captured network data
into subsets and then sent the data subsets to analysis agents.
This, in turn, led to the determining of the number of hosts
T
IAENG International Journal of Computer Science, 43:1, IJCS_43_1_10
(Advance online publication: 29 February 2016)
______________________________________________________________________________________
and agents required to accomplish an IDS, with less time
consuming and without affecting the performance of the
system. The JADE platform was employed in the
implementation of the proposed system, as well as, in the
use of the data mining clustering technique to classify data
in clusters of either normal or attack. To examine the system
performance, the KDD’99 dataset was used. The experiment
results illustrated that the time spent in the process of testing
data by MAS-IDS was better than traditional IDS.
The remainder of this paper was organised as follows:
Section 2 discussed related works in the processing time of
IDSs with the different methods used; Section 3 described
the main concepts of Multi-agent System based intrusion
detection systems; Section 4 explained the architecture of
MAS-IDS and the role of each agent, along with the
algorithms applied in the proposed work; Section 5
demonstrated the dataset used and the experimental results;
and Section 6 displayed the conclusions and portrayed
future works.
II. RELATED WORK
Nowadays, with high-speed infrastructure network and
large volumes of data traffic, traditional IDS are not capable
of effectively encountering these challenges; to monitor and
analyse the entire traffic network with minimum time
consumption. To promote the performance of network IDSs
and reduce the processing time of analysing traffic, a few
studies had presented network IDSs that focus on parallel
techniques as an alternative. These studies used several
nodes (hosts) to process the traffic of network parallelism,
so that each node in the system was responsible for dealing
with 1 part of the traffic network. These studies were
classified into 2 categories, in accordance to the definition
from Culler and Singh [15], as data parallelism [16, 17] and
function parallelism [18, 19].
Data parallelism divided the payload of each packet into n
portions, so that each node has 1/n of the original packet
(load balancing). Divided Data Parallel (DDP) is an
approach for signature matching IDS proposed by Kopek et
al. (2007) which divided the data packet as fragments across
an array of processors. This approach worked with the data
parallel principle of having each processor with the same
rules as the signatures. However, it used match-bit to reduce
the problem of an overlap between fragments; whereby,
when the overlap occurred, the fragment was duplicated
between processors. Vasiliadis et al. (2011) presented
MIDeA using hardware system resources such as multi-
queue NICs, multiple CPUs and multiple GPUs to process
and analyse the network traffic. This method employed the
Receive-Side Scaling (RSS) technology to split network
traffic received from the NIC card to N slices; N was the
number of cores available within the system. Therefore, the
slices were processed by SNORT and assigned with each
core, then sent to the memory of GPUs to further address
and show the results. Kruegel et al. [20] proposed a
partitioning approach to dividing the traffic network into
subsets of manageable size. This approach used a slicing
mechanism in the dividing process; thus, each slice
contained all the evidence necessary to detect a specific
attack by the node without the need to interact with other
nodes in the system. In addition, Intel Corporation (2006)
presented a paper, “Supra-linear Packet Processing
Performance with Intel Multi-core Processors”; regarding
the benefit of multiple processing cores to achieve good
performance results of IDS. This paper utilised the
programming concepts of pipelining and flow-pinning with
the SNORT application to divide the dataflow of SNORT
into a number of packets and assign them to multi-cores of
execution units in the system. The results illustrated that the
use of multi-cores were better than the use of a single core
in terms of cache hit rate in high network traffic. Function parallelism was used, in particular, with
signature detection systems to distribute the rules across
nodes. Thus, each packet was duplicated to each node for
searching and matching, with a few rules dedicated to this
node. Shiri' et al.’s (2011) presented method relied on NLFP
(node level function parallelism) which was introduced by
Wheeler (2003) in the design signature detection
architecture. This method dispersed all the rules across the
nodes and then used a packet duplicator, or traffic splitter, to
send each traffic packet to the appropriate node; depending
on the source and destination ports. The results had shown
that the performance of this method, in terms of processing
time, when applied to several SNORTs distributed on the
nodes of the system was better than the processing time
implemented on the same packets with centralised SNORT.
Sallay et al. (2009) presented a method of splitting the
incoming traffic and forwarding to the sensors of IDS. This
depended on the switching table (protocols) which the FTP
packet had sent to the sensor that was responsible for FTP
protocols and so on. At the same time, each sensor was only
running the rules that were set by SNORT and dedicated to
that sensor, such as the FTP rules set. The control centre
component aggregated and analysed the various alarms from
the sensors to detect attacks.
From previous works, it was noted that function
parallelism was used to shorten the delay in the processing
of the packets; however, it did not reduce the delay of
signature matching in each node due to the use of multi-
pattern search algorithms. Therefore, distributing the rules
across nodes only lessened the processing delay. In contrast,
data parallelism reduced the inspection time in each node
due to the use of bounded amounts of data; thus, decreasing
the overall processing time of the packets. All the
approaches presented with data parallelism were aimed at
constructing a misuse detection system, without any
mention of approaching aims to build an anomaly detection
system; in which such approaches depend upon matching
the attack signatures with incoming network traffic. In
addition, all previous researches interested with IDSs that
employed parallelism in their work to reduce the time
required for processing had applied various methods to
construct the parallel system; but so far, no research has
utilised the Multi-agent System as a distribution system to
create parallelism for reducing the time required for
processing data packets in IDS.
A state of the art, the Multi-agent System is used to tackle
and solve the problems suffered by IDSs. One of these
problems is the centralised processing of IDS which leads to
a single point of failure. Numerous studies where presented
to tackle this problem, such as [10, 21, 22]. An advantage of
using agents with IDS is the sharing of information
IAENG International Journal of Computer Science, 43:1, IJCS_43_1_10
(Advance online publication: 29 February 2016)
______________________________________________________________________________________
pertaining to attacks upon agents deployed in the system
environment; this was further demonstrated in numerous
works such as [10, 23]. Another benefit provided by Multi-
agent Systems for IDSs is the security of IDS through the
exchange of messages between entities by using agents such
as [24].
III. MULTI-AGENT SYSTEM BASED INTRUSION DETECTION
SYSTEM
Traditionally, an IDS works by analysing the data
collected from various sources such as network traffic,
system logs and user logs to identify whether the data
contains any malicious or suspicious activities [1]. These
data are gathered through the spread of a number of tools in
the system environment, such as sniffers. These tools are
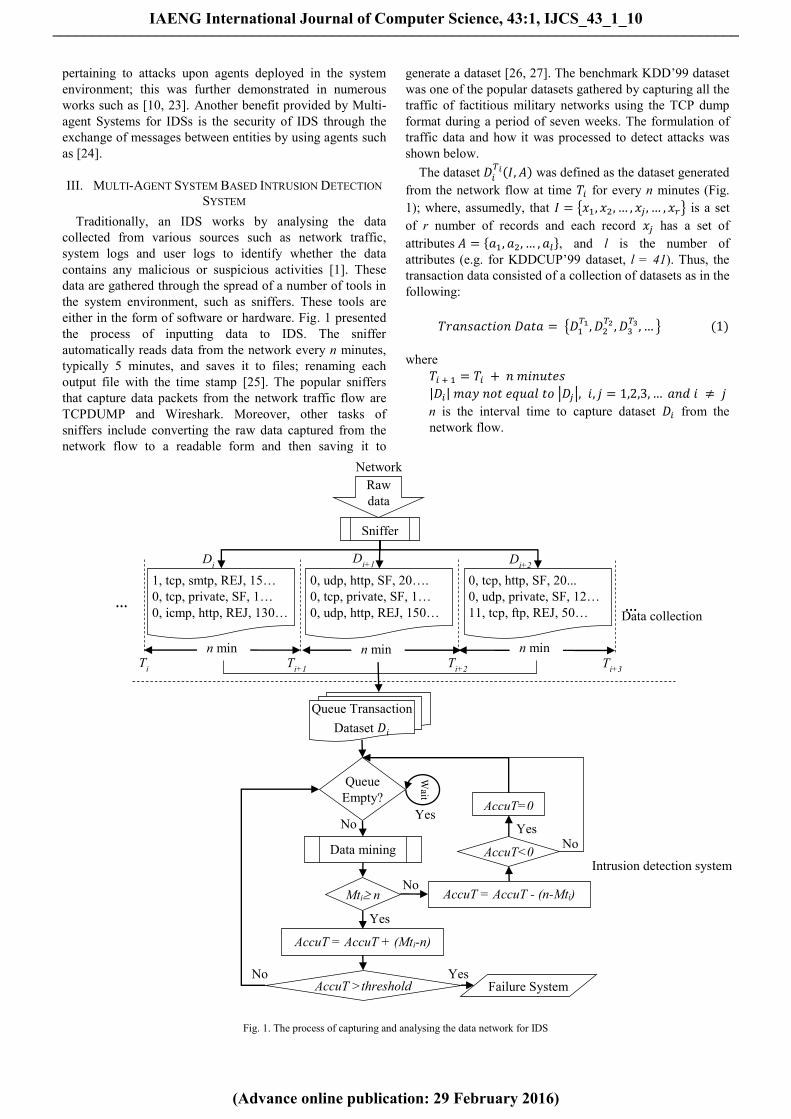
either in the form of software or hardware. Fig. 1 presented
the process of inputting data to IDS. The sniffer
automatically reads data from the network every n minutes,
typically 5 minutes, and saves it to files; renaming each
output file with the time stamp [25]. The popular sniffers
that capture data packets from the network traffic flow are
TCPDUMP and Wireshark. Moreover, other tasks of
sniffers include converting the raw data captured from the
network flow to a readable form and then saving it to
generate a dataset [26, 27]. The benchmark KDD’99 dataset
was one of the popular datasets gathered by capturing all the
traffic of factitious military networks using the TCP dump
format during a period of seven weeks. The formulation of
traffic data and how it was processed to detect attacks was
shown below.
The dataset 𝐷𝑖𝑇𝑖(𝐼, 𝐴) was defined as the dataset generated
from the network flow at time 𝑇𝑖 for every n minutes (Fig.
1); where, assumedly, that 𝐼 = {𝑥1, 𝑥2, … , 𝑥𝑗 , … , 𝑥𝑟} is a set
of r number of records and each record 𝑥𝑗 has a set of
attributes 𝐴 = {𝑎1, 𝑎2, … , 𝑎𝑙}, and l is the number of
attributes (e.g. for KDDCUP’99 dataset, l = 41). Thus, the
transaction data consisted of a collection of datasets as in the
following:
𝑇𝑟𝑎𝑛𝑠𝑎𝑐𝑡𝑖𝑜𝑛 𝐷𝑎𝑡𝑎 = {𝐷1𝑇1 , 𝐷2
𝑇2 , 𝐷3𝑇3 , … } (1)
where
𝑇𝑖 + 1 = 𝑇𝑖 + 𝑛 𝑚𝑖𝑛𝑢𝑡𝑒𝑠
|𝐷𝑖| 𝑚𝑎𝑦 𝑛𝑜𝑡 𝑒𝑞𝑢𝑎𝑙 𝑡𝑜 |𝐷𝑗|, 𝑖, 𝑗 = 1,2,3, … 𝑎𝑛𝑑 𝑖 ≠ 𝑗 n is the interval time to capture dataset 𝐷𝑖 from the
network flow.
Fig. 1. The process of capturing and analysing the data network for IDS
Raw
data
Network
Sniffer
1, tcp, smtp, REJ, 15… 0, tcp, private, SF, 1… 0, icmp, http, REJ, 130…
0, udp, http, SF, 20…. 0, tcp, private, SF, 1… 0, udp, http, REJ, 150…
0, tcp, http, SF, 20... 0, udp, private, SF, 12… 11, tcp, ftp, REJ, 50…
Ti T
i+1 T
i+2 T
i+3
n min n min n min
Queue Transaction
Dataset 𝐷𝑖
Di D
i+1 D
i+2
Queue
Empty?
Data mining
Mti n
AccuT = AccuT + (Mti-n)
AccuT >threshold
AccuT = AccuT - (n-Mti)
AccuT<0
AccuT=0
Failure System
Wait
Yes Yes
Yes
Yes No
No
No
No
Data collection
Intrusion detection system
… …
IAENG International Journal of Computer Science, 43:1, IJCS_43_1_10
(Advance online publication: 29 February 2016)
______________________________________________________________________________________
The datasets from formula (1) were entered into the next
phase for analysis and for determining whether these data
contained malicious or suspicious activities by employing
one of the data mining techniques. Each one of these
datasets may be too large, especially in the present day, in
which increasing size and speed of data flow in the network
may lead to the construction of large datasets; therefore, the
data analysis process by IDS will be expensive and difficult.
This is especially true if the analysis process is
centralisation, which would require a long time in the
completion of the task and may result in system failure [28].
Each dataset 𝐷𝑖 may need 𝑀𝑡𝑖 minutes from the data mining
technique to complete its process of analysis. When the
required time 𝑀𝑡𝑖 to analyse a dataset 𝐷𝑖𝑇𝑖 is greater than the
required time n to capture the next dataset 𝐷𝑖+1
𝑇𝑖+1 , then the
process will lead to the accumulation of aggregates of data
that will require more time (𝐴𝑐𝑐𝑢𝑇 minutes) to analyse. This
may then exceed the required time (Threshold) of attacks to
damage the system.
However, if the required time 𝑀𝑡𝑖 to analyse the dataset is
less than n, then the analysis process by data mining would
be positive towards improving the analysis time; whereby,
the accumulated time from analysing previous datasets will
be reduced and perhaps equal to zero.
𝐴𝑐𝑐𝑢𝑇𝑖 + 1 = {𝐴𝑐𝑐𝑢𝑇𝑖 + (𝑀𝑡𝑖 − 𝑛) 𝑖𝑓 𝑀𝑡𝑖 ≥ 𝑛
𝐴𝑐𝑐𝑢𝑇𝑖 − (𝑛 − 𝑀𝑡𝑖) 𝑖𝑓 𝑀𝑡𝑖 < 𝑛 (2)
subject to
𝐴𝑐𝑐𝑢𝑇𝑖 + 1 = 0, 𝑖𝑓 𝐴𝑐𝑐𝑢𝑇𝑖 + 1 < 0
AccuT: is the accumulation time of the analysis
process by data mining.
𝑀𝑡𝑖: is the required time from data mining to
analyse 𝐷𝑖.
In order to address the above problem, a method was
proposed to reduce the processing time of the data mining
technique 𝑀𝑡𝑖 by dividing the dataset 𝐷𝑖(𝐼, 𝐴) into m
number of data subsets formula (3) and addressing each data
subset 𝑆𝑗(𝐼, 𝐴) separately; then, the re-unification of the
results that were obtained from the analysis of each data
subset would be to construct the final results of 𝐷𝑖 . The
value of m will rely on some factors available in the system;
for example, in this study, the value of m depended on the
available resources of the system, such as logical processors
(cores).
∀𝐷𝑖 = {𝑆1, 𝑆2, … , 𝑆𝑗 , … , 𝑆𝑚}, (3)
𝑚 < 𝑁𝑜𝑛_𝐵𝑢𝑠𝑦 𝐿𝑜𝑔𝑖𝑐𝑎𝑙 𝑃𝑟𝑜𝑐𝑒𝑠𝑠𝑜𝑟𝑠 𝑜𝑓 𝑆𝑦𝑠𝑡𝑒𝑚
The size of each data subset 𝑆𝑗(𝐼, 𝐴) is:
|𝑆𝑗| = {
|𝐷𝑖|
𝑚 , 𝑗 = 1,2, … , 𝑚 − 1
|𝐷𝑖|
𝑚 + |𝐷𝑖| 𝑚𝑜𝑑 𝑚, 𝑗 = 𝑚
(4)
The set of records for each 𝑆𝑗 were assigned from 𝐷𝑖 as:
𝑆𝑗 = {𝐼|𝑆𝑗|∗(𝑗−1)+1, 𝐼|𝑆𝑗|∗(𝑗−1)+2, … , 𝐼|𝑆𝑗|∗(𝑗−1)+|𝑆𝑗|}, (5)
𝑗 = 1,2, … , 𝑚 − 1
𝑆𝑚 =
{𝐼|𝑆𝑚−1|∗(𝑚−1)+1, 𝐼|𝑆𝑚−1|∗(𝑚−1)+2, … , 𝐼|𝑆𝑚−1|∗(𝑚−1)+|𝑆𝑚|} (6)
The data subsets formulas (5) and (6) emerged from the
dividing process that was analysed in parallel through the
use of the distributed system. In this paper, a Multi-agent
System environment was employed as the distributing
system to create a set of agents so as to analyse the data
subsets. For each subset, an agent was created to be
responsible for the analysis process of this subset. This
process is called allocate function, and the procedure was as
follows: 𝐴𝑙𝑙𝑜𝑐𝑎𝑡𝑒 (𝑆𝑗 , 𝐴𝑔𝑒𝑛𝑡𝑗) was responsible for creating
𝐴𝑔𝑒𝑛𝑡𝑗 to analyse the data subset 𝑆𝑗 and return the result
𝑅𝑗 to the cooperative agent. It was concluded that the
number of agents required to analyse the data subsets was
equal to the number of data subsets (|𝐴𝑔𝑒𝑛𝑡𝑠| = |𝑆|).
∀𝑆𝑗 , ∃𝐴𝑔𝑒𝑛𝑡𝑗: 𝑅𝑗 ← 𝐴𝑙𝑙𝑜𝑐𝑎𝑡𝑒 (𝑆𝑗 , 𝐴𝑔𝑒𝑛𝑡𝑗), (7)
𝑗 = 1,2, … , 𝑚 (7)
where 𝑅𝑗 represents the result of analysis 𝑆𝑗 by 𝐴𝑔𝑒𝑛𝑡𝑗
However, the MAS-IDS system environment has a set of
hosts (computers) which are responsible for creating agents.
𝑀𝐴𝑆 − 𝐼𝐷𝑆 𝑆𝑦𝑠𝑡𝑒𝑚 𝐸𝑛𝑣𝑖𝑟𝑜𝑛𝑚𝑒𝑛𝑡 =
{𝐻𝑜𝑠𝑡1, 𝐻𝑜𝑠𝑡2, … , 𝐻𝑜𝑠𝑡𝑝} (8)
Each host has a number of logical processors (LPs), or
(Cores), which play an important role in the proposed
system; whereby, each logical processor has the ability to
implement a single agent without affecting the rest of the
host activities.
𝐻𝑜𝑠𝑡𝑖 = {𝐿𝑃1, 𝐿𝑃2 , … , 𝐿𝑃𝑞𝑖}, 𝑖 = 1,2, … , 𝑝, 𝑞𝑖 ≥ 1 (9)
Therefore, the administrator of the system must have all
the information regarding the number of hosts allocated
within the system environment and the number of logical
processors available within each host; as well as, the total
number of logical processors available in the whole system.
𝑇𝑜𝑡𝑎𝑙 𝐿𝑃𝑠 = ∑ 𝑞𝑖𝑝𝑖=1 (10)
where 𝑞𝑖 is the number of logical processors available
in 𝐻𝑜𝑠𝑡𝑖.
In addition, the administrator of the system must have
information regarding the number of LPs that are currently
busy with other activities in each host. After the collection
of all these information on the system environment, the
system can implement each agent, 𝐴𝑔𝑒𝑛𝑡𝑗, to analyse 1 data
subset 𝑆𝑗 with 1 logical processor of the host environment.
Therefore, a new function was defined to implement the
agent with the logical processor; the name of this function
was 𝐼𝑚𝑝𝑙𝑒𝑚𝑒𝑛𝑡 (𝐴𝑔𝑒𝑛𝑡𝑗, 𝐿𝑃𝑢).
∀𝐴𝑙𝑙𝑜𝑐𝑎𝑡𝑒(𝑆𝑗 , 𝐴𝑔𝑒𝑛𝑡𝑗), ∃ 𝐿𝑃𝑢 ∈
𝐻𝑜𝑠𝑡𝑖 : 𝐼𝑚𝑝𝑙𝑒𝑚𝑒𝑛𝑡(𝐴𝑔𝑒𝑛𝑡𝑗, 𝐿𝑃𝑢), (11)
1 ≤ 𝑗 ≤ 𝑚, 1 ≤ 𝑖 ≤ 𝑝, 1 ≤ 𝑢 ≤ 𝑞𝑖
IAENG International Journal of Computer Science, 43:1, IJCS_43_1_10
(Advance online publication: 29 February 2016)
______________________________________________________________________________________
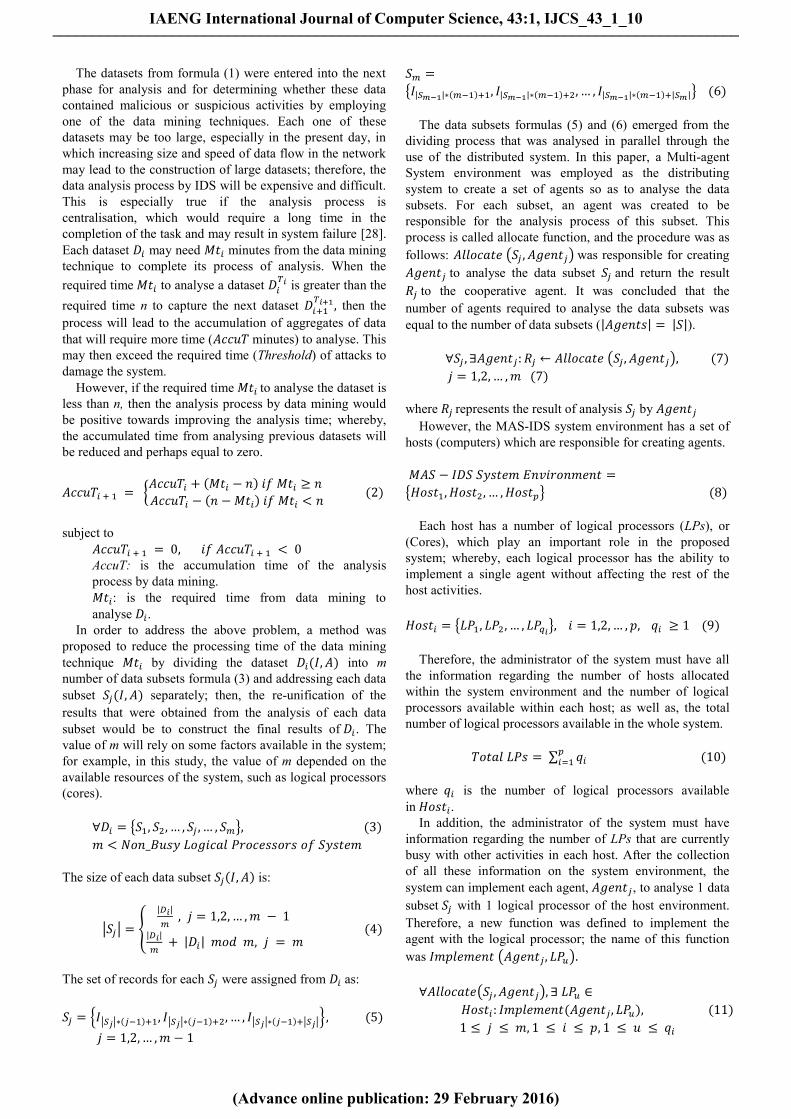
For example, the details of the system composed of hosts
are shown in Table 1. However, the dataset was divided to a
set of data subsets (m = 10) ready to be analysed by the
system. Therefore, 10 agents need to be created to analyse
these data subsets. Thus, 10 logical processors are required
to implement these agents.
TABLE I
DETAILS OF HOSTS
Host Total of
LPs
No of LPs
(busy)
No of LPs
(non-busy)
Host1 6 2 4
Host2 4 0 4
Host3 8 3 5
Host4 4 3 1
Host5 8 2 6
Total 30 10 20
From this example, the proposed system required a plan
for choosing the appropriate hosts to create agents. This plan
was based on the availability of logical processors that were
non-busy in the hosts. As a result, the system may employ 1
of these 2 ideas to create agents in the hosts. The first idea
involved creating agents by equally distributing them on the
hosts as much as possible. So the agents, for
example {𝐴𝑔𝑒𝑛𝑡1, 𝐴𝑔𝑒𝑛𝑡2, … , 𝐴𝑔𝑒𝑛𝑡10}, will be distributed
on hosts {𝐻𝑜𝑠𝑡1, 𝐻𝑜𝑠𝑡2, 𝐻𝑜𝑠𝑡3, 𝐻𝑜𝑠𝑡4, 𝐻𝑜𝑠𝑡5}
as {3, 2,2,1,2}, respectively. It was noted from this
distribution that the creation of 1 agent was only for 𝐻𝑜𝑠𝑡4
because 𝐻𝑜𝑠𝑡4 was busy with the implementation of other
activities which used (3/4) of its logical processors;
therefore, the proposed system created only 1 agent
for 𝐻𝑜𝑠𝑡4. On the other hand, this distribution had other
disadvantages in terms of costs in the consumption of
system resources and communication processes. It was
noted that 𝐻𝑜𝑠𝑡1and 𝐻𝑜𝑠𝑡4 were consuming CPU and
memory through the implementation of agents, as well as,
for the rest of the activities in which they used (5/6) and
(4/4) of their logical processors, respectively. In addition,
the system made numerous communications to create agents
in the host system. The second idea was to create agents
with hosts that had the largest number of non-busy logical
processors. 𝐻𝑜𝑠𝑡5 and 𝐻𝑜𝑠𝑡3 were chosen, so the agents
{𝐴𝑔𝑒𝑛𝑡1, 𝐴𝑔𝑒𝑛𝑡2, … , 𝐴𝑔𝑒𝑛𝑡10} were distributed on
{𝐻𝑜𝑠𝑡5, 𝐻𝑜𝑠𝑡3} as {6, 4} or {5, 5}. The disadvantage of
communication did not exist with this idea, but the
disadvantage of system resources was still present through
the use of all the logical processors of 𝐻𝑜𝑠𝑡5 or 𝐻𝑜𝑠𝑡3. To
avoid the disadvantages of the above 2 ideas, a plan was
proposed for creating agents in hosts by taking advantage of
the mentioned concepts. At first, the hosts were arranged in
descending order according to the number of non-busy
logical processors; then, the created agents were distributed
on the hosts where (if necessary) in each host, the system
created a number of agents that was half the number of non-
busy logical processors of that host.
𝐴𝑔𝑒𝑛𝑡𝑠(𝐻𝑜𝑠𝑡𝑖) = ⌈𝑞𝑖 − 𝐵𝑢𝑠𝑦 𝐿𝑃(𝐻𝑜𝑠𝑡𝑖)
2⌉ , 𝑖 = 1,2, … , 𝑝 (12)
subject to
𝑚 = ∑ 𝐴𝑔𝑒𝑛𝑡𝑠(𝐻𝑜𝑠𝑡𝑖)𝑝𝑖=1
where
𝐴𝑔𝑒𝑛𝑡𝑠(𝐻𝑜𝑠𝑡𝑖): The number of agents that can be
created with 𝐻𝑜𝑠𝑡𝑖 . 𝐵𝑢𝑠𝑦 𝐿𝑃(𝐻𝑜𝑠𝑡𝑖): The number of logical processors
have busy now with other activities in 𝐻𝑜𝑠𝑡𝑖.
Depending on this idea, the creation of agents for the
example above {𝐴𝑔𝑒𝑛𝑡1, 𝐴𝑔𝑒𝑛𝑡2, … , 𝐴𝑔𝑒𝑛𝑡10} will be distributed on hosts {𝐻𝑜𝑠𝑡5, 𝐻𝑜𝑠𝑡3, 𝐻𝑜𝑠𝑡1, 𝐻𝑜𝑠𝑡2} as {3, 3,
2, 2}, respectively. Thus, this idea had reduced the
consumption of system resources, as well as, the
communication processes between agents.
To analyse the data subsets in each agent, data mining
clustering as K-means algorithm was used to achieve this
task. Basically, K-means algorithm depends on the method
to choose the initial centres in order to obtain good results.
Here, it was sufficient to use the random method of selecting
the initial centres of clusters.
𝐼𝑛𝑖𝑡𝑖𝑎𝑙 𝐶𝑒𝑛𝑡𝑒𝑟𝑠 = {𝐶1, 𝐶2, … , 𝐶𝑘} (13)
𝐶𝑖 = 𝑅𝑎𝑛𝑑𝑜𝑚 𝑥, 1 ≤ 𝑥 ≤ |𝑆𝑗| 𝑎𝑛𝑑 𝑥 ∉ {𝐶1, 𝐶2, … , 𝐶𝑖−1},
𝑖 = 1,2, … , 𝑘
where k is the desired number of clusters with K-means.
Next, the method of Portnoy [29] was applied to label the
clusters, either as normal clusters or attack clusters. The
normal clusters were the maximum cluster size and the
others were attack clusters.
𝑁𝑜𝑟𝑚𝑎𝑙(𝑅𝑗) =
𝑀𝑎𝑥𝑠𝑖𝑧𝑒{𝐶𝑙𝑢𝑠𝑡𝑒𝑟1, 𝐶𝑙𝑢𝑠𝑡𝑒𝑟2, … , 𝐶𝑙𝑢𝑠𝑡𝑒𝑟𝑘} (14)
𝐴𝑡𝑡𝑎𝑐𝑘𝑠(𝑅𝑗) = ⋃ 𝐶𝑙𝑢𝑠𝑡𝑒𝑟𝑖 − 𝑁𝑜𝑟𝑚𝑎𝑙 (𝑅𝑗)𝑘𝑖=1 (15)
After each agent had completed the analyse of the data
subset that was sent to it, each agent returned the results to
the cooperative agent that had combined the results from all
the analysis agents so as to compute the overall performance
of the analysis from the original dataset 𝐷𝑖 .
𝑁𝑜𝑟𝑚𝑎𝑙(𝐷𝑖) = ∑ 𝑁𝑜𝑟𝑚𝑎𝑙(𝑅𝑗) (16)𝑚𝑗=1
𝐴𝑡𝑡𝑎𝑐𝑘𝑠(𝐷𝑖) = ∑ 𝐴𝑡𝑡𝑎𝑐𝑘𝑠(𝑅𝑗) (17)𝑚𝑗=1
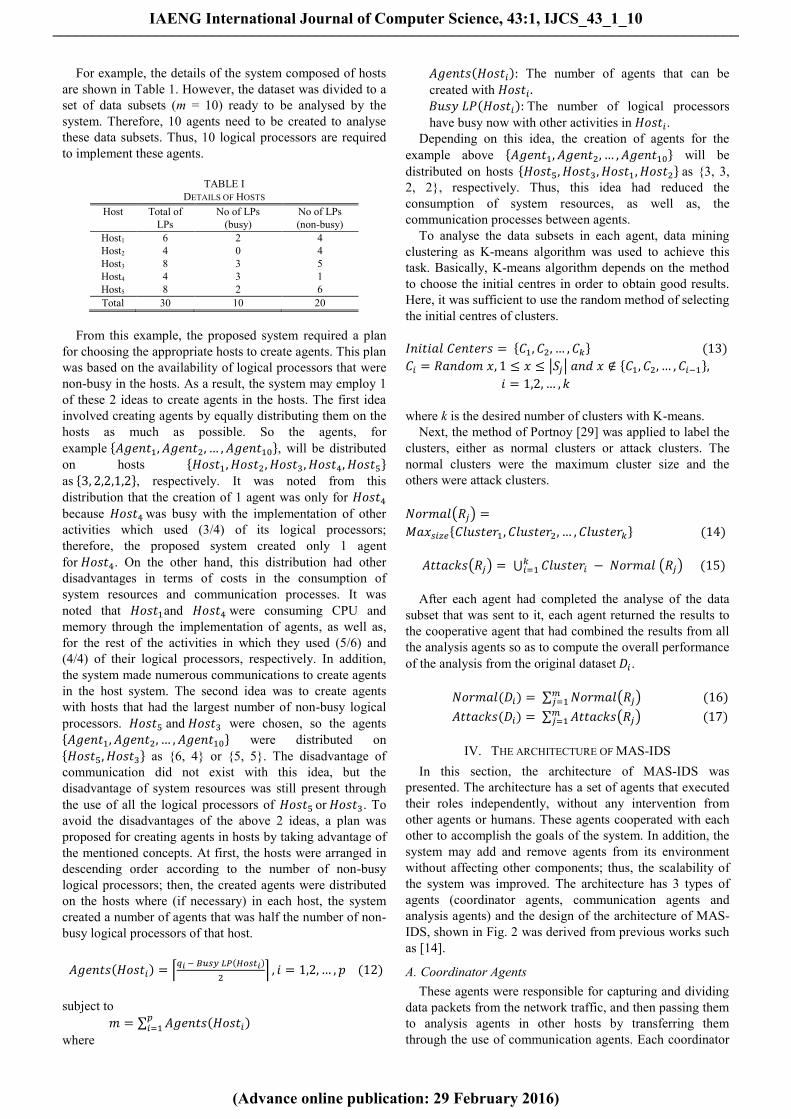
IV. THE ARCHITECTURE OF MAS-IDS
In this section, the architecture of MAS-IDS was
presented. The architecture has a set of agents that executed
their roles independently, without any intervention from
other agents or humans. These agents cooperated with each
other to accomplish the goals of the system. In addition, the
system may add and remove agents from its environment
without affecting other components; thus, the scalability of
the system was improved. The architecture has 3 types of
agents (coordinator agents, communication agents and
analysis agents) and the design of the architecture of MAS-
IDS, shown in Fig. 2 was derived from previous works such
as [14].
A. Coordinator Agents
These agents were responsible for capturing and dividing
data packets from the network traffic, and then passing them
to analysis agents in other hosts by transferring them
through the use of communication agents. Each coordinator
IAENG International Journal of Computer Science, 43:1, IJCS_43_1_10
(Advance online publication: 29 February 2016)
______________________________________________________________________________________
agent gathered the traffic data network as the first step and
then divided the data into a number of data subsets. The
number depended on the size of the received data and on the
number of analysis agents that were created by other hosts.
After completing the analysis task, the coordinator agents
began gathering the results of the analysis agents to present
the final result of the intrusion detection process. The
number of agents depended on the number of cores (logical
processors) available within the system hosts; therefore, the
size of each subset was computed from the formula (4). For
example, if the size of the data required for analysis was
1000 records and the number of hosts available on the
system were 2, in which the first host can create 6 agents
and the second host can create 4 agents, then the number of
subsets of data will be 10 with the size of each subset as 100
records.
Fig. 2. Architecture of MAS-IDS
Therefore, each host has the ability to create a limited
number of agents since the implementation of these agents
was in parallelism, so each agent will be running on 1
logical processor of the host; for example, if the host has a
CPU consisting of 4 logical processors then the number of
agents that can run on this host would only be 4 agents.
When an attempt to create more agents than the number of
logical processors was made, the processing time was close
to the processing time of agents equal to the number of
logical processors. Thus, each coordinator agent must have
information regarding the CPU and memory of each host in
the system environment.
The first role carried out by coordinator agents was the
pre-processing of data by converting the symbolic features
of data to numerical features, known as Role 1. Role 2 for
coordinator agents was to split the data into data subsets
after pre-processing and then send them to analysis agents
through the use of Role 3. The steps of coordinator agents’
roles were shown in the following:
Role 1. Pre-processing
Input: Raw data
Output: Data with all features are numerical
For each symbolic featurei in data
No_Vlaue_Featurei ← Compute the number of values
possessed by featurei;
End for;
For each recordi in data packet
If featurej in recordi is symbolic
Featurej ← assign integer value between 1 and
No_Value_Featurej;
End if;
End for;
Role 2. Split dataset
Input: Testing Dataset
Output: Number of data subsets
Subset_Size ← Size of dataset/No_of_Host;
For i ← 1 to No_of_Host
Data_Subseti ← Dataset.subList((i-1) * Subset_Size, (i
* Subset_Size) – 1);
End for;
Role 3. Send data and receive results from hosts
Input: Number of data subset
Output: Response time, Performance
For i ← 1 to No_of_Host
Create new communication agent on the hosti;
Send Data_Subseti by communication agent to hosti;
Add behaviour CyclicBehaviour;
Wait until receive results from hosti;
End for;
Compute the final results that collection from all hosts;
B. Communication Agents
The role of these agents was to transfer the data from host
to host, where they transferred data from coordinator agents
to analysis agents, and then transferred the results from
analysis agents to coordinator agents. Communication
agents were created by coordinator agents in the same host
as coordinator agents and then moved to another host where
the analysis agents were created. This step was very
important in this work, which depended on the capabilities
provided by MAS or, specifically, the capabilities of JADE
in the sending of data; therefore, the work of these agents
was demonstrated in detail. Coordinator agents required the
controller address of the analysis agents that were to be
created in the other host so as to send the data to the analysis
agents. The agent controller was a memory address, which
cannot be sent to coordinator agents through the usual
method of sending messages between agents; furthermore,
the agent controller was always changing with each run.
Accordingly, another method was utilised to transfer data
through the creation of a new agent in the same host as the
analysis agents. The new agent was created by the
coordinator agents, and then the data was passed from
coordinator agents to the new agent since the coordinator
agents now have the controller of the new agent. Lastly,
each analysis agent in the control host was receiving data
from the new agent by moving data from the main container
to the same container as the new agent in order to collect the
data and then return it to the main container for processing.
The role of communication agents was further demonstrated
as follows:
Send data and receive results by communication agents
Input: Data subset
Output: Return results from analysis agents to coordinator
IAENG International Journal of Computer Science, 43:1, IJCS_43_1_10
(Advance online publication: 29 February 2016)
______________________________________________________________________________________
agents
newSubset_Size ← Size of Data Subset/No_of_Agents;
For i ← 1 to No_of_Agents
newData_Subseti ← Data_SubSet.subList((i-
1)*newSubset_Size,
(i*newSubset_Size)–1)
End for;
For i ← 1 to No_of_Agents
Create new analysis agenti;
Send newData_Subseti to analysis agenti;
Add behaviour CyclicBehaviour;
Wait until receive results from Analysis Agenti;
Kill Agenti;
End for;
Compute the final results from all analysis agents;
C. Analysis Agents
These types of agents used data mining, or machine
learning techniques, to analyse data and detect attacks.
Analysis agents were created in other hosts of coordinator
agents to analyse the data that had been sent to it; and once
it had completed analysing the data, the analysis agents will
then be deleted from the system. Each host in the system
environment can create a limited number of analysis agents
because every host has a limited number of cores, and each
core can implement only 1 agent at a time in order to
analyse the data packets in parallel. After the completion of
the analysis process, the analysis agents will return the
results to the coordinator agents so that they may integrate
the results received from all analysis agents in order to
obtain the final result. Simple K-means algorithm was
employed with the analysis agents to achieve the role of
analysing data, as shown in the following:
Simple K-means algorithm
Input: Dataset, the number of clusters k
Output: Clusters
For each Clusteri
Centeri ← Choose Record Randomly (Size of
Dataset);
End for;
Do
For each Recordi
For each Clusterj
If Min distance (Recordi, Centerj)
Clusterj ← Recordi;
End if;
End for;
For each Clusteri
Centeri ← Avg (Clusteri);
End for;
End for;
Until (Centeri-1 = Centeri);
V. EXPERIMENTAL SETUP
In this section, the experimental results and performance
evaluation of the MAS-IDS approach were presented. The
benchmark of the KDDCUP'99 dataset was used in the
experiments. It had 494021 connection records for training,
and 311029 connection records for testing. Each connection
record consisted of 41 features. Table 2 presented the
datasets that were randomly collected from the testing
dataset (Corrected KDD) to evaluate the performance of
MAS-IDS.
TABLE II
THE CHARACTERISTICS OF TESTING DATASETS
Dataset Normal DoS Probe R2L U2R Total
DS1 5000 3000 700 900 400 10000
DS2 10000 7000 1000 1500 500 20000
DS3 15000 10000 1500 2500 1000 30000
DS4 20000 14000 1500 3000 1500 40000
In addition, the measures were used to evaluate the
performance of MAS-IDS: accuracy, detection rate, false
alarm rate and time. The time measure represented the time
required to analyse and process the dataset, beginning from
reading the dataset to acquiring the final results. The
accuracy, detection rate and false alarm rate were computed
by the formulas (18-20), respectively.
𝐴𝑐𝑐 = 𝑇𝑃 + 𝑇𝑁
𝑇𝑃 + 𝑇𝑁 + 𝐹𝑃 + 𝐹𝑁 (18)
𝐷𝑅 =𝑇𝑃
𝑇𝑃 + 𝐹𝑁 (19)
𝐹𝐴𝑅 =𝐹𝑃
𝑇𝑁 + 𝐹𝑃 (20)
where
TP: actual attack has predicted as an attack.
TN: actual normal has predicted as a normal.
FP: actual normal has predicted as an attack.
FN: actual attack has predicted as a normal.
Two computers were utilised to compute the results: the
first had the specification Core i5 2.60 GHz for its CPU with
4 logical processors and 12 GB of RAM, and the second had
the specification Core i7 3.40 GHz for its CPU with 8
logical processors and 4 GB of RAM. Each computer has
Windows 8.1 single Language. Moreover, the MAS-IDS
was run using the JADE platform.
In the experiments, the creation of 10 agents (by dividing
the dataset to 10 data subsets) was attempted in order to
know whether the effect of create a number of agents was
greater than the number of available logical processors;
where the second computer had 8 logical processors as the
maximum in this experiment. The results regarding the
performance and processing time were compared between
the pure K-means with the proposed method of MAS-IDS,
represented by dividing the dataset into several data subsets
and processing them in parallel by using analysis agents that
applied the K-means algorithm in their work. In this
experiment, only the first computer was used with (k=20)
for K-means; whereby, the repetition of applied K-means on
different datasets proved to be the most accurate when the
number of clusters was equal to 20. The average accuracy,
detection rate, false alarm rate and time between pure K-
means and MAS-IDS for the first computer were shown in
Table 3.
The results of the accuracy, detection rate, false alarm
rate and time for pure K-means in Table 3 represented the
performance of the simple K-means results and the time to
collect these results; each average accuracy, detection rate
and false alarm rate of MAS-IDS in Table 3 was computed
IAENG International Journal of Computer Science, 43:1, IJCS_43_1_10
(Advance online publication: 29 February 2016)
______________________________________________________________________________________
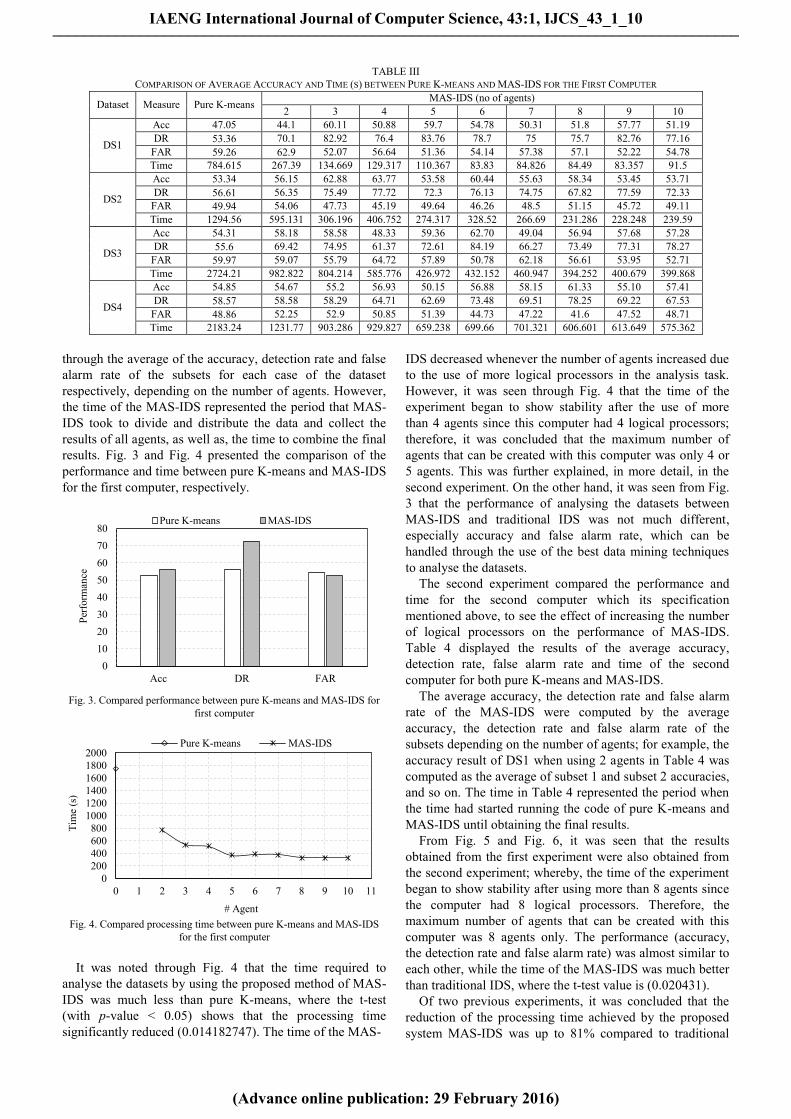
TABLE III
COMPARISON OF AVERAGE ACCURACY AND TIME (S) BETWEEN PURE K-MEANS AND MAS-IDS FOR THE FIRST COMPUTER
Dataset Measure Pure K-means MAS-IDS (no of agents)
2 3 4 5 6 7 8 9 10
DS1
Acc 47.05 44.1 60.11 50.88 59.7 54.78 50.31 51.8 57.77 51.19
DR 53.36 70.1 82.92 76.4 83.76 78.7 75 75.7 82.76 77.16
FAR 59.26 62.9 52.07 56.64 51.36 54.14 57.38 57.1 52.22 54.78
Time 784.615 267.39 134.669 129.317 110.367 83.83 84.826 84.49 83.357 91.5
DS2
Acc 53.34 56.15 62.88 63.77 53.58 60.44 55.63 58.34 53.45 53.71
DR 56.61 56.35 75.49 77.72 72.3 76.13 74.75 67.82 77.59 72.33
FAR 49.94 54.06 47.73 45.19 49.64 46.26 48.5 51.15 45.72 49.11
Time 1294.56 595.131 306.196 406.752 274.317 328.52 266.69 231.286 228.248 239.59
DS3
Acc 54.31 58.18 58.58 48.33 59.36 62.70 49.04 56.94 57.68 57.28
DR 55.6 69.42 74.95 61.37 72.61 84.19 66.27 73.49 77.31 78.27
FAR 59.97 59.07 55.79 64.72 57.89 50.78 62.18 56.61 53.95 52.71
Time 2724.21 982.822 804.214 585.776 426.972 432.152 460.947 394.252 400.679 399.868
DS4
Acc 54.85 54.67 55.2 56.93 50.15 56.88 58.15 61.33 55.10 57.41
DR 58.57 58.58 58.29 64.71 62.69 73.48 69.51 78.25 69.22 67.53
FAR 48.86 52.25 52.9 50.85 51.39 44.73 47.22 41.6 47.52 48.71
Time 2183.24 1231.77 903.286 929.827 659.238 699.66 701.321 606.601 613.649 575.362
through the average of the accuracy, detection rate and false
alarm rate of the subsets for each case of the dataset
respectively, depending on the number of agents. However,
the time of the MAS-IDS represented the period that MAS-
IDS took to divide and distribute the data and collect the
results of all agents, as well as, the time to combine the final
results. Fig. 3 and Fig. 4 presented the comparison of the
performance and time between pure K-means and MAS-IDS
for the first computer, respectively.
Fig. 3. Compared performance between pure K-means and MAS-IDS for
first computer
Fig. 4. Compared processing time between pure K-means and MAS-IDS
for the first computer
It was noted through Fig. 4 that the time required to
analyse the datasets by using the proposed method of MAS-
IDS was much less than pure K-means, where the t-test
(with p-value < 0.05) shows that the processing time
significantly reduced (0.014182747). The time of the MAS-
IDS decreased whenever the number of agents increased due
to the use of more logical processors in the analysis task.
However, it was seen through Fig. 4 that the time of the
experiment began to show stability after the use of more
than 4 agents since this computer had 4 logical processors;
therefore, it was concluded that the maximum number of
agents that can be created with this computer was only 4 or
5 agents. This was further explained, in more detail, in the
second experiment. On the other hand, it was seen from Fig.
3 that the performance of analysing the datasets between
MAS-IDS and traditional IDS was not much different,
especially accuracy and false alarm rate, which can be
handled through the use of the best data mining techniques
to analyse the datasets. The second experiment compared the performance and
time for the second computer which its specification
mentioned above, to see the effect of increasing the number
of logical processors on the performance of MAS-IDS.
Table 4 displayed the results of the average accuracy,
detection rate, false alarm rate and time of the second
computer for both pure K-means and MAS-IDS.
The average accuracy, the detection rate and false alarm
rate of the MAS-IDS were computed by the average
accuracy, the detection rate and false alarm rate of the
subsets depending on the number of agents; for example, the
accuracy result of DS1 when using 2 agents in Table 4 was
computed as the average of subset 1 and subset 2 accuracies,
and so on. The time in Table 4 represented the period when
the time had started running the code of pure K-means and
MAS-IDS until obtaining the final results.
From Fig. 5 and Fig. 6, it was seen that the results
obtained from the first experiment were also obtained from
the second experiment; whereby, the time of the experiment
began to show stability after using more than 8 agents since
the computer had 8 logical processors. Therefore, the
maximum number of agents that can be created with this
computer was 8 agents only. The performance (accuracy,
the detection rate and false alarm rate) was almost similar to
each other, while the time of the MAS-IDS was much better
than traditional IDS, where the t-test value is (0.020431).
Of two previous experiments, it was concluded that the
reduction of the processing time achieved by the proposed
system MAS-IDS was up to 81% compared to traditional
0
10
20
30
40
50
60
70
80
Acc DR FAR
Per
form
ance
Pure K-means MAS-IDS
0
200
400
600
800
1000
1200
1400
1600
1800
2000
0 1 2 3 4 5 6 7 8 9 10 11
Tim
e (s
)
# Agent
Pure K-means MAS-IDS
IAENG International Journal of Computer Science, 43:1, IJCS_43_1_10
(Advance online publication: 29 February 2016)
______________________________________________________________________________________
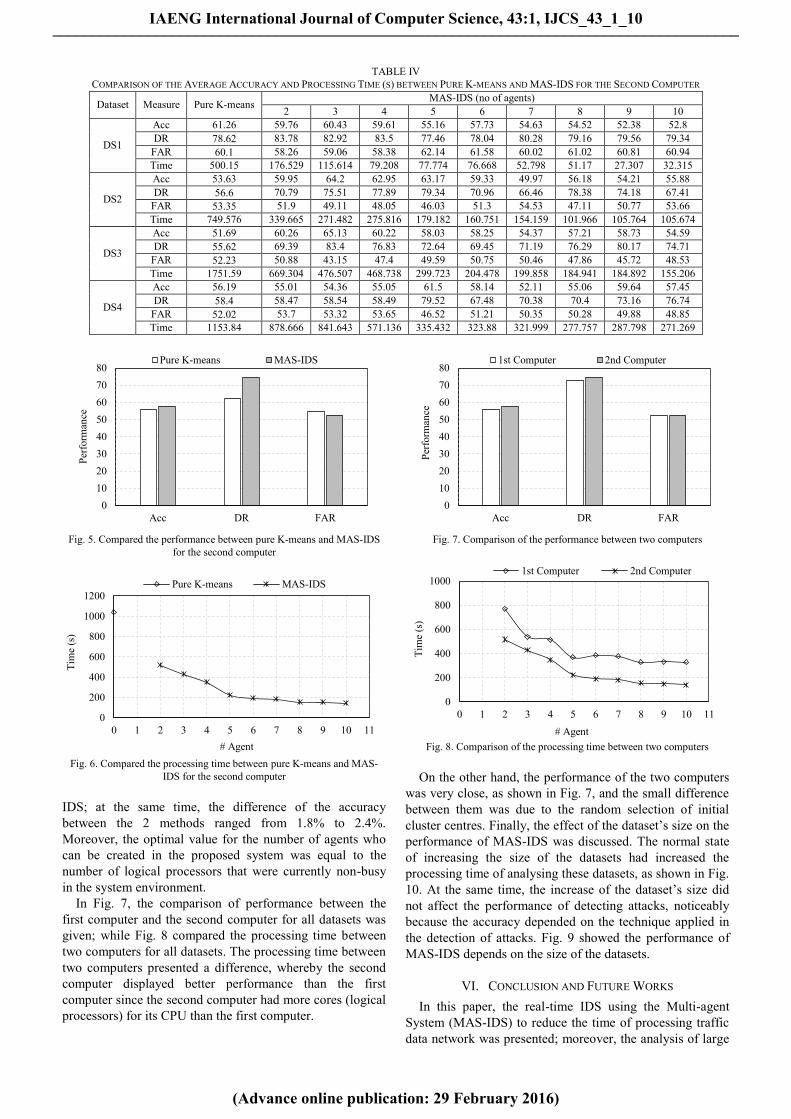
TABLE IV
COMPARISON OF THE AVERAGE ACCURACY AND PROCESSING TIME (S) BETWEEN PURE K-MEANS AND MAS-IDS FOR THE SECOND COMPUTER
Dataset Measure Pure K-means MAS-IDS (no of agents)
2 3 4 5 6 7 8 9 10
DS1
Acc 61.26 59.76 60.43 59.61 55.16 57.73 54.63 54.52 52.38 52.8
DR 78.62 83.78 82.92 83.5 77.46 78.04 80.28 79.16 79.56 79.34
FAR 60.1 58.26 59.06 58.38 62.14 61.58 60.02 61.02 60.81 60.94
Time 500.15 176.529 115.614 79.208 77.774 76.668 52.798 51.17 27.307 32.315
DS2
Acc 53.63 59.95 64.2 62.95 63.17 59.33 49.97 56.18 54.21 55.88
DR 56.6 70.79 75.51 77.89 79.34 70.96 66.46 78.38 74.18 67.41
FAR 53.35 51.9 49.11 48.05 46.03 51.3 54.53 47.11 50.77 53.66
Time 749.576 339.665 271.482 275.816 179.182 160.751 154.159 101.966 105.764 105.674
DS3
Acc 51.69 60.26 65.13 60.22 58.03 58.25 54.37 57.21 58.73 54.59
DR 55.62 69.39 83.4 76.83 72.64 69.45 71.19 76.29 80.17 74.71
FAR 52.23 50.88 43.15 47.4 49.59 50.75 50.46 47.86 45.72 48.53
Time 1751.59 669.304 476.507 468.738 299.723 204.478 199.858 184.941 184.892 155.206
DS4
Acc 56.19 55.01 54.36 55.05 61.5 58.14 52.11 55.06 59.64 57.45
DR 58.4 58.47 58.54 58.49 79.52 67.48 70.38 70.4 73.16 76.74
FAR 52.02 53.7 53.32 53.65 46.52 51.21 50.35 50.28 49.88 48.85
Time 1153.84 878.666 841.643 571.136 335.432 323.88 321.999 277.757 287.798 271.269
Fig. 5. Compared the performance between pure K-means and MAS-IDS
for the second computer
Fig. 6. Compared the processing time between pure K-means and MAS-
IDS for the second computer
IDS; at the same time, the difference of the accuracy
between the 2 methods ranged from 1.8% to 2.4%.
Moreover, the optimal value for the number of agents who
can be created in the proposed system was equal to the
number of logical processors that were currently non-busy
in the system environment.
In Fig. 7, the comparison of performance between the
first computer and the second computer for all datasets was
given; while Fig. 8 compared the processing time between
two computers for all datasets. The processing time between
two computers presented a difference, whereby the second
computer displayed better performance than the first
computer since the second computer had more cores (logical
processors) for its CPU than the first computer.
Fig. 7. Comparison of the performance between two computers
Fig. 8. Comparison of the processing time between two computers
On the other hand, the performance of the two computers
was very close, as shown in Fig. 7, and the small difference
between them was due to the random selection of initial
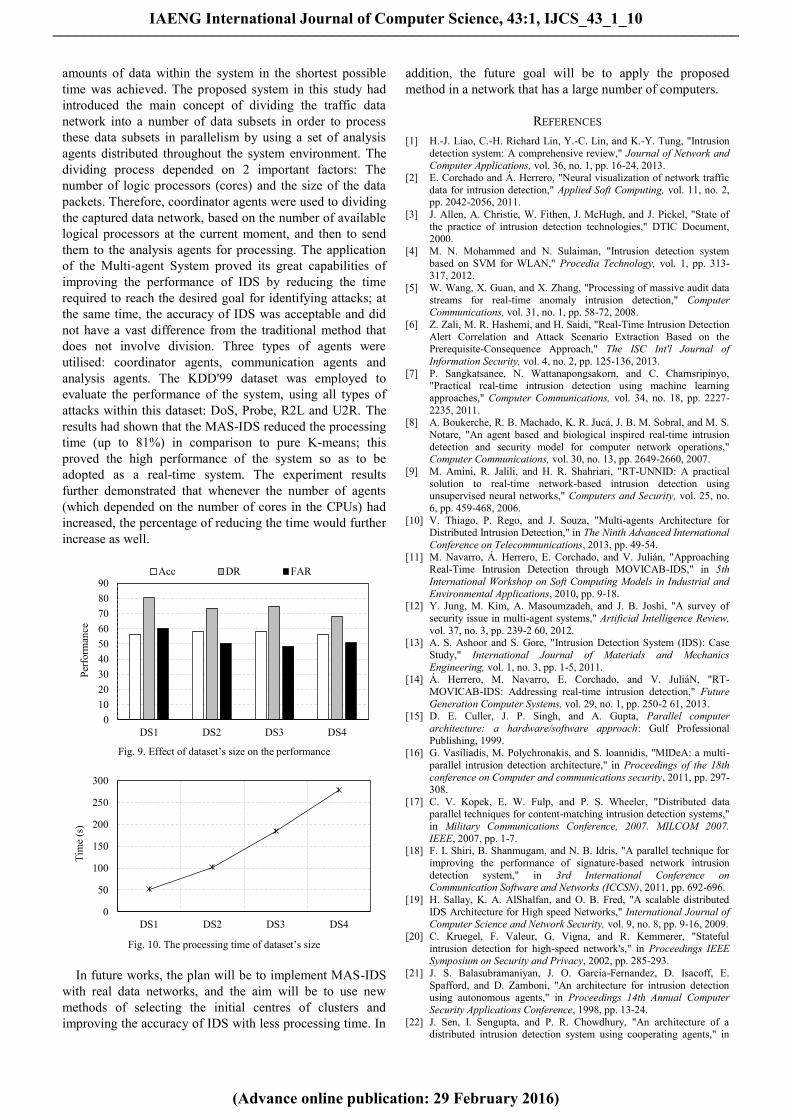
cluster centres. Finally, the effect of the dataset’s size on the
performance of MAS-IDS was discussed. The normal state
of increasing the size of the datasets had increased the
processing time of analysing these datasets, as shown in Fig.
10. At the same time, the increase of the dataset’s size did
not affect the performance of detecting attacks, noticeably
because the accuracy depended on the technique applied in
the detection of attacks. Fig. 9 showed the performance of
MAS-IDS depends on the size of the datasets.
VI. CONCLUSION AND FUTURE WORKS
In this paper, the real-time IDS using the Multi-agent
System (MAS-IDS) to reduce the time of processing traffic
data network was presented; moreover, the analysis of large
0
10
20
30
40
50
60
70
80
Acc DR FAR
Per
form
ance
Pure K-means MAS-IDS
0
200
400
600
800
1000
1200
0 1 2 3 4 5 6 7 8 9 10 11
Tim
e (s
)
# Agent
Pure K-means MAS-IDS
0
10
20
30
40
50
60
70
80
Acc DR FAR
Per
form
ance
1st Computer 2nd Computer
0
200
400
600
800
1000
0 1 2 3 4 5 6 7 8 9 10 11
Tim
e (s
)
# Agent
1st Computer 2nd Computer
IAENG International Journal of Computer Science, 43:1, IJCS_43_1_10
(Advance online publication: 29 February 2016)
______________________________________________________________________________________
amounts of data within the system in the shortest possible
time was achieved. The proposed system in this study had
introduced the main concept of dividing the traffic data
network into a number of data subsets in order to process
these data subsets in parallelism by using a set of analysis
agents distributed throughout the system environment. The
dividing process depended on 2 important factors: The
number of logic processors (cores) and the size of the data
packets. Therefore, coordinator agents were used to dividing
the captured data network, based on the number of available
logical processors at the current moment, and then to send
them to the analysis agents for processing. The application
of the Multi-agent System proved its great capabilities of
improving the performance of IDS by reducing the time
required to reach the desired goal for identifying attacks; at
the same time, the accuracy of IDS was acceptable and did
not have a vast difference from the traditional method that
does not involve division. Three types of agents were
utilised: coordinator agents, communication agents and
analysis agents. The KDD'99 dataset was employed to
evaluate the performance of the system, using all types of
attacks within this dataset: DoS, Probe, R2L and U2R. The
results had shown that the MAS-IDS reduced the processing
time (up to 81%) in comparison to pure K-means; this
proved the high performance of the system so as to be
adopted as a real-time system. The experiment results
further demonstrated that whenever the number of agents
(which depended on the number of cores in the CPUs) had
increased, the percentage of reducing the time would further
increase as well.
Fig. 9. Effect of dataset’s size on the performance
Fig. 10. The processing time of dataset’s size
In future works, the plan will be to implement MAS-IDS
with real data networks, and the aim will be to use new
methods of selecting the initial centres of clusters and
improving the accuracy of IDS with less processing time. In
addition, the future goal will be to apply the proposed
method in a network that has a large number of computers.
REFERENCES
[1] H.-J. Liao, C.-H. Richard Lin, Y.-C. Lin, and K.-Y. Tung, "Intrusion
detection system: A comprehensive review," Journal of Network and
Computer Applications, vol. 36, no. 1, pp. 16-24, 2013. [2] E. Corchado and Á. Herrero, "Neural visualization of network traffic
data for intrusion detection," Applied Soft Computing, vol. 11, no. 2, pp. 2042-2056, 2011.
[3] J. Allen, A. Christie, W. Fithen, J. McHugh, and J. Pickel, "State of
the practice of intrusion detection technologies," DTIC Document, 2000.
[4] M. N. Mohammed and N. Sulaiman, "Intrusion detection system
based on SVM for WLAN," Procedia Technology, vol. 1, pp. 313-317, 2012.
[5] W. Wang, X. Guan, and X. Zhang, "Processing of massive audit data
streams for real-time anomaly intrusion detection," Computer Communications, vol. 31, no. 1, pp. 58-72, 2008.
[6] Z. Zali, M. R. Hashemi, and H. Saidi, "Real-Time Intrusion Detection
Alert Correlation and Attack Scenario Extraction Based on the Prerequisite-Consequence Approach," The ISC Int'l Journal of
Information Security, vol. 4, no. 2, pp. 125-136, 2013.
[7] P. Sangkatsanee, N. Wattanapongsakorn, and C. Charnsripinyo, "Practical real-time intrusion detection using machine learning
approaches," Computer Communications, vol. 34, no. 18, pp. 2227-
2235, 2011. [8] A. Boukerche, R. B. Machado, K. R. Jucá, J. B. M. Sobral, and M. S.
Notare, "An agent based and biological inspired real-time intrusion
detection and security model for computer network operations," Computer Communications, vol. 30, no. 13, pp. 2649-2660, 2007.
[9] M. Amini, R. Jalili, and H. R. Shahriari, "RT-UNNID: A practical
solution to real-time network-based intrusion detection using unsupervised neural networks," Computers and Security, vol. 25, no.
6, pp. 459-468, 2006.
[10] V. Thiago, P. Rego, and J. Souza, "Multi-agents Architecture for
Distributed Intrusion Detection," in The Ninth Advanced International
Conference on Telecommunications, 2013, pp. 49-54.
[11] M. Navarro, Á. Herrero, E. Corchado, and V. Julián, "Approaching Real-Time Intrusion Detection through MOVICAB-IDS," in 5th
International Workshop on Soft Computing Models in Industrial and
Environmental Applications, 2010, pp. 9-18. [12] Y. Jung, M. Kim, A. Masoumzadeh, and J. B. Joshi, "A survey of
security issue in multi-agent systems," Artificial Intelligence Review,
vol. 37, no. 3, pp. 239-2 60, 2012. [13] A. S. Ashoor and S. Gore, "Intrusion Detection System (IDS): Case
Study," International Journal of Materials and Mechanics
Engineering, vol. 1, no. 3, pp. 1-5, 2011. [14] Á. Herrero, M. Navarro, E. Corchado, and V. JuliáN, "RT-
MOVICAB-IDS: Addressing real-time intrusion detection," Future
Generation Computer Systems, vol. 29, no. 1, pp. 250-2 61, 2013. [15] D. E. Culler, J. P. Singh, and A. Gupta, Parallel computer
architecture: a hardware/software approach: Gulf Professional
Publishing, 1999.
[16] G. Vasiliadis, M. Polychronakis, and S. Ioannidis, "MIDeA: a multi-
parallel intrusion detection architecture," in Proceedings of the 18th
conference on Computer and communications security, 2011, pp. 297-308.
[17] C. V. Kopek, E. W. Fulp, and P. S. Wheeler, "Distributed data parallel techniques for content-matching intrusion detection systems,"
in Military Communications Conference, 2007. MILCOM 2007.
IEEE, 2007, pp. 1-7. [18] F. I. Shiri, B. Shanmugam, and N. B. Idris, "A parallel technique for
improving the performance of signature-based network intrusion
detection system," in 3rd International Conference on Communication Software and Networks (ICCSN), 2011, pp. 692-696.
[19] H. Sallay, K. A. AlShalfan, and O. B. Fred, "A scalable distributed
IDS Architecture for High speed Networks," International Journal of Computer Science and Network Security, vol. 9, no. 8, pp. 9-16, 2009.
[20] C. Kruegel, F. Valeur, G. Vigna, and R. Kemmerer, "Stateful
intrusion detection for high-speed network's," in Proceedings IEEE Symposium on Security and Privacy, 2002, pp. 285-293.
[21] J. S. Balasubramaniyan, J. O. Garcia-Fernandez, D. Isacoff, E.
Spafford, and D. Zamboni, "An architecture for intrusion detection using autonomous agents," in Proceedings 14th Annual Computer
Security Applications Conference, 1998, pp. 13-24.
[22] J. Sen, I. Sengupta, and P. R. Chowdhury, "An architecture of a distributed intrusion detection system using cooperating agents," in
0
10
20
30
40
50
60
70
80
90
DS1 DS2 DS3 DS4
Per
form
ance
Acc DR FAR
0
50
100
150
200
250
300
DS1 DS2 DS3 DS4
Tim
e (s
)
IAENG International Journal of Computer Science, 43:1, IJCS_43_1_10
(Advance online publication: 29 February 2016)
______________________________________________________________________________________
International Conference on Computing & Informatics, ICOCI'06,
2006, pp. 1-6. [23] O. Oriola, A. Adeyemo, and A. Robert, "Distributed Intrusion
Detection System Using P2P Agent Mining Scheme," African Journal
of Computing & ICT, vol. 5, no. 2, pp. 3-10, 2012. [24] R. Páez, M. Y. Uribe, and M. Torres, "Internal Security on an IDS
Based on Agents," International Journal of Network Security & Its
Applications, vol. 5, no. 4, pp. 129-142, 2013. [25] P. Gogoi, M. H. Bhuyan, D. Bhattacharyya, and J. K. Kalita, "Packet
and flow based network intrusion dataset," in Contemporary
Computing, ed: Springer, 2012, pp. 322-334. [26] N. Sengupta, J. Sen, J. Sil, and M. Saha, "Designing of on line
intrusion detection system using rough set theory and Q-learning
algorithm," Neurocomputing, vol. 111, pp. 161-168, 2013. [27] P. Asrodia and H. Patel, "Analysis of various packet sniffing tools for
network monitoring and analysis," International Journal of Electrical,
Electronics and Computer Engineering, vol. 1, no. 1, pp. 55-58, 2012. [28] A. A. Cárdenas, R. Berthier, R. B. Bobba, J. H. Huh, J. G. Jetcheva,
D. Grochocki, et al., "A Framework for Evaluating Intrusion
Detection Architectures in Advanced Metering Infrastructures," IEEE Transactions on Smart Grid, vol. 5, no. 2, pp. 906-915, 2014.
[29] L. Portnoy, "Intrusion detection with unlabeled data using clustering,"
in Proceedings of ACM CSS Workshop on Data Mining Applied to Security, 2001, pp. 1-14.
IAENG International Journal of Computer Science, 43:1, IJCS_43_1_10
(Advance online publication: 29 February 2016)
______________________________________________________________________________________