Embed Size (px)
Citation preview
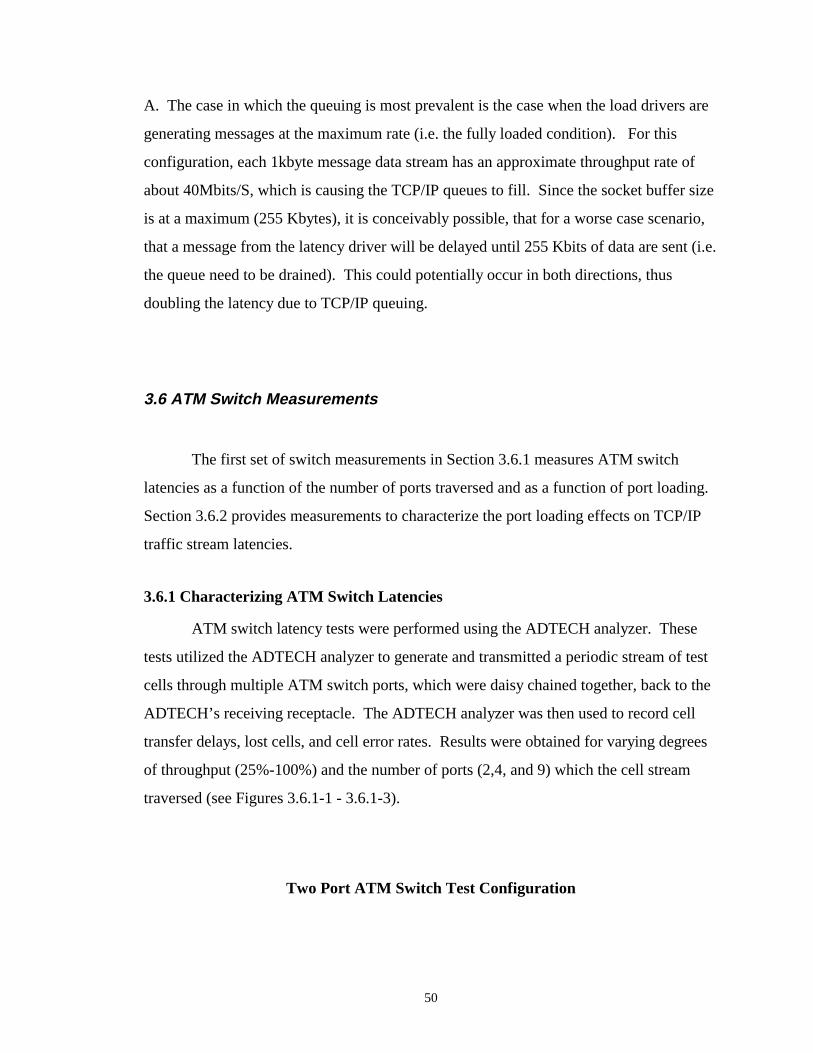
1
REAL-TIME COTS MESSAGE COMMUNICATION FOR C3I SYSTEMS
BY
ROBERT J. PALLACK JR.
A THESIS SUBMITTED IN PARTIAL FULFULLMENT OF THE
REQUIREMENTS FOR THE DEGREE OF
MASTER OF SCIENCE
IN
COMPUTER SCIENCE
UNIVERSITY OF RHODE ISLAND 1997

2
MASTER OF SCIENCE THESIS
OF
ROBERT J. PALLACK JR.
APPROVED: Thesis Commitee Major Professor ________________________________ ________________________________ ________________________________ _________________________________ DEAN OF THE GRADUATE SCHOOL
UNIVERSITY OF RHODE ISLAND 1997
3
Abstract
This work investigates the viability of utilizing a Commercial off the Shelf
(COTS) based distributed system to meet the real-time data messaging requirements of
the Combat Command Control and Intelligent (C3I) systems for the New Strategic
Submarine Nuclear (NSSN) submarine. The primary method for performing the required
analysis is measuring the system latencies on representative equipment. Measurements
are taken to determine the latency effects of the workstation and underlying
Asynchronous Transfer Mode (ATM) network on message latencies.
The concept of the Latency Server is also introduced. The Latency Server
provides latency estimates for message latencies between pairs of communication
workstations. The latency estimates are available to any requesting application client.
Lastly, recommendations are made to the standards which specify the components
of the message communications system.

4
Acknowledgments
I first would like to thank my Branch Head Robert Watson and the Naval
Undersea Warfare Center (NUWC) for allowing the availablity of the computational
resources required to accomplish this thesis. I thank Greg Bussiere for his TCP/IP test
drivers and for his technical consultation in the accomplishment of the measurements in
Section 3. I thank Dr. Fay-Wolfe for his technical guidance and editorial comments.
Lastly, I would like to thank my wife, Mary Anne, and daughters, Hannah and Jamie for
putting up with me during the time I worked on this thesis.
5
1.0 Introduction
The problem domain that this research is addressing is to determine the viability
of utilizing a Commercial off the Shelf (COTS) computer network based system to meet
the real-time data messaging requirements of military Combat Command Control and
Intelligent (C3I) systems. C3I systems provide the computational resources which are
required to gather and process data in the support of a complex weapon system, such as,
a submarine. The C3I system that is the focus of this thesis is the C3I system being
developed for the New Strategic Submarine Nuclear (NSSN) submarine.
In general, C3I systems can contain numerous software applications on various
workstations. C3I systems are typically composed of subsystems, each of which offers
specific system functionality. Each subsystem consists of one or more computer
resources. The subsystems are interconnected by computer networks. Applications
typically are required to exchange data with numerous applications from other subsystems
to accompish a system level task. Some system level tasks have real-time requirements.
Real-time refers to timing requirements (i.e. deadline) for task completion. Real-time
requirements are typically characterized as either soft or hard. Hard real-time
requirements can never be violated or else a catastrophic event will occur. On the other
hand, if soft real-time requirements are violated, no castrophic event occurs, however the
results may be degraded. Modern C3I systems will be based on COTS computers and
computer networks. Since message communications may be required in order for a task
to complete, the latency characteristics of message communications are of significant
interest with respect to the system’s real-time requirements. It is important to
characterize the latency of the COTS message communication system and to gain insight
on how the COTS system communication system can be utilized to support real-time C3I
system message traffic.
The key measurement metrics used in this thesis to characterize latency are
average latency, maximum latency and latency distribution. Average latency
measurements provide a means of comparing the performance characteristics of different
configurations. Maximum latencies provide the means to determine what time critical
requirements a particular configuration can meet. If the requirement is considered soft-
6
real-time, then the maximum latency may occasionally exceed the real-time time
constraint. If the requirements are considered hard real-time, the maximum latency can
never exceed the real-time time constraint. This thesis is primarily concerned with soft-
real-time systems.
To facilitate C3I system design and implementation, a Common Object Request
Broker Architecture (CORBA) product will be utilized. CORBA is a standard which
provides a framework to define interfaces between communicating software applications
and includes the mechanisms to support communications between networked computers.
Unfortunately, the software utilized to implement the CORBA functionality adds to the
message data latencies. It is also of interest to characterize the CORBA implementation
contribution to intercomputer message data latencies.
As a means to identify message data latencies, it may be beneficial for software
applications to dynamically request the latency component of the message
communication implementation between applications on different computers. This
would allow for the applications to maximize the amount of time available for
computational processing while ensuring that system deadlines are not missed. Although
this concept is not necessarily applicable to NSSN C3I System, it may have applications
to other network based computer systems.
1.1 Background of COTS Based Message Communications for C3I Systems
Navy Combat Command Control and Intelligence Systems are the computer
systems aboard Navy platforms that, receive information from the outboard sensors,
provide the necessary computations for the platform personal to make decisions, and
provide the required preset commands to the weapon subsystems. The NSSN C3I System
consists of a high level network architecture connecting 13 subsystems. The subsystems
are as follows:
• Combat Control

7
• Sonar
• Total Ship Monitoring
• Tactical Support Device
• Exterior Communication
• Electronic Surveillance
• On Board Training
• Ship Control
• Submarine Defense Warfare System
• Photonics
• Simulation/Stimulation
• Radar
• Navigation
Each subsystem performs a specific function. For instance, the Sonar subsystem
translates raw sensor data from transducers to target data for the Combat Control
subsystem.
C3I systems have traditionally been composed of uniquely designed computer
systems, communicating by point-to-point connections. These systems typically consist
of dozens of software applications located on different computer platforms. Several of
the applications have real-time considerations in that message latency characteristics are
of importance. Since the older systems utilized point-to-point connections and used
specially designed computers, the message latency characteristics were known and hence
not a major source of concern.
In an effort to reduce procurement costs, procurement lead time, and to keep
current with technological advances, the Navy has taken the approach that all new
procurements of C3I systems will be based on COTS components. These components
would be specified by open system standards, so that the Navy would not become
dependent on a particular vendor’s implementation. This approach has resulted in the
design of the NSSN C3I System consisting of numerous commercial workstations
8
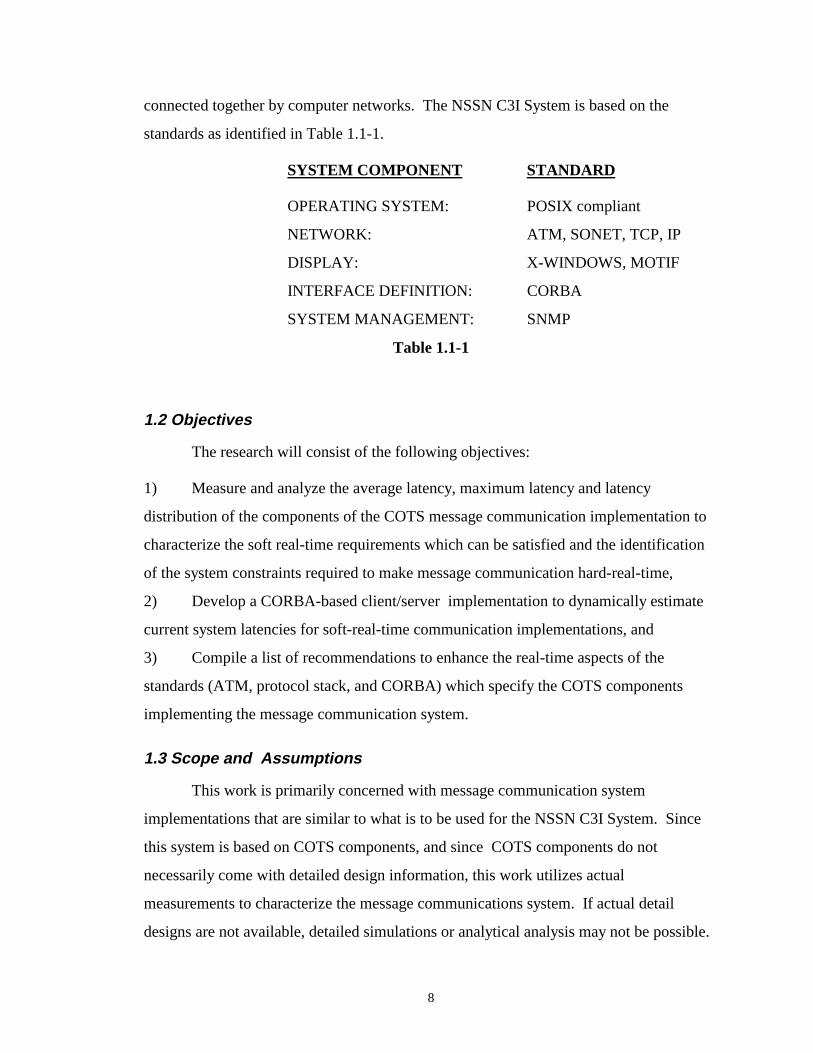
connected together by computer networks. The NSSN C3I System is based on the
standards as identified in Table 1.1-1.
SYSTEM COMPONENT STANDARD
OPERATING SYSTEM: POSIX compliant
NETWORK: ATM, SONET, TCP, IP
DISPLAY: X-WINDOWS, MOTIF
INTERFACE DEFINITION: CORBA
SYSTEM MANAGEMENT: SNMP
Table 1.1-1
1.2 Objectives
The research will consist of the following objectives:
1) Measure and analyze the average latency, maximum latency and latency
distribution of the components of the COTS message communication implementation to
characterize the soft real-time requirements which can be satisfied and the identification
of the system constraints required to make message communication hard-real-time,
2) Develop a CORBA-based client/server implementation to dynamically estimate
current system latencies for soft-real-time communication implementations, and
3) Compile a list of recommendations to enhance the real-time aspects of the
standards (ATM, protocol stack, and CORBA) which specify the COTS components
implementing the message communication system.
1.3 Scope and Assumptions
This work is primarily concerned with message communication system
implementations that are similar to what is to be used for the NSSN C3I System. Since
this system is based on COTS components, and since COTS components do not
necessarily come with detailed design information, this work utilizes actual
measurements to characterize the message communications system. If actual detail
designs are not available, detailed simulations or analytical analysis may not be possible.
9
Actual measurements also provide advantages in that time consuming complex analysis
need not be done, important implementation “quirks” can be uncovered and the results
obtained are actual results versus theoretical results which may be prone to errors.
The majority of messages required to support the NSSN C3I System will be 256
bytes or smaller. Therefore, this work only obtains measurements for relatively small size
messages. The message sizes utilized in the measurements are as follows: 64 bytes, 128
bytes, 256 bytes, 512 bytes, 1024 bytes, 2048 bytes, 4096 bytes and 8192 bytes.
The systems utilized for the measurements were HP TAC-3 and TAC-4
computers. The TAC-3 systems had HP-UX 9.01 operating system with the Orbix 2.0.1
implementation of CORBA. The TAC-4 systems had HP-UX 10.0 operating system with
the Orbix 2.0 implementation of CORBA. The ATM/SONET network used was based
on FORE ASX-1000 switches. It is also assumed that the ATM virtual connections are
based on the Unspecified Bit Rate (UBR) traffic contract.
1.4 Document Overview
Section 2.0 of this document provides an introduction to the components of the
COTS message passing system. An example of how messages are passed between
remote applications is then described. In addition, real-time concepts are identified along
with a discussion of related published research.
Section 3.0 provides a description and analysis of the latency measurements which
were taken. Measurements were taken and compared from application-to-application
from both CORBA and TCP/IP perspectives. In addition, measurements characterizing
latencies for the ATM network were obtain. This section also provides measurements to
demonstrate how latencies could be improved by assigning high priority to process.
Section 4.0 introduces the concept of the Latency Server and provides high level
design information. In addition, the setup in which the Latency Server was tested is
discussed.
Section 5.0 addresses the applicability of this thesis research to other work (i.e.
NSSN C3I System development and URI research). Section 6.0 provides
recommendations to the ATM, CORBA and TCP/IP standards on how these components
could be improved to support real-time time constrains. Section 7.0 states the

10
conclusions for this work. Lastly, Section 8.0 provides recommendations on how this
thesis can be extended.
11
2.0 Background Discussion
2.1 Message Communications Paradigm
Inter-workstation communications is accomplished by message passing.
The two fundamental components of the COTS message passing system are the ATM
network and the workstations from which messages are to be passed. The significant
components of the workstation are the operating system, the protocol stack, and the
application program’s environment. The ATM network major components are the ATM
switches and the workstation’s ATM interface Network Interface Card (NIC).
Section 2.1.1 presents a brief introduction to the operating system, the TCP/IP
protocol stack, the CORBA environment, and ATM. Section 2.1.2 illustrates the
interaction of these components during a message passing scenario.
2.1.1 Component Details
2.1.1.1 Operating System
A POSIX compliant operating system can be viewed as several layers. The lowest
layer is the machine’s hardware. The machine hardware is accessed by the operating
system (kernel). The kernel provides basic services to programs by providing the
mechanism to interact with the hardware. Programs interact with the kernel via system
calls.
Programs are executable files. An instance of an executing program is a process.
Programs which implement required NSSN functionality will be termed application
programs. Application programs consist of one or more processes.
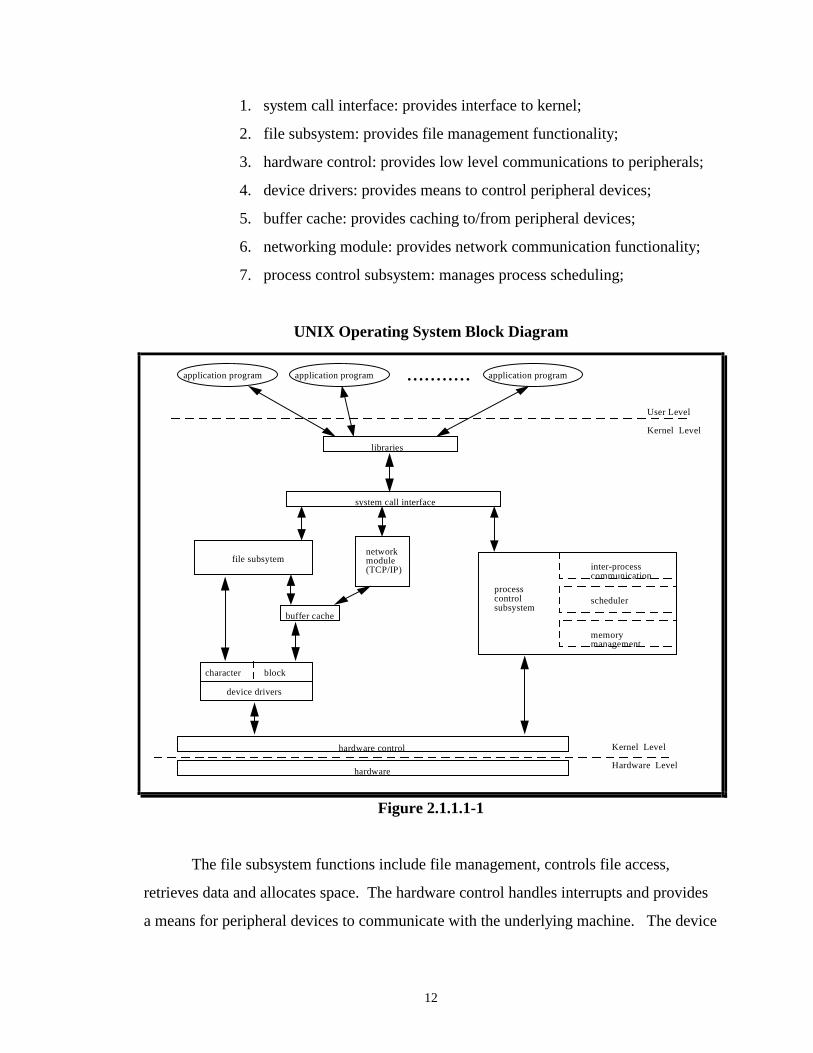
Figure 2.1.1.1-1 is a block diagram of the kernel derived from [15]. Application
programs are invoked in what is termed as the User Mode. Application programs call a
system call library which causes an interrupt resulting the system to transition from User
mode to Kernel Mode.
The kernel itself is composed of:
12
1. system call interface: provides interface to kernel;
2. file subsystem: provides file management functionality;
3. hardware control: provides low level communications to peripherals;
4. device drivers: provides means to control peripheral devices;
5. buffer cache: provides caching to/from peripheral devices;
6. networking module: provides network communication functionality;
7. process control subsystem: manages process scheduling;
UNIX Operating System Block Diagram
file subsyteminter-processcommunication
scheduler
memorymanagement
processcontrolsubsystem
buffer cache
system call interface
networkmodule(TCP/IP)
hardware
hardware control Kernel Level
Hardware Level
device drivers
blockcharacter
libraries
application program application program application program...........
User Level
Kernel Level
Figure 2.1.1.1-1
The file subsystem functions include file management, controls file access,
retrieves data and allocates space. The hardware control handles interrupts and provides
a means for peripheral devices to communicate with the underlying machine. The device
13
drivers provide the means to control peripheral devices such as disks and network
interfaces. There are two methods in which the device drivers interact with the file
subsystem, character device and block device. The character device accepts a raw stream
of data to/from the driver. The block device offers caching utilizing the buffer cache.
The buffer cache allows peripheral data to be cached. This allows performance benefits
in that the CPU does not have to wait for a slower peripheral device (i.e. secondary
memory) to provide/accept the data to/from the file system. The network stack provides
the functionality to support network communications.
The process control subsystem is composed of the inter-process communication
module, the scheduler module and the memory management module. The inter-process
communication module provides a means to pass data between processes. The memory
management module manages main memory. If main memory is not large enough, the
memory manager either performs a paging or a swapping function. The scheduler,
schedules processes to run. For HP-UX, processes run for 10 ms before they are swapped
out. The highest priority process always run first. The priority of User Mode processes is
dependent on the time duration since it was last scheduled.
2.1.1.2 CORBA
The Common Object Request Broker (CORBA) is a specification [17] for a
distributed architecture specified by the Object Management Group. CORBA specifies
an architecture in which applications on remote hosts can communicate with each other
without any knowledge of the underlying network. The applications can be on
heterogeneous machines utilizing different programming languages.
A Client/Server model is used for information exchange between applications.
Interfaces between Clients and Servers are specified by an Interface Definition Language
(IDL). IDL provides a declarative language in which object interfaces or software
“wrappers” are created to facilitate data exchange between applications. It is the
responsibility of the server programmer to implement the object methods. Data can be
interchanged simply by the client invoking the object methods.
14
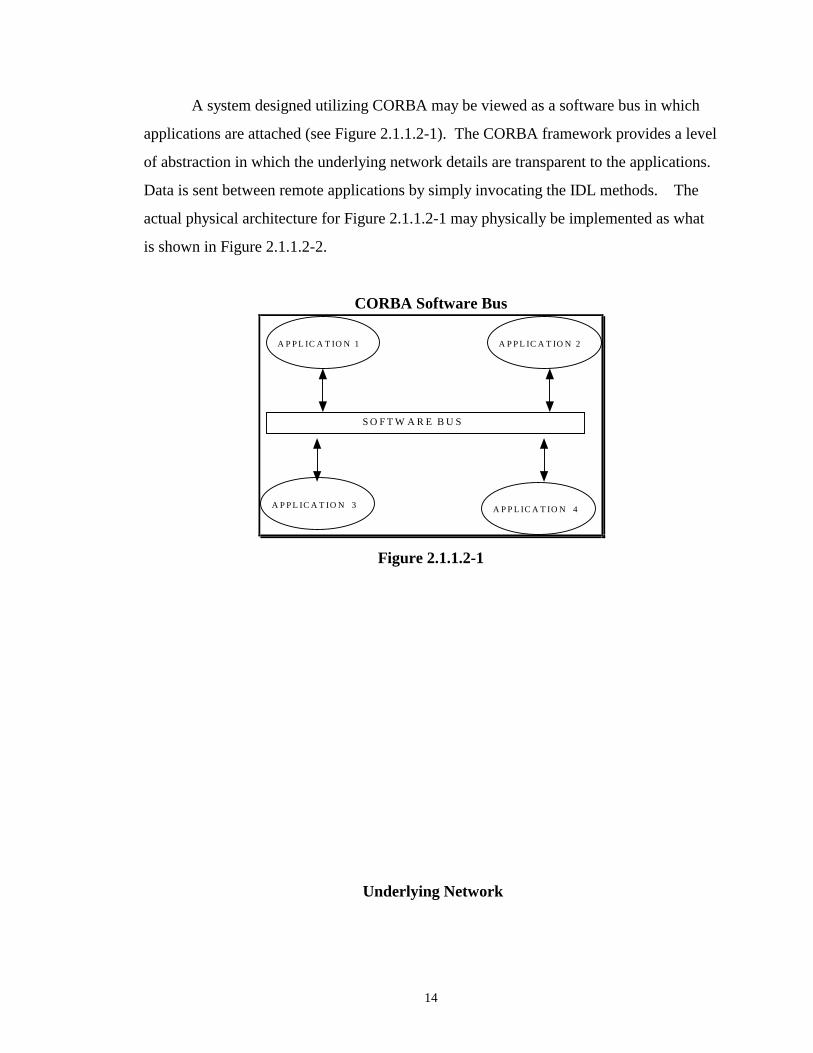
A system designed utilizing CORBA may be viewed as a software bus in which
applications are attached (see Figure 2.1.1.2-1). The CORBA framework provides a level
of abstraction in which the underlying network details are transparent to the applications.
Data is sent between remote applications by simply invocating the IDL methods. The
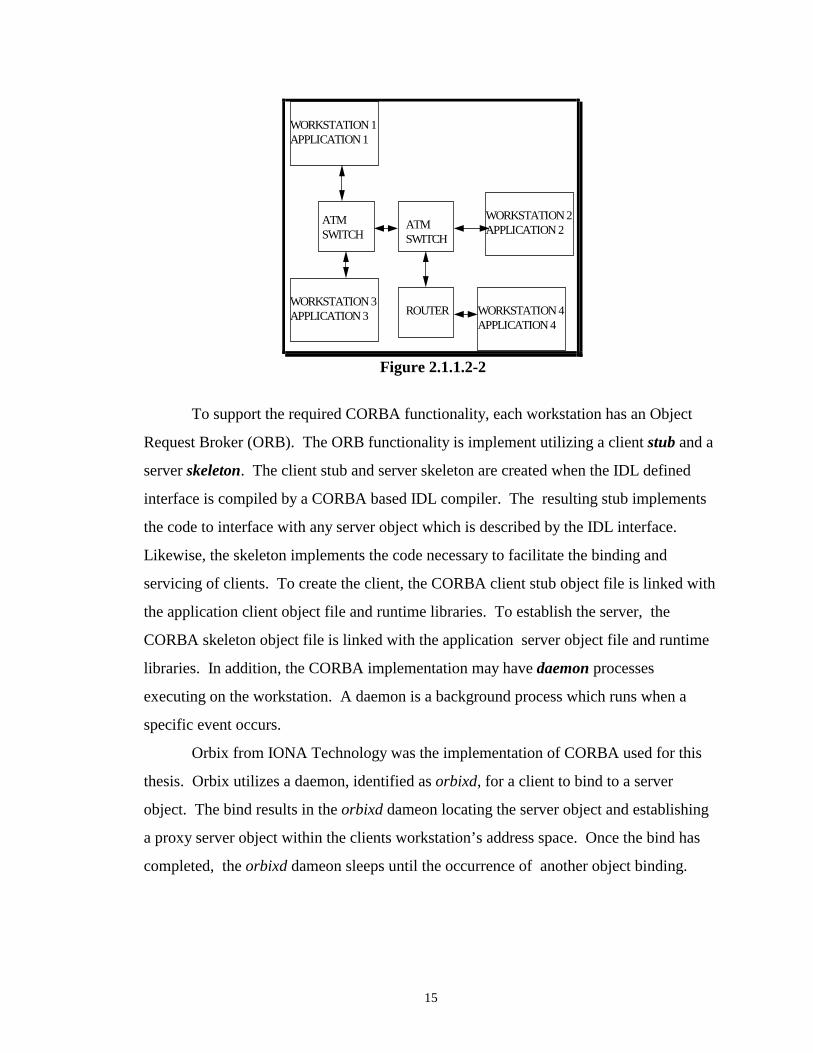
actual physical architecture for Figure 2.1.1.2-1 may physically be implemented as what
is shown in Figure 2.1.1.2-2.
CORBA Software Bus
S O F T W A R E B U S
A P P L IC A T IO N 1 A P P L IC A T IO N 2
A P P L IC A T IO N 3 A P P L IC A T IO N 4
Figure 2.1.1.2-1
Underlying Network
15
ATMSWITCH
ROUTER
ATMSWITCH
WORKSTATION 2APPLICATION 2
WORKSTATION 4APPLICATION 4
WORKSTATION 1APPLICATION 1
WORKSTATION 3APPLICATION 3
Figure 2.1.1.2-2
To support the required CORBA functionality, each workstation has an Object
Request Broker (ORB). The ORB functionality is implement utilizing a client stub and a
server skeleton. The client stub and server skeleton are created when the IDL defined
interface is compiled by a CORBA based IDL compiler. The resulting stub implements
the code to interface with any server object which is described by the IDL interface.
Likewise, the skeleton implements the code necessary to facilitate the binding and
servicing of clients. To create the client, the CORBA client stub object file is linked with
the application client object file and runtime libraries. To establish the server, the
CORBA skeleton object file is linked with the application server object file and runtime
libraries. In addition, the CORBA implementation may have daemon processes
executing on the workstation. A daemon is a background process which runs when a
specific event occurs.
Orbix from IONA Technology was the implementation of CORBA used for this
thesis. Orbix utilizes a daemon, identified as orbixd, for a client to bind to a server
object. The bind results in the orbixd dameon locating the server object and establishing
a proxy server object within the clients workstation’s address space. Once the bind has
completed, the orbixd dameon sleeps until the occurrence of another object binding.
16
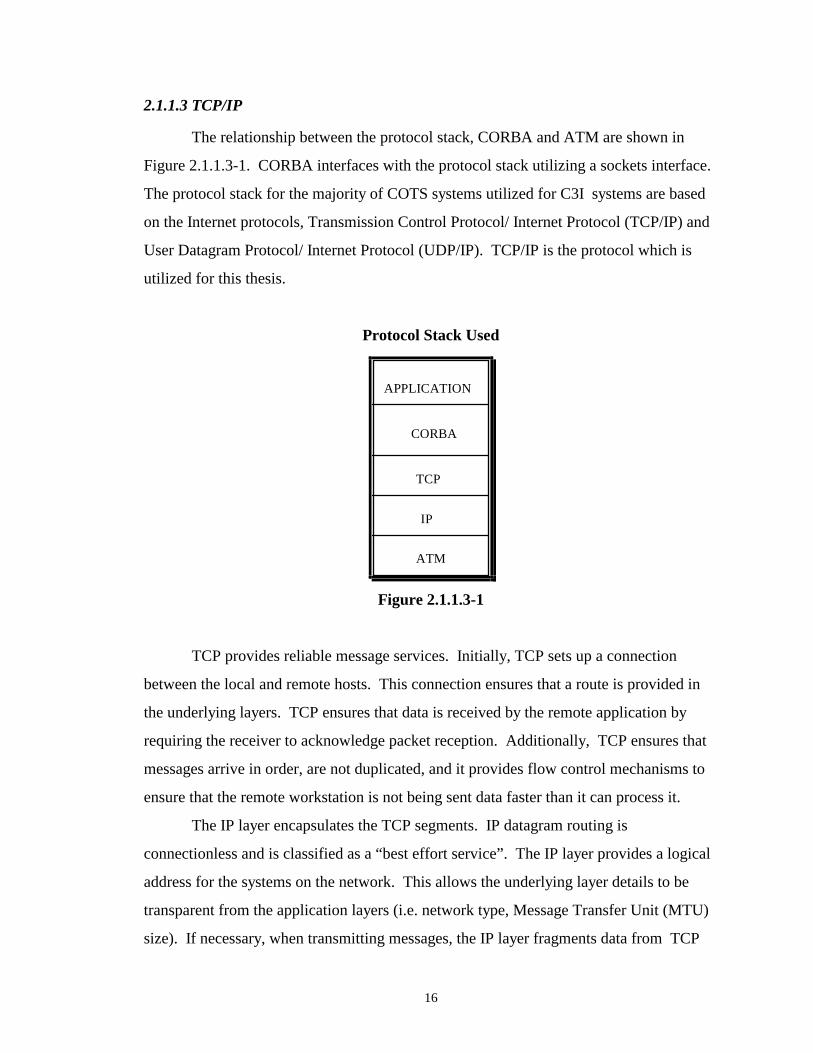
2.1.1.3 TCP/IP
The relationship between the protocol stack, CORBA and ATM are shown in
Figure 2.1.1.3-1. CORBA interfaces with the protocol stack utilizing a sockets interface.
The protocol stack for the majority of COTS systems utilized for C3I systems are based
on the Internet protocols, Transmission Control Protocol/ Internet Protocol (TCP/IP) and
User Datagram Protocol/ Internet Protocol (UDP/IP). TCP/IP is the protocol which is
utilized for this thesis.
Protocol Stack Used
APPLICATION
CORBA
TCP
IP
ATM
Figure 2.1.1.3-1
TCP provides reliable message services. Initially, TCP sets up a connection
between the local and remote hosts. This connection ensures that a route is provided in
the underlying layers. TCP ensures that data is received by the remote application by
requiring the receiver to acknowledge packet reception. Additionally, TCP ensures that
messages arrive in order, are not duplicated, and it provides flow control mechanisms to
ensure that the remote workstation is not being sent data faster than it can process it.
The IP layer encapsulates the TCP segments. IP datagram routing is
connectionless and is classified as a “best effort service”. The IP layer provides a logical
address for the systems on the network. This allows the underlying layer details to be
transparent from the application layers (i.e. network type, Message Transfer Unit (MTU)
size). If necessary, when transmitting messages, the IP layer fragments data from TCP
17
into the appropriate MTU size of the underlying network. When receiving messages, if
necessary, the IP layer reassembles message frames for the TCP layer.
The TCP/IP protocol is implemented in the kernel of most POSIX compliant
operating systems of interest in this thesis. The operating system queues both incoming
messages and outgoing messages. Thus, a message needs to wait its turn before it is
transmitted on the network. There is no concept of message priority in TCP/IP.
2.1.1.4 ATM
Asynchronous Transfer Mode (ATM) is an international standard for high-speed
networking technology. ATM provides a communication path between End Stations.
End Stations can be computers, video devices or audio devices. ATM functionality is
equivalent to the Physical, Data Link and a portion of the Network layer of the OSI
model. A description of the OSI model can be found in [23].
An ATM data communication network is composed of workstations with ATM
Network Interface Cards (NIC) and ATM switches. ATM switches contain multiple ports
(i.e. 16). The workstations are connected directly to the ports by a physical interface
(fiber or copper) to a switch port. In addition to workstations, switch ports can be
connected to other switch ports. A path between any two end-stations is termed a virtual
circuit. Virtual circuits are composed of virtual paths. Each virtual path is further
composed of numerous virtual channels. Information which traverses the ATM network
is decomposed into 53 byte ATM cells. The cells consist of a 5 byte header and a 48 byte
payload. Two fields of the header identify the Virtual Path and the Virtual Channel
which the cell is to traverse. These fields are the Virtual Path Identifier (VPI) and the
Virtual Circuit Identifier (VCI). Each switch port has a data structure associated with it
which maps the incoming cells VPI/VCI pairing to the appropriate output switch port.
The output switch port also has a data structure associated with it which maps the current
VPI/VCI pairing with a potentially new VPI/VCI pairing.
In order to support the various types of information that can traverse the ATM
network, ATM provides Quality of Service (QoS) parameters. For example, video
information requires the network to provide a low latency, constant bandwidth, while
18
computer data is bursty and generally does not require low latency constant bit rate data.
The QoS parameters are used by the user to specify their requirements to the network. If
the network can support the user requirements, a traffic contract with the network is
established.
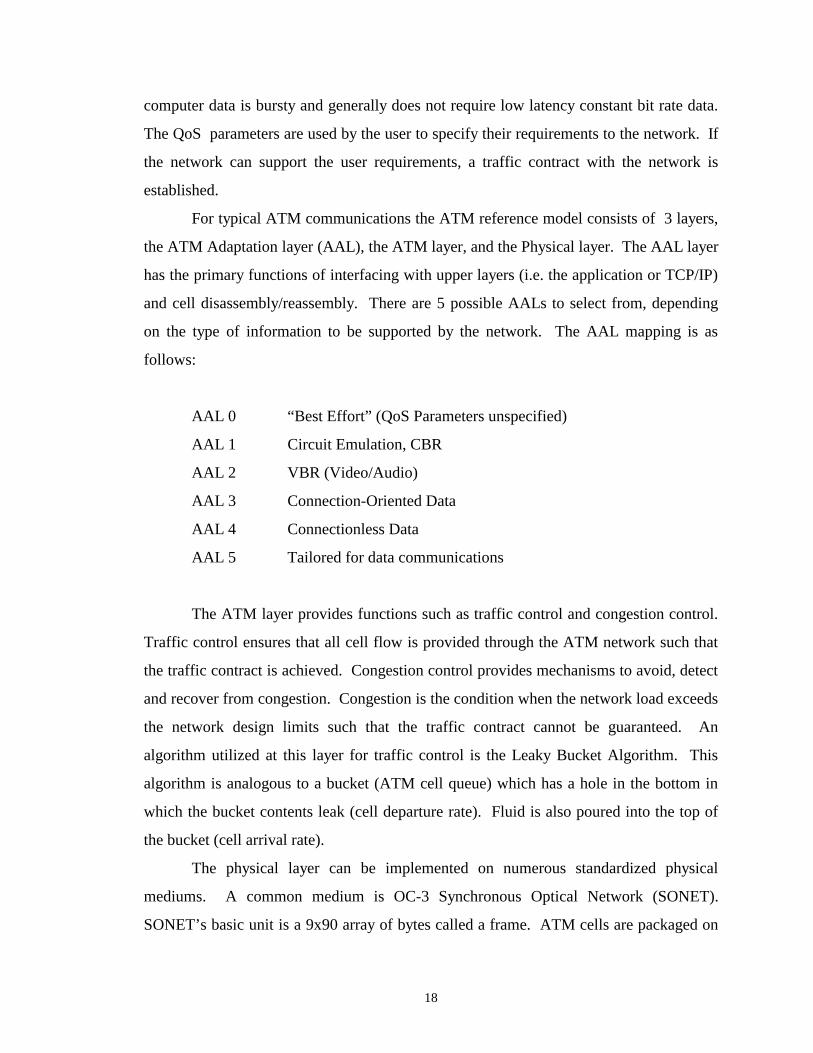
For typical ATM communications the ATM reference model consists of 3 layers,
the ATM Adaptation layer (AAL), the ATM layer, and the Physical layer. The AAL layer
has the primary functions of interfacing with upper layers (i.e. the application or TCP/IP)
and cell disassembly/reassembly. There are 5 possible AALs to select from, depending
on the type of information to be supported by the network. The AAL mapping is as
follows:
AAL 0 “Best Effort” (QoS Parameters unspecified)
AAL 1 Circuit Emulation, CBR
AAL 2 VBR (Video/Audio)
AAL 3 Connection-Oriented Data
AAL 4 Connectionless Data
AAL 5 Tailored for data communications
The ATM layer provides functions such as traffic control and congestion control.
Traffic control ensures that all cell flow is provided through the ATM network such that
the traffic contract is achieved. Congestion control provides mechanisms to avoid, detect
and recover from congestion. Congestion is the condition when the network load exceeds
the network design limits such that the traffic contract cannot be guaranteed. An
algorithm utilized at this layer for traffic control is the Leaky Bucket Algorithm. This
algorithm is analogous to a bucket (ATM cell queue) which has a hole in the bottom in
which the bucket contents leak (cell departure rate). Fluid is also poured into the top of
the bucket (cell arrival rate).
The physical layer can be implemented on numerous standardized physical
mediums. A common medium is OC-3 Synchronous Optical Network (SONET).
SONET’s basic unit is a 9x90 array of bytes called a frame. ATM cells are packaged on
19
to these frames on the physical medium. These frames are continuous, and if there is no
data to be sent, empty ATM cells are placed in the SONET frames. The physical layer is
synchronous.
OC refers to the speed of the SONET frames. The basic 51.840 Mb/s channel is
OC-1. OC-n is used to indicate that n SONET channels are being utilized. Therefore
OC-3 indicates that the underlying physical medium has a rate of 155.2 Mb/s.
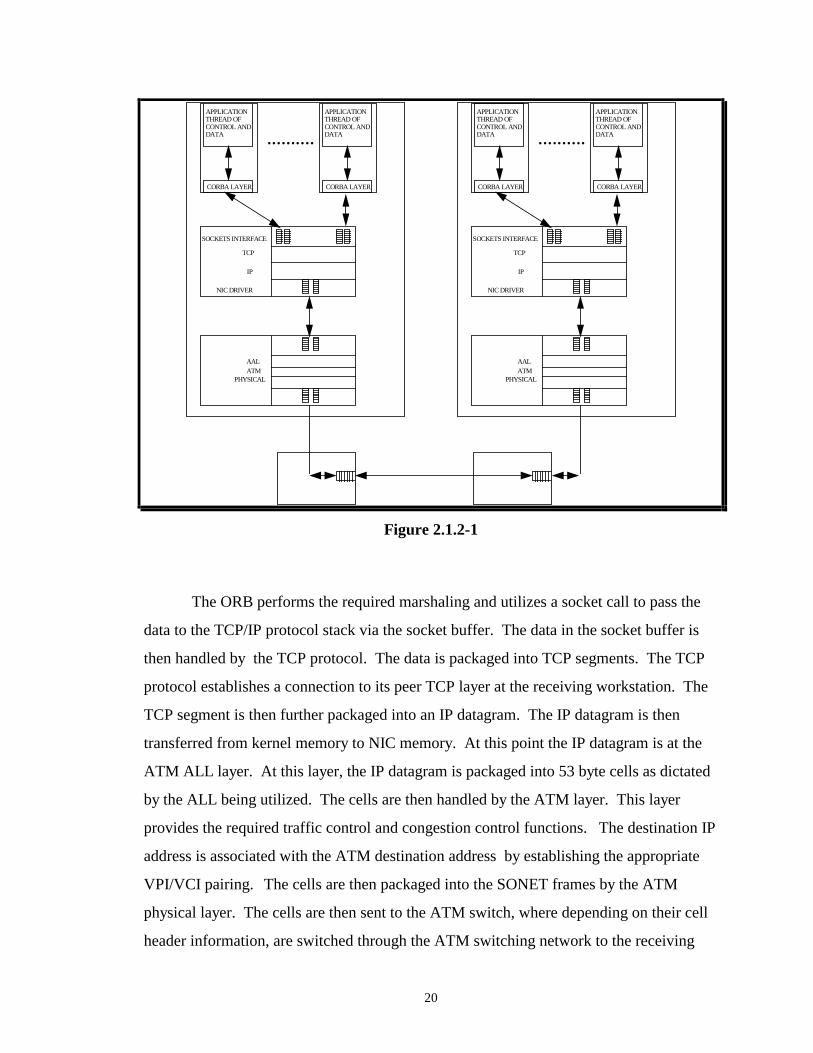
2.1.2 Message Communication Example
Figure 2.1.2-1 provides an illustration of the subsystem components. Initially,
when ready to send data, the sending application awaits to be scheduled by the scheduler.
Once this occurs, the application’s CORBA clients binds to the server object. This
binding results in the execution of the orbixd deamon, which in turn establishes a
connection between the CORBA client and remote server. The ORB then establishes a
proxy object in the client’s address space. Once the bind is complete, the orbixd deamon
enters a sleep mode. Once the kernel reschedules the client process, the client invokes a
server method to pass data. For the purpose of this example, it is assumed that the
method invocation passes a 1KByte array as an ‘in’ parameter and returns a 1 KByte
array. The functionality to support the method invocations is implemented in the client
stub and server skeleton.
Message Flow
20
SOCKETS INTERFACE
TCP
IP
NIC DRIVER
..........
AAL ATM
PHYSICAL
APPLICATIONTHREAD OF CONTROL ANDDATA
CORBA LAYER
APPLICATIONTHREAD OF CONTROL ANDDATA
CORBA LAYER
SOCKETS INTERFACE
TCP
IP
NIC DRIVER
..........
AAL ATM
PHYSICAL
APPLICATIONTHREAD OF CONTROL ANDDATA
CORBA LAYER
APPLICATIONTHREAD OF CONTROL ANDDATA
CORBA LAYER
Figure 2.1.2-1
The ORB performs the required marshaling and utilizes a socket call to pass the
data to the TCP/IP protocol stack via the socket buffer. The data in the socket buffer is
then handled by the TCP protocol. The data is packaged into TCP segments. The TCP
protocol establishes a connection to its peer TCP layer at the receiving workstation. The
TCP segment is then further packaged into an IP datagram. The IP datagram is then
transferred from kernel memory to NIC memory. At this point the IP datagram is at the
ATM ALL layer. At this layer, the IP datagram is packaged into 53 byte cells as dictated
by the ALL being utilized. The cells are then handled by the ATM layer. This layer
provides the required traffic control and congestion control functions. The destination IP
address is associated with the ATM destination address by establishing the appropriate
VPI/VCI pairing. The cells are then packaged into the SONET frames by the ATM
physical layer. The cells are then sent to the ATM switch, where depending on their cell
header information, are switched through the ATM switching network to the receiving
21
workstation. The reverse process is then accomplished at the receiving workstation. The
53 byte cells are combined into IP datagrams which are copied from NIC memory to
kernel memory. The IP datagrams are then decomposed into the TCP segments. TCP
performs error checking functions and if required will request any missing or corrupted
segments be resent. The TCP data is then redirect to the proper ports for applications to
utilize. When the CORBA server application is scheduled on the receiving workstation’s
CPU, the application can copy the socket data (i.e. the method’s ‘in’ parameter) to its user
space. The method executes and the CORBA run-time system fills the socket buffer
with the return data from the method invocation. This return data is sent to the original
host utilizing the same mechanisms that were just described.
2.2 Real-Time Considerations
2.2.1 Real-Time Overview
Real-time systems are those systems which are constrained by time requirements.
A common time constraint is the concept of a deadline. A deadline is the time in which a
task is to be completed. As previoulsy stated, if the system is termed hard real-time,
tasks always have to complete before deadlines. If the task does not complete before the
deadline, a catastrophic event occurs. For soft real-time systems, if the deadline is
missed, no catastrophic event occurs, although the resulting computation may have a
degraded value.
For a system to be hard real-time, its run-time behavior needs to be predictable. If
the system’s behavior is not predictable, it is not possible to guarantee that the system
will be able to meet its deadlines. Therefore, a nonpredictable system can not be
considered hard real-time. However, the system may be classified as soft real-time.
A key concept in real-time theory is schedulability. Scheduling for real-time
systems is discussed in [4] and [6]. To meet deadlines, fast operation is not enough.
For a task to complete, it needs to be scheduled on system resources. If the resources are
not available in a timely fashion then timing constraints may be violated. Initial research
on real-time systems concentrated on the scheduling of tasks on the workstations CPUs.
Similar concepts can be applied to scheduling messages on system protocol stacks.
22
Scheduling research has resulted into two general types of scheduling: static scheduling
and dynamic scheduling.
In static scheduling, there is enough information about the system behavior to
perform scheduling a priori. To utilize static scheduling, the system operational states
need to be characterized a priori, which may be labor intensive. In addition, static
scheduling is inflexible, since run-time behavior can not be allowed to result in any states
other then the predefined operational states. Dynamic scheduling occurs during program
execution. Typically, dynamic scheduling is implemented by utilizing a priority-based
scheme for the scheduable tasks. In general, because of the disadvantages of static
scheduling, dynamic scheduling is preferable.
Scheduling can be further characterized as either pre-emptive or nonpre-emptive.
Pre-emptive scheduling, immediately replace the current task that is utilizing the
resource, with the higher priority task. Nonpre-emptive scheduling, the high priority task
waits until either the lower priority task completes or it times out.
2.2.2 Real-Time Considerations of COTS Based Messaging
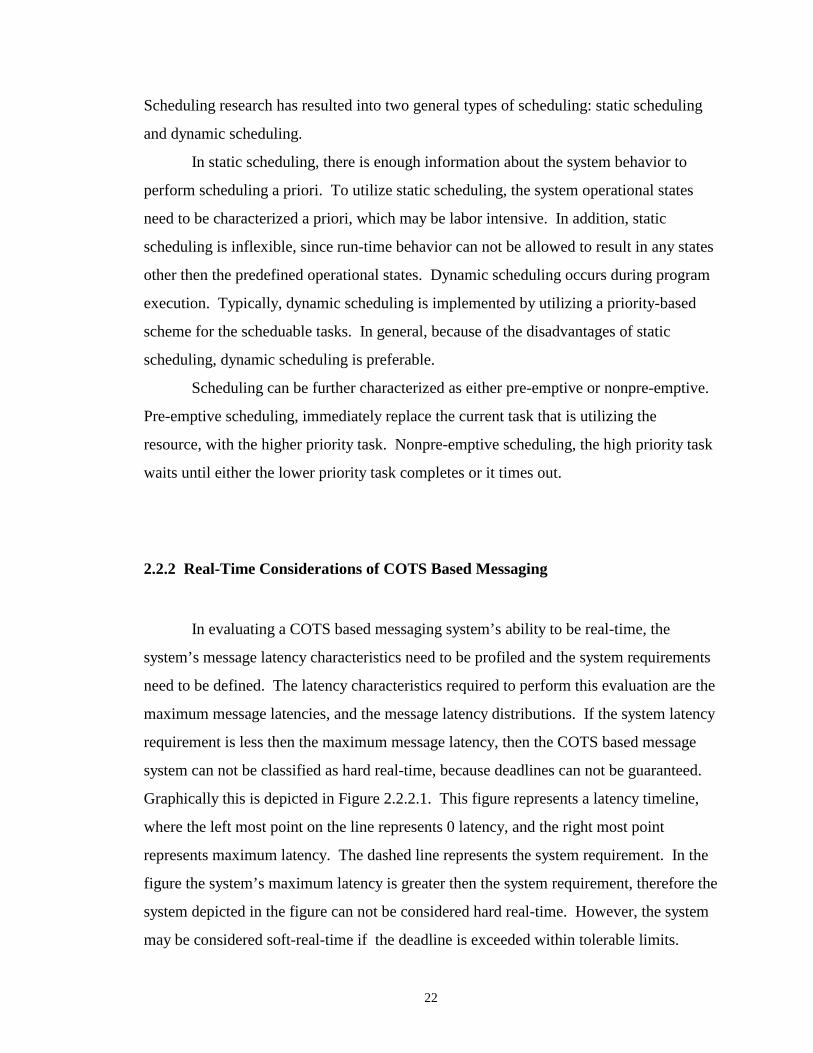
In evaluating a COTS based messaging system’s ability to be real-time, the
system’s message latency characteristics need to be profiled and the system requirements
need to be defined. The latency characteristics required to perform this evaluation are the
maximum message latencies, and the message latency distributions. If the system latency
requirement is less then the maximum message latency, then the COTS based message
system can not be classified as hard real-time, because deadlines can not be guaranteed.
Graphically this is depicted in Figure 2.2.2.1. This figure represents a latency timeline,
where the left most point on the line represents 0 latency, and the right most point
represents maximum latency. The dashed line represents the system requirement. In the
figure the system’s maximum latency is greater then the system requirement, therefore the
system depicted in the figure can not be considered hard real-time. However, the system
may be considered soft-real-time if the deadline is exceeded within tolerable limits.
23
These limits would need to be specified. In addition, the latency distribution of the
COTS system would need to be characterize inorder to evaluate if the system meets the
specified soft-real-time requirements.
minlatency
avglatency
maxlatency
SYSTEMREQUIREMENT
SOFT REAL-TIME
Figure 2.2.2-1
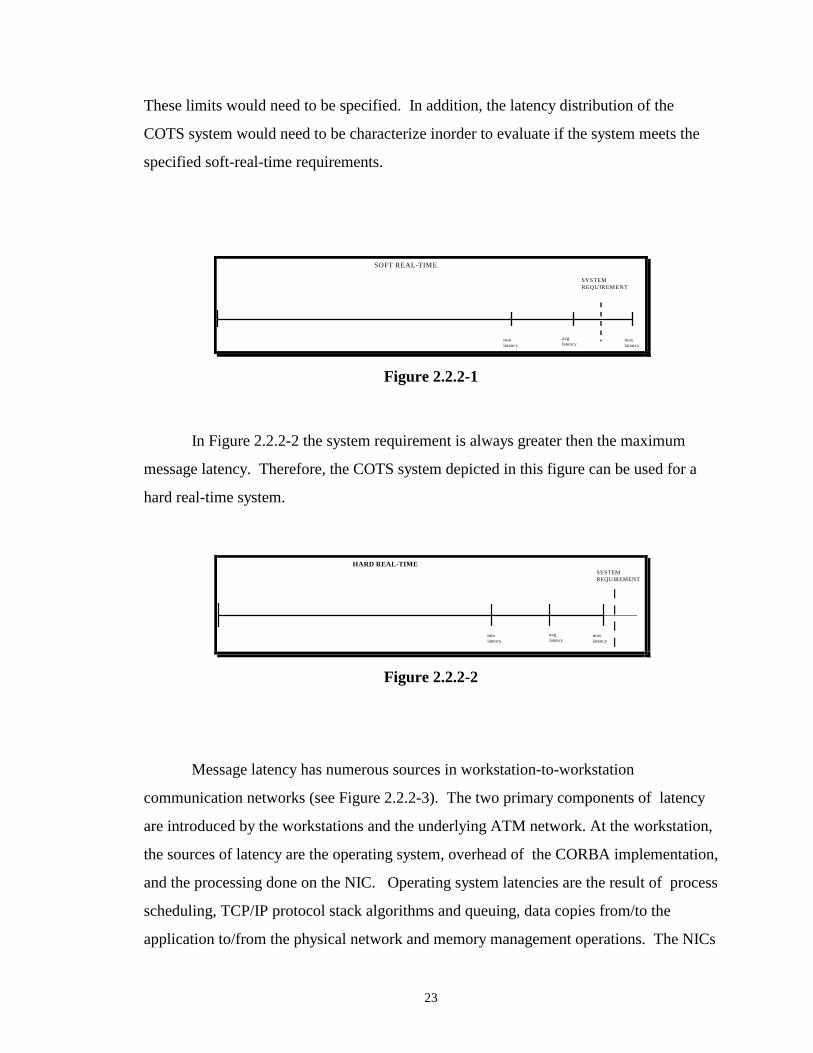
In Figure 2.2.2-2 the system requirement is always greater then the maximum
message latency. Therefore, the COTS system depicted in this figure can be used for a
hard real-time system.
minlatency
avglatency
maxlatency
HARD REAL-TIMESYSTEMREQUIREMENT
Figure 2.2.2-2
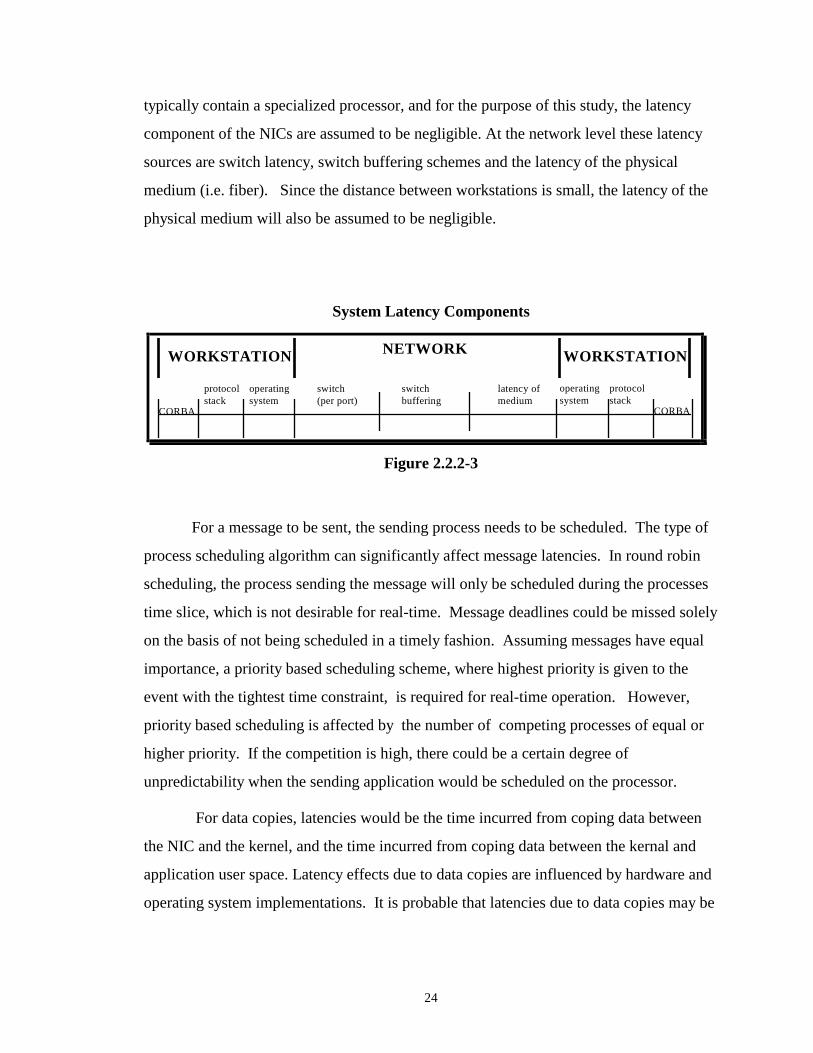
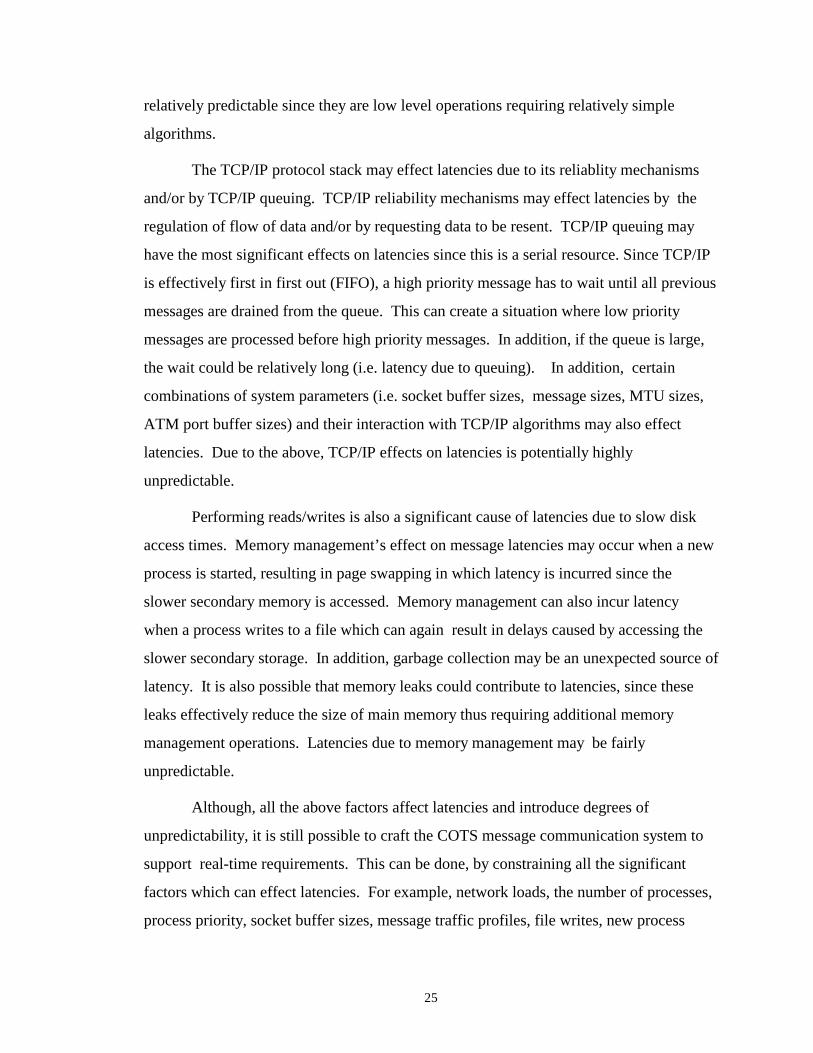
Message latency has numerous sources in workstation-to-workstation
communication networks (see Figure 2.2.2-3). The two primary components of latency
are introduced by the workstations and the underlying ATM network. At the workstation,
the sources of latency are the operating system, overhead of the CORBA implementation,
and the processing done on the NIC. Operating system latencies are the result of process
scheduling, TCP/IP protocol stack algorithms and queuing, data copies from/to the
application to/from the physical network and memory management operations. The NICs
24
typically contain a specialized processor, and for the purpose of this study, the latency
component of the NICs are assumed to be negligible. At the network level these latency
sources are switch latency, switch buffering schemes and the latency of the physical
medium (i.e. fiber). Since the distance between workstations is small, the latency of the
physical medium will also be assumed to be negligible.
System Latency Components
switch (per port)
switchbuffering
latency ofmedium
CORBA
protocolstack
operatingsystem
CORBA
protocolstack
operatingsystem
WORKSTATION WORKSTATIONNETWORK
Figure 2.2.2-3
For a message to be sent, the sending process needs to be scheduled. The type of
process scheduling algorithm can significantly affect message latencies. In round robin
scheduling, the process sending the message will only be scheduled during the processes
time slice, which is not desirable for real-time. Message deadlines could be missed solely
on the basis of not being scheduled in a timely fashion. Assuming messages have equal
importance, a priority based scheduling scheme, where highest priority is given to the
event with the tightest time constraint, is required for real-time operation. However,
priority based scheduling is affected by the number of competing processes of equal or
higher priority. If the competition is high, there could be a certain degree of
unpredictability when the sending application would be scheduled on the processor.
For data copies, latencies would be the time incurred from coping data between
the NIC and the kernel, and the time incurred from coping data between the kernal and
application user space. Latency effects due to data copies are influenced by hardware and
operating system implementations. It is probable that latencies due to data copies may be
25
relatively predictable since they are low level operations requiring relatively simple
algorithms.
The TCP/IP protocol stack may effect latencies due to its reliablity mechanisms
and/or by TCP/IP queuing. TCP/IP reliability mechanisms may effect latencies by the
regulation of flow of data and/or by requesting data to be resent. TCP/IP queuing may
have the most significant effects on latencies since this is a serial resource. Since TCP/IP
is effectively first in first out (FIFO), a high priority message has to wait until all previous
messages are drained from the queue. This can create a situation where low priority
messages are processed before high priority messages. In addition, if the queue is large,
the wait could be relatively long (i.e. latency due to queuing). In addition, certain
combinations of system parameters (i.e. socket buffer sizes, message sizes, MTU sizes,
ATM port buffer sizes) and their interaction with TCP/IP algorithms may also effect
latencies. Due to the above, TCP/IP effects on latencies is potentially highly
unpredictable.
Performing reads/writes is also a significant cause of latencies due to slow disk
access times. Memory management’s effect on message latencies may occur when a new
process is started, resulting in page swapping in which latency is incurred since the
slower secondary memory is accessed. Memory management can also incur latency
when a process writes to a file which can again result in delays caused by accessing the
slower secondary storage. In addition, garbage collection may be an unexpected source of
latency. It is also possible that memory leaks could contribute to latencies, since these
leaks effectively reduce the size of main memory thus requiring additional memory
management operations. Latencies due to memory management may be fairly
unpredictable.
Although, all the above factors affect latencies and introduce degrees of
unpredictability, it is still possible to craft the COTS message communication system to
support real-time requirements. This can be done, by constraining all the significant
factors which can effect latencies. For example, network loads, the number of processes,
process priority, socket buffer sizes, message traffic profiles, file writes, new process

26
startups are all potentially constrainable. If the system is well understood and all the
required factors are constrained, then the system can be crafted to support hard real-time
requirements. If all the factors are not constrainable, then the crafted system may only be
able support soft real-time requirements.
2.3 Related Research Efforts
There are several areas that are documented in the literature which relate to the
study performed by this thesis. These areas either provide additional insight on the work
accomplished by the thesis or provide interesting concepts, such as, QoS, on how this
thesis can be extended. There are four research areas of particular interest: message
passing in real-time distributed networks, the effects of the TCP/IP protocol stack on
real-time performance, the utilization of system Quality of Service (QoS) parameters to
guarantee resources and the real-time aspects of CORBA. In addition, it is of interest to
note the real-time research for the traditional COTS networking technologies (FDDI,
ethernet, etc.).
Distributed Real-Time Networks. Research directly related to real-time messaging in
distributed systems is of particular interest. The ARTS distributed system described in
[9] supports the concept of message priority. ARTS utilizes the Real-Time Protocol
(RTP) protocol. RTP supports message prioritization and utilizes a Time Fence
Mechanism to flag any message time violations. In addition, ARTS is careful to ensure
that priority inversions do not occur during message communication.
TCP/IP Research. There is a body of literature that discusses issues with TCP/IP over
ATM. A study describe in [5] shows that TCP/IP performance can be significantly
improved if ATM switch buffers are increased in size for the UBR traffic contract. A
study identifying a configuration for a deadlock condition with TCP/IP over ATM is
identified in [2].
27
System QoS Research. Unlike traditional network technologies (Ethernet, Token Ring,
FDDI), ATM supports QoS parameters for its virtual connections. With ATM QoS
parameters, various types of information can be simultaneously supported (video, audio,
data) by the network. Systems utilizing a system-level QoS concept, have a form of
admission control in which it is first determine if there are enough system resources
available to support a connection for the specified QoS parameters. If there are resources
available to make the connection for the given QoS, then the connection is granted. This
is seen in GRAMS [8], which is an ATM based distributive system which utilizes a
distributed multimedia server. The QoS Broker described in [14] also utilizes similar
concept for the OS and ATM resources. The Chorus System identified in [3] also utilizes
QoS to establish a connection between communicating workstations. In this system, QoS
is system based, and is used to control CPU scheduling, workstation memory
management, in addition to ATM resource allocation. The required QoS is specified via
an API. Other work, such as, [7] has specified a set of QoS parameters. These
parameters are implemented at the transport layer.
Research on Real-Time CORBA. A framework identifying the syntax, semantics and
support required to support real-time distributed computing utilizing a CORBA based
system is identified in [1]. In this framework, timing constraints are made available to
applications by the utilization of CORBA context declarations. This work is further
expanded in [18] by providing additional implementational details. Research on
CORBA-level performance “bottlenecks” are identified in [19]. These results are similar
to the results derived by this thesis, and will be further addressed in Section 3.
Real-Time Research on Traditional Networking Technologies. It is worthy to note
some of the previous work concerning the real-time aspects of traditional network
technologies. Unlike ATM, traditional network technologies are limited in that they
shared the same physical medium. This physical medium is a shared resource in which is
28
either arbitrated by a token or by sensing a “busy signal”. The real-time limitations of
Token Ring and Ethernet are simulated in [10]. Research has been accomplish in how to
make an Ethernet based system capable of being real-time. A Window Protocol using
real-time constraints for Ethernet is identified in [11]. Another approach [12] is to use a
token passing scheme implemented at the application level. For time token medium
access protocol, such as FDDI, a scheme is identified in [13] which message deadlines
may be guaranteed.
29
3.0 Measurements
3.1 Measurement Background
The primary objectives of the measurements are to obtain the latency
characteristics of the workstation and the underlying ATM network. These measurements
are to be used to establish a profile of the latency characteristics of the data message
communication components. These characteristics will be utilized in the implementation
of the latency estimation server, which is described in Section 4.
In order to characterize the latencies of the various system components, the
measurements were taken at various layers in the COTS network message communication
paradigm: the CORBA-level layer, the underlying TCP/IP layer and the ATM network.
The CORBA-level measurements are ultimately the most meaningful
measurements with respect to this work because they reflect what the applications
actually experience. I took the CORBA-level measurements by utilizing a round-trip
lanency measurement scheme between a CORBA-level based client and server. The
TCP/IP socket measurements also utilized a round-trip latency measurement scheme. By
taking the difference between the CORBA-level measurements and the socket
measurements, I identified the CORBA-level latency characteristics. To further identify
the latency components, I took ATM network measurements. By taking the difference
between the socket-level measurements and the ATM network measurements, I
charactierized the latencies for both the workstation component and the latencies of the
network. The network measurements were taken by utilizing the ADTECH network
analyzer [20]. This analyzer is able to generate/receive full bandwidth ATM cell traffic
streams. Since the analyzer both generates and receives the data stream, (i.e. the
generator and receiver are synchronized) the analyzer it is able to provide statistics such
as inter-cell arrival time and cell delay transfer time.
30
3.2 CORBA Application-to-Application Latency Measurements
3.2.1 Measurement Configurations
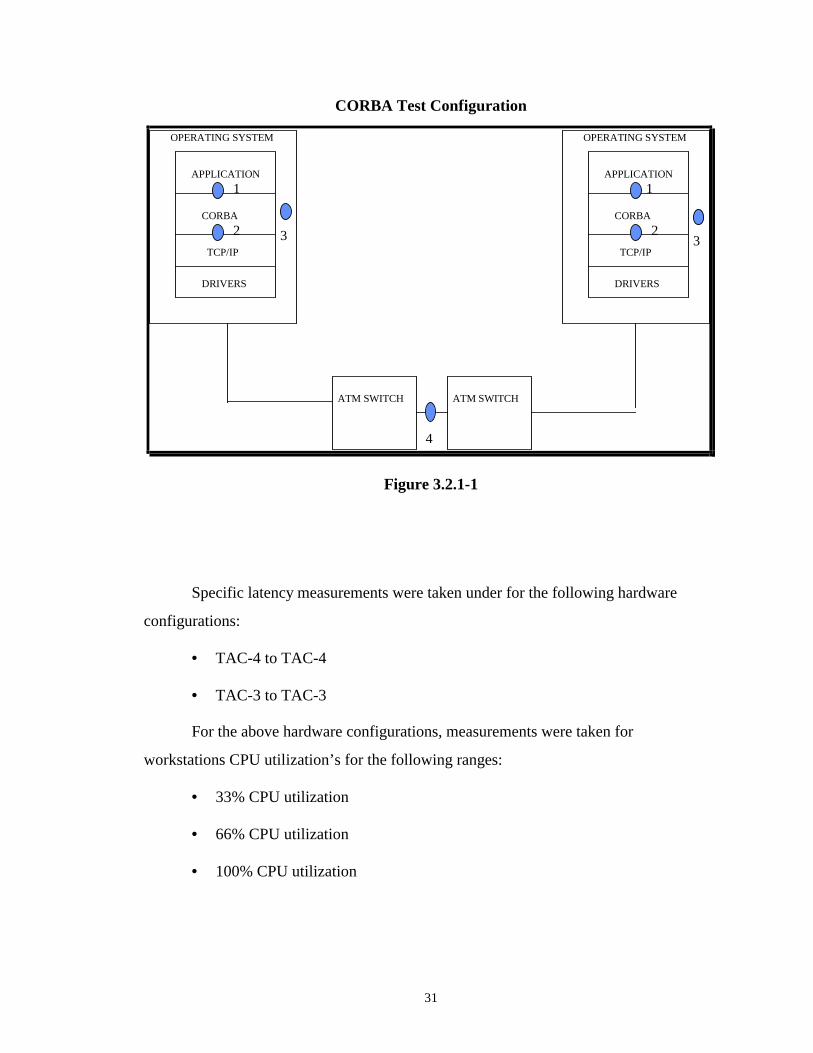
The configuration setup for which the measurements were taken are shown in
Figure 3.2.1-1. This configuration consists of two workstations, each containing a
CORBA-based envriornment over a TCP/IP protocol stack, each of which is over ATM
drivers. The workstations are interconnected by an ATM network. The ATM network
consists of two switches, connected by one OC-3 port. The workstations in this test
configuration are connected to different ATM switches.
The workstations in this configuration (depending on the test cases) were either
TAC-3 or TAC-4 workstations. The TAC-3 workstation consists of a HP 755 processor
running with a HP-UX 9.01 operating system. The TAC-3 used Iona Technologies Orbix
2.0.1 for the CORBA implementation. The TAC-4 workstation consists of a HP 770
processor running with a HP-UX 10.0 operating system. The TAC-4 used Iona
Technologies Orbix 2.0 for the CORBA implementation. The ATM NICs and drivers
for both the TAC-3 and TAC-4 workstation configuration are also HP products. FORE
Systems ASX-1000 ATM switches were used for the underlying network.
Figure 3.2.1-1 depicts the measurement points of interest (#1,#2 and #3 in the
figure). The Iona CORBA-level client/server measurements taken are represented by
measurement point #1. The units of measurement for measurement point #1 are
milliseconds. Measurement point #2 in the figure depicts the operating system CPU
utilization. The units of measurement for measurement point #2 are the percentage of
utilized time slices. Measurement point #3 represents the loading of the intermediate port
between the ATM switched. The units of measurement for measurement point #3 in a
non-load state are in microseconds. The ATM switch for both CORBA-level and
TCP/IP-level application-to-application measurements is in a non-load state.
31
CORBA Test Configuration
ATM SWITCH ATM SWITCH
APPLICATION
CORBA
TCP/IP
DRIVERS
OPERATING SYSTEM
1APPLICATION
CORBA
TCP/IP
DRIVERS
OPERATING SYSTEM
1
33
4
22
Figure 3.2.1-1
Specific latency measurements were taken under for the following hardware
configurations:
• TAC-4 to TAC-4
• TAC-3 to TAC-3
For the above hardware configurations, measurements were taken for
workstations CPU utilization’s for the following ranges:
• 33% CPU utilization
• 66% CPU utilization
• 100% CPU utilization
32
CPU utilization was recorded by HP-UX’s sar and top utilities. These utilities
provide average CPU utilization’s over selected time intervals. The utilization numbers
are the percentage of idle schedulable time slices.
Latency measurements for the various workstation sender CPU utilization and
receiver CPU utilizations were recorded for each sender/receiver combination. Latency
measurements were taken for 64 byte, 128 byte, 256 byte, 512 byte, 1 kbyte, 2 kbyte, 4
kbyte and 8 kbyte message sizes. These sizes represent the likely range of NSSN C3I
System messages.
The measurement tables for each message size contain nine possible CPU loading
combinations. Since there are several combinations that have the same loading
configuration except for the server/client being reversed, only six unique sets of
measurements are really needed for any given message size. Table 3.2.1-2 illustrates the
loading configurations that I used to obtain the measurements. The load programs were
socket-based programs that transmitted a constant stream of 1 Kbyte messages utilizing
TCP/IP between the workstations. The rate in which the 1 Kbyte messages were sent was
controllable, as were the socket-buffer sizes. For the case in which each workstation was
utilized between 0-33% CPU, the load test drivers were not required since this was the no
load state. The load test drivers used to obtain the various CPU load states for each
message size is shown in Table 3.2.1-1. It should be noted that the round-trip
measurement driver and the loading drivers were at the same user priorities. Maximum
socket-buffer sizes were utilized by the load drivers in attempt to maximize the effect of
TCP/IP queuing on message latencies. I speculate that using maximum socket-buffer
sizes would result in larger TCP/IP queue sizes. Therefore, there is likelihood of
increased message delay, since messages would be required to wait longer for the larger
TCP/IP queues to “drain”.
Port Loading Table

33
WORKSTATION A WORKSTATION B LOAD DRIVER CONFIGURATION (load drivers utilized)
0-33% 0-33% N/A
0-33% 34-66% load drivers 3
0-33% 67-100% load drivers 3
34-66% 34-66% load drivers 1 & 2
34-66% 67-100% load drivers 1 & 2 & 3
67-100% 67-100% load drivers 1 & 2
Table 3.2.1-1
Latency effects due to memory management were kept to a minimum since the
same applications were constantly executed (i.e. page swapping was at a minimum) and
since no file writes were accomplished by the test applications during the measurements.
Measurement results for average and maximum latencies are provided in
Appendix A. Measurements were taken to a 1 microsecond resolution. For each
measurement configuration, each individual latency measurement was grouped into one
of 100, 1 millisecond “bins”. This grouping provided a latency distribution for the
measurement configuration since it showed the measurement range charactersistics of the
latency measurement samples. For selected key configurations, this latency distrubution
data is presented as a bar graph in later sections of this thesis. The bar graphs show the
number of measurements in each “bin” from 0 to 100 millisecond. The latency
distribution data is also utilized by the Latency Server which will be described in Section
4.
For each CPU measurement combination, 10K samples were taken for each
message size. For the TAC-4 configurations when both workstations had a CPU
utilization between 0-33% loaded (lightly loaded), an additional 100K samples were
taken for each message size. More samples were taken for the lightly loaded conditions
since these measurements were used as a baseline case to compare average message
latency, maximum message latency, and latency distributions of the CORBA-level and of
the TCP/IP-level. In addition, for the TAC-4 configuration, to further facilitate the
34
comparisons, 100K samples were taken for the 256 byte message size when both
workstations had a CPU utilization between 67% - 100% loaded (heavily loaded). In
general, there was no significant differences in results between taking 10K vs 100K
samples. This can be seen for the average latency times (1.365 ms for the 10k sample
case vs 1.385 ms for the 100k sample case for the light-load configuration for the 256
Byte message) and very similar latency measurement distributions (i.e. for both the 10K
and 100K cases, 99.5% of the measurements were accomplished within 3 ms for the
heavily loaded condition).
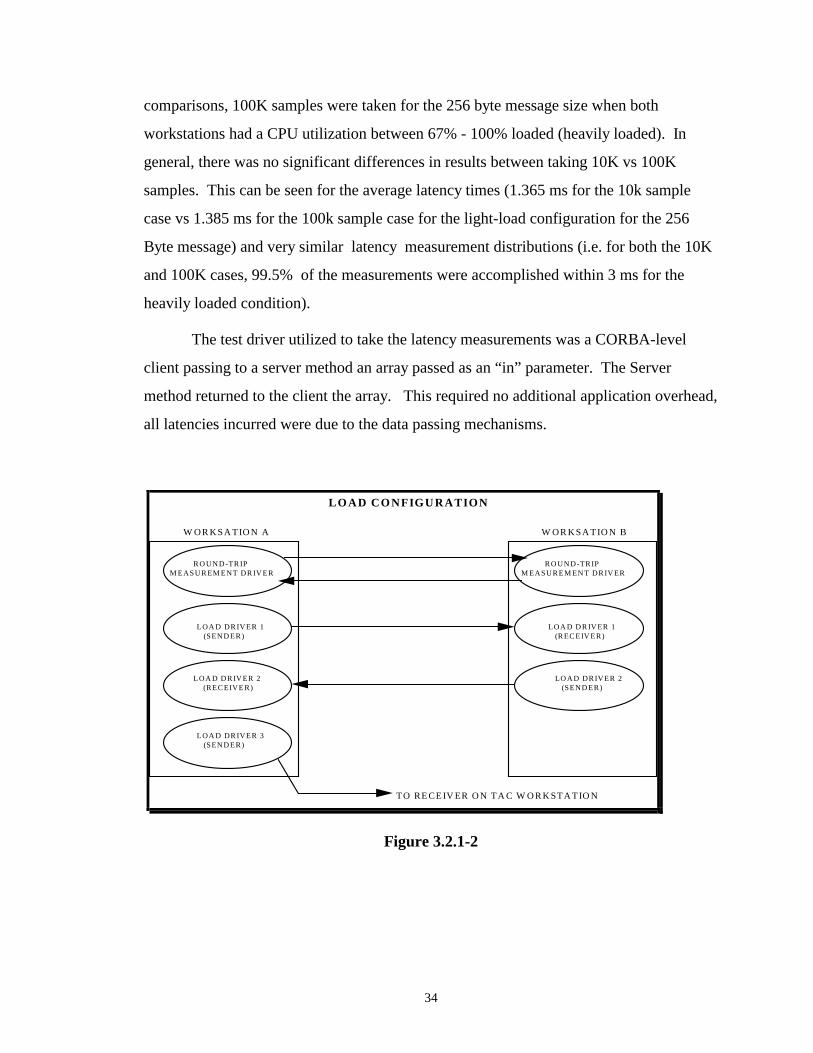
The test driver utilized to take the latency measurements was a CORBA-level
client passing to a server method an array passed as an “in” parameter. The Server
method returned to the client the array. This required no additional application overhead,
all latencies incurred were due to the data passing mechanisms.
R O UN D -TR IP M EASU R EM ENT DR IV ER
LOA D DR IVER 1 (SEN D ER)
R O UN D -TR IP M EASUR EM EN T DR IV ER
LOA D D R IV ER 1 (R EC EIV ER)
LO AD CO NFIGU RATION
LO A D DR IVER 2 (SEND ER)
LOA D D R IV ER 2 (REC EIVE R)
LOA D DR IVER 3 (SEN D ER)
TO RE CE IV ER O N TA C W O R K STA T IO N
W OR KSA TIO N A W OR KSA TIO N B
Figure 3.2.1-2
35
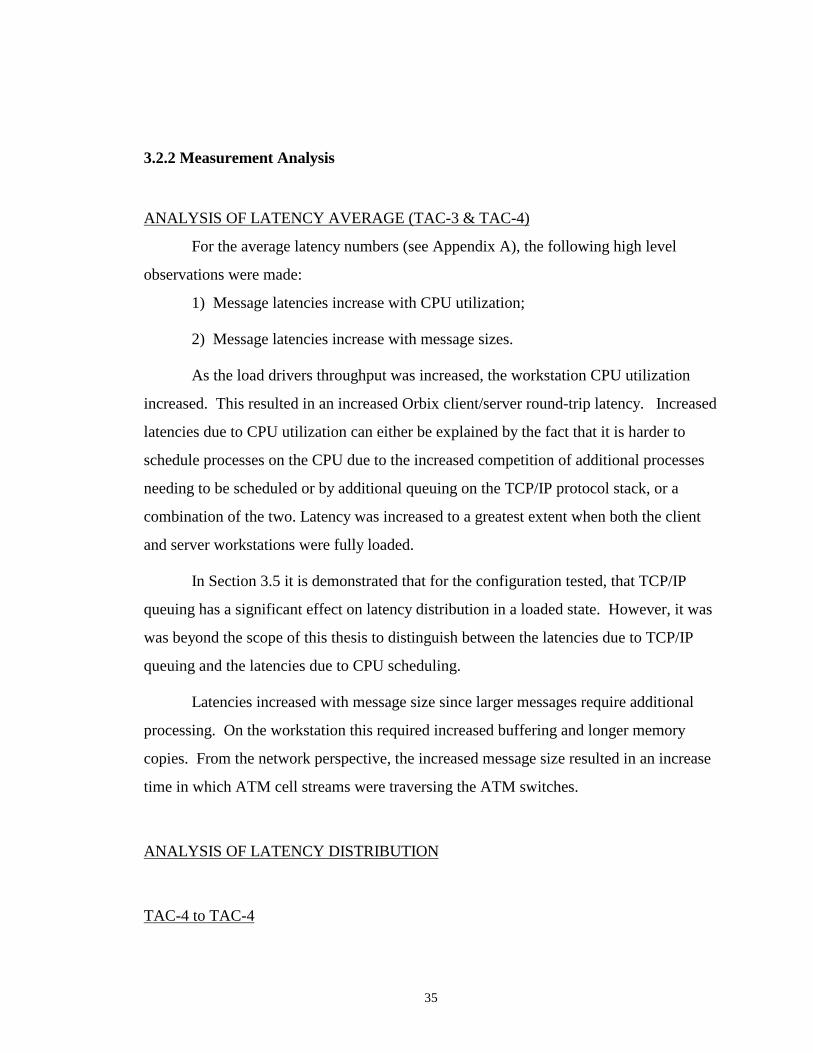
3.2.2 Measurement Analysis
ANALYSIS OF LATENCY AVERAGE (TAC-3 & TAC-4)
For the average latency numbers (see Appendix A), the following high level
observations were made:
1) Message latencies increase with CPU utilization;
2) Message latencies increase with message sizes.
As the load drivers throughput was increased, the workstation CPU utilization
increased. This resulted in an increased Orbix client/server round-trip latency. Increased
latencies due to CPU utilization can either be explained by the fact that it is harder to
schedule processes on the CPU due to the increased competition of additional processes
needing to be scheduled or by additional queuing on the TCP/IP protocol stack, or a
combination of the two. Latency was increased to a greatest extent when both the client
and server workstations were fully loaded.
In Section 3.5 it is demonstrated that for the configuration tested, that TCP/IP
queuing has a significant effect on latency distribution in a loaded state. However, it was
was beyond the scope of this thesis to distinguish between the latencies due to TCP/IP
queuing and the latencies due to CPU scheduling.
Latencies increased with message size since larger messages require additional
processing. On the workstation this required increased buffering and longer memory
copies. From the network perspective, the increased message size resulted in an increase
time in which ATM cell streams were traversing the ATM switches.
ANALYSIS OF LATENCY DISTRIBUTION
TAC-4 to TAC-4
36
For message up to 4 Kbytes, the maximum latency was 75 milliseconds. In this
case, the maximum latency appears to be unaffected by message size. Maximum
latencies were, in general, least when both CPU utilizations were in the low load
condition (33% or less). For all other CPU states, maximum latencies generally appeared
to be higher than the low-load condition, and unaffected by other CPU utilization
combinations or message sizes. The reason that maximum latencies were lower in the
low load condition was that the round-trip latency driver process was continuously
scheduled on the CPU resource because there were no competing user-level application
processes.
Maximum latencies for 8KByte messages were consistently as high as 200 ms.
These maximum latencies always occurred when the latency measurement driver is first
invoked. In addition, this maximum latency always occurred within the first two
samples of the measurement set. Other than these first two samples, the latency
distribution is similar to that of the latency distribution of the smaller size messages.
Since this anomaly did not occur in the TAC-3 configuration, I assume that there is a
quirk with Orbix 2.0 or HP-UX-10.0.
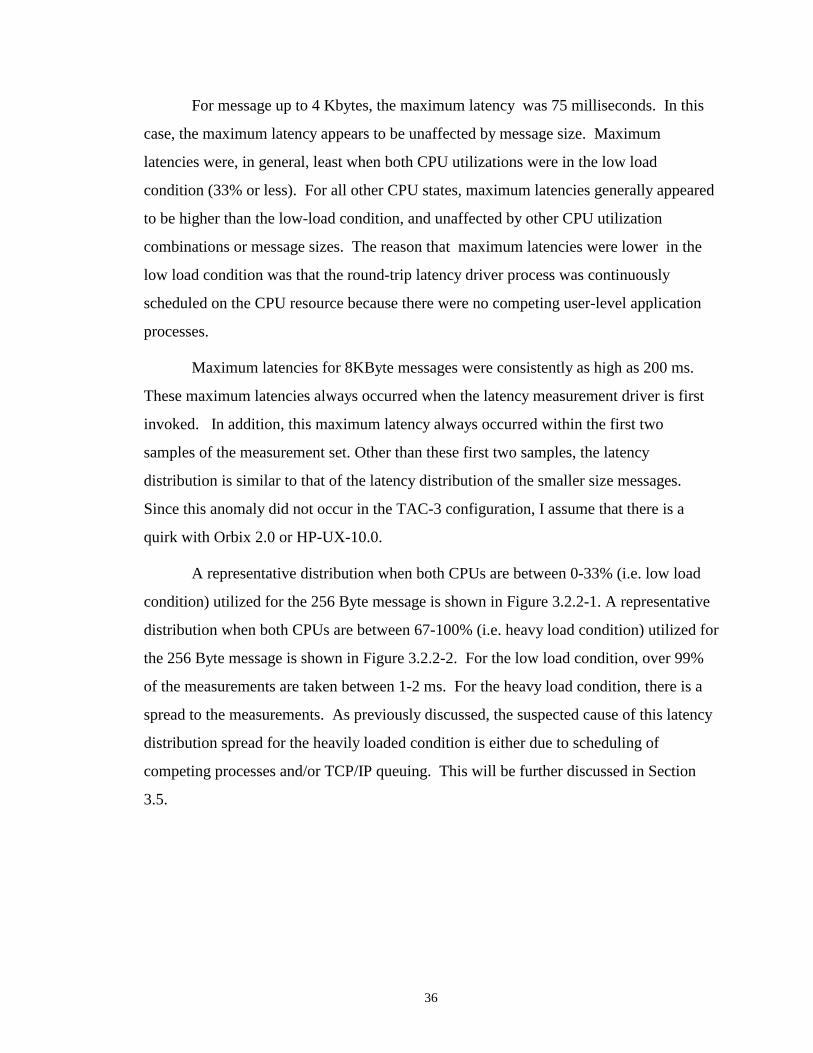
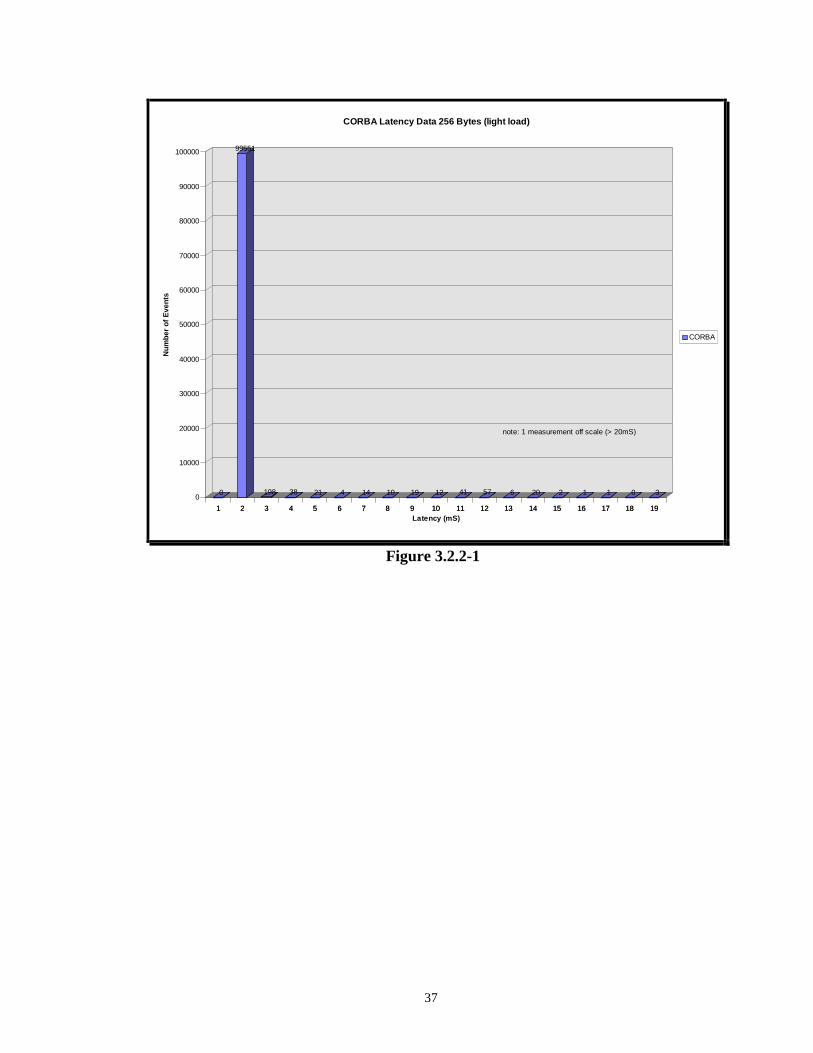
A representative distribution when both CPUs are between 0-33% (i.e. low load
condition) utilized for the 256 Byte message is shown in Figure 3.2.2-1. A representative
distribution when both CPUs are between 67-100% (i.e. heavy load condition) utilized for
the 256 Byte message is shown in Figure 3.2.2-2. For the low load condition, over 99%
of the measurements are taken between 1-2 ms. For the heavy load condition, there is a
spread to the measurements. As previously discussed, the suspected cause of this latency
distribution spread for the heavily loaded condition is either due to scheduling of
competing processes and/or TCP/IP queuing. This will be further discussed in Section
3.5.
37
1 2 3 4 5 6 7 8 9 10 11 12 13 14 15 16 17 18 19
0
99551
198 38 21 4 14 10 19 12 41 57 6 20 2 1 1 0 30
10000
20000
30000
40000
50000
60000
70000
80000
90000
100000
Nu
mb
er o
f E
ven
ts
1 2 3 4 5 6 7 8 9 10 11 12 13 14 15 16 17 18 19Latency (mS)
CORBA Latency Data 256 Bytes (light load)
CORBA
note: 1 measurement off scale (> 20mS)
Figure 3.2.2-1
38
1 2 3 4 5 6 7 8 9 10 11 12 13 14 15 16 17 18 19
0
3846
12470
8672
28574
35398
47193538
2059487 147 31 18 17 11 5 5 1 1
0
5000
10000
15000
20000
25000
30000
35000
40000
Nu
mb
er o
f E
ven
ts
1 2 3 4 5 6 7 8 9 10 11 12 13 14 15 16 17 18 19Latency (mS)
CORBA Latency Data 256 Bytes (heavily loaded)
CORBA
note: 1 measurement off scale (> 20mS)
Figure 3.2.2-2
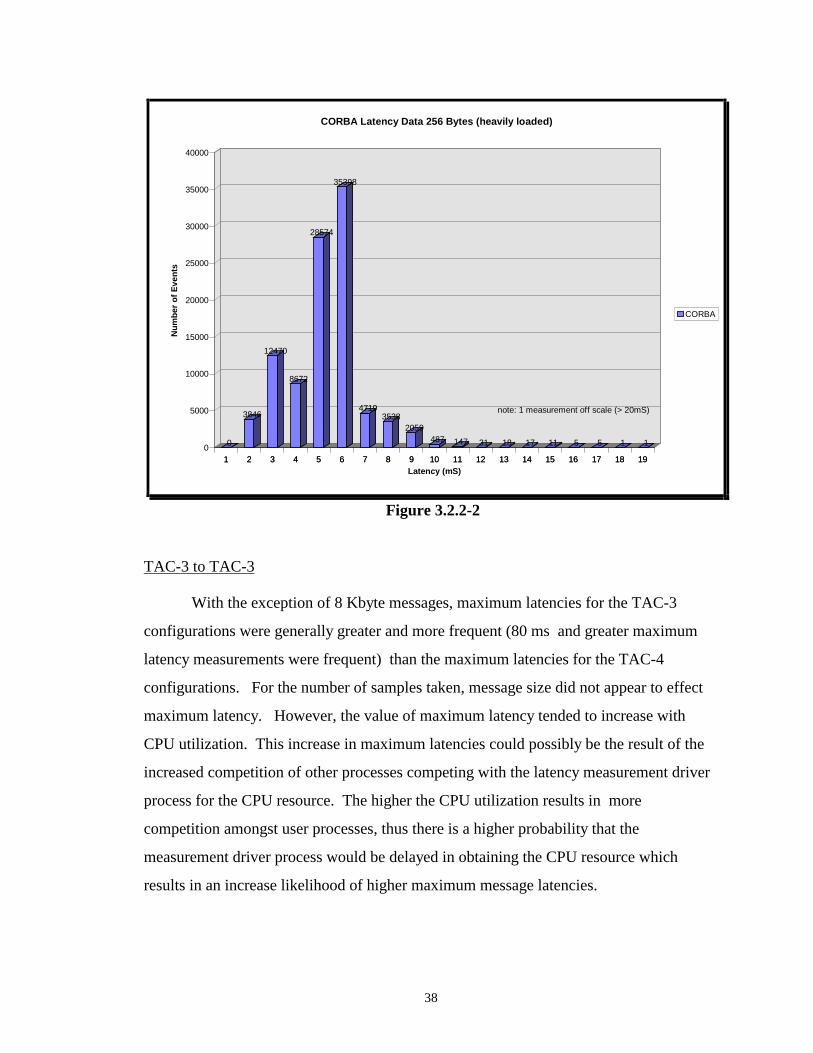
TAC-3 to TAC-3
With the exception of 8 Kbyte messages, maximum latencies for the TAC-3
configurations were generally greater and more frequent (80 ms and greater maximum
latency measurements were frequent) than the maximum latencies for the TAC-4
configurations. For the number of samples taken, message size did not appear to effect
maximum latency. However, the value of maximum latency tended to increase with
CPU utilization. This increase in maximum latencies could possibly be the result of the
increased competition of other processes competing with the latency measurement driver
process for the CPU resource. The higher the CPU utilization results in more
competition amongst user processes, thus there is a higher probability that the
measurement driver process would be delayed in obtaining the CPU resource which
results in an increase likelihood of higher maximum message latencies.
39
It is interesting to note that, other than the low-load CPU combination, the TAC-
4 did not exhibit the same behavior. Possibly, if more measurement samples were taken
for each loading TAC-4 configuration (i.e. 1 million), a correlation between maximum
latency and CPU utilization could be established. The reason for this would be the same
as for the TAC-3 configuration: the average increased run-time added by Orbix may
result in more required clock ticks, which increases the liklihood of the application
process being pre-empted. However, it appears that the effect (if there is one) of CPU
loading on maximum CORBA-level latencies for the TAC-4 configuration is
signaficantly less than that of the TAC-3 configuration. This may be the result of the
TAC-3 being a slower machine than the TAC-4. There is less work accomplished during
a TAC-3 time slice versus a TAC-4 time slice. The result of this experiment is that the
test driver processes need to be scheduled for more time slices for the TAC-3 than the
TAC-4. Therefore, maximum message latencies are generally greater for the TAC-3
versus than the TAC-4.
Latency distributions for the TAC-3 configurations were similar to the latency
distributions of the TAC-4 configurations. However, it should be noted that the 200 ms
maximum latency for 8KByte messages was not seen with the TAC-3 configuration.
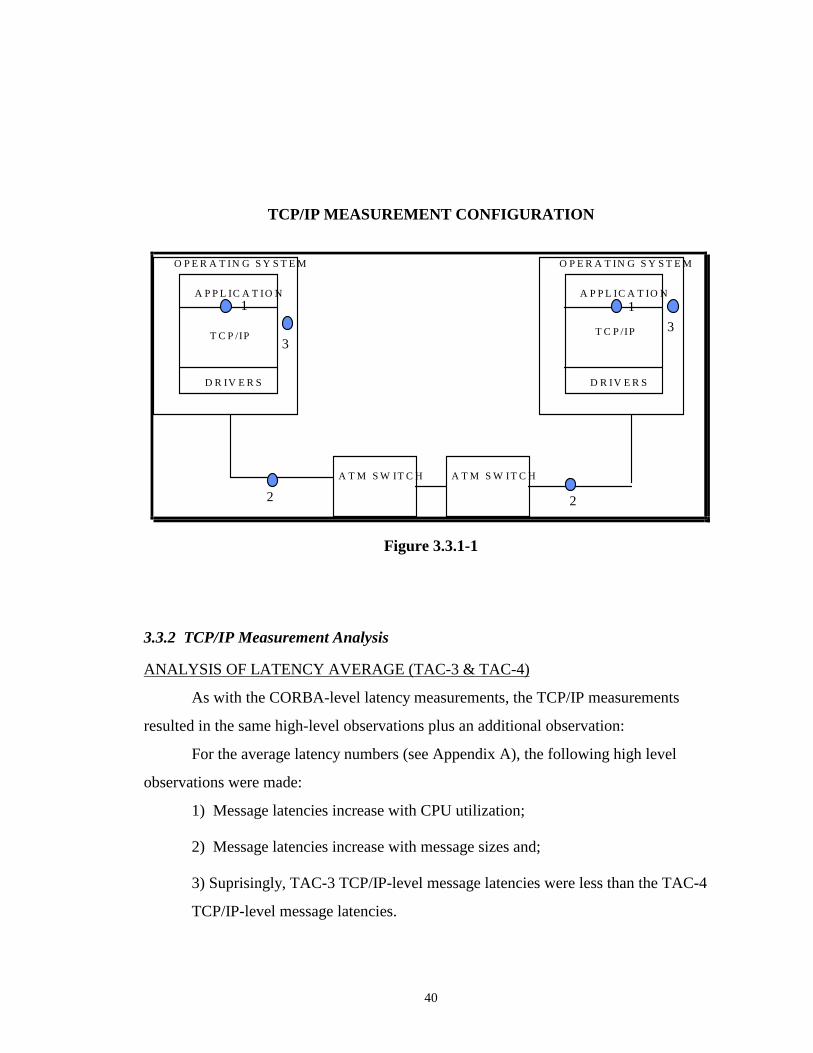
3.3 Application-to-Application Measurements Utilizing TCP/IP
3.3.1 TCP/IP Measurement Setup
Figure 3.3.1-1 identifies the test configuration utilized to obtain the TCP/IP-level
measurements. The only difference between Figure 3.3.1-1 and the Figure identifying the
CORBA-level measurement configuration (Figure 3.2.1-1), is that the CORBA-level
layer is removed. The TCP/IP-level measurements were taken by test applications at
point #1 on Figure 3.3.1-1. The measurement methodology and configurations for the
TCP/IP-level measurements were the same as the CORBA-level measurements so that
direct comparison between CORBA-level and TCP/IP-level could be made.
Measurement results for average, and maximum latencies are provided in Appendix A.
40
TCP/IP MEASUREMENT CONFIGURATION
A P P L IC A T IO N
T C P /IP
D R IV E R S
O P E R A T IN G S Y S T E M
A P P L IC A T IO N
T C P /IP
D R IV E R S
O P E R A T IN G S Y S T E M
A T M S W IT C H A T M S W IT C H
1 1
2 2
33
Figure 3.3.1-1
3.3.2 TCP/IP Measurement Analysis
ANALYSIS OF LATENCY AVERAGE (TAC-3 & TAC-4)
As with the CORBA-level latency measurements, the TCP/IP measurements
resulted in the same high-level observations plus an additional observation:
For the average latency numbers (see Appendix A), the following high level
observations were made:
1) Message latencies increase with CPU utilization;
2) Message latencies increase with message sizes and;
3) Suprisingly, TAC-3 TCP/IP-level message latencies were less than the TAC-4
TCP/IP-level message latencies.
41
The explanation for the first two observations are the same as for the CORBA-
level measurements. Increased latencies due to CPU utilization can either be explained
by the fact that it is harder to schedule processes on the CPU due to the increased
competition of additional processes needing to be scheduled or by additional queuing on
the TCP/IP protocol stack, or a combination of the two. Latency was increased to a
greatest extent when both the client and server workstations were fully loaded.
Latencies increased with message size since larger messages require additional
processing. On the workstation this increased message size required increased buffering
and longer memory copies. From the network perspective, the increased message size
resulted in an increase time in which ATM cell streams were traversing the ATM
switches.
When compared to the Orbix client/server measurements, the average latencies of
the TAC-4 TCP/IP measurements, for the low-load conditions, are less than 1 ms smaller
then the TAC-4 Orbix measurements. For loaded conditions, the Orbix measurements
were generally no more then 1.5 ms greater than the TCP/IP measurements.
The TAC-4 is a faster machine than the TAC-3. The TAC-4 is a120 Mhz
machine rated at 176 Million of Instructions per Second (MIPS) while the TAC-3 is a 100
Mhz rated at 124 MIPS. However, the TAC-3 TCP/IP latencies were consistently less
then the TAC-4 TCP/IP message latencies. In addition, from previous testing efforts[21]
it has been demonstrated that the actual throughput between two TAC-3 machines was
greater than the throughput between two TAC-4 machines. The TAC-3 and TAC-4 have
the same backplane, NIC and comparable memory components. This indicates that the
implementation of the operating system (specifically the TCP/IP protocol stack) plays a
significant role in performance results. I conject that it is the implementation of the
kernel which is resulting in the unexpected performance results. Analyzing the
differences between the two types of machines can be complex. It is not an objective of
this thesis to analyze performance differences between the TAC-3 and TAC-4.
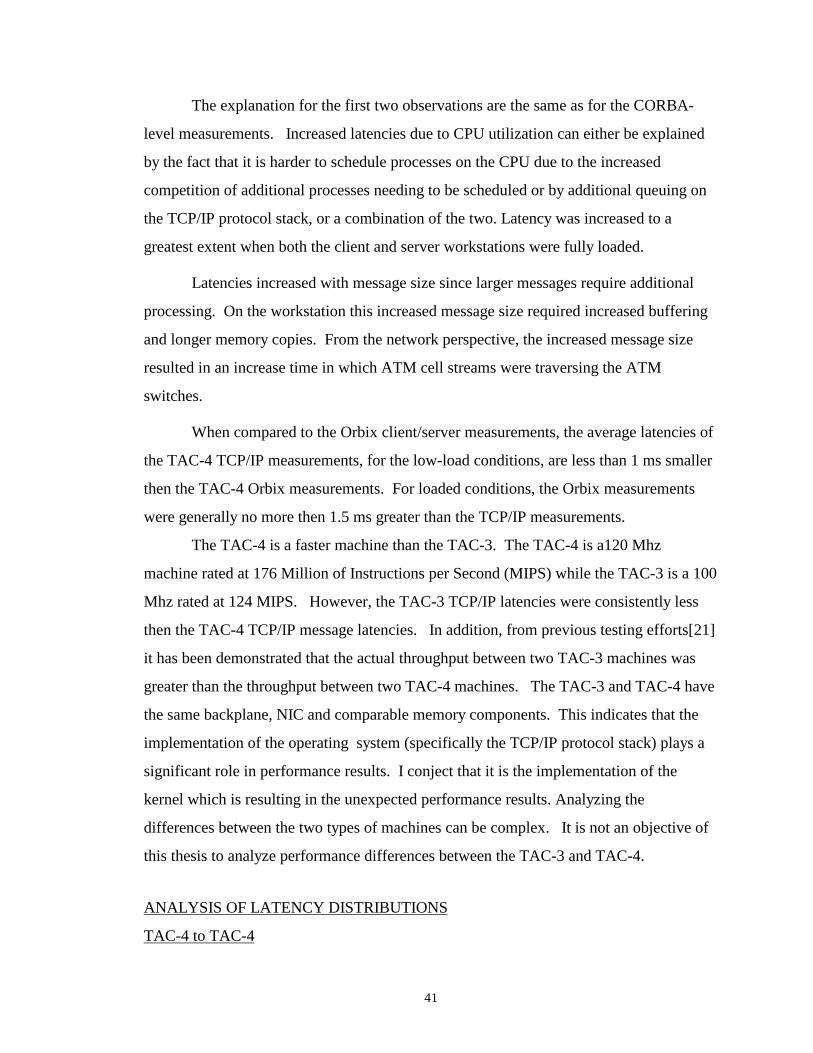
ANALYSIS OF LATENCY DISTRIBUTIONS
TAC-4 to TAC-4
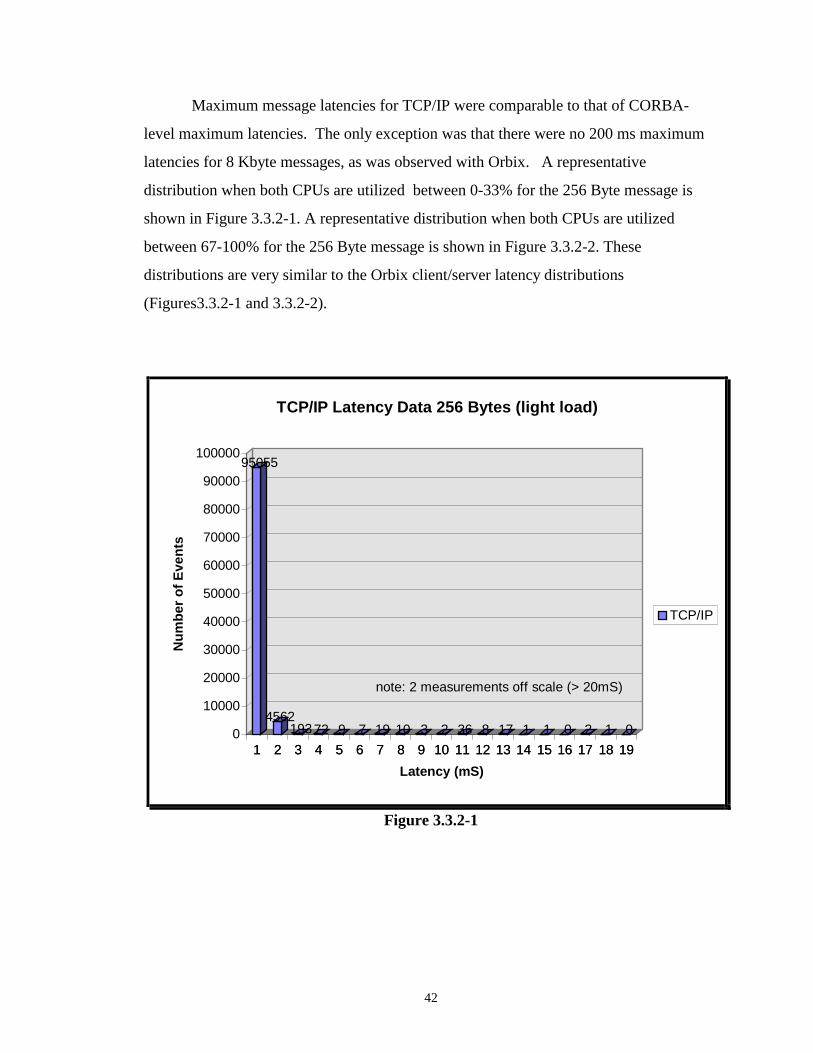
42
Maximum message latencies for TCP/IP were comparable to that of CORBA-
level maximum latencies. The only exception was that there were no 200 ms maximum
latencies for 8 Kbyte messages, as was observed with Orbix. A representative
distribution when both CPUs are utilized between 0-33% for the 256 Byte message is
shown in Figure 3.3.2-1. A representative distribution when both CPUs are utilized
between 67-100% for the 256 Byte message is shown in Figure 3.3.2-2. These
distributions are very similar to the Orbix client/server latency distributions
(Figures3.3.2-1 and 3.3.2-2).
1 2 3 4 5 6 7 8 9 10 11 12 13 14 15 16 17 18 19
95055
456219372 9 7 19 10 3 2 36 8 17 1 1 0 2 1 00
10000
20000
30000
40000
50000
60000
70000
80000
90000
100000
Nu
mb
er o
f E
ven
ts
1 2 3 4 5 6 7 8 9 10 11 12 13 14 15 16 17 18 19
Latency (mS)
TCP/IP Latency Data 256 Bytes (light load)
TCP/IP
note: 2 measurements off scale (> 20mS)
Figure 3.3.2-1
43
1 2 3 4 5 6 7 8 9 10 11 12 13 14 15 16 17 18 19
3810
22840
9563
13329
20823
15173
6300
4802
2046
489 256 231 150 69 41 16 13 10 220
5000
10000
15000
20000
25000
Nu
mb
er o
f E
ven
ts
1 2 3 4 5 6 7 8 9 10 11 12 13 14 15 16 17 18 19
Latency (mS)
TCP/IP Latency Data 256 Bytes (heavily loaded)
TCP/IP
note: 1 7 measurements off scale (> 20mS)
Figure 3.3.2-2
TAC-3 to TAC-3
Although for many cases, TAC-3 to TAC-3 maximum latencies were greater than
TAC-4 to TAC-4 latencies, the latency distribution was similar to that of a TAC-4 to
TAC-4 configuration.
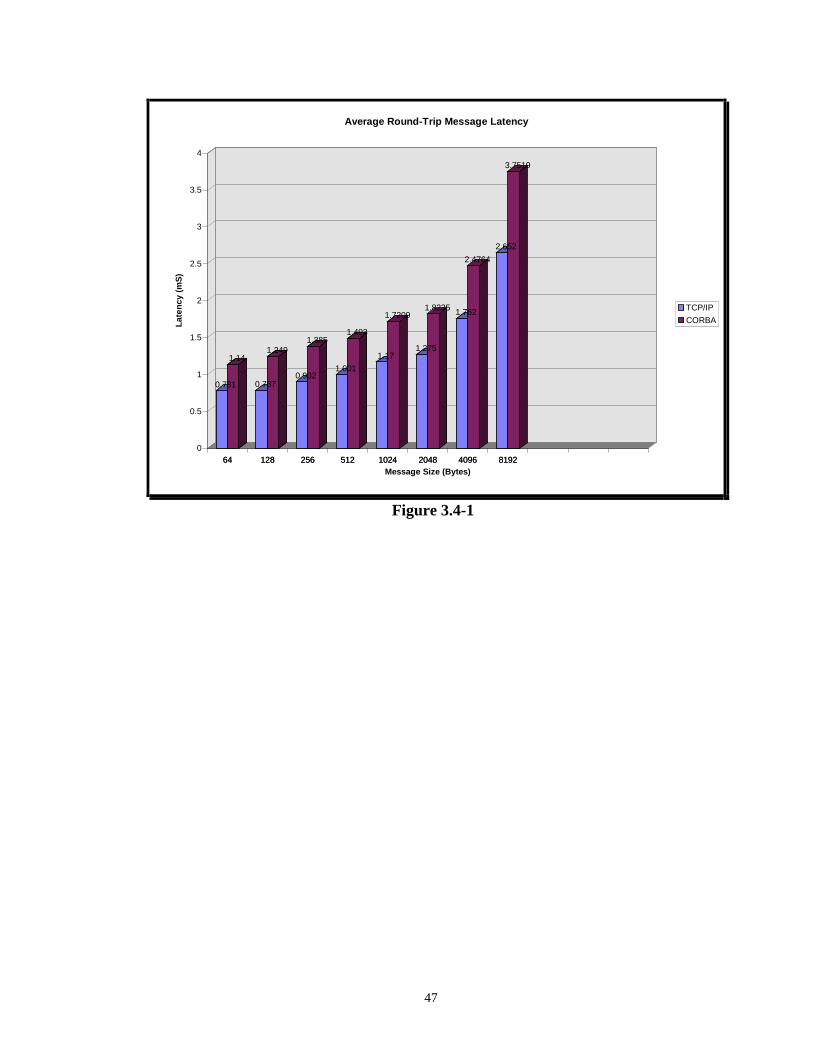
3.4 Analysis of CORBA Vs TCP/IP
The measurement results indicate that while CORBA-level increases average
latency, it does not significantly alter latency distribution. For lightly loaded scenarios,
(i.e. each Workstation has a CPU utilization of less than 33%), for the TAC-4
configuration, CORBA-level increases the average latencies by less 1 ms. This is seen in
Figure 3.4-1. For the configurations which are in a loaded state, with the exception of 8
kbyte messages, CORBA-level increases the average over TCP/IP-level average latencies
were generally less than 1.5 ms. This slight increase in average latency in the loaded
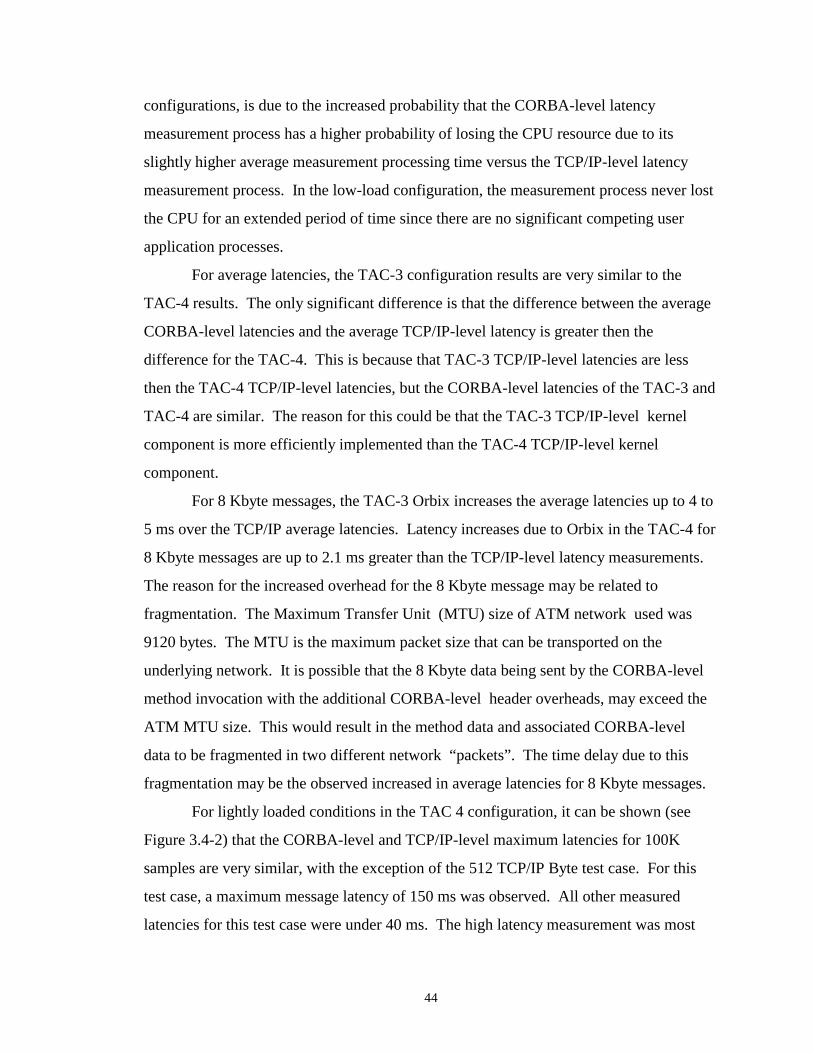
44
configurations, is due to the increased probability that the CORBA-level latency
measurement process has a higher probability of losing the CPU resource due to its
slightly higher average measurement processing time versus the TCP/IP-level latency
measurement process. In the low-load configuration, the measurement process never lost
the CPU for an extended period of time since there are no significant competing user
application processes.
For average latencies, the TAC-3 configuration results are very similar to the
TAC-4 results. The only significant difference is that the difference between the average
CORBA-level latencies and the average TCP/IP-level latency is greater then the
difference for the TAC-4. This is because that TAC-3 TCP/IP-level latencies are less
then the TAC-4 TCP/IP-level latencies, but the CORBA-level latencies of the TAC-3 and
TAC-4 are similar. The reason for this could be that the TAC-3 TCP/IP-level kernel
component is more efficiently implemented than the TAC-4 TCP/IP-level kernel
component.
For 8 Kbyte messages, the TAC-3 Orbix increases the average latencies up to 4 to
5 ms over the TCP/IP average latencies. Latency increases due to Orbix in the TAC-4 for
8 Kbyte messages are up to 2.1 ms greater than the TCP/IP-level latency measurements.
The reason for the increased overhead for the 8 Kbyte message may be related to
fragmentation. The Maximum Transfer Unit (MTU) size of ATM network used was
9120 bytes. The MTU is the maximum packet size that can be transported on the
underlying network. It is possible that the 8 Kbyte data being sent by the CORBA-level
method invocation with the additional CORBA-level header overheads, may exceed the
ATM MTU size. This would result in the method data and associated CORBA-level
data to be fragmented in two different network “packets”. The time delay due to this
fragmentation may be the observed increased in average latencies for 8 Kbyte messages.
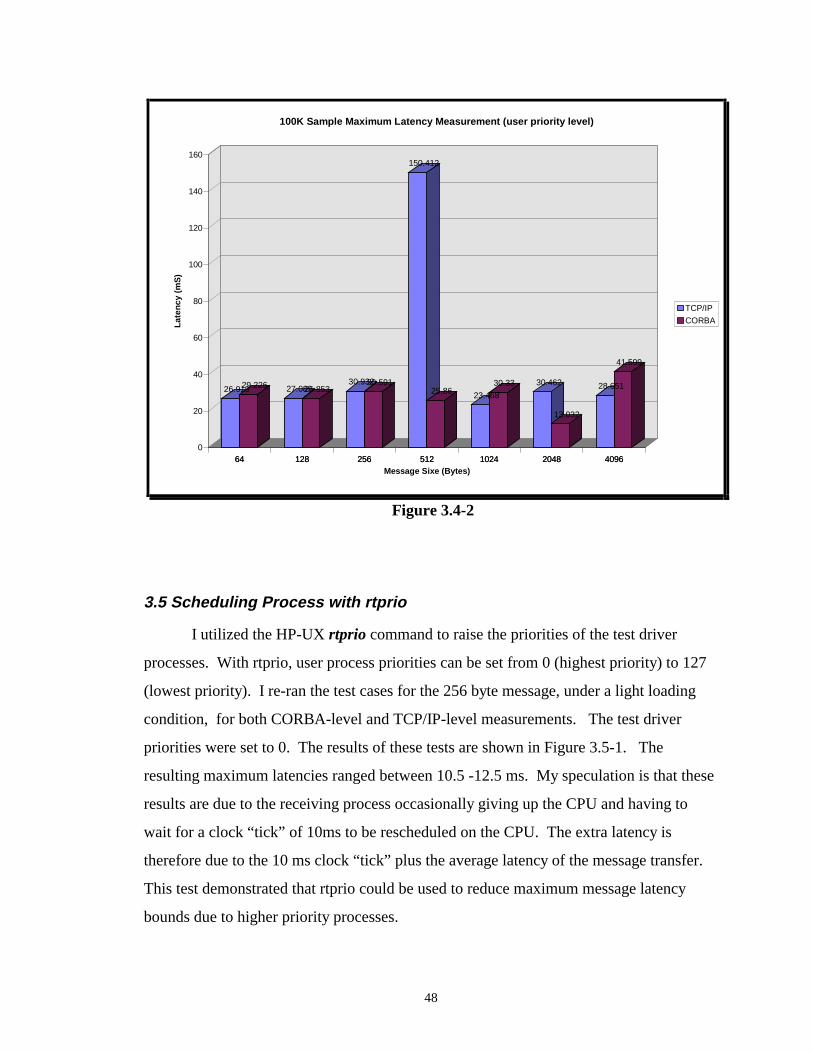
For lightly loaded conditions in the TAC 4 configuration, it can be shown (see
Figure 3.4-2) that the CORBA-level and TCP/IP-level maximum latencies for 100K
samples are very similar, with the exception of the 512 TCP/IP Byte test case. For this
test case, a maximum message latency of 150 ms was observed. All other measured
latencies for this test case were under 40 ms. The high latency measurement was most
45
likely caused by the test driver application being pre-empted by a higher priority process
during the measurement. To demonstrate the low probability that this event would
reoccur, I took another 500K samples resulting in maximum latency of only 40 ms.
Note that for the loaded configurations, it would not be unexpected to see a slight
increase in CORBA-level maximum latencies versus TCP/IP-level maximum latencies as
CPU utilizations increased. This is because of the CORBA-level overhead. There is a
higher probability that a CORBA-level process may need to wait for more CPU time-
slices. Since the CPU time slices are harder to come by when there is loading (i.e.
competing processes have to share a single CPU), it is likely that a CORBA-level process
may have a higher maximum latency. For the TAC-3, when at least one of the
workstations was heavily loaded, CORBA-level maximum latencies were consistently
greater than TCP/IP-level maximum latencies. The other loading configurations would
need to be rerun with a much larger number of latency measurement samples to see if this
effect on maximum loading is true at lower loading configurations. With the TAC-4
configurations, this relationship between CORBA-level and TCP/IP-level maximum
latencies was not all apparent. However, this does not mean it does not exist. A large
number of latency measurement samples would be required to verify or rule out this
effect for TAC-4 configurations.
More significant than similar maximum latencies, is the observation that CORBA-
level and TCP/IP-level latency distributions are very similar. The graphs shown in the
previous sections for both the lightly loaded and the heavily loaded conditions (Figures
3.2.2-1, 3.2.3-1, 3.2.2-2 and 3.2.3-2), have shown that the CORBA-level and TCP/IP-
level measurements have similar latency distribution characteristics. For the lightly
loaded conditions the graphs have the vast majority of the measurements in the first
couple of bins with very few measurements in any of the other bins. The most
significant difference is that CORBA-level measurements are out 1 bin further then the
TCP/IP-level measurements, demonstrating the higher averages. For example, for the
lightly loaded TCP/IP-level condition, close to 96% of the measurements were taken
with in 1 ms. Over 99.5% of the measurements were accomplished within 3 ms. For the
corresponding CORBA-level test, 0 measurements were completed before 1 ms, while

46
over 99% were accomplished within 2 ms. For the heavily loaded conditions, both
TCP/IP-level and CORBA-level graphs show similar characteristics indicating the
TCP/IP queuing. There is no consistently distinguishable differences between the
CORBA-level and TCP/IP-level measurements for the heavily loaded conditions. As can
be seen from the latency distribution graphs (Figures 3.2.2-2 and 3.3.2-2), the graphs are
very similar when the percentage of measurements taken versus time in latencies are
compared. For example, the TCP/IP-level and CORBA-level full-load latency graphs
show the characteristics as identified in Table 3.4-1. This table compares the CORBA-
level and TCP/IP-level measurement distributions. The table shows a relation between a
selective percentage of 10K measurements taken, and the time in milliseconds which was
required to take the measurements. As can be seen by this table, the latency distributions
for the CORBA-level and TCP/IP-level are very similiar. The distributions are similar for
all message sizes for both the TAC-3s and TAC-4s.
Percentage of Samples vs Time
Percentage of Samples
(number of samples)
CORBA-level
Time in milliseconds
TCP/IP-level
Time in milliseconds
90% 7 7
95% 8 8
99% 9 10
99.4% 10 11
Table 3.4-1
47
64 128 256 512 1024 2048 4096 8192
0.781
1.14
0.787
1.249
0.902
1.385
1.001
1.493
1.17
1.7209
1.275
1.8235 1.762
2.4764
2.652
3.7519
0
0.5
1
1.5
2
2.5
3
3.5
4
Lat
ency
(m
S)
64 128 256 512 1024 2048 4096 8192Message Size (Bytes)
Average Round-Trip Message Latency
TCP/IP
CORBA
Figure 3.4-1
48
64 128 256 512 1024 2048 4096
26.91929.226 27.08926.85330.93230.591
150.412
25.86 23.468
30.33 30.462
13.032
28.651
41.599
0
20
40
60
80
100
120
140
160
Lat
ency
(m
S)
64 128 256 512 1024 2048 4096Message Sixe (Bytes)
100K Sample Maximum Latency Measurement (user priority level)
TCP/IP
CORBA
Figure 3.4-2
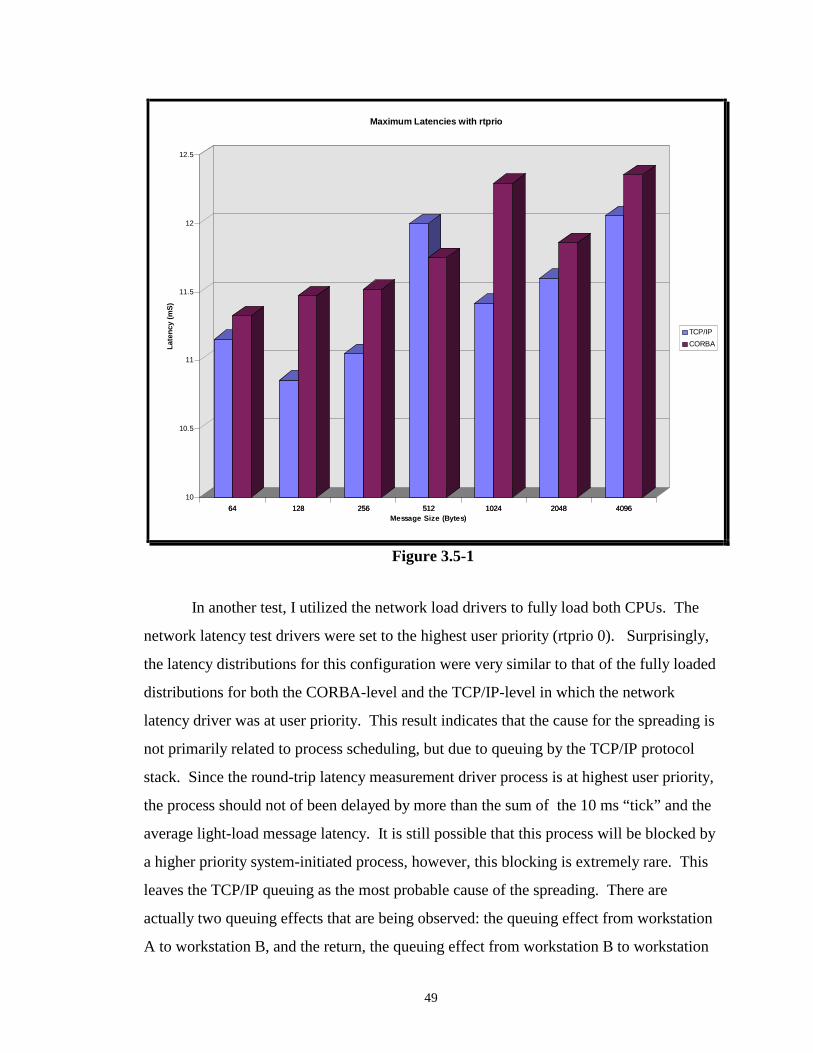
3.5 Scheduling Process with rtprio
I utilized the HP-UX rtprio command to raise the priorities of the test driver
processes. With rtprio, user process priorities can be set from 0 (highest priority) to 127
(lowest priority). I re-ran the test cases for the 256 byte message, under a light loading
condition, for both CORBA-level and TCP/IP-level measurements. The test driver
priorities were set to 0. The results of these tests are shown in Figure 3.5-1. The
resulting maximum latencies ranged between 10.5 -12.5 ms. My speculation is that these
results are due to the receiving process occasionally giving up the CPU and having to
wait for a clock “tick” of 10ms to be rescheduled on the CPU. The extra latency is
therefore due to the 10 ms clock “tick” plus the average latency of the message transfer.
This test demonstrated that rtprio could be used to reduce maximum message latency
bounds due to higher priority processes.
49
64 128 256 512 1024 2048 4096
10
10.5
11
11.5
12
12.5
Lat
ency
(m
S)
64 128 256 512 1024 2048 4096Message Size (Bytes)
Maximum Latencies with rtprio
TCP/IP
CORBA
Figure 3.5-1
In another test, I utilized the network load drivers to fully load both CPUs. The
network latency test drivers were set to the highest user priority (rtprio 0). Surprisingly,
the latency distributions for this configuration were very similar to that of the fully loaded
distributions for both the CORBA-level and the TCP/IP-level in which the network
latency driver was at user priority. This result indicates that the cause for the spreading is
not primarily related to process scheduling, but due to queuing by the TCP/IP protocol
stack. Since the round-trip latency measurement driver process is at highest user priority,
the process should not of been delayed by more than the sum of the 10 ms “tick” and the
average light-load message latency. It is still possible that this process will be blocked by
a higher priority system-initiated process, however, this blocking is extremely rare. This
leaves the TCP/IP queuing as the most probable cause of the spreading. There are
actually two queuing effects that are being observed: the queuing effect from workstation
A to workstation B, and the return, the queuing effect from workstation B to workstation
50
A. The case in which the queuing is most prevalent is the case when the load drivers are
generating messages at the maximum rate (i.e. the fully loaded condition). For this
configuration, each 1kbyte message data stream has an approximate throughput rate of
about 40Mbits/S, which is causing the TCP/IP queues to fill. Since the socket buffer size
is at a maximum (255 Kbytes), it is conceivably possible, that for a worse case scenario,
that a message from the latency driver will be delayed until 255 Kbits of data are sent (i.e.
the queue need to be drained). This could potentially occur in both directions, thus
doubling the latency due to TCP/IP queuing.
3.6 ATM Switch Measurements
The first set of switch measurements in Section 3.6.1 measures ATM switch
latencies as a function of the number of ports traversed and as a function of port loading.
Section 3.6.2 provides measurements to characterize the port loading effects on TCP/IP
traffic stream latencies.
3.6.1 Characterizing ATM Switch Latencies
ATM switch latency tests were performed using the ADTECH analyzer. These
tests utilized the ADTECH analyzer to generate and transmitted a periodic stream of test
cells through multiple ATM switch ports, which were daisy chained together, back to the
ADTECH’s receiving receptacle. The ADTECH analyzer was then used to record cell
transfer delays, lost cells, and cell error rates. Results were obtained for varying degrees
of throughput (25%-100%) and the number of ports (2,4, and 9) which the cell stream
traversed (see Figures 3.6.1-1 - 3.6.1-3).
Two Port ATM Switch Test Configuration
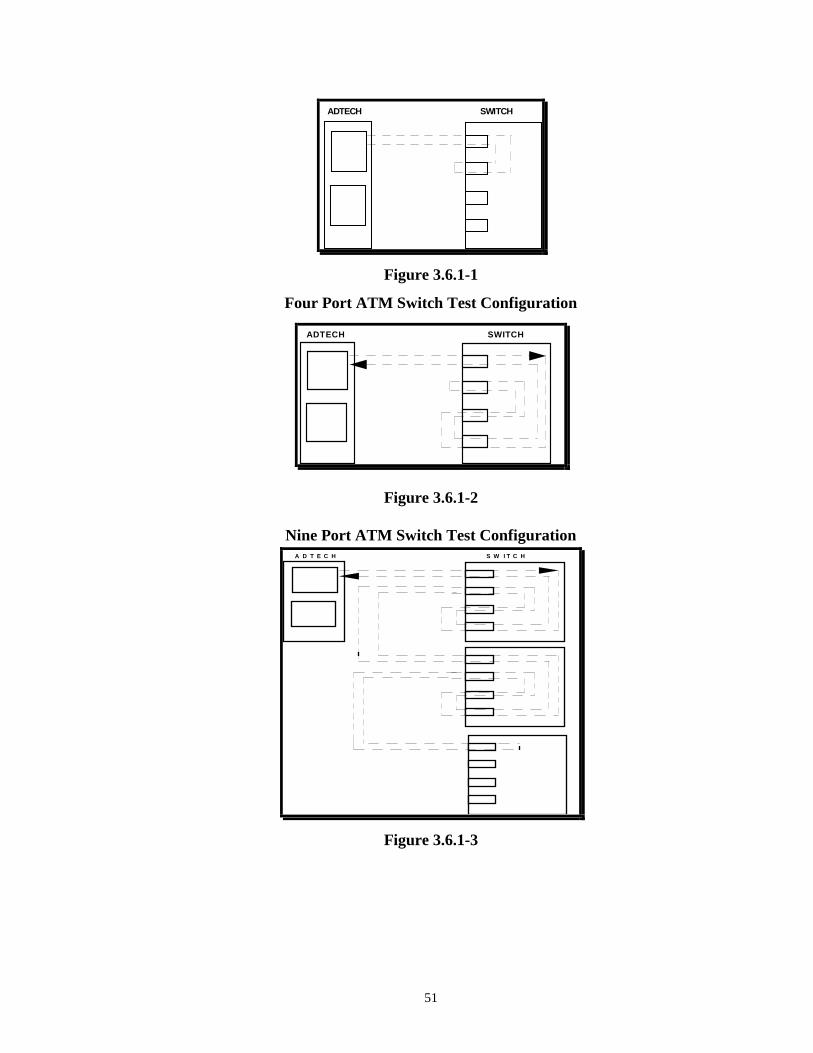
51
ADTECH SWITCH
Figure 3.6.1-1
Four Port ATM Switch Test Configuration
ADTECH SWITCH
Figure 3.6.1-2
Nine Port ATM Switch Test Configuration A D T E C H S W I T C H
Figure 3.6.1-3
52
Latency, and the variation of latency, were measured by utilizing the ADTECH’s
capability to measure cell delay variation. To determine cell delay variation time the
ADTECH analyzer timestamps each of the transmitted cells. For each transmitted cell,
the cell delay variation is calculated by subtracting the time from which the cell was
received at the port from the time that the cell was transmitted from the port. Cell delay
variation times can be determined to within 0.5 nanosecond accuracy.
The results of the measurements are shown in Table 3.6.1-1 for both the range of
the cell delay variation and the mean value of the cell delay. As shown by the table, cell
delay variation increases as both the number of ports increase, and as the cell throughput
increases. The results indicate that for throughput rates less than 90% of the ATM OC-3
rates, cell delay variation is most affected by the number of ports that the cell stream
traverses. However, there is some spreading of cell delay variation as the cell rate is
increased. Above 90% capacity, the effect of cell throughput on cell delay variation is
increasingly affected by an increase in cell throughput. This is probably a result of switch
buffering. At 100% capacity, latency increases dramatically. In addition, at 100%
capacity, cell loss eventually occurred with all the configurations. During 100%
capacity, the cell delay variation is continuously increasing. This is probably the result of
the buffers in the switches overflowing as the incoming cell rate into the switch is greater
than the switch’s capability to forward the data. Eventually, the switch’s buffers
overflow and cells are lost. The cell loss is observed at the ADTECH analyzer. With the
9 port configuration, cell loss was typically observed within 30 seconds, the 4 port
configuration cell loss appeared within 14 minutes and in the 2 port configuration cell
loss occurred within 30 minutes.
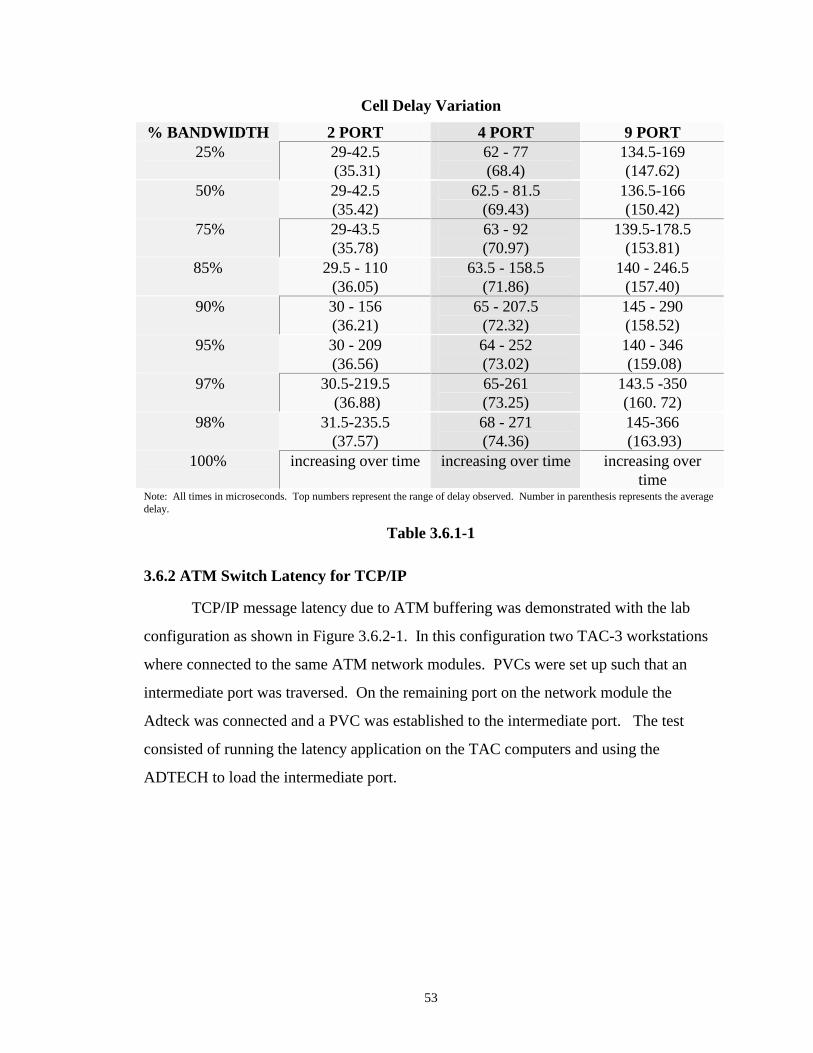
53
Cell Delay Variation
% BANDWIDTH 2 PORT 4 PORT 9 PORT 25% 29-42.5
(35.31) 62 - 77 (68.4)
134.5-169 (147.62)
50% 29-42.5 (35.42)
62.5 - 81.5 (69.43)
136.5-166 (150.42)
75% 29-43.5 (35.78)
63 - 92 (70.97)
139.5-178.5 (153.81)
85% 29.5 - 110 (36.05)
63.5 - 158.5 (71.86)
140 - 246.5 (157.40)
90% 30 - 156 (36.21)
65 - 207.5 (72.32)
145 - 290 (158.52)
95% 30 - 209 (36.56)
64 - 252 (73.02)
140 - 346 (159.08)
97% 30.5-219.5 (36.88)
65-261 (73.25)
143.5 -350 (160. 72)
98% 31.5-235.5 (37.57)
68 - 271 (74.36)
145-366 (163.93)
100%
increasing over time increasing over time increasing over time
Note: All times in microseconds. Top numbers represent the range of delay observed. Number in parenthesis represents the average delay.
Table 3.6.1-1
3.6.2 ATM Switch Latency for TCP/IP
TCP/IP message latency due to ATM buffering was demonstrated with the lab
configuration as shown in Figure 3.6.2-1. In this configuration two TAC-3 workstations
where connected to the same ATM network modules. PVCs were set up such that an
intermediate port was traversed. On the remaining port on the network module the
Adteck was connected and a PVC was established to the intermediate port. The test
consisted of running the latency application on the TAC computers and using the
ADTECH to load the intermediate port.
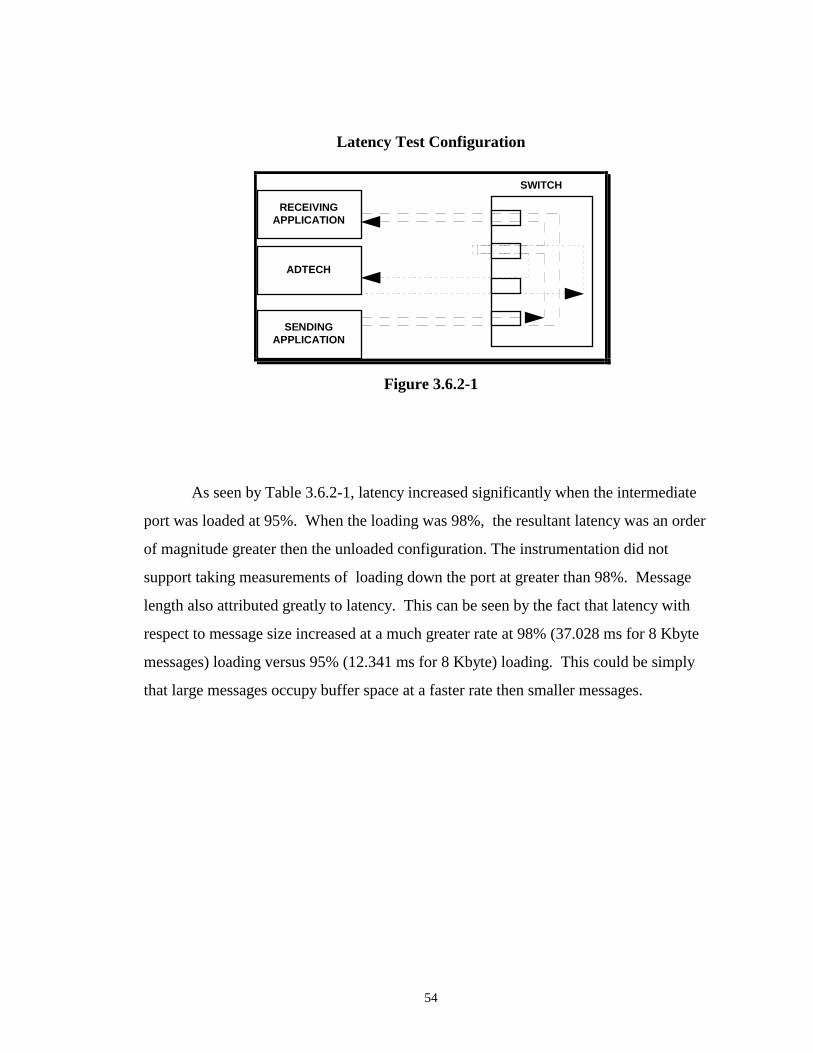
54
Latency Test Configuration
SWITCH
ADTECH
SENDINGAPPLICATION
RECEIVINGAPPLICATION
Figure 3.6.2-1
As seen by Table 3.6.2-1, latency increased significantly when the intermediate
port was loaded at 95%. When the loading was 98%, the resultant latency was an order
of magnitude greater then the unloaded configuration. The instrumentation did not
support taking measurements of loading down the port at greater than 98%. Message
length also attributed greatly to latency. This can be seen by the fact that latency with
respect to message size increased at a much greater rate at 98% (37.028 ms for 8 Kbyte
messages) loading versus 95% (12.341 ms for 8 Kbyte) loading. This could be simply
that large messages occupy buffer space at a faster rate then smaller messages.
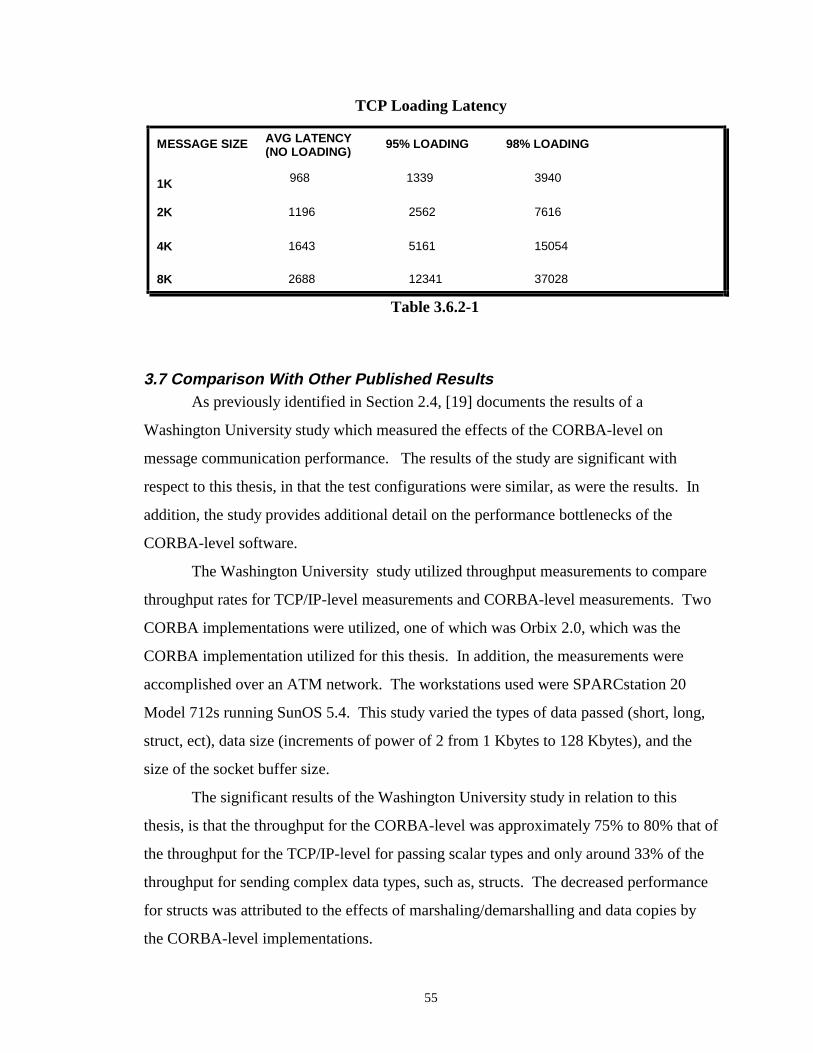
55
TCP Loading Latency
95% LOADINGAVG LATENCY(NO LOADING)
MESSAGE SIZE 98% LOADING
1K
2K
4K
8K
968
1196
1643
2688 12341
5161
2562
37028
15054
7616
3940 1339
Table 3.6.2-1
3.7 Comparison With Other Published Results As previously identified in Section 2.4, [19] documents the results of a
Washington University study which measured the effects of the CORBA-level on
message communication performance. The results of the study are significant with
respect to this thesis, in that the test configurations were similar, as were the results. In
addition, the study provides additional detail on the performance bottlenecks of the
CORBA-level software.
The Washington University study utilized throughput measurements to compare
throughput rates for TCP/IP-level measurements and CORBA-level measurements. Two
CORBA implementations were utilized, one of which was Orbix 2.0, which was the
CORBA implementation utilized for this thesis. In addition, the measurements were
accomplished over an ATM network. The workstations used were SPARCstation 20
Model 712s running SunOS 5.4. This study varied the types of data passed (short, long,
struct, ect), data size (increments of power of 2 from 1 Kbytes to 128 Kbytes), and the
size of the socket buffer size.
The significant results of the Washington University study in relation to this
thesis, is that the throughput for the CORBA-level was approximately 75% to 80% that of
the throughput for the TCP/IP-level for passing scalar types and only around 33% of the
throughput for sending complex data types, such as, structs. The decreased performance
for structs was attributed to the effects of marshaling/demarshalling and data copies by
the CORBA-level implementations.
56
When the TCP/IP-level and CORBA-level latency measurement time results
from my thesis work are compared (Section 3.4), it is obvious that the CORBA-level adds
additional overhead. The TCP/IP-level latency measurement times, for the lightly loaded
TAC-4 configurations, were at best, approximately 73% of the corresponding CORBA-
level latency measurement times measurements. For the TAC-3 configurations, the
TCP/IP-level latency measurements times was at best, approximately 61% of the
corresponding CORBA-level latency measurement times. In my opinion, the results for
my thesis work, were consistent with the results of the study. Differences between my
work and the Washington University study could be due to any combination of the
following: hardware, operating systems, or how the data was passed. I used a 2
dimensional array of longs for my data measurements. The Washington University study
utilized various types of data. The closest type which was utilized by the Washington
University study to the type I used was a sequence of longs.
It is interesting to note that the authors of the Washington University study
seemed to be disappointed with the results. This was because, with their application
domain (Medical Imaging) high speed is of significant importance. In the C3I system
domain, high speed is not as important. From my measurements, it was shown that
CORBA-level software typically added less than 2 ms to message latency. This is fairly
insignificant when compared to the other larger contributors of message latency. In short,
it is important to note that the significance of performance results are dependent on the
domain to which they apply.
3.8 Latency Measurement Summary
Measured round-trip CORBA-level latencies were typically in the range of low
milliseconds (less than 10 ms). The most significant sources of latencies were due to the
workstations. For network utilization’s of 90% or less, network contributions to latency
was minimal, only in the tens of microseconds. A high level comparison of message
latency contributors are shown in Table 3.8-1.
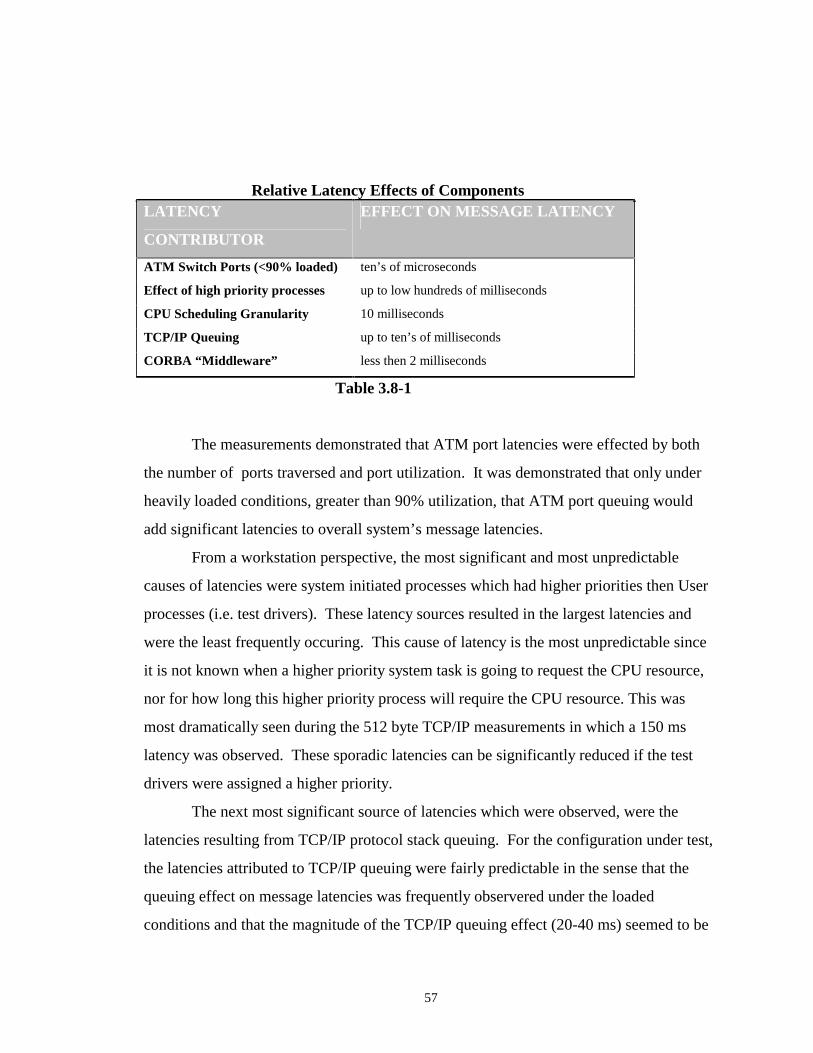
57
Relative Latency Effects of Components LATENCY
CONTRIBUTOR
EFFECT ON MESSAGE LATENCY
ATM Switch Ports (<90% loaded) ten’s of microseconds
Effect of high priority processes up to low hundreds of milliseconds
CPU Scheduling Granularity 10 milliseconds
TCP/IP Queuing up to ten’s of milliseconds
CORBA “Middleware” less then 2 milliseconds
Table 3.8-1
The measurements demonstrated that ATM port latencies were effected by both
the number of ports traversed and port utilization. It was demonstrated that only under
heavily loaded conditions, greater than 90% utilization, that ATM port queuing would
add significant latencies to overall system’s message latencies.
From a workstation perspective, the most significant and most unpredictable
causes of latencies were system initiated processes which had higher priorities then User
processes (i.e. test drivers). These latency sources resulted in the largest latencies and
were the least frequently occuring. This cause of latency is the most unpredictable since
it is not known when a higher priority system task is going to request the CPU resource,
nor for how long this higher priority process will require the CPU resource. This was
most dramatically seen during the 512 byte TCP/IP measurements in which a 150 ms
latency was observed. These sporadic latencies can be significantly reduced if the test
drivers were assigned a higher priority.
The next most significant source of latencies which were observed, were the
latencies resulting from TCP/IP protocol stack queuing. For the configuration under test,
the latencies attributed to TCP/IP queuing were fairly predictable in the sense that the
queuing effect on message latencies was frequently observered under the loaded
conditions and that the magnitude of the TCP/IP queuing effect (20-40 ms) seemed to be

58
related to the socket buffer size. The latencies due to the protocol stack could be reduced
in both frequency and magnitude by using either utilizing smaller buffer sizes or by
limiting message traffic between workstations.
The non-preemptive nature of the scheduler was an additional measured
contributor to system latency. Since a clock ‘tick’ is 10 ms, the scheduler could result in
latencies of 10 ms.
From a network perspective, the last measured contributor to system latency was
CORBA-level. For the system under test, this implementation of CORBA-level typically
contributed less than 2 ms to system latencies. Most significantly, CORBA-levels latency
component was predictable, it did not add to system maximum latencies.
3.9 Implications of Measurement Results for Soft/Hard Real-Time Systems
The measurements taken suggest that, for the specified configurations, a soft real-
time system could be supported. For the configurations under test, the maximum
latencies for round-trip latencies, was approximately 100 ms (TAC-4 to TAC-4 8K
messages are an exception). Making the assumption that a one-way latency is one-half
the round trip latency, the maximum latency is approximately 50 ms. However, it is
important that these maximum latencies assume minimum memory management and only
a minimum of competing application processes. Page swapping was virtually
nonexistent (only a minimum set of applications were executing) and there were no writes
to files during the measurements. This maximum latency bound could be improved if the
applications are given higher priorities. If message communication is relatively light and
the default socket buffer sizes (32 kbytes) are used, it is reasonable to assume that the
round trip latency would be less then 15 ms (the 10 ms clock ‘tick’ plus the average
round-trip latency). The exact lower bound latency requirement in which HP-UX could
support is dependent on the CPU loading profiles and the size of the message.
However, even under these conditions, the system still can not be considered hard
real-time, unless the requirements allow for significant time to meet deadlines. This is
because it is still possible that there are other system initiated processes which could
have a priority higher than the maximum user priority assignable by rtprio. This makes
59
the system unpredictable since it is still possible that the maximum latencies could exceed
system time requirements.
Another point worth noting is that the implementation of CORBA (Orbix)
utilized, only required a separate process to be run at the time of an object bind. After the
connection was made, the Orbix daemon did not need to execute. This meant that this
daemon did not need to be scheduled and was not vying for processor resources. It is
possible that other CORBA implementations or the utilization of additional CORBA
services would result in a more active daemon or additional daemons which would
require system resources. The execution of this deamon could result in increase latencies.
Assuming that the deadline requirements are at least 15 ms but not significantly
long in duration (i.e. 1 Second), the system configuration under study could support hard
real-time requirements only if significant constrains are placed on the system. These
constrains include:
1. time critical processes be given sufficient priorities relative to each other and
it is determine system initiated processes will not result in time constraints to
be violated
2. message traffic is low enough so that TCP/IP queuing is not a factor
3. ATM port utilization is less than 90% of maximum bandwidth
4. application’s minimize memory management effects
The first constraint requires a system study to analyze all possible conditions in which
higher priority processes then the time critical process could occur. The system design
would have to take into account the system initiated tasks which have a lower priority
then what can be set by rtprio. Message traffic to and from the workstation would need to
be controlled to ensure that TCP/IP queuing effects are constrained to tolerable limits. In
addition, application programmers need to ensure that applications are written so that
memory management effects (i.e. page swapping, file writes and memory leaks ) are also
within acceptable limits. Also from a workstation perspective, possible priority inversion
scenarios between resources would have to be explored.
60
ATM port utilization is a network architecture issue. Unless, multiple
workstations are passing data through one common port (i.e. the connection between
ATM switches), it is unlikely that ATM port loading will be a significant design
limitation for hard-real-time messaging systems.
61
4.0 Latency Server
The Latency Server dynamically provides estimates on message latencies between
two communicating applications on different workstations. This section discusses the
methodology, design and test setup of the Latency Server.
4.1 Latency Server Methodology
For real-time systems, it is necessary to know the latencies of the underlying data
communications path so that current application deadlines can properly be established.
As seen from the measurements in Section 3, these latencies can vary due to multiple
factors, such as network loading and end-station loading. It would be the function of the
Latency Server to provide the current estimated message latencies for pairs of end-station
connections.
In providing network latencies, the Latency Server needs to account for the
following:
1. The required “hardness of bound”, which refers to the percentage of
measurements in which the latency must bound hold;
2. The latency estimates should not be overly cautious (i.e. latency estimates should
not be higher than actually required);
3. The bandwidth required to make the latency measurement.
The first consideration refers to the need to have the estimated value greater than a
certain percentage of the possible actual latencies. For instance, it may be desirable that
the value of the returned estimate latency time be greater then the actual message
latencies 96% of the time (i.e. an upper latency bound of 96%).
The second consideration refers to the need in which the estimate not be overly
cautious (i.e. “excessively hard”). It may be acceptable to miss message deadlines in
certain circumstances since it may be more important that other components of the
system are given execution time to complete their tasks. For this case, average message
latencies would be desirable.
62
The third consideration refers to the amount of available bandwidth to support the
latency measurements. Some systems may not be able to afford to provide the required
bandwidth to make the measurements, while other systems may be able to afford the
bandwidth costs if it will ensure an accurate message latency value.
There are 3 possible approaches in providing a latency number for the data
communications path:
1) Provide a static estimated value (i.e. network latency = 3 ms)
2) Measure the latency
3) Use known system parameters to dynamically estimate the current latency
The prototype Latency Server uses Approaches 2 and 3.
Providing a static estimate value has the advantage that no resources are needed at
run-time to maintain the value. The disadvantages are that the latency characteristics of
the message communication system are dynamic, therefore message latencies are
dependent on workstation and network states. If the static estimated value is too low,
then deadlines will be missed. If the estimated value is too high, applications may be
forced to complete their tasks earlier than necessary. If the system is required to be hard
real-time, the estimated value must always be high to account for the worse-case network
latency.
Measuring the actual network latency can be accomplished by performing round-
trip latency measurements. These measurements should be accomplished when a system
state change occurs (i.e. network and/or CPU loading change) that could significantly
effect message latency. The advantage to this approach is that if enough round-trip
measurements are made, a confidence interval could be established for the actual message
latencies for the current communications system state. The disadvantage of this approach
is that substantial network bandwidth can be utilized in taking latency measurements.
This is due to the fact that round trip measurements will need to be performed for each
end-station-to-end-station communications pair. This is compounded by the fact that
these round-trip measurements should consist of multiple messages (i.e. 1000) at the
message size of interest.
63
Assuming that the network has a system management system and that the network
latencies can be correlated to the system management state parameters, it may be
desirable to calculate message latencies utilizing current system state information. There
are numerous COTS system management products available that track the state of
LANS. The state information (network throughput, workstation CPU utilization,
workstation availability, ect.) can be stored in Management Information Bases (MIBS)
(MIB standards exist). To retrieve state information from entities on the network the
standardize Simple Network Management Protocol (SNMP) can be employed. The
advantage of this approach is that message latencies can be dynamically provided without
increasing network bandwidth. The disadvantages is that this approached requires system
resources, such as a system management application. Not all networked systems have a
system management application. Another disadvantage is that, depending on the design,
the system may need to completely characterize latencies for each system state a priori, so
that this information can be made available to the Latency Server. Aquiring the required
measurements a priori may require significant effort.
As previously mentioned, the Latency Server prototype can utilize either approach
2 (message latency is measured) or approach 3 (message latency is estimated). In
addition, for each approach, the Latency Server can provide either the average message
latency or a latency bound. The average latency is a time in milliseconds which is the
mean of the number of round-trip sample latencies. The latency bound is a time (in
milliseconds) in which a predetermined percentage of the sampled measured message
latencies times are equal to or less than it.
To specifically identify the required approach to provide the latency estimate, the
prototyped Latency Server provides one of four Quality of Service (QoS) levels for each
connection. A connection is the message communication path between two workstation.
The QoS levels are as follows:
• QoS 1: Estimate the average latencies using system state information and a
priori data:
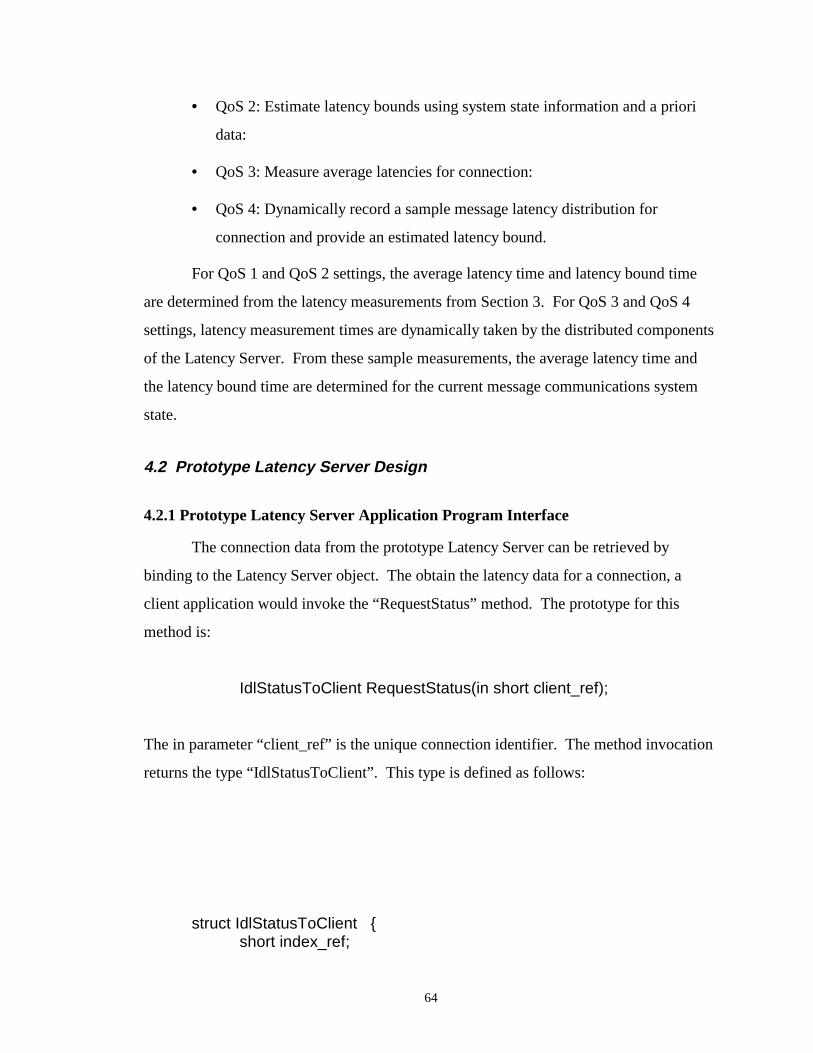
64
• QoS 2: Estimate latency bounds using system state information and a priori
data:
• QoS 3: Measure average latencies for connection:
• QoS 4: Dynamically record a sample message latency distribution for
connection and provide an estimated latency bound.
For QoS 1 and QoS 2 settings, the average latency time and latency bound time
are determined from the latency measurements from Section 3. For QoS 3 and QoS 4
settings, latency measurement times are dynamically taken by the distributed components
of the Latency Server. From these sample measurements, the average latency time and
the latency bound time are determined for the current message communications system
state.
4.2 Prototype Latency Server Design
4.2.1 Prototype Latency Server Application Program Interface
The connection data from the prototype Latency Server can be retrieved by
binding to the Latency Server object. The obtain the latency data for a connection, a
client application would invoke the “RequestStatus” method. The prototype for this
method is:
IdlStatusToClient RequestStatus(in short client_ref);
The in parameter “client_ref” is the unique connection identifier. The method invocation
returns the type “IdlStatusToClient”. This type is defined as follows:
struct IdlStatusToClient { short index_ref;
65
short quality; short server_acknowledges_client; float latency_estimate; float upper_bound_estimate; float lower_bound_estimate; short update_required_flag; };
The update_required_flag provides the status of the connection (i.e. the Latency
Server is providing latency estimates). The quality variable provides the QoS which is
used for the connection. The QoS for each connection was defined at the Latency Server
startup time, and it can not be altered during run-time. If the QoS is equal to 1 or 3, then
the latency_estimate variable is the time in milliseconds of the measured average
message latency. The upper_bound_estimate float and lower_bound_estimate
variables define the range in which there is a statistical 95% confidence that the average
latency will fall within. If the QoS is equal to 2 or 4, then the latency_estimate
variable is the time in milliseconds for the measured latency bound. The latency bound
for the connection was identified in a configuration file, which was read at the time of the
prototype Latency Server startup. The upper_bound_estimate and
lower_bound_estimate variables represent the 95% confidence interval for the
percentage of message latency times in which the latency bound is greater then the
message latencies. The update_required_flag indication is only significant if the QoS is
equal to 2 or 4. If the update_required_flag variable has a value of 1, than the Latency
Server is waiting for the results of measurements, and that the latency estimate value is
soon likely to change. If the value is not 1, then the latency estimate value is valid.
For example, assume a client is bound to the Latency Server and invokes:
RequestStatus(1). Assume that the configured latency bound for connection 1 was 96%.
Also, assume that the following values are returned:
index_ref : 1 quality: 4 server_acknowledges_client: 1
66
latency_estimate: 5 upper_bound_estimate: 98 lower_bound_estimate: 97 update_required_flag: 0
This returned value indicates that the connection is good since the
server_acknowledges_client is 1. The QoS is 4, indicating that a dynamically measured
latency bound was provided. Since the update_required_flag is 0, the value is valid since
there is no pending measurement to be made. The latency bound estimate is 5
milliseconds. From this result the following conclusion can be made: There is a 95%
confidence that between 97% to 98% of actual message latencies are less than 5
milliseconds.
An example to demonstrate average message latencies may result in the following
returned values:
index_ref : 2 quality: 3 server_acknowledges_client: 1 latency_estimate: 1.46 upper_bound_estimate: 1.56 lower_bound_estimate: 1.36 update_required_flag: 0
This result leads to the conclusion that there is a 95% confidence that the actual average
latency is between 1.36 ms to 1.56 ms.
4.2.2 Prototype Latency Server System Description
The implementation of the Latency Server prototype accomplished for this thesis
consists of the following CORBA-level components:
• The Latency Server which either provides estimates or requests new
measurements from its distributed components (i.e. Client and Peer
applications);
• N Client applications, which reside on one of the workstations (Client
workstation) for each connection. When requested by the Latency Server, the
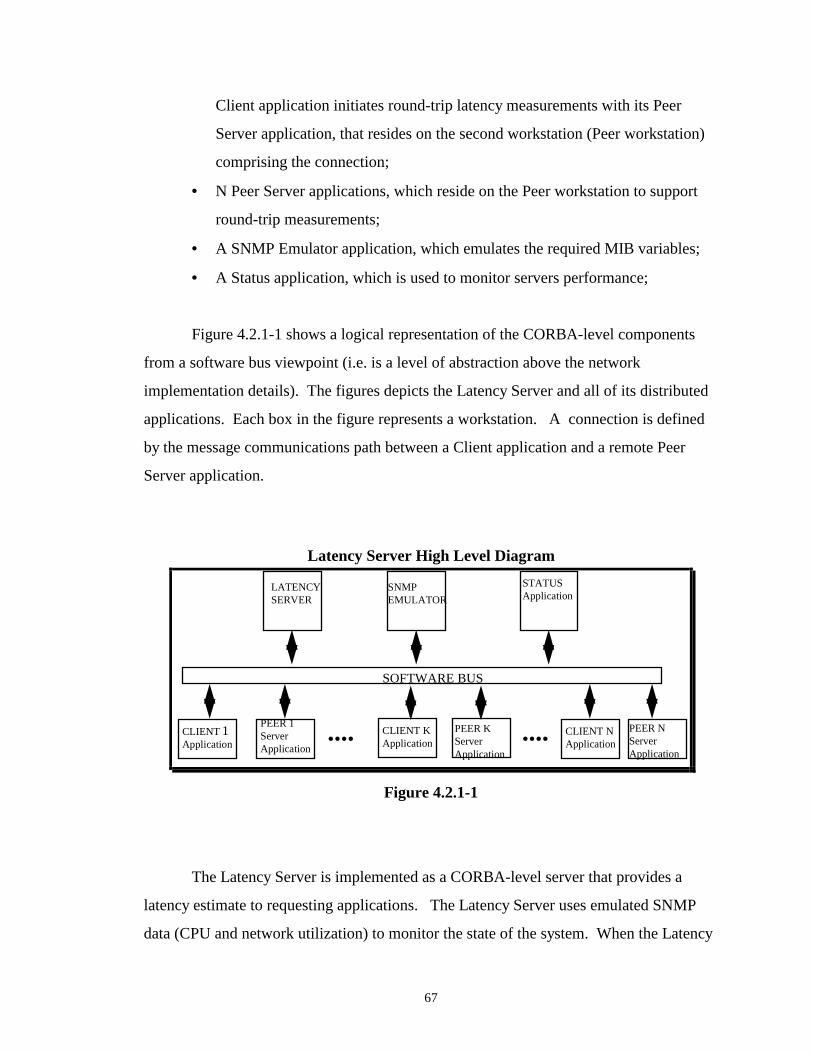
67
Client application initiates round-trip latency measurements with its Peer
Server application, that resides on the second workstation (Peer workstation)
comprising the connection;
• N Peer Server applications, which reside on the Peer workstation to support
round-trip measurements;
• A SNMP Emulator application, which emulates the required MIB variables;
• A Status application, which is used to monitor servers performance;
Figure 4.2.1-1 shows a logical representation of the CORBA-level components
from a software bus viewpoint (i.e. is a level of abstraction above the network
implementation details). The figures depicts the Latency Server and all of its distributed
applications. Each box in the figure represents a workstation. A connection is defined
by the message communications path between a Client application and a remote Peer
Server application.
Latency Server High Level Diagram
SOFTWARE BUS
LATENCYSERVER
CLIENT Application
1PEER 1ServerApplication
CLIENT KApplication
CLIENT NApplication
PEER KServerApplication
PEER NServerApplication
....
SNMPEMULATOR
....
STATUSApplication
Figure 4.2.1-1
The Latency Server is implemented as a CORBA-level server that provides a
latency estimate to requesting applications. The Latency Server uses emulated SNMP
data (CPU and network utilization) to monitor the state of the system. When the Latency
68
Server detects a state change for a connection, it will either calculate a new estimated
latency, or request a latency measurement between the Client application and Peer Server
application. The method of determining the latency estimate is depended on the
connections preconfigured QoS value.
The SNMP Emulator application, also a CORBA-level client, provides emulated
CPU utilization data for the client and peer workstations. In addition, it provides the
network loading (i.e. the port utilization for the intermediate ATM port). The Status
application, another CORBA-level client, provides an operator a view of the system’s
current state and the state of each connection.
4.2.3 Latency Server Scope and Assumptions
The prototype Latency Server makes numerous assumptions about the network.
These assumptions include:
1. The network configuration consists of two ATM switches, interconnected by 1 OC-3
port. The client and peer workstations are not connected to the same switch.
2. The ATM virtual connections utilize the UBR traffic contract between the End
Stations and the ATM switches.
3. Since actual ATM network latency measurements were not accomplished
simultaneously for both ATM port loading greater than 90% and workstation CPU
loading (i.e. for network measurements both workstations were always lightly
loaded), ATM port loading is assumed to be negligible (i.e. < 90%) when the
estimated latency bound is given.
4. Since actual latency measurements were not accomplish simultaneously for both
ATM port loading greater than 90% and the workstation CPU loading, the Latency
Server assumes that latency due to port loading and CPU loading is additive in nature
when estimated average latencies are provided. In calculating average latencies, it is
assumed that the effect of ATM port loading under 90% adds negligible latency.
When ATM port loading is greater than 90%, the port latency contribution is
69
calculated by (1/1- (network load)), where network load = (ATM port utilization -
91)/10. The equation (1/1-network load) is a general result in describing queue
loading effects [22].
5. All measurements are round-trip latencies.
6. Workstations are either TAC-3s or TAC-4s running applications over CORBA and
TCP/IP.
7. Depending on the selected QoS, connections will only be TAC-4 to TAC-4 or TAC-3
to TAC-3.
8. The SNMP Emulator is the source of emulated SNMP data at a rate of 10 Hz.
9. The Latency Server will only provide estimates for a specific message size:
64B, 128B, 256B, 512B, 1kB, 2KB, 4KB & 8KB
The Latency Server is dependent on the measurements that were accomplished in
Section 3. Therefore, the same hardware configuration, message sizes and measurement
techniques need to be reflected in the Latency Servers network configuration and design.
The ATM network was is a lightly loaded state when the workstation CPU
measurements were taken in Section 3. Likewise, the workstations were in a lightly
loaded state when the ATM network measurements were taken. There were no
measurements taken when both the ATM network and the workstations were both in a
heavily loaded condition. Therefore, there is no a priori measurement data which the
Latency Server can utilize when providing latency estimates for QoS 1 and QoS 2. To
provide average latency estimates for QoS 1, the Latency Server assumes that the loading
effects of the workstation and ATM network components are additive. In addition, it is
assumed that the network loading is defined by the equation identified in constraint
number 4. This equation is a rough approximation of the queuing seen by TCP when the
ATM ports are loaded to greater than 90% of their maximum capacity. No distinction for
port loading is made in regard to message size.
Since no system management application was available to support this work, a
simple script provide system state information was developed. This script runs at 10 Hz
rate, which is representative of a fairly fast system management polling rate.
70
4.2.4 Latency Server High Level Design
The physical configuration of the Latency Server system is depicted in Figure
4.2.3-1. The Latency Server, SNMP Emulator application and Status application can be
all collocated in one workstation or be distributed amongst numerous workstations.
Each connection that has a QoS of 3 or 4 requires a Client application in the client
workstation and the Peer Server application in the peer workstation. The Latency Server
provides the round-trip latency measurements. The number of Client applications and
Peer Server application pairings is dependent on the number of connections of interest,
and on the configuration of the system.
Initially, the Latency Server is provided pre-configured information for each
connection. This information consists of the workstation type,the size of message and the
QoS value. The workstation types and message sizes were defined in Section 4.2.2. As
previously discussed, there are four QoS values to choose from. These values result in
one of the following actions:
1. Utilize profile data to determine new average message latency.
2. Utilize profile data to determine the latency bound value in which x% of the
actual round-trip message latencies times must be less than it.
3. Take actual latency measurement and provide new latency average.
4. Take actual latency measurement and provide the latency bound value in
which x% of the actual round trip message latencies times must be less than it.
The Latency Server provides a new estimated latency value when the CPU
utilization states change between the client and peer workstations or when the ATM port
state changes. The CPU states represent a range of processor utilization (0-33%, 34-66%,
67-100%). Since both processors are accounted for, there are nine possible combinations
of CPU utilizations. These are the same combinations in which the measurements in
Section 3 were recorded. The ATM port state changes as follows:
1. Port utilization increases from less then 90% to greater then 90%;
2. Port utilization decreases from greater then 90% to less then 90%; and
3. Port utilization is above 90%, and changes, but is still above 90%.
71
The first two QoS cases do not require actual latency measurements. The
advantage of this approach is that no network resources and minimum workstation
resources are used to determine the estimated latencies.
For QoS Case 1, the average message latencies are based on the sum of a CPU
latency component and a network latency component. The CPU latency component is
determined by performing a look up of previously profiled latency data for the CPU state
and message size of interest. The port contribution is estimated as defined by Constraint
4 in Section 4.2.2. This latency estimate may be desirable for systems which can not
have an overly-restrictive message latency estimate, and can miss message latency
deadlines.
For QoS Case 2, the estimated latency bound is the time in which x% of the
measured average round-trip latencies are less than it. As previously stated, the bound for
this QoS is dependent on CPU state only. The bound is determined from previously-
recorded latency distribution data (Section 3) when the Latency Server initially starts up.
This bound is beneficial when it is known what percentage of the time the latency bound
is required to be greater than message latencies.
The next two QoS cases have the advantage that they provide the actual latencies
for the current system state. The disadvantage is that substantial network and workstation
resources are required to obtain the “estimates”. For QoS Case 3, the estimate latency is
the average of the actual measured latencies. The rationale for this QoS is similar to the
rationale for QoS Case 1. For QoS Case 4, the estimated latency bound is the time in
which x% of the measured average round-trip latencies are less then. The rationale for
this QoS is similar to the rationale for QoS Case 2.
The confidence interval for the average message latencies (QoS Cases 1 and 3) are
determined by Equation 1. All statistical equations in this thesis are from [16]. These
values represent the range in milliseconds in which there is a 95% statistical confidence
that the actual mean message latency falls within. Using Equation 2 and assuming the
standard deviation is 5 ms, the sampling error is about .1 ms for 10000 samples (QoS =
1) and less then .3 ms for 1000 samples (QoS = 3).

72
x ±z(a/2) . s/¥n (1)
where:
x = average sample message latency mean
z(a/2) = 1.96 (the z-value underneath the standard normal curve for 95% of the area)
s = ¥((( x2) - ( x)2)/n(n-1))
and n = number of samples ; (n=10000 for QoS =1 and n = 1000 for QoS = 3)
and x = sampled value
n = [(z(a/2). )E]2 (2)
where: E = the error and = standard deviations
The Latency Server provides both the lower and upper message latency values for the
95% percent confidence level for QoS 1 and 3.
To determine the maximum latency bound, Equation 3 is utilized, which is used to
calculate confidence intervals for a proportion.
p ±z(a/2) . ¥(p(1 - p)/n) (3)
where p = x/n; where x is the sample statistic and n is the number of samples
The proportion for this equation, is the proportion of samples that contain a specific
attribute in relation to the total number of samples taken. The samples of interest are the
ones with the characteristics that the average round-trip latency is less then the calculated
latency bound, t. Therefore, the proportion of interest is the percentage of average latency
values which are less than the latency bound.
The latency bound is first calculated by determining the number of samples which
need to be less then the latency bound. For example, if a 90% latency bound is required,
and 10000 samples are taken, then at least 9000 samples must be less then the latency
bound. As in Section 3 of this thesis, the latency distributions for message latencies for
both the a priori measurements and for the dynamic measurements are recorded in 100, 1
ms bins. Each bin contains the number of latency measurements for the specific 1 ms
window. To determine the latency bound, starting from the first bin, the number of
measurements of each bin in the latency distribution are cumulatively added until the total
73
number of measurements are equal to or greater then the required number of
measurements. The upper time value in milliseconds of the last bin added is the latency
value that the Latency Server returned. Also returned, as calculated by Equation 3, are
the 95% confidence interval for the value returned. For example, suppose the latency
distribution is described by the bar graph in Figure 3.2.2-2 and that the user specified
latency bound is 93%. The graph represents 100K samples. The latency time of 7 ms, is
the smallest latency time on the graph, in which 93K (93% of 100K) of the samples are
less than. On this graph, 7 ms represents the point in which 93.679K measurements were
accomplished. Using the confidence interval equations we arrive at the following result:
There is a 95% confidence that between 93.52 - 93.82% of actual message latencies are
less than the 7 ms.
Table 4.2.3-1 provides the IDL for the Latency Server. There are 4 structures
defined. The structures are:
• TableRow,
• IdlBaselineMeasurements,
• IdlStatusToClient, and
• IdlMibUpdates.
The Latency Server is designed around a table (an array of structures) which
contains the required information for each active connection. The data structure utilized
is the same structure layout which is defined in the IDL TableRow struct type. All
Latency Server data is stored in the table.
The data in the Latency Server is logically structured into 6 different data types.
More specifically the table contains the following type of data:
• configuration data,
• connection status data (server to requesting application),
• client generated data,
• MIB update data,
• MIB historical data and,
• connection state information.
74
The configuration information is known a priori and is read from a configuration
file at time of system start up. This contains basic paramatic information, workstation
types, message size and required quality of service, which are utilized in the calculation
of the estimates.
The connection status data is provided by the Latency Server to any requesting
client. The type of information contains all pertinent information of the status of the
connection. The primary information of this type is the latency estimate and the request
flag to the client to provide an actual measurement. The requesting client can receive this
information for a specific connection by invoking the RequestStatus method.
The Client application generates data which consists of the measured latency data
(average and maximum latency bound) for the Latency Server to update its status table.
This data is required if the connection is set with a QoS 3 or 4. This data is provided to
the Latency Server by invocation of the UpdateResponse method.
The MIB update data is the latest SNMP measurement data. For each connection,
this data consists of emulated CPU utilization data for both the Client and Peer
workstations. In addition an emulated ATM port utilization data is also provided. The
SNMP Emulation application client updates the Latency Server with this data by invoking
the PutMibUpdates method. The historical MIB data was the previous SNMP
measurement data.
The connection state information provides the current state of the CPU utilization
and ATM port utilization states.
The Latency Server has 2 phases of operation: A phase in which the Latency
Server is available to provide data to any requesting clients or receive data from the
Client applications; and a second phase in which the server updates the data table. These
two phase are encapsulated by an infinite loop. During program startup, the Latency
Server’s data table is created. After initialization, the loop is entered. The first phase of
operation is to instantitiate the CORBA-level server object so that it can service any
requesting clients. If no clients invoke any of the server’s methods for a period of 1
second, the CORBA-level object instantiation times-out and the Latency Server performs
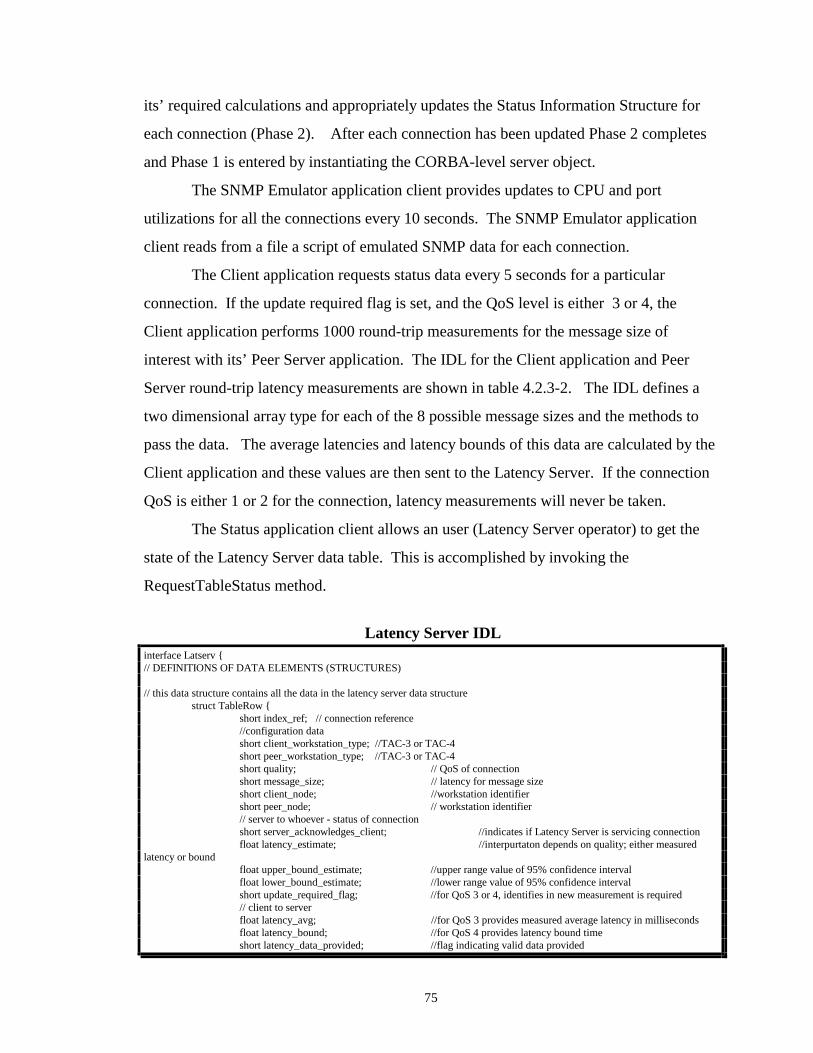
75
its’ required calculations and appropriately updates the Status Information Structure for
each connection (Phase 2). After each connection has been updated Phase 2 completes
and Phase 1 is entered by instantiating the CORBA-level server object.
The SNMP Emulator application client provides updates to CPU and port
utilizations for all the connections every 10 seconds. The SNMP Emulator application
client reads from a file a script of emulated SNMP data for each connection.
The Client application requests status data every 5 seconds for a particular
connection. If the update required flag is set, and the QoS level is either 3 or 4, the
Client application performs 1000 round-trip measurements for the message size of
interest with its’ Peer Server application. The IDL for the Client application and Peer
Server round-trip latency measurements are shown in table 4.2.3-2. The IDL defines a
two dimensional array type for each of the 8 possible message sizes and the methods to
pass the data. The average latencies and latency bounds of this data are calculated by the
Client application and these values are then sent to the Latency Server. If the connection
QoS is either 1 or 2 for the connection, latency measurements will never be taken.
The Status application client allows an user (Latency Server operator) to get the
state of the Latency Server data table. This is accomplished by invoking the
RequestTableStatus method.
Latency Server IDL
interface Latserv { // DEFINITIONS OF DATA ELEMENTS (STRUCTURES) // this data structure contains all the data in the latency server data structure struct TableRow { short index_ref; // connection reference //configuration data short client_workstation_type; //TAC-3 or TAC-4 short peer_workstation_type; //TAC-3 or TAC-4 short quality; // QoS of connection short message_size; // latency for message size short client_node; //workstation identifier short peer_node; // workstation identifier // server to whoever - status of connection short server_acknowledges_client; //indicates if Latency Server is servicing connection float latency_estimate; //interpurtaton depends on quality; either measured latency or bound float upper_bound_estimate; //upper range value of 95% confidence interval float lower_bound_estimate; //lower range value of 95% confidence interval short update_required_flag; //for QoS 3 or 4, identifies in new measurement is required // client to server float latency_avg; //for QoS 3 provides measured average latency in milliseconds float latency_bound; //for QoS 4 provides latency bound time short latency_data_provided; //flag indicating valid data provided
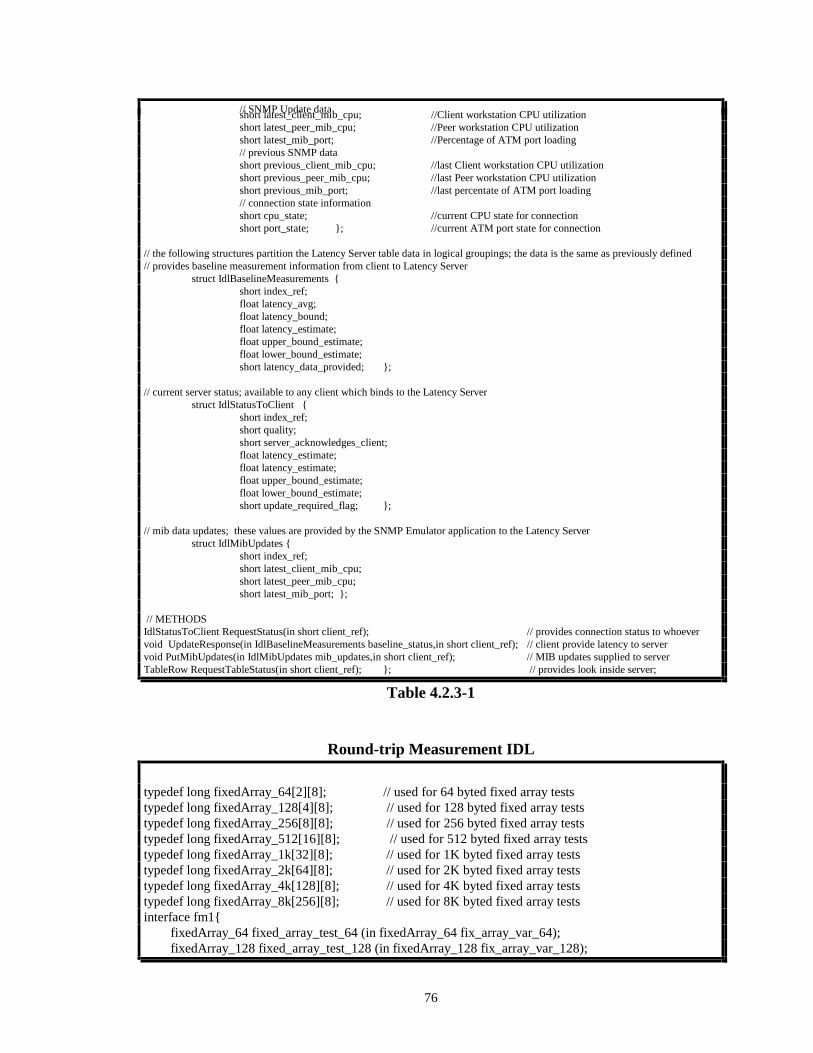
76
// SNMP Update data short latest_client_mib_cpu; //Client workstation CPU utilization short latest_peer_mib_cpu; //Peer workstation CPU utilization short latest_mib_port; //Percentage of ATM port loading // previous SNMP data short previous_client_mib_cpu; //last Client workstation CPU utilization short previous_peer_mib_cpu; //last Peer workstation CPU utilization short previous_mib_port; //last percentate of ATM port loading // connection state information short cpu_state; //current CPU state for connection short port_state; }; //current ATM port state for connection // the following structures partition the Latency Server table data in logical groupings; the data is the same as previously defined // provides baseline measurement information from client to Latency Server struct IdlBaselineMeasurements { short index_ref; float latency_avg; float latency_bound; float latency_estimate; float upper_bound_estimate; float lower_bound_estimate; short latency_data_provided; }; // current server status; available to any client which binds to the Latency Server struct IdlStatusToClient { short index_ref; short quality; short server_acknowledges_client; float latency_estimate; float latency_estimate; float upper_bound_estimate; float lower_bound_estimate; short update_required_flag; }; // mib data updates; these values are provided by the SNMP Emulator application to the Latency Server struct IdlMibUpdates { short index_ref; short latest_client_mib_cpu; short latest_peer_mib_cpu; short latest_mib_port; }; // METHODS IdlStatusToClient RequestStatus(in short client_ref); // provides connection status to whoever void UpdateResponse(in IdlBaselineMeasurements baseline_status,in short client_ref); // client provide latency to server void PutMibUpdates(in IdlMibUpdates mib_updates,in short client_ref); // MIB updates supplied to server TableRow RequestTableStatus(in short client_ref); }; // provides look inside server;
Table 4.2.3-1
Round-trip Measurement IDL
typedef long fixedArray_64[2][8]; // used for 64 byted fixed array tests typedef long fixedArray_128[4][8]; // used for 128 byted fixed array tests typedef long fixedArray_256[8][8]; // used for 256 byted fixed array tests typedef long fixedArray_512[16][8]; // used for 512 byted fixed array tests typedef long fixedArray_1k[32][8]; // used for 1K byted fixed array tests typedef long fixedArray_2k[64][8]; // used for 2K byted fixed array tests typedef long fixedArray_4k[128][8]; // used for 4K byted fixed array tests typedef long fixedArray_8k[256][8]; // used for 8K byted fixed array tests interface fm1{ fixedArray_64 fixed_array_test_64 (in fixedArray_64 fix_array_var_64); fixedArray_128 fixed_array_test_128 (in fixedArray_128 fix_array_var_128);
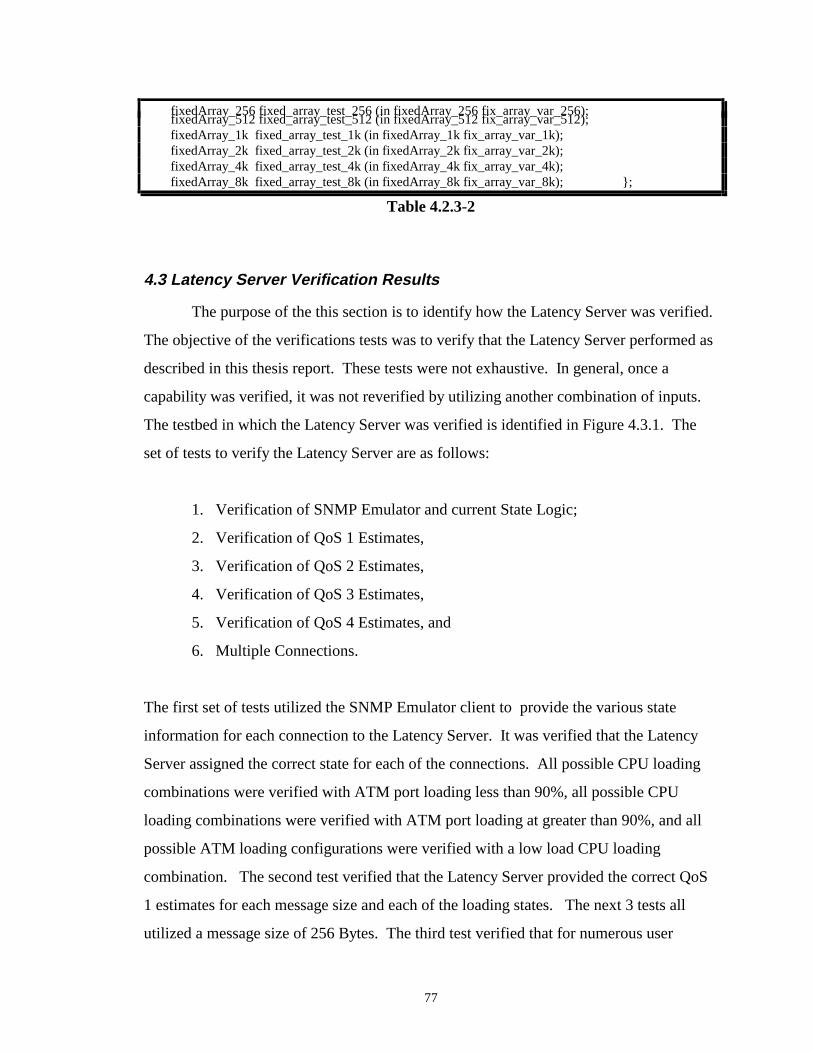
77
fixedArray_256 fixed_array_test_256 (in fixedArray_256 fix_array_var_256); fixedArray_512 fixed_array_test_512 (in fixedArray_512 fix_array_var_512); fixedArray_1k fixed_array_test_1k (in fixedArray_1k fix_array_var_1k); fixedArray_2k fixed_array_test_2k (in fixedArray_2k fix_array_var_2k); fixedArray_4k fixed_array_test_4k (in fixedArray_4k fix_array_var_4k); fixedArray_8k fixed_array_test_8k (in fixedArray_8k fix_array_var_8k); };
Table 4.2.3-2
4.3 Latency Server Verification Results
The purpose of the this section is to identify how the Latency Server was verified.
The objective of the verifications tests was to verify that the Latency Server performed as
described in this thesis report. These tests were not exhaustive. In general, once a
capability was verified, it was not reverified by utilizing another combination of inputs.
The testbed in which the Latency Server was verified is identified in Figure 4.3.1. The
set of tests to verify the Latency Server are as follows:
1. Verification of SNMP Emulator and current State Logic;
2. Verification of QoS 1 Estimates,
3. Verification of QoS 2 Estimates,
4. Verification of QoS 3 Estimates,
5. Verification of QoS 4 Estimates, and
6. Multiple Connections.
The first set of tests utilized the SNMP Emulator client to provide the various state
information for each connection to the Latency Server. It was verified that the Latency
Server assigned the correct state for each of the connections. All possible CPU loading
combinations were verified with ATM port loading less than 90%, all possible CPU
loading combinations were verified with ATM port loading at greater than 90%, and all
possible ATM loading configurations were verified with a low load CPU loading
combination. The second test verified that the Latency Server provided the correct QoS
1 estimates for each message size and each of the loading states. The next 3 tests all
utilized a message size of 256 Bytes. The third test verified that for numerous user
78
specified latency bounds, that the Latency Server provided the correct time estimate for
the connection. The fourth test verified that for QoS 3 that the Latency Server provided
latency estimates that were consistent with the QoS 1 estimates. This was accomplished
for all the CPU states. For this test ATM port loading was less than 90%. For the fifth
test, it was verified that for QoS 4, the Latency Server provided a realistic latency bound.
It was verified that the returned latency bound estimate either stayed the same or
increased as the user specified latency bound value increased. The last test,
demonstrated that the latency server could support multiple connections (two QoS 1
connections, one QoS 2 connection, two QoS 3 connections, and one QoS 4 connection)
simultaneously.
Verification Configuration
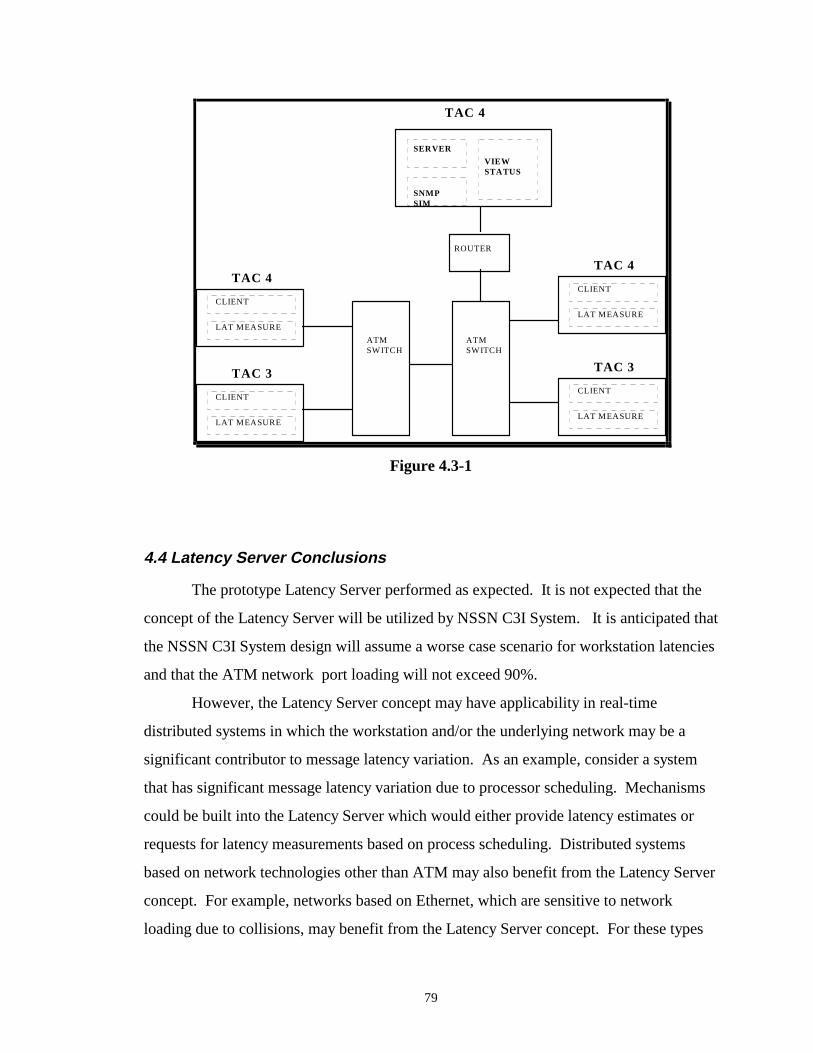
79
ROUTER
VIEWSTATUS
CLIENT
LAT MEASURE
CLIENT
LAT MEASURE
CLIENT
LAT MEASURE
CLIENT
LAT MEASURE
ATMSWITCH
SERVER
SNMPSIM
TAC 4
TAC 4TAC 4
TAC 3 TAC 3
ATMSWITCH
Figure 4.3-1
4.4 Latency Server Conclusions
The prototype Latency Server performed as expected. It is not expected that the
concept of the Latency Server will be utilized by NSSN C3I System. It is anticipated that
the NSSN C3I System design will assume a worse case scenario for workstation latencies
and that the ATM network port loading will not exceed 90%.
However, the Latency Server concept may have applicability in real-time
distributed systems in which the workstation and/or the underlying network may be a
significant contributor to message latency variation. As an example, consider a system
that has significant message latency variation due to processor scheduling. Mechanisms
could be built into the Latency Server which would either provide latency estimates or
requests for latency measurements based on process scheduling. Distributed systems
based on network technologies other than ATM may also benefit from the Latency Server
concept. For example, networks based on Ethernet, which are sensitive to network
loading due to collisions, may benefit from the Latency Server concept. For these types
80
of networks, the Latency Server should utilize collision information in determining
connection latencies. Also, distributed systems could theoretically be a combination of
numerous network technologies (FDDI, ethernet, token ring, ect.) interconnect by routers.
In this case, the Latency Server could use numerous system-level parameters to make the
latency estimate decisions. The Latency Server concept could also be extended to
systems that are based on Wide Area Networks (WANs). WANs introduce an additional
latency component since the latency of the physical medium becomes significant.
The implementation of the prototype Latency Server could be improved if threads
are utilized. The utilization of threads could help address the potential of any timing
problems between server invocations and maintaining the Latency Server data table.
With a thread implementation, a thread could be created to continuously update the
latency table data structure. Another thread could be created to execute the server method
invocations. The latency table data structure would require data locking mechanisms to
ensure data consistency.
81
5.0 Applicability of Thesis Results to Other Work
This section discusses two areas of current work in which the results of this thesis
may be of benefit. These areas are:
• NSSN C3I System and
• University of Rhode Island (URI) Real-time CORBA Research.
Potential Benefits to the NSSN Community. Currently, the NSSN community is
utilizing the standards which were identified in Table 1.1-1, to construct a NSSN C3I
System. One of the concerns in building this C3I System is the ability of the system to be
real-time. Of particular interest are the latencies contributions of the message
communications system. The measurements of Section 3 can provide the NSSN
community the following useful information concerning the COTS message latency
contributions:
• The aggegrate latency total of the COTS messaging components,
• The COTS components which contribute to latencies and the relative
magnitude of the latency contributions,
• Guidance on how the components can be constrained to achieve real-time
requirements, and
• The identification of the importance of how implementations of COTS
products may affect latency characteristics.
The identification of the aggegrate latency of the COTS messaging components is
important since this indicates potential problems with requirements and/or the proposed
implementation. Knowing information concerning relative latency contributions of the
COTS message communication system and guidance on how to constrain these
contributions, provides a means to alter the system design such that the requirements can
be met. For example, the most common maximum latencies identified in the NSSN
Specifications are 1 ms, 10 ms, 50 ms and 100 ms. Making the assumption that these
times reflect only network communication times, 50 ms is a realistic maximum soft real-
82
time latency requirement for the network’s message communication system. For
requirements that require message latencies of 10 ms - 20 ms or less, a real-time
operating system would be required (see section 3.9). This is due to HP-UX’s non-pre-
emptible timeslice of 10 ms. Because of the time-slice, the application maybe delayed up
to 10 ms before it is even scheduled. Even if a real-time operating system is utilized,
message size, CPU utilization and TCP/IP queuing may need to be accounted for.
This thesis also identified the issue that different configurations of COTS
components, and even different versions of the same COTS product, may produce
unexpected results. For example, it was shown that Orbix 2.0 had unusual results when
8K messages were passed, and that the TCP/IP measurements were actually worse
(slower) with HP-UX 10.0 running on a TAC-4 then with HP-UX-9 running on a TAC-3.
From findings such as these, it is recommended that the NSSN community properly
characterize the performance of each new COTS component when it is incorporated in
the C3I System.
Potential Benefits to the University of Rhode Island (URI) Research.
The real-time CORBA research team at URI is investigating approached to add
real-time extensions to CORBA. The research is primarily concerned to adding end-to-
end real-time constraints to method invocations. This research was initially identified in
[1]. To support real-time method invocations, one of the identified requirements was that
network latencies need to be known.
This research was further extended in [18]. Implementations were developed to
demonstrate the required interface facilities and the required support services to support
the end-to-end time constraints. The interface facilities contained time constraint
parameters: task importance, task deadlines, and Quality of Service. The required
CORBA support services were a Global Priority Service and a modification of the
Concurrency Control Service to support real-time constraints.
The potential contributions of this thesis to the URI work are as follows:
• Provide informaction concerning the dynamic latency characteristics of the
underlying message communication components;
83
• Provide a methodology on how to measure the latencies of the underlying
network;
• Identify the process scheduling has a significant effect on maximum message
latencies;
• Provide the concept of the Latency Server.
This thesis demonstrated that message latency can vary significantly depending on system
conditions. A static message latency value may be undesirable. This thesis identified the
system components and conditions which can effect system latency, provided metrics to
assess message latency (average latency, maximum latency, and latency distribution) and
provided a methodology to measure latencies. This research may assist the URI research
team in how to determine message latencies to support their reaserch needs.
In addition, process scheduling was identified to be the most significant factor
influencing maximum message latency. This should be guidance to ensure that
processes involved in message communication be given sufficient priority to allow for
messages to meet their time constraints.
Perhaps the most significant contribution of this work to the URI research is the
concept of the Latency Server. The Latency Server can dynamically provide the message
latencies for each connection. The concept of the Latency Server could become a
CORBA service which could be utilize to support the real-time method invocations. This
would be beneficial in that fairly accurate message latencies would be provided, ensuring
that the latency estimates are not too low (to prevent missed deadlines) nor are to high (to
ensure that applications are allotted a maximum amount of time).
84
6.0 Recommended Changes to Standards
This section provides recommendations to the standards which were utilized for
this thesis research. The standards of interest are ATM, TCP/IP and CORBA.
6.1 ATM Recommended Changes
The ATM virtual circuits that were utilized in this thesis work were based on an
Unspecified Bit Rate (UBR) contract. This means that if ATM cell traffic exceeds the
available virtual connection bandwidth, then ATM cells can be lost. Cell loss was
demonstrated in Section 3.6.2-1. In addition, UBR cell is also demonstrated in [21]. Cell
loss is undesirable for real-time systems in that data is lost. If the lost data is time-critical
and if this data is not resent, then effectively the data latency is infinite, which will cause
real-time requirements not to be met. If the data is resent, then additional latency is
incurred due to the data being resent. This additional latency may potentially cause time
constraints to be violated.
ATM provides the ability to ensure that cell loss does not occur by setting up
either Constant Bit Rate (CBR) or Variable Bit Rate (VBR) traffic contract for a virtual
connection. This traffic contract is between the End Stations and the ATM network. The
viability of using an ATM CBR traffic contract to prevent ATM cell loss was
demonstrated in [21].
The current ATM Standards only allow the CBR and VBR traffic contracts to be
set up a priori by utilizing Permanent Virtual Circuits (PVC). To allow maximum
flexibility for the run-time environment it would be desirable for applications to specify
traffic contracts for connections dynamically by utilizing Switched Virtual Circuits
(SVCs). The traffic contract could be specified by an application through the appropriate
(Application Programmer’s Interface) API. This enhancement would provide an ability
for the run-time environment to ensure that the virtual connection is at the appropriate
ATM QoS for the message priority. For instance, if the virtual connection is used for a
constant stream of high priority data than a CBR connection be specified. If the data is
periodic high priority data, perhaps a VBR connection would be specified. Else if, the
data if relatively low priority, than perhaps a Available Bit Rate (ABR) or UBR

85
connection would be specified. Also, under this scheme, ATM network resources are not
reserved until they are actually required.
6.2 TCP/IP Recommended Changes
TCP/IP is effectively a type of “middleware” between the workstations run-time
environment and the network. This “middleware” should not adversely impact the
ability for the system to meet its real-time requirements. Ideally, TCP/IP should have the
following requirements:
1) No information on how the data should be processed (i.e. priority) should
lost;
2) TCP/IP should provide the ability for the application to access the underlying
network’s setup parameters.
Section 2.2.1 briefly introduced the role of scheduling and the utilization of
priorities as a mechanisms in designing real-time systems. Section 3 demonstrated the
utilization of priorities to schedule processes to meet real-time requirements was briefly
discussed. A problem with TCP/IP with respect to real-time systems, is that TCP/IP does
not support the concept of priorities. Messages which are of low priority may be serviced
before high priority messages when TCP/IP is used. To effectively support real-time,
TCP/IP should establish a mechanism to recognize message priorities. The message
priorities need to be insured throughout the protocol stack.
TCP/IP should also be able to pass QoS information to the underlying ATM
network. With this information, the traffic contract could be specified (i.e. VBR, CBR)
for the underlying network, along with other specifications (PCR, SCR, MSB) to support
these contracts. In addition, TCP/IP should provide mechanism to allow for the dynamic
establishment of ATM virtual connections.
Another approach may be to eliminate TCP. The reliability mechanisms which
TCP provides may not be necessary with the emergence of ATM Available Bit Rate
(ABR) traffic contract. ABR has a form of flow control built into it. ABR will replace
current UBR. The CBR and VBR traffic contracts guarantee that the network resources

86
are available to support specified network traffic. These mechanisms reduce the need for
TCP reliability mechanisms. In addition, the elimination of TCP mechanisms may reduce
problems, such as, the deadlock condition which can occur over ATM [2].
Instead of TCP, applications could interface to an ATM API which supports the
dynamic allocation of virtual connections, and the setting of QoS parameters for these
connections. The underlying IP layer should be modified to support this ATM API. IP
itself could also be eliminated, but this may be undesirable since IP addressing has
become so prevalent.
6.3 CORBA Recommended Changes
Currently, applications in the current CORBA-level run-time environment do not
have the appropriate mechanisms to support real-time requirements. Since CORBA
provides the framework to facilitate communications between applications, the CORBA-
level is a natural layer to incorporate real-time mechanisms for distributed applications.
From an application perspective, it would be desirable to build mechanisms into
CORBA in which timing information is made available to the CORBA based
applications. This timing information is available to the application to help ensure that
processing deadlines are not violated. These mechanisms are described in detail in [1].
However, to determine the timing requirements for the applications, the latency of the
underlying network needs to be known. The underlying network latencies could be
provided by an implementation of the Latency Server concept introduced in this thesis. It
may be desirable that a Latency Server be provided as a CORBA service that would be
available to any application.
From a message communication perspective, it would be desirable for the
CORBA implementation to be directly over a transport protocol which supports ATM
QoS and dynamic allocation of ATM virtual circuits. With this underlying network
functionality, a message communication system that could directly utilize ATM virtual
connections to maintain message priority throughout the distributed system. The ORB
would be required to specify and manage the virtual connections. In addition, the ORB
would have to perform the associated queuing functionality.

87
From information which could be supplied by the applications to the ORB, the
ORB could dynamically create virtual connections, with the appropriate QoS settings to
support the required application communications. This would require addition
computational complexity on the part of the ORB. For instance, an Iona implementation,
to establish a connection, the orbixd daemon would do the following additional steps:
• Retrieve applications real-time requirements,
• Determine if a virtual circuit of the required priority is available to the
destination, and
• if the virtual circuit is not available, create it, specify the correct QoS
parameters, and establish the required queuing in workstation address space.
88
7.0 Conclusions
This work identified the major contributing sources of message latencies in the
COTS data messaging system that will be utilized in NSSN C3I System. It was shown
that the most significant sources of the latency were due to the workstation components.
For the configurations investigated, the most significant cause of latency was due to
processes waiting to be scheduled on the CPU. It was demonstrated that process could be
given higher priorities to significantly lessen this component of message latency. It was
also demonstrated that TCP/IP queuing could have a significant effect on latencies if
message traffic was heavy. The Iona implementation of CORBA was shown to result in a
1 -2 ms increase in average latencies, but was shown to have minimal effect on maximum
latencies or latency distributions. The effect of ATM network latencies was shown to be
very small (in the microsecond range) relative to the other latency components. However,
ATM latency can become a significant factor if ATM port utilization’s are at 91% or
above their maximum rates.
A prototype Latency Server was also developed in which either latency averages
or user-specified latency bounds are provided to any requesting application. Latencies
were either estimated or measured when CPU utilization or ATM port loading changed.
Latency estimates were derived from the measurement data. Round-trip measurements
were taken to provide the measured values.
Finally, based on this work, recommendation were made for ATM, TCP/IP and
CORBA. The primary recommendation for ATM is to provide an API to applications
such that applications can dynamically establish virtual connection. The primary
recommendation for TCP is to support message priority and to provide an interface to
ATMs underlying QoS parameters. The first recommendation for CORBA was to
implement the Latency Server concept as a CORBA service which would be available to
applications to assist in determining time constraints. A second recommendation to
CORBA is to assume that applications can establish virtual ATM connection and that the
underlying transport layer does support message priorities, and to implement in the ORB
a mechanism to support message priorities using ATMs virtual connections.
89
In summary, this thesis identified the sources of latency in a COTS message
communication system, identified a means to dynamically determine message latencies,
and provided recommendations on how these components could be improved. In short,
the thesis objectives were accomplished.
90
8.0 Recommendations for Future Work
There are three primary areas in which the work started in this thesis could be
extended:
1. Continue measurements for additional details.
2. Expand the Latency Server.
3. Investigate how QoS can be extended to include workstation resources.
Expand Measurements. Measurements could be continued to further determine the
latency effects for more complex system configurations. The work done in this thesis,
assumed rather simple scenarios. Additional measurements may include the following:
• TCP/IP queuing effects of latencies for various loading configurations;
• Maximum latencies as effected by various parameters (CPU utilization’s,
message sizes, ect);
• Further determination on how various hardware implementations can effect
latencies;
• Effects on how multiple processes at various priority levels effect message
latencies; and
• Detailed analysis on how CPU utilization effects latency.
From the measurements taken in this report, it was shown that TCP/IP queuing can be a
major effect of message latency. This thesis looked at one possible configuration. The
maximum queuing of this configuration was not addressed. In addition, it may be
important to understand what the worse case loading configuration could be.
Message maximum latencies were seen to be greater for CORBA than TCP/IP for
the TAC-3 configuration. Not enough measurements were taken to determine if the same
is true for the TAC-4 configurations. Additional measurements could be determine if
indeed TAC-4 CORBA maximum latencies are greater then TCP/IP maximum latencies.
This thesis demonstrated that hardware implementation can effect latency
performance by providing unexpected results. Additional measurements could be
91
obtained to identify why the TAC-4 does not perform as well as the TAC-3 for some
configurations.
Setting process priority was demonstrated to have an effect on message latencies.
It may be of use to determine how multiple processes should be prioritized relative to
each other to ensure message latencies are within requirements.
CPU utilization was determined to have potentially significant effects on message
latencies. The CPU utilization’s in this work were at a relatively high level of granularity
(i.e. 33%). It may be of interest to further understand how CPU utilization effects
message latency.
Expand Latency Server. The Latency Server could be extended to include the loading
effects of different network technologies and/or different network topologies. For
instance, Ethernet based distributed systems may need to look on how collisions effect
message latencies. In addition, for a non-trivial system, the Latency Server should also be
extended to take into account process scheduling and process priorities of the system
workstations.
Full System Support of QoS. This work has shown that workstation resources have a
significant effect on message latencies. It would be desirable to provide a message
communication system which not only utilize QoS to specify network resources but to
also specify workstation resources as well.
This thesis identified numerous topics concerning COTS message
communications systems. As shown by this reaserch, this is an important topic which has
many facets. It is my hope that this thesis developed an adequate framework to aid
further research for both the NSSN C3I System community and the real-time CORBA
research group at URI.
92
References
1. V Fay Wolfe, J.K Black, B. Thraisingham and P. Krupp, “Real-time Method
Invocations in Distributed Environments”, Third International High Performance
Computing Conference, December 1995.
2. Moldeklev, K. and Gunningberg, P., “How a Large ATM MTU Causes Deadlocks in
TCP Data Transfers,” IEEE Trans. on Networking, vol. 3, no. 4, August 1995, pp 409-
422.
3. G. Coulson, A. Campbell, P. Robin, G. Blair, M. Papathomas and D. Shepherd, “The
Design of a QoS-Controlled ATM-Based Communications System in Chorus”, IEEE
JSAC, Vol 13, no. 4, May 1995, pp 686 - 698.
4. Liu, C. L. and Layland J. W., “Scheduling Algorithms for Multiprogramming in a Hard
Real Time Environment”, JACM 20 (1):46 - 61, 1973.
5. C. B. Tipper and J. N. Daigle, “ATM Cell Delay and Loss for Best-Effort TCP in the
Presence of Isonchronous Traffic”, IEEE Journal on Selected Areas in Communications,
Vol. 13, October 1995, pp 1457 - 1463.
6. W. Zhao, K. Ramamritham and J. A. Stankovic, “Preemptive Scheduling Under Time
and Resource Constraints”, IEEE Trans. on Computers, Vol., C-36, no. 8 August 1987.
7. S. Bocking, “TIP’s Performance Quality of Service”, IEEE Communications
Magazine, August 1995, pp. 74 - 81.
8. J. Y. Hui, J. Zhang, and J. Li, “Quality-of-Service Control in GRAMS for ATM Local
Area Network”, IEEE JSAC, Vol. 13, no. 4, May 1995.
9. H. Tokuda, C. Mercer, Y. Ishikawa and T. E. Marchok, “Priority Inversions in Real-
Time Communication”, IEEE 1989, pp348 - 358.
10. K. G. Shin and C. Hou, “Analysis of Three Contention Protocols In distributed Real-
Time Systems, RTSS 1990, pp. 136 - 144.
11. W. Zhao, J. Stankovic and K. Ramamritham, “A Window Protocol for Transmission
of Time-Constrained Messages”, IEEE Trans. on Computers, Vol. 39, No. 9, September
1990, pp 1186 - 1203.
12. C. Venkatramani, T. Chiueh, “Supporting Real-Time Traffic on Ethernet”, RTSS,
1994, pp 282 -286.
93
13. N. Malcolm and W. Zhao, “TheTimed-Token Protocol for Real-Time
Communications”, IEEE Computer, January 1990, pp 35 - 41.
14. K. Nahrstedt and J. M. Smith “The QOS Broker”, IEEE MultiMedia, Spring 1995,
pp 53 - 67.
15. M. J. Bach, “The Design of the UNIX Operating System”, Prentice-Hall, Englewood
Cliffs, N.J. 1986.
16. N. A. Weiss and M. J. Hassett, “Introductory Statistics”, Addison-Wesley Publishing
Company, Reading, MA, 1987, pp 297 - 340.
17. The Common Request Broker Architecture and Specification, Revision 2.0, July
1995.
18. L. C. DiPippo, R. Ginis, M. Squadrito, S. Wohlever, V. Fay Wolfe, I. Zykh, and R.
Johnston, “Expressing and Enforcing Timing Constraints in a CORBA Environment”,
University of Rhode Island, Computer Science Department DRAFT Report.
19. A. Gokhale and D. C. Schmidt, “Measuring the Performance of Communication
Middleware on High-Speed Networks”, ACM 1996, Stanford University, August 28-30,
1996.
20. ADTECH Inc., http//adtech-inc.com.
21. G. Bussiere and R. Pallack, “New Attack Submarine Performance of ATM-Based
Networks: A Study for NSSN C3I Infrastructure”, Naval Undersea Warfare Center
Division, Newport, RI, December 1996.
22. A. Tanenbaum, “Computer Networks”, Prentice Hall, Upper Saddle River, NJ, 1996
p. 561.
23. M. Santifaller, “TCP/IP and ONC/NFS”, Addison-Wesley, New York, NY, 1994, pp
5 - 10.
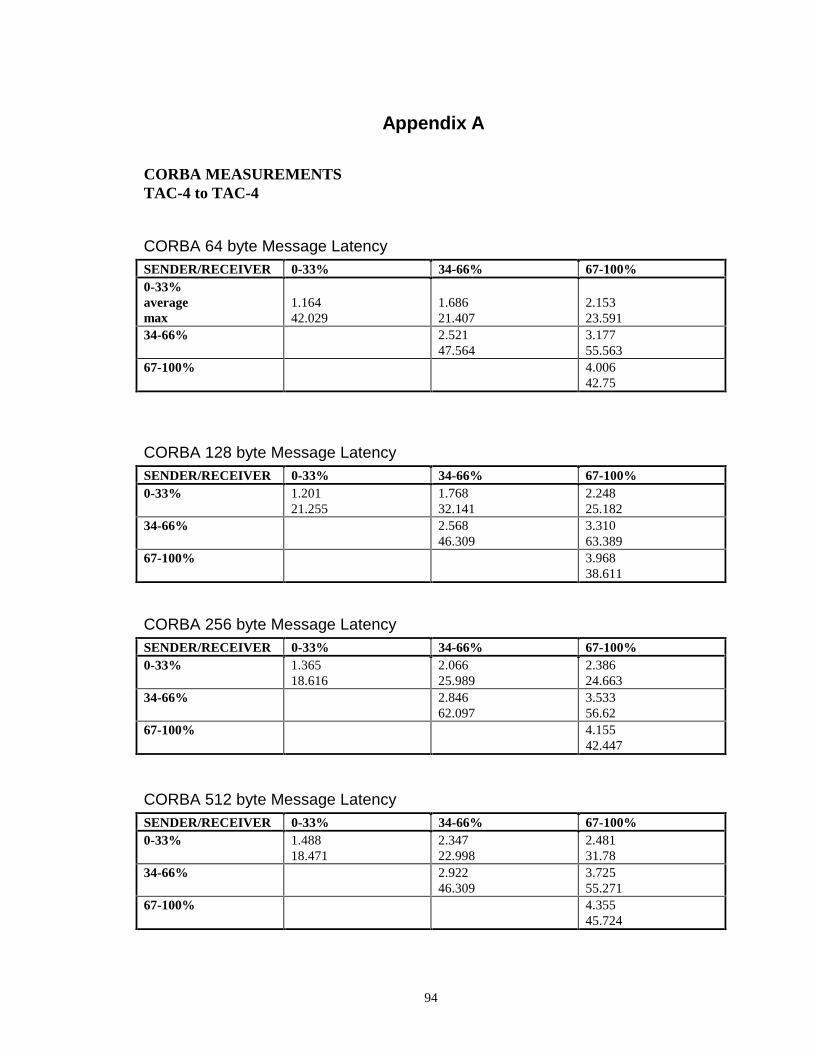
94
Appendix A
CORBA MEASUREMENTS TAC-4 to TAC-4
CORBA 64 byte Message Latency SENDER/RECEIVER 0-33% 34-66% 67-100% 0-33% average max
1.164 42.029
1.686 21.407
2.153 23.591
34-66% 2.521 47.564
3.177 55.563
67-100% 4.006 42.75
CORBA 128 byte Message Latency SENDER/RECEIVER 0-33% 34-66% 67-100% 0-33%
1.201 21.255
1.768 32.141
2.248 25.182
34-66% 2.568 46.309
3.310 63.389
67-100% 3.968 38.611
CORBA 256 byte Message Latency SENDER/RECEIVER 0-33% 34-66% 67-100% 0-33%
1.365 18.616
2.066 25.989
2.386 24.663
34-66% 2.846 62.097
3.533 56.62
67-100% 4.155 42.447
CORBA 512 byte Message Latency SENDER/RECEIVER 0-33% 34-66% 67-100% 0-33%
1.488 18.471
2.347 22.998
2.481 31.78
34-66% 2.922 46.309
3.725 55.271
67-100%
4.355 45.724
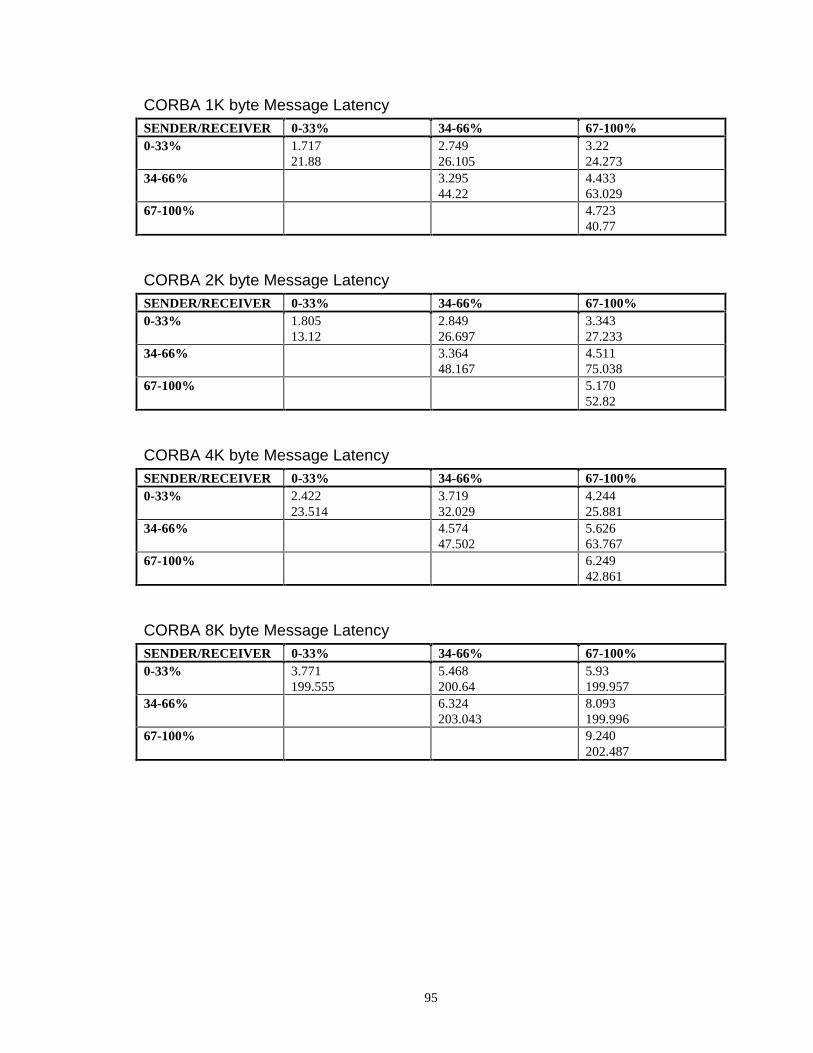
95
CORBA 1K byte Message Latency SENDER/RECEIVER 0-33% 34-66% 67-100% 0-33%
1.717 21.88
2.749 26.105
3.22 24.273
34-66%
3.295 44.22
4.433 63.029
67-100%
4.723 40.77
CORBA 2K byte Message Latency SENDER/RECEIVER 0-33% 34-66% 67-100% 0-33%
1.805 13.12
2.849 26.697
3.343 27.233
34-66% 3.364 48.167
4.511 75.038
67-100%
5.170 52.82
CORBA 4K byte Message Latency SENDER/RECEIVER 0-33% 34-66% 67-100% 0-33%
2.422 23.514
3.719 32.029
4.244 25.881
34-66% 4.574 47.502
5.626 63.767
67-100%
6.249 42.861
CORBA 8K byte Message Latency SENDER/RECEIVER 0-33% 34-66% 67-100% 0-33%
3.771 199.555
5.468 200.64
5.93 199.957
34-66%
6.324 203.043
8.093 199.996
67-100%
9.240 202.487
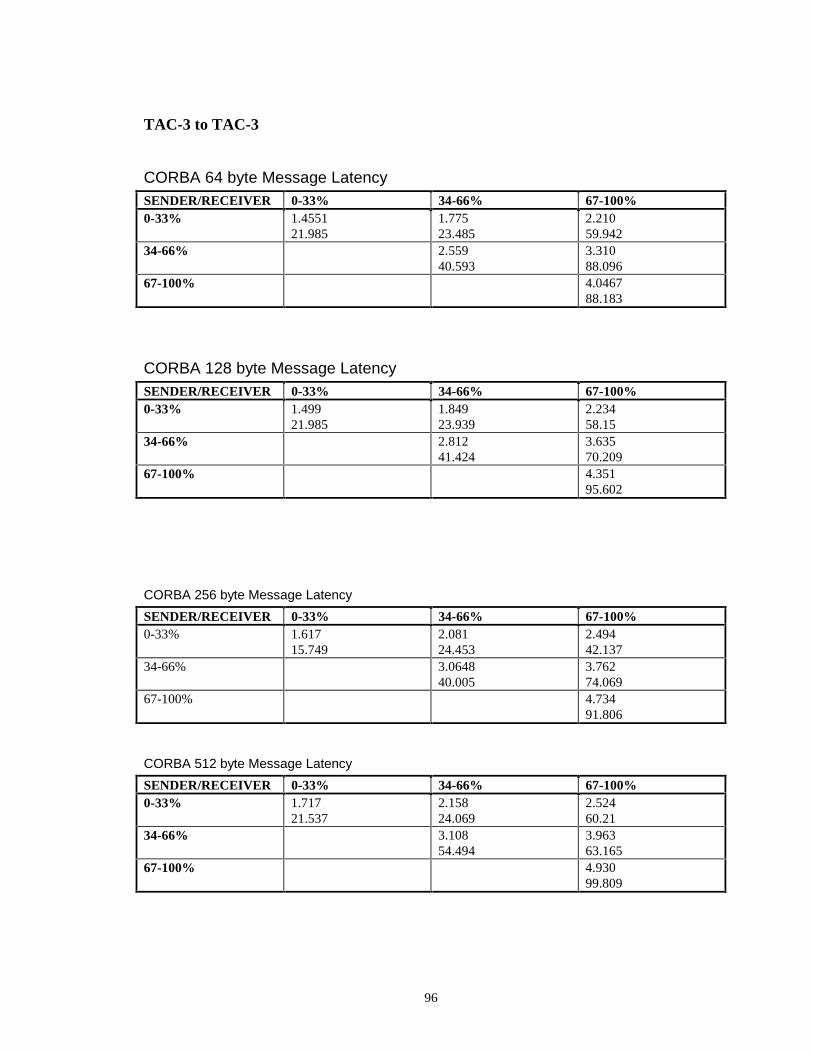
96
TAC-3 to TAC-3
CORBA 64 byte Message Latency SENDER/RECEIVER 0-33% 34-66% 67-100% 0-33%
1.4551 21.985
1.775 23.485
2.210 59.942
34-66% 2.559 40.593
3.310 88.096
67-100% 4.0467 88.183
CORBA 128 byte Message Latency SENDER/RECEIVER 0-33% 34-66% 67-100% 0-33%
1.499 21.985
1.849 23.939
2.234 58.15
34-66% 2.812 41.424
3.635 70.209
67-100% 4.351 95.602
CORBA 256 byte Message Latency
SENDER/RECEIVER 0-33% 34-66% 67-100% 0-33%
1.617 15.749
2.081 24.453
2.494 42.137
34-66% 3.0648 40.005
3.762 74.069
67-100%
4.734 91.806
CORBA 512 byte Message Latency
SENDER/RECEIVER 0-33% 34-66% 67-100% 0-33%
1.717 21.537
2.158 24.069
2.524 60.21
34-66% 3.108 54.494
3.963 63.165
67-100% 4.930 99.809
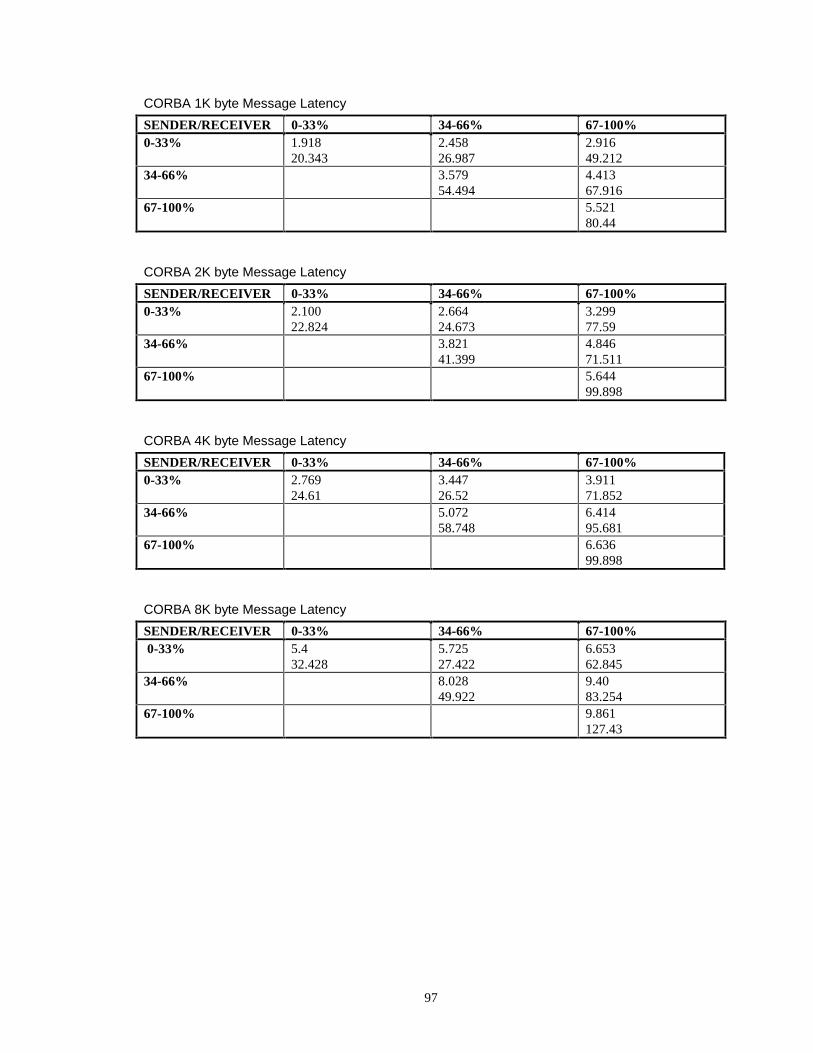
97
CORBA 1K byte Message Latency
SENDER/RECEIVER 0-33% 34-66% 67-100% 0-33%
1.918 20.343
2.458 26.987
2.916 49.212
34-66% 3.579 54.494
4.413 67.916
67-100% 5.521 80.44
CORBA 2K byte Message Latency
SENDER/RECEIVER 0-33% 34-66% 67-100% 0-33%
2.100 22.824
2.664 24.673
3.299 77.59
34-66% 3.821 41.399
4.846 71.511
67-100% 5.644 99.898
CORBA 4K byte Message Latency
SENDER/RECEIVER 0-33% 34-66% 67-100% 0-33% 2.769
24.61 3.447 26.52
3.911 71.852
34-66%
5.072 58.748
6.414 95.681
67-100% 6.636 99.898
CORBA 8K byte Message Latency
SENDER/RECEIVER 0-33% 34-66% 67-100% 0-33%
5.4 32.428
5.725 27.422
6.653 62.845
34-66% 8.028 49.922
9.40 83.254
67-100% 9.861 127.43
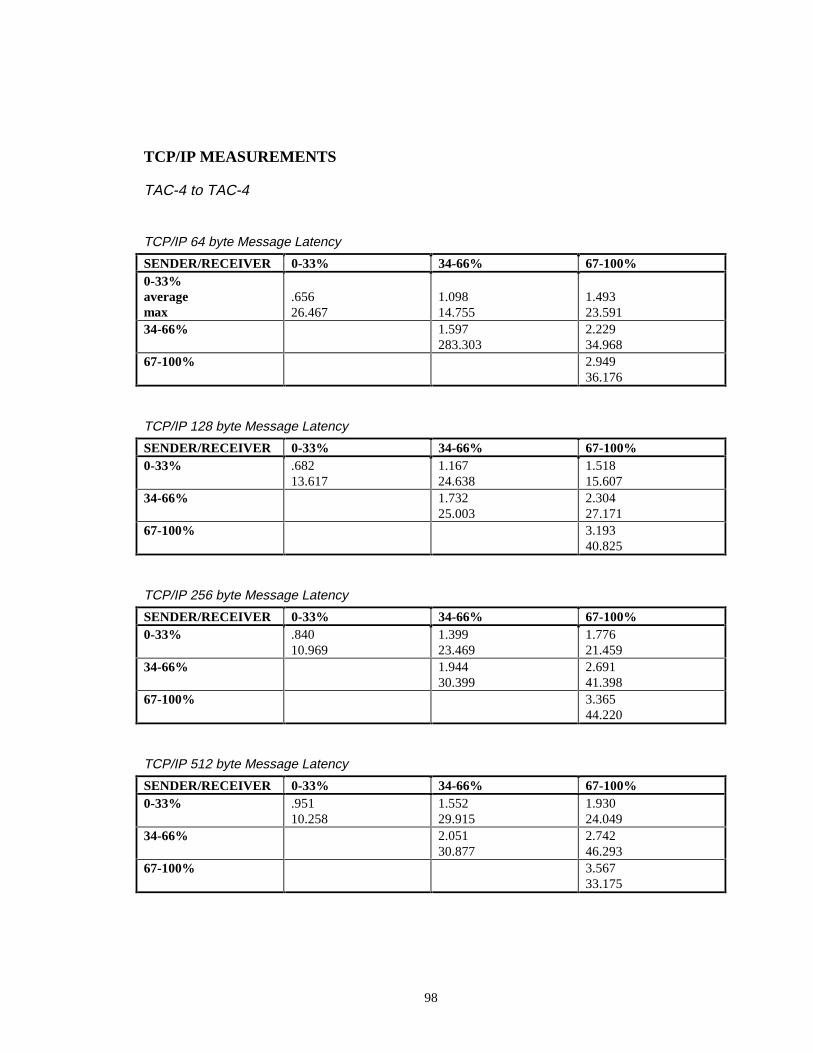
98
TCP/IP MEASUREMENTS
TAC-4 to TAC-4
TCP/IP 64 byte Message Latency
SENDER/RECEIVER 0-33% 34-66% 67-100% 0-33% average max
.656 26.467
1.098 14.755
1.493 23.591
34-66% 1.597 283.303
2.229 34.968
67-100% 2.949 36.176
TCP/IP 128 byte Message Latency
SENDER/RECEIVER 0-33% 34-66% 67-100% 0-33% .682
13.617 1.167 24.638
1.518 15.607
34-66% 1.732 25.003
2.304 27.171
67-100% 3.193 40.825
TCP/IP 256 byte Message Latency
SENDER/RECEIVER 0-33% 34-66% 67-100% 0-33% .840
10.969 1.399 23.469
1.776 21.459
34-66% 1.944 30.399
2.691 41.398
67-100% 3.365 44.220
TCP/IP 512 byte Message Latency
SENDER/RECEIVER 0-33% 34-66% 67-100% 0-33% .951
10.258 1.552 29.915
1.930 24.049
34-66% 2.051 30.877
2.742 46.293
67-100% 3.567 33.175
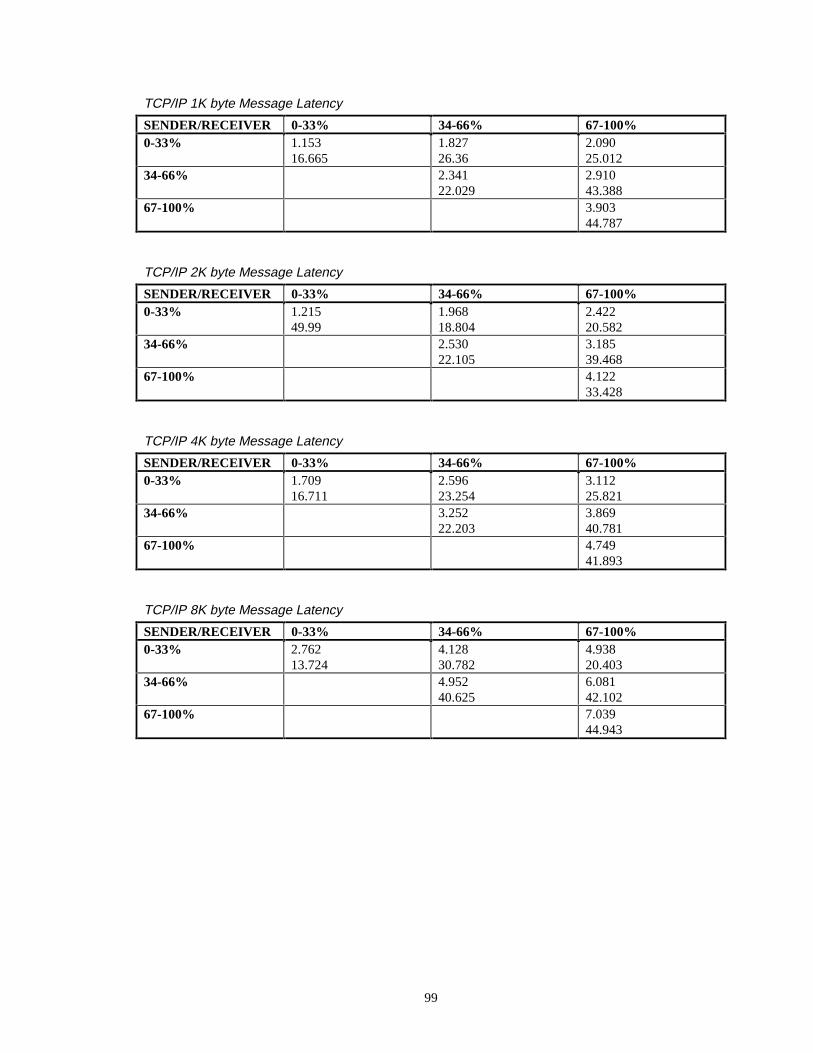
99
TCP/IP 1K byte Message Latency
SENDER/RECEIVER 0-33% 34-66% 67-100% 0-33% 1.153
16.665 1.827 26.36
2.090 25.012
34-66% 2.341 22.029
2.910 43.388
67-100% 3.903 44.787
TCP/IP 2K byte Message Latency
SENDER/RECEIVER 0-33% 34-66% 67-100% 0-33% 1.215
49.99 1.968 18.804
2.422 20.582
34-66% 2.530 22.105
3.185 39.468
67-100% 4.122 33.428
TCP/IP 4K byte Message Latency
SENDER/RECEIVER 0-33% 34-66% 67-100% 0-33% 1.709
16.711 2.596 23.254
3.112 25.821
34-66% 3.252 22.203
3.869 40.781
67-100% 4.749 41.893
TCP/IP 8K byte Message Latency
SENDER/RECEIVER 0-33% 34-66% 67-100% 0-33% 2.762
13.724 4.128 30.782
4.938 20.403
34-66% 4.952 40.625
6.081 42.102
67-100% 7.039 44.943
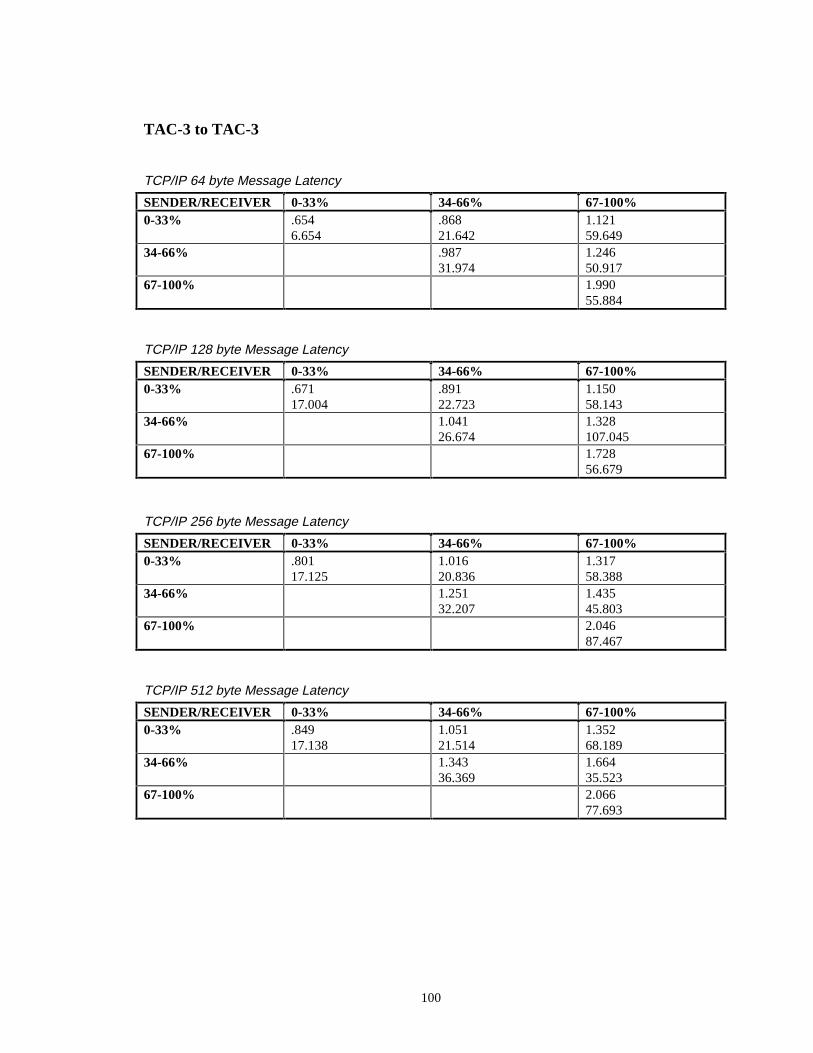
100
TAC-3 to TAC-3
TCP/IP 64 byte Message Latency
SENDER/RECEIVER 0-33% 34-66% 67-100% 0-33% .654
6.654 .868 21.642
1.121 59.649
34-66% .987 31.974
1.246 50.917
67-100% 1.990 55.884
TCP/IP 128 byte Message Latency
SENDER/RECEIVER 0-33% 34-66% 67-100% 0-33% .671
17.004 .891 22.723
1.150 58.143
34-66% 1.041 26.674
1.328 107.045
67-100% 1.728 56.679
TCP/IP 256 byte Message Latency
SENDER/RECEIVER 0-33% 34-66% 67-100% 0-33% .801
17.125 1.016 20.836
1.317 58.388
34-66% 1.251 32.207
1.435 45.803
67-100% 2.046 87.467
TCP/IP 512 byte Message Latency
SENDER/RECEIVER 0-33% 34-66% 67-100% 0-33% .849
17.138 1.051 21.514
1.352 68.189
34-66% 1.343 36.369
1.664 35.523
67-100% 2.066 77.693
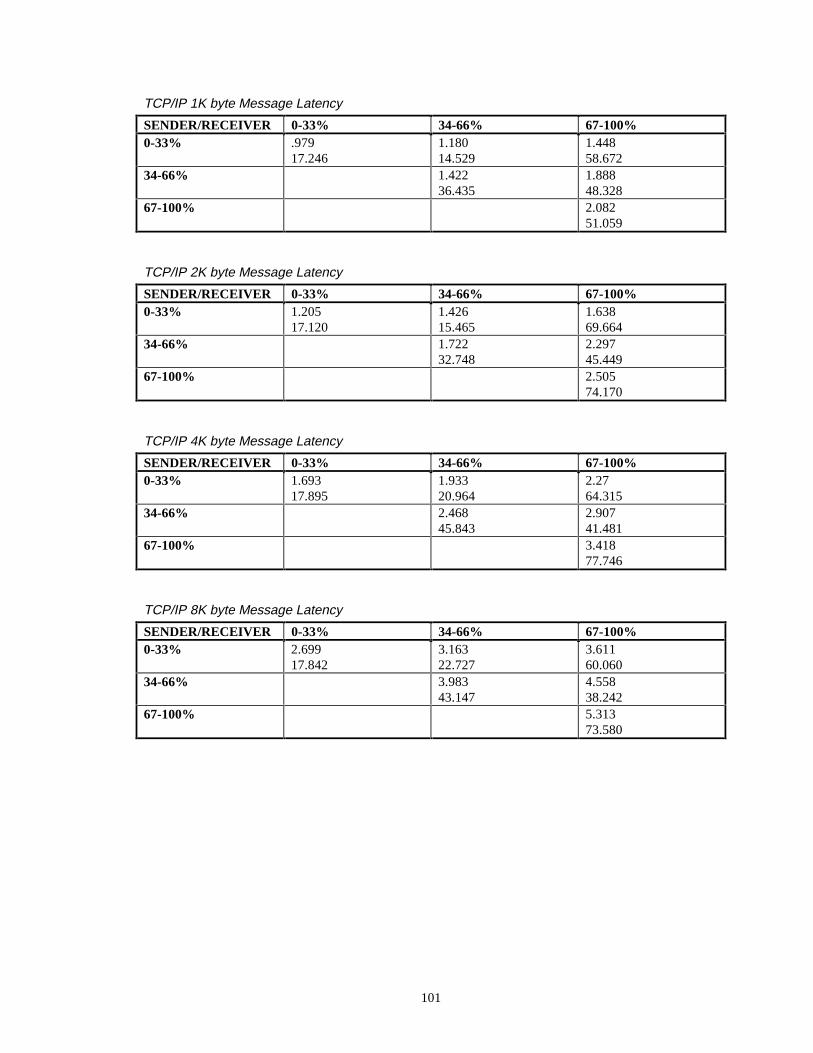
101
TCP/IP 1K byte Message Latency
SENDER/RECEIVER 0-33% 34-66% 67-100% 0-33% .979
17.246 1.180 14.529
1.448 58.672
34-66% 1.422 36.435
1.888 48.328
67-100% 2.082 51.059
TCP/IP 2K byte Message Latency
SENDER/RECEIVER 0-33% 34-66% 67-100% 0-33% 1.205
17.120 1.426 15.465
1.638 69.664
34-66% 1.722 32.748
2.297 45.449
67-100% 2.505 74.170
TCP/IP 4K byte Message Latency
SENDER/RECEIVER 0-33% 34-66% 67-100% 0-33% 1.693
17.895 1.933 20.964
2.27 64.315
34-66% 2.468 45.843
2.907 41.481
67-100% 3.418 77.746
TCP/IP 8K byte Message Latency
SENDER/RECEIVER 0-33% 34-66% 67-100% 0-33% 2.699
17.842 3.163 22.727
3.611 60.060
34-66% 3.983 43.147
4.558 38.242
67-100% 5.313 73.580
102
Bibliography “Fore Runner ASX-1000 ATM User’s Switch Manual MANU0053-Rev. D”, Fore
Systems, 1996.
“J2802B HP EISA ATM Adapter for HP-UX 10.X Configuration and Troubleshooting
Guide”, HP part number J2802-90017, Hewlett-Packard (Undated).
“J2802B HP EISA ATM Adapter for HP-UX 10.X Installation Guide”, HP part number
J2802-90014, Hewlett-Packard (Undated).
“Orbix 2.0 Programming Guide”, IONA Technologies, 1996.
“Orbix 2.0 Reference Manual”, IONA Technologies, 1996.
Tanenbaum A. S., “Computer Networks”, Prentice Hall, Upper Saddle River, NJ. 1996
Tanenbaum A. S., “Distributed Operating Systems”, Prentice Hall, Upper Saddle River,
NJ 1995.