Embed Size (px)
Citation preview
Hindawi Publishing CorporationEURASIP Journal on Advances in Signal ProcessingVolume 2007, Article ID 76256, 8 pagesdoi:10.1155/2007/76256
Research ArticleReal-Time Cardiac Arrhythmia Detection Using WOLAFilterbank Analysis of EGM Signals
Hamid Sheikhzadeh, Robert L. Brennan, and Simon So
AMI Semiconductor Canada Company, 611 Kumpf Drive, Unit 200, Waterloo, Ontario, Canada N2V 1K8
Received 27 April 2006; Revised 13 October 2006; Accepted 13 October 2006
Recommended by William Allan Sandham
Novel methods of cardiac rhythm detection are proposed that are based on time-frequency analysis by a weighted overlap-add(WOLA) oversampled filterbank. Cardiac signals are obtained from intracardiac electrograms and decomposed into the time-frequency domain and analyzed by parallel peak detectors in selected frequency subbands. The coherence (synchrony) of thesubband peaks is analyzed and employed to detect an optimal peak sequence representing the beat locations. By further analysisof the synchrony of the subband beats and the periodicity and regularity of the optimal beat, various possible cardiac events (in-cluding fibrillation, flutter, and tachycardia) are detected. The Ann Arbor Electrogram Library is used to evaluate the proposeddetection method in clean and in additive noise. The evaluation results show that the method never misses any episode of fibril-lation or flutter in clean or in noise and is robust to far-field R-wave interference. Furthermore, all other misclassification errorswere within the acceptable limits.
Copyright © 2007 Hamid Sheikhzadeh et al. This is an open access article distributed under the Creative Commons AttributionLicense, which permits unrestricted use, distribution, and reproduction in any medium, provided the original work is properlycited.
1. INTRODUCTION
The objective of this research is rhythm classification andevent detection based on the intracardiac electrogram (E-GM) signals. The proposed methods are designed for im-plantable devices that should operate on extremely low-power budgets. In the meantime, these methods should op-erate in real time and the processing delay should be in theminimal range acceptable for such applications. The detec-tion methods should be very reliable and robust to interfer-ence, noise, and morphology variations.
Current practical methods of cardiac rhythm detectionemployed in implantable cardioverter defibrillators (ICDs)are generally based on beat-by-beat time-domain analysis.Although research has been conducted to exploit more so-phisticated signal processing such as wavelet transform andtemplate matching for event detection [1–3], the new meth-ods have rarely been employed in practical systems due totheir computational and power demands and issues relatedto the reliability of their detection.
Current challenges in reliable rhythm detection for im-plantable cardiac rhythm management (CRM) systems suchas ICDs are the following.
(1) Inappropriate device therapy (IDT) amount to a con-siderable rate (between 10 to 30%) in various devices[4]. IDTs occur due to low EGM signal quality, sinustachycardia, supraventricular tachycardia (SVT), my-opotential interference, external interference, and T-wave oversensing [5]. IDT is painful to the patient anddepletes the device battery power more quickly. IDTis also potentially harmful to the patient as it puts thepatient at risk of device-induced VT (proarrhythmia)that might be dangerous and hard to detect by the ICD[4, 5].
(2) Missing serious cardiac events compromises the relia-bility of the CRM devices. This happens due to manyreasons including quick morphology, rate, and evenpolarity changes of the EGM signal, abnormally wideR-waves and P-waves, and external noises [1]. Theproblems are aggravated due to the fact that often pa-tients have to simultaneously use medicines that alterthe EGM waveforms.
(3) Following a device therapy (low-energy pacing orhigh-energy cardioversion), it is essential to quickly re-detect the EGM rhythm to analyze the effectiveness ofthe therapy. Quick redetection, however, is tricky as
2 EURASIP Journal on Advances in Signal Processing
often the device therapy polarizes the EGM electrodesor causes baseline variations of the EGM signal (some-times in form of low-frequency oscillations with mag-nitudes larger than the EGM beat itself). Often a black-out period has to be applied before any reliable newsensing.
(4) As increasingly sophisticated multichamber CRM de-vices become available offering the physicians morechoices in programming the devices, more powerfulsignal processing is required to efficiently handle themultichannel information while offering the physicianless complicated and reliable programming scenarios.Also, increased immunity to cross-channel interfer-ence is necessary.
To cope with the mentioned problems and to improve therhythm detection accuracy, we propose a multitiered de-tection method that is based on time-frequency analysis ofthe EGM signals by a weighted overlap-add (WOLA) filter-bank. The WOLA filterbank can be efficiently implementedon an ultra-low power platform [6] targeted for real-timelow-delay and implantable devices.
Methods based on time-frequency analysis have alreadybeen proposed for electrocardiogram (ECG) and QRS detec-tion [7]. However, the proposed methods are not qualifiedfor ultra-low power implementation on implantable devicessince they are either (a) too complex or unsuitable for real-time applications or (b) specifically designed for (and eval-uated on) ECG signals and do not provide the robust andreliable performance essential for EGM signal processing.
Possibly, the most relevant to our work is the research byAfonso et al. on ECG beat detection in real time [8]. They an-alyze the ECG signal by a critically sampled polyphase filter-bank, extracting six features that are all based on the accumu-lated energy (or absolute value) of groups of subbands. Eachenergy feature is processed by a peak detector that comparesthe signal moving average to a threshold that is determinedbased on an estimation of the background noise. Peaks arethen refined in a cascade of five stages (levels). In one stage,two different thresholds are used to detect the peaks of thesame feature. The peaks are then combined in parallel. Themethod is evaluated on a standard ECG database with satis-factory performance.
The objective of this research is to present a real-time de-tection method for cardiac event detection using the intrac-ardiac EGM signals. Sensed EGM signals differ from ECGsignals in many aspects. Major differences are summarizedhere.
(1) EGM signals provide direct access to individual heartchambers, most importantly right ventricular andright atrial, at the signal source. In contrast, ECG sig-nals provide a combined signal after propagation ofvarious waves to the body surface.
(2) Relative timing of various EGM signals is very impor-tant as it could be employed to discriminate variouscardiac events (e.g., SVT versus VT) accurately. ForECG signals, however, such timing information is notavailable.
Analysis filterbank
h0(n)
hK�1(n)
R
R
z0(m)
Subban
drhyth
mdetectionx(n) zK�1(m)
...
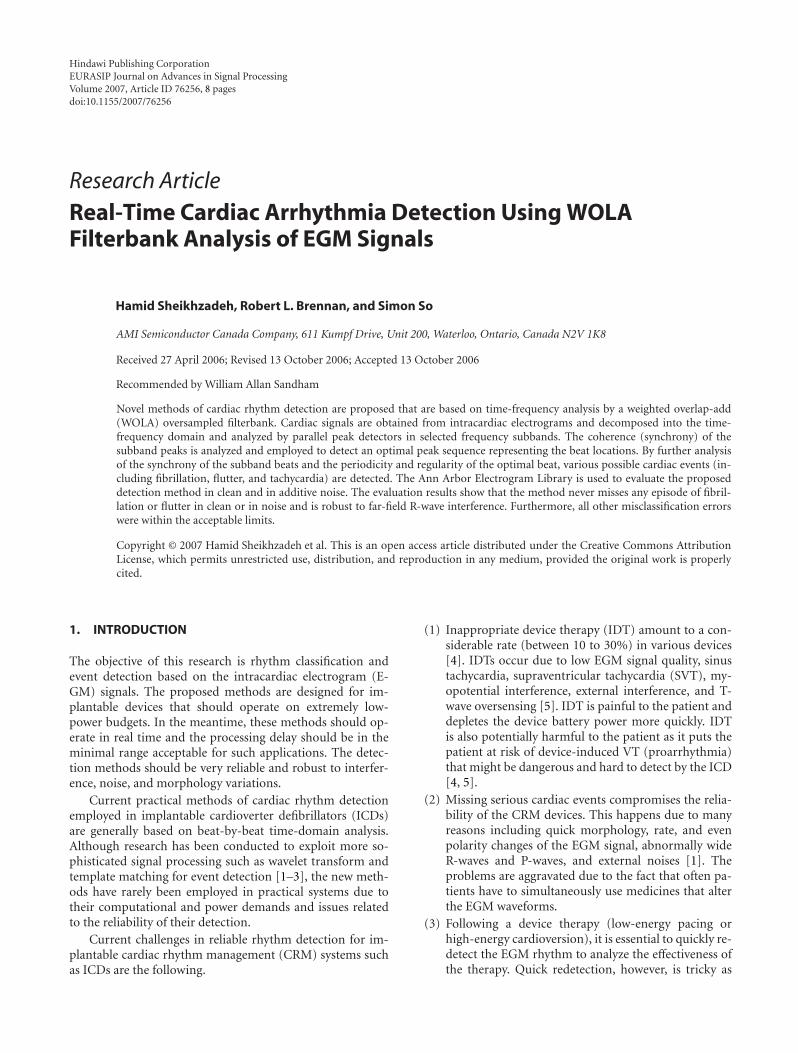
Figure 1: WOLA oversampled filterbank analysis for subbandrhythm detection.
(3) Unlike ECG signals, sensed EGM signals are proneto cross-talk. For example, far-field R-waves (FFRWs)might occur when the much stronger ventricular sig-nal interferes with sensing of the weaker atrial signal.Although FFRWs are a major problem with unipolarelectrodes, they interfere with bipolar electrodes to alesser degree.
Signal processing strategies are therefore greatly different forEGM signals as compared to ECG signals.
Rather than critically sampled polyphase filterbanks of[8], we employ a very efficient WOLA oversampled filterbank[6] for time-frequency analysis of the EGM signals. Subbandpeaks are detected directly from the subband signals (abso-lute values) by recursive averaging with no absolute thresh-olds. Subband peaks are combined in parallel by exploitingthe synchrony of the subband signals at the beat time. Fur-thermore, to cope with the wide range of possible beat ratesand morphologies of the EGM signal, the narrowband (com-plex) subbands are merged to obtain wideband-subband sig-nals to be used for wideband event detection. The results ofthe wideband and narrowband detections are then combinedfor robust detection.
As the intention here is to describe the basis for the detec-tion method, we limit our attention to single-electrode anal-ysis; extension to multiple-electrode analysis is straightfor-ward. Also, the algorithm simplicity has been a major con-sideration in this research since we are targeting low-power,real-time, and implantable applications.
This paper is organized as follows: Section 2 presents de-tails of the detection algorithm, Section 3 discusses evalua-tion of the methods using the EGM signals in clean and inadditive noise, and Section 4 presents research conclusions.
2. THE PROPOSED DETECTION METHOD
2.1. General
A time-domain EGM signal x(n) is analyzed by an oversam-pled filterbank (depicted in Figure 1) that is efficiently im-plemented using a WOLA structure [6]. The filterbank pa-rameters, adjusted by optimization for this application, areK = 32 subbands, analysis window length of L = 256, sub-band decimation factor of R = 4, and oversampling factor ofOS = K/R = 8.
Hamid Sheikhzadeh et al. 3
At the output of WOLA analysis, K complex-valued sub-band signals are obtained: Zk(m), k = 0, 1, . . . ,K − 1, wherem is the subband time index. For real input signals, onlyhalf of the subbands are stored and processed due to Hermi-tian symmetry. The subband time-index m is updated everyR = 4 input samples when a new block of WOLA subbandsignals is available.
Subband signals are then framed with a frame length of3 seconds and a frame shift of 2 seconds. The frame lengthshould be chosen long enough to cover more than one beatfor slow beats (around 60 beats per minute, bpm) and to pro-vide enough beats for statistical analysis. At the same time,the frame should be as short as possible to track the dy-namics of the quickly varying beats. The choice of frameshift is rather arbitrary and depends on how often a deci-sion is needed. Notice that irrespective of the frame lengthand frame shift, the WOLA analysis is continuously appliedto the input signal, yielding a new block of subband signalsfor every R input samples.
The cardiac beat is often represented by a sharp pulse inthe EGM signal. As a result, the magnitudes of subband sig-nals (|Zk(m)|, k = 0, 1, . . . ,K − 1) exhibit mainly coherentpeaks at the time of cardiac depolarization. A major objectivein this research is to exploit this subband coherence (termed“synchrony” here) between various subbands. Among manypossible methods, we designed a simple and robust approachbased on binary operations to measure the synchrony.
Based on the synchrony analysis, a final beat sequence(called “optimal beat” in this paper) is detected for everyframe as detailed in the next section. Then the periodicityand the regularity of the optimal beat are combined with thesynchrony measure to detect the underlying cardiac event.
2.2. Subband peak detection and synchrony analysis
In the first stage, peaks are detected in selected subbands.Given the subband magnitude signal |Zk(m)| for subbandk, its maximum is tracked with a two-time-constant first-order recursive filter. Considering two filter coefficients of0.9 < αm1 < 1 and 0.1 < αm2 < 0.5, the following pseudocodedescribes how the maximum signal (Mk(m)) is calculated:
α = αm1,
If∣∣Zk(m)
∣∣ > Mk(m− 1), α = αm2,
Mk(m) =Mk(m− 1) · α +∣∣Zk(m)
∣∣ · (1− α).
(1)
After each peak, the filter acts as a leaky integrator. Accord-ingly, the first filter coefficient (αm1) is selected close to one.This controls the so-called “release time” of the filter. Theother coefficient is selected smaller for the filter to reactquickly to the next peak.
Similarly, the average signal Ak(m) is tracked by a two-time-constant recursive filter with 0.7 < αa1 < 1 and 0.5 <αa2 < 0.7. At each time-instance m, a peak value (Pk(m)) isdetected by comparing the three values of |Zk(m)|, Mk(m),
44 44.5 45 45.5 46 46.5 47�1000
0
1000
Inst.
Peak
Max.Avg.
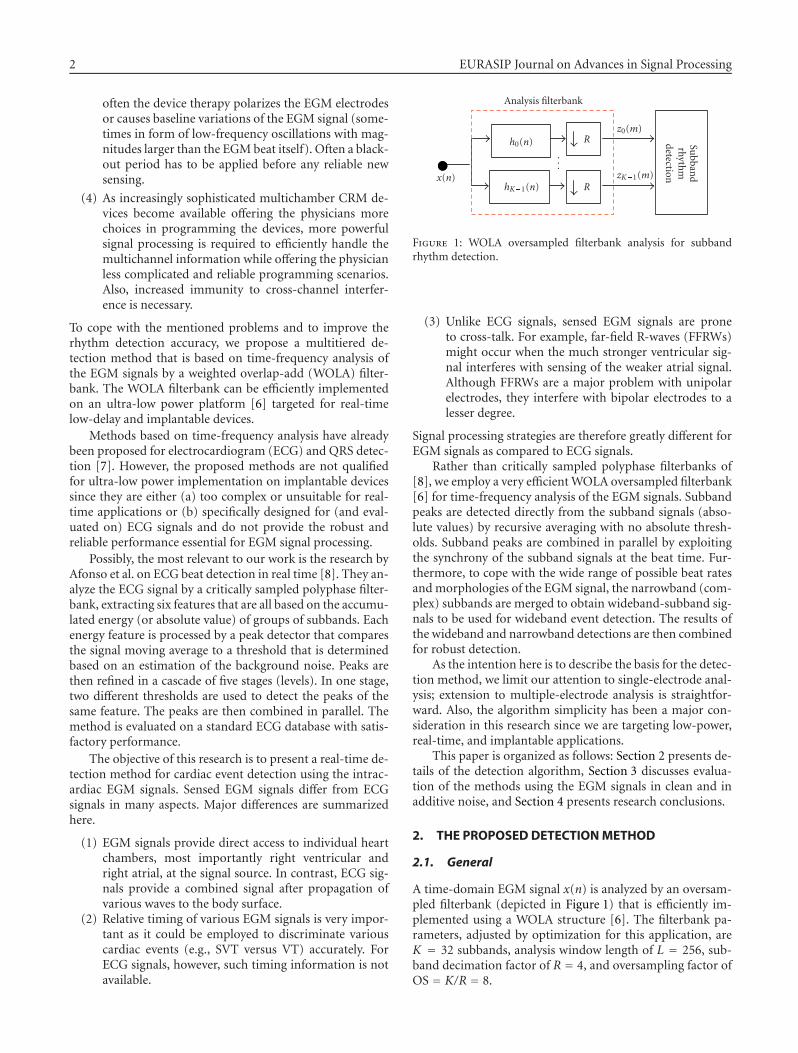
Figure 2: From top to bottom, a segment of ventricular EGM sig-nal, four WOLA subband energies with their average, maximum,instantaneous, and peak signals, their corresponding binary pulsesBk(m) (rows 6–9), and the optimal-detected pulse (bottom row).
and Ak(m) (the instantaneous, maximum, and average val-ues) as described in the following pseudocode:
Pk(m) = 0,
If{∣∣Zk(m)
∣∣ > Ak(m− 1)&
∣∣Zk(m)
∣∣ > 0.5Mk(m− 1)
}
&{
Ak(m− 1) < 0.9Mk(m− 1)}
, Pk(m) = ∣∣Zk(m)∣∣.(2)
Between two distant cardiac beats, it is possible that Ak(m)and Mk(m) converge to each other. To prevent peak detec-tion in this situation, the last term in the condition aboveis included. Notice that no absolute threshold is used in thepeak detection and only relative thresholds are employed.
By analyzing various beats in subband domain, it was ob-served that peaks appear more distinctively in the first halfof the subbands. As a result, we limited peak detection tosubbands 2–9 (out of 1–16). The first subband is ignored asit mostly captures noise and baseline wander. Figure 2 illus-trates a frame of atrial EGM signal (top graph), and four setsof WOLA subband signals of |Zk(m)|, Mk(m), Ak(m), andPk(m) (instantaneous, maximum, average, and peak).
Following the peak detection, each subband peak signalPk(m) is converted to a binary (0/1 for peak/no-peak) sig-nal Bk(m). This greatly simplifies further processing. To em-bed more robustness in the algorithm and to avoid detectingshort-term spurious peaks, we search every frame of binarypeak signal Bk(m) for a pattern of consecutive peaks (1s) fol-lowed by a block of zeros (e.g., {1 1 1 0 0 0}). For every pat-tern found, the falling edge of the binary peak signal is regis-tered as a valid peak. The peak location is marked by a blockof three 1s ({1 1 1}) and the rest of the peak signal is resetto zero. Replacing the peak by a block of 1s (rather than a
4 EURASIP Journal on Advances in Signal Processing
single 1) increases robustness in the next stage of synchronyanalysis. All further steps of processing are applied to the bi-nary peak signals Bk(m).
2.3. Synchrony analysis and robust beat detection
In the next stage, the degree of synchrony between varioussubbands is measured by applying simple AND operationsto the binary peak signals. For each possible pair of signalsBk(m) and Bl(m), k �= l, synchrony of the pair Sk,l (in per-centage) is calculated as follows:
Sk,l = 100 NP(
Bk(m)&Bl(m))
max{
NP(
Bk(m))
, NP(
Bl(m))}
,(3)
where function NP(·) denotes the number of peaks in aframe of binary peaks and & denotes the logical AND op-eration. The synchrony is evaluated for all nonidentical pairs(for 8 subbands this involves 28 AND operations on framepairs). To minimize the effect of noise and interference, onlythe top 3 synchrony scores are considered as measures of theframe synchrony. The top 3 scores are compared to fixed syn-chrony thresholds to classify the frame of subband beats asperfectly synchronous (Syn = 4), as borderline synchronous(Syn = 2), or asynchronous (Syn = 0).
We also employ the top 3 binary pulse pairs to robustlydetect the beat times. Applying a majority-voting rule, beatsare detected from the 3 pairs (after the logical AND opera-tion within each pair) when 2 out of the 3 pairs exhibit si-multaneous beats. Considering the peak extension to a blockof three 1s, this method proved to be very robust when thesignal quality was compromised by noise or due to flutterand fibrillation. As a result of beat detection, an optimal beatsequence OB(m) is obtained for every frame. Depicted inFigure 2 (rows 6–9) are binary subband pulses for the EGMsegment together with the optimal-detected beat (bottomrow).
2.4. Analysis of periodicity and regularity
Once an optimal beat sequence OB(m) is obtained, it is an-alyzed to find the beat rate and the regularity of the beats.A set of thresholds for periods of various cardiac events isused to set histogram edges as [0, FibPer/2, FibPer, FlutPer+1, TachyPer +1, SRMax, infinity]; where FibPer, FlutPer,TachyPer, and SRMax indicate the largest acceptable periodsfor fibrillation, flutter, tachycardia, and sinus rhythm, respec-tively. The beats are classified in a period histogram with 6bins specified by the above edges. The mode (bin index forthe most populated bin) of the histogram (Tm) is an indi-cator of the periodicity. For the periods in the “acceptable”range of (FibPer/2, SRMax), the mean period (T) and thestandard deviation-to-mean ratio (σ/μ) are calculated. If ei-ther of the T and Tm fall in the fibrillation, flutter or tachy-cardia range, the period zone indicator would be set to showthe corresponding event. For sinus rhythm, however, both Tand Tm should indicate a sinus rhythm. In all cases, we choseto use the mean period T to find the rate as beat per minute,bpm = 60/T . So, it is possible that the period zone indicator
show a flutter since Tm is pointing to a flutter while averagebeat rate is still slightly below the minimum flutter rate.
σ/μ (of periods) is an indicator of the regularity; typi-cally for very regular beats σ/μ < 20%, for very irregularbeats σ/μ > 40%, and σ/μ values between the two rangesindicate moderate regularity. In case unusual lack of EGMactivity (longer than the slowest possible rhythm) is detectedwithin the frame, the irregularity flag is set (Ireg = 1).
2.5. Event detection based on subband features
The synchrony analysis provides both the optimal beatOB(m) and the synchrony score (Syn = 0, 2, 4). Based onthese and the periodicity and regularity of the optimal beat(T , Tm, σ/μ, and Ireg), cardiac events are classified as one ofthe following eight events:
(1) stable sinus rhythm (SR),(2) transitional SR (T-SR),(3) stable tachycardia (VT or AT),(4) transitional tachycardia (T-VT or T-AT),(5) flutter (VFLUT or AFLUT),(6) fibrillation (VFIB or AFIB),(7) synchronous but irregular rhythm (Syn-Irg),(8) unclassified,
where VT, VFLUT, and VFIB represent ventricular events oftachycardia, flutter, and fibrillation, respectively. Similarly,AT, AFLUT, and AFIB represent the corresponding atrialevents. When the mean period is within the range for sinusrhythm but the rhythm is irregular, a transitional event ofT-SR is detected. A similar criterion is used in detection of T-VT or T-AT. Event (7) is detected when the synchrony is per-fect but periods are too irregular or insufficient in number tobe considered for other classes. Finally, event (8) is reservedfor unclassified rhythms.
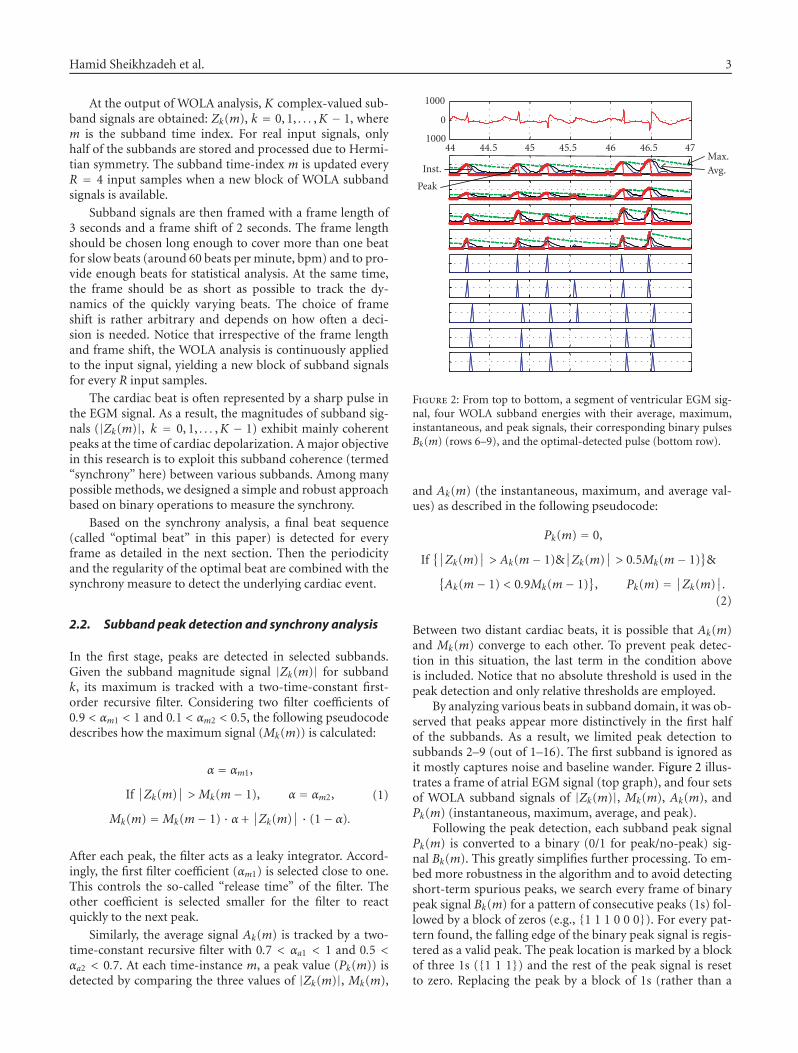
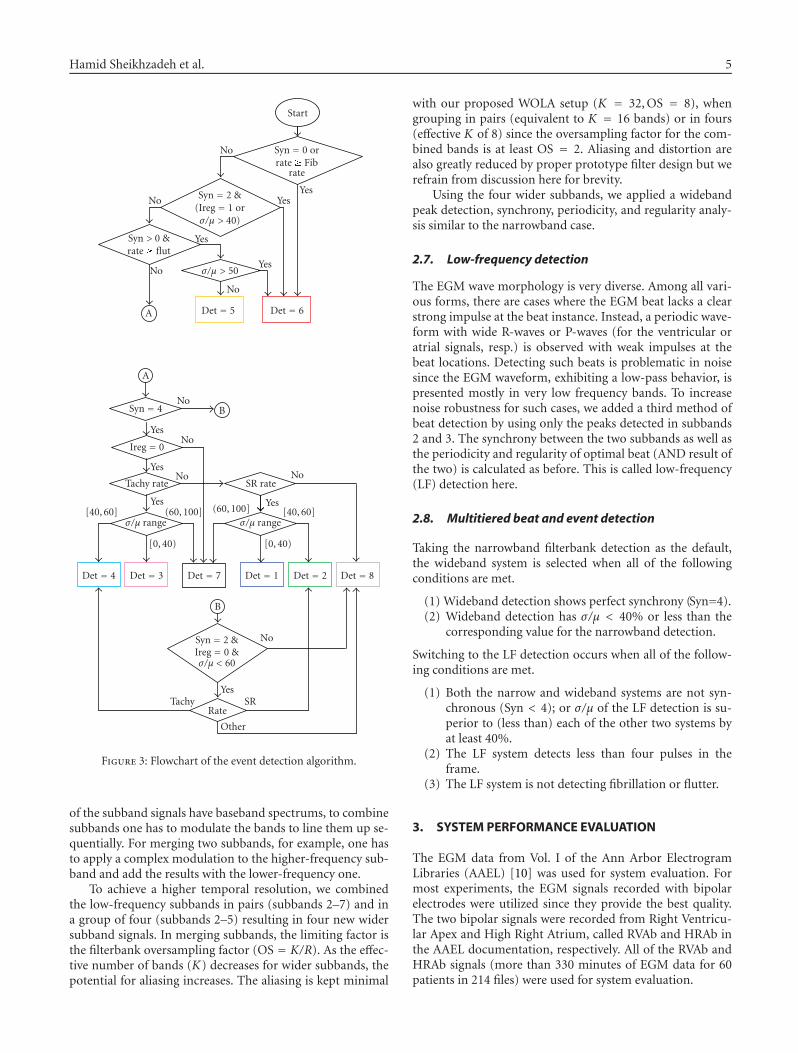
A flowchart of the event detection algorithm is depictedin Figure 3. As shown, the algorithm sets a series of trapsfor various events. It first tries to identify fibrillation or flut-ter (classes {5, 6}). If none is detected (state A in the fig-ure), it searches for fast beats (classes {3, 4, 7}) and then sinusrhythm (classes {1, 2, 7}). If none of the traps succeeds in de-tection, the beat remains unclassified (class 8).
2.6. Detection by wideband filterbank
The expected range of cardiac beat rates is very wide, fromless than 50 bpm to over 300 bpm. As a result of the classictime-frequency resolution trade-off, the time resolution ofthe narrowband filterbank (WOLA analysis with K = 32) isinsufficient to separate two closely spaced beats. The prob-lem is compounded when the signal quality is further com-promised during flutter or fibrillation.
An effective solution is to use a filterbank with widersubbands. In uniform filterbanks, it is possible to merge thesubbands through a simple postprocessing [9]. Specifically,in the WOLA filterbank, we can combine, for example, ev-ery neighboring pair of complex subband signals to obtaina wideband analysis, doubling the time resolution. Since all
Hamid Sheikhzadeh et al. 5
Start
No
No Syn = 2 &(Ireg = 1 orσ/μ > 40)
Syn > 0 &rate � flut
No
A
Yes
σ/μ > 50
Det = 5 Det = 6
No
Yes
YesYes
Syn = 0 orrate � Fib
rate
A
NoBSyn = 4
YesNo
Ireg = 0
YesNo
Tachy rate
Yes
σ/μ range[40, 60] (60, 100]
[0, 40) [0, 40)
Det = 4 Det = 3 Det = 7 Det = 1 Det = 2 Det = 8
(60, 100]σ/μ range
[40, 60]Yes
SR rateNo
B
Syn = 2 &Ireg = 0 &σ/μ < 60
No
YesTachy SR
Other
Rate
Figure 3: Flowchart of the event detection algorithm.
of the subband signals have baseband spectrums, to combinesubbands one has to modulate the bands to line them up se-quentially. For merging two subbands, for example, one hasto apply a complex modulation to the higher-frequency sub-band and add the results with the lower-frequency one.
To achieve a higher temporal resolution, we combinedthe low-frequency subbands in pairs (subbands 2–7) and ina group of four (subbands 2–5) resulting in four new widersubband signals. In merging subbands, the limiting factor isthe filterbank oversampling factor (OS = K/R). As the effec-tive number of bands (K) decreases for wider subbands, thepotential for aliasing increases. The aliasing is kept minimal
with our proposed WOLA setup (K = 32, OS = 8), whengrouping in pairs (equivalent to K = 16 bands) or in fours(effective K of 8) since the oversampling factor for the com-bined bands is at least OS = 2. Aliasing and distortion arealso greatly reduced by proper prototype filter design but werefrain from discussion here for brevity.
Using the four wider subbands, we applied a widebandpeak detection, synchrony, periodicity, and regularity analy-sis similar to the narrowband case.
2.7. Low-frequency detection
The EGM wave morphology is very diverse. Among all vari-ous forms, there are cases where the EGM beat lacks a clearstrong impulse at the beat instance. Instead, a periodic wave-form with wide R-waves or P-waves (for the ventricular oratrial signals, resp.) is observed with weak impulses at thebeat locations. Detecting such beats is problematic in noisesince the EGM waveform, exhibiting a low-pass behavior, ispresented mostly in very low frequency bands. To increasenoise robustness for such cases, we added a third method ofbeat detection by using only the peaks detected in subbands2 and 3. The synchrony between the two subbands as well asthe periodicity and regularity of optimal beat (AND result ofthe two) is calculated as before. This is called low-frequency(LF) detection here.
2.8. Multitiered beat and event detection
Taking the narrowband filterbank detection as the default,the wideband system is selected when all of the followingconditions are met.
(1) Wideband detection shows perfect synchrony (Syn=4).(2) Wideband detection has σ/μ < 40% or less than the
corresponding value for the narrowband detection.
Switching to the LF detection occurs when all of the follow-ing conditions are met.
(1) Both the narrow and wideband systems are not syn-chronous (Syn < 4); or σ/μ of the LF detection is su-perior to (less than) each of the other two systems byat least 40%.
(2) The LF system detects less than four pulses in theframe.
(3) The LF system is not detecting fibrillation or flutter.
3. SYSTEM PERFORMANCE EVALUATION
The EGM data from Vol. I of the Ann Arbor ElectrogramLibraries (AAEL) [10] was used for system evaluation. Formost experiments, the EGM signals recorded with bipolarelectrodes were utilized since they provide the best quality.The two bipolar signals were recorded from Right Ventricu-lar Apex and High Right Atrium, called RVAb and HRAb inthe AAEL documentation, respectively. All of the RVAb andHRAb signals (more than 330 minutes of EGM data for 60patients in 214 files) were used for system evaluation.
6 EURASIP Journal on Advances in Signal Processing
20 40 60 80
Time (s)
0
200
400
1 7 13 19 25 31 37 43 49 55 61 67 73 790
2
4AT
SR-Irg
AT
AFLUT
AFIB
SR
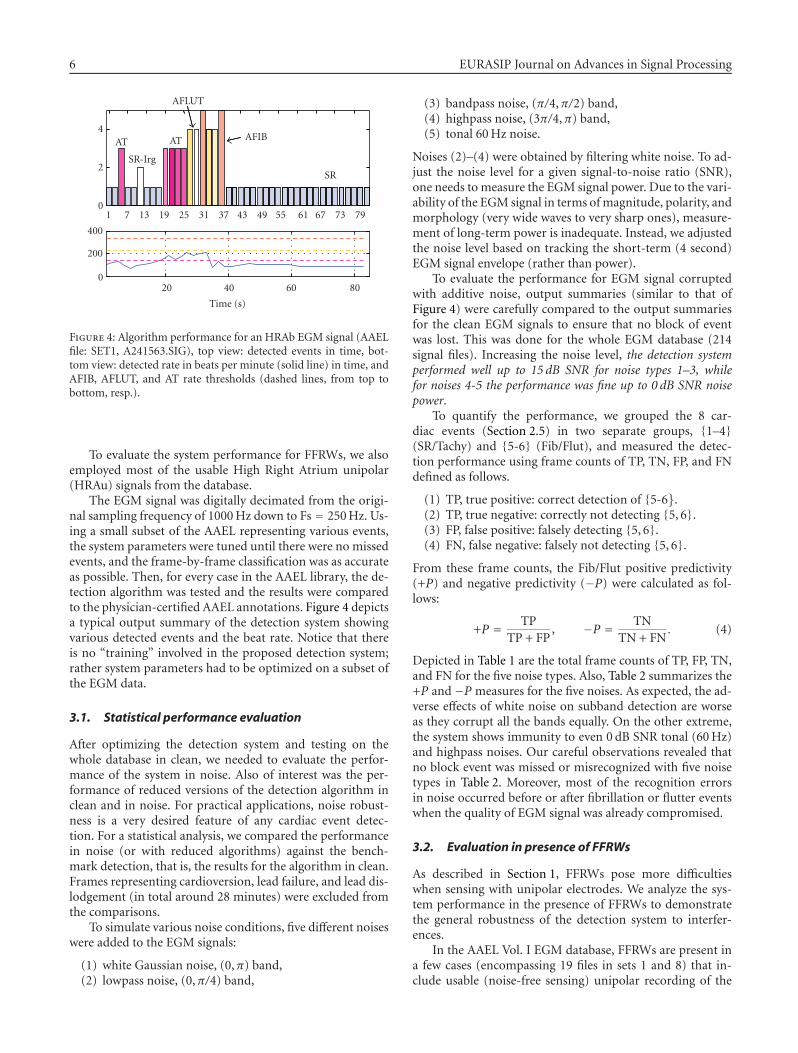
Figure 4: Algorithm performance for an HRAb EGM signal (AAELfile: SET1, A241563.SIG), top view: detected events in time, bot-tom view: detected rate in beats per minute (solid line) in time, andAFIB, AFLUT, and AT rate thresholds (dashed lines, from top tobottom, resp.).
To evaluate the system performance for FFRWs, we alsoemployed most of the usable High Right Atrium unipolar(HRAu) signals from the database.
The EGM signal was digitally decimated from the origi-nal sampling frequency of 1000 Hz down to Fs = 250 Hz. Us-ing a small subset of the AAEL representing various events,the system parameters were tuned until there were no missedevents, and the frame-by-frame classification was as accurateas possible. Then, for every case in the AAEL library, the de-tection algorithm was tested and the results were comparedto the physician-certified AAEL annotations. Figure 4 depictsa typical output summary of the detection system showingvarious detected events and the beat rate. Notice that thereis no “training” involved in the proposed detection system;rather system parameters had to be optimized on a subset ofthe EGM data.
3.1. Statistical performance evaluation
After optimizing the detection system and testing on thewhole database in clean, we needed to evaluate the perfor-mance of the system in noise. Also of interest was the per-formance of reduced versions of the detection algorithm inclean and in noise. For practical applications, noise robust-ness is a very desired feature of any cardiac event detec-tion. For a statistical analysis, we compared the performancein noise (or with reduced algorithms) against the bench-mark detection, that is, the results for the algorithm in clean.Frames representing cardioversion, lead failure, and lead dis-lodgement (in total around 28 minutes) were excluded fromthe comparisons.
To simulate various noise conditions, five different noiseswere added to the EGM signals:
(1) white Gaussian noise, (0,π) band,(2) lowpass noise, (0,π/4) band,
(3) bandpass noise, (π/4,π/2) band,(4) highpass noise, (3π/4,π) band,(5) tonal 60 Hz noise.
Noises (2)–(4) were obtained by filtering white noise. To ad-just the noise level for a given signal-to-noise ratio (SNR),one needs to measure the EGM signal power. Due to the vari-ability of the EGM signal in terms of magnitude, polarity, andmorphology (very wide waves to very sharp ones), measure-ment of long-term power is inadequate. Instead, we adjustedthe noise level based on tracking the short-term (4 second)EGM signal envelope (rather than power).
To evaluate the performance for EGM signal corruptedwith additive noise, output summaries (similar to that ofFigure 4) were carefully compared to the output summariesfor the clean EGM signals to ensure that no block of eventwas lost. This was done for the whole EGM database (214signal files). Increasing the noise level, the detection systemperformed well up to 15 dB SNR for noise types 1–3, whilefor noises 4-5 the performance was fine up to 0 dB SNR noisepower.
To quantify the performance, we grouped the 8 car-diac events (Section 2.5) in two separate groups, {1–4}(SR/Tachy) and {5-6} (Fib/Flut), and measured the detec-tion performance using frame counts of TP, TN, FP, and FNdefined as follows.
(1) TP, true positive: correct detection of {5-6}.(2) TP, true negative: correctly not detecting {5, 6}.(3) FP, false positive: falsely detecting {5, 6}.(4) FN, false negative: falsely not detecting {5, 6}.
From these frame counts, the Fib/Flut positive predictivity(+P) and negative predictivity (−P) were calculated as fol-lows:
+P = TPTP + FP
, −P = TNTN + FN
. (4)
Depicted in Table 1 are the total frame counts of TP, FP, TN,and FN for the five noise types. Also, Table 2 summarizes the+P and −P measures for the five noises. As expected, the ad-verse effects of white noise on subband detection are worseas they corrupt all the bands equally. On the other extreme,the system shows immunity to even 0 dB SNR tonal (60 Hz)and highpass noises. Our careful observations revealed thatno block event was missed or misrecognized with five noisetypes in Table 2. Moreover, most of the recognition errorsin noise occurred before or after fibrillation or flutter eventswhen the quality of EGM signal was already compromised.
3.2. Evaluation in presence of FFRWs
As described in Section 1, FFRWs pose more difficultieswhen sensing with unipolar electrodes. We analyze the sys-tem performance in the presence of FFRWs to demonstratethe general robustness of the detection system to interfer-ences.
In the AAEL Vol. I EGM database, FFRWs are present ina few cases (encompassing 19 files in sets 1 and 8) that in-clude usable (noise-free sensing) unipolar recording of the
Hamid Sheikhzadeh et al. 7
Table 1: Number of TP, FP, TN, and FN frames for five noise typesof (1) white, (2) lowpass, (3) bandpass, (4) highpass, and (5) 60 Hz,with noise types (1)–(3) at 15 dB and types (4)-(5) at 0 dB SNR.
Actual
FIB/FLUT SR/VT
Det
ecte
d
FIB/FLUT
True positive False positive
(1) 1005 (1) 43
(2) 1114 (2) 27
(3) 1001 (3) 11
(4) 1027 (4) 0
(5) 1020 (4) 0
SR/VT
False negative True negative
(1) 38 (1) 8777
(2) 29 (2) 8786
(3) 42 (3) 8825
(4) 16 (4) 8895
(5) 23 (5) 8882
Table 2: Positive and negative predictivity for five noise types of (1)white, (2) lowpass, (3) bandpass, (4) highpass, and (5) 60 Hz.
Noise type +P% −P%
(1) 15 dB SNR 95.9 99.6
(2) 15 dB SNR 97.4 99.7
(3) 15 dB SNR 98.9 99.5
(4) 0 dB SNR 100.0 99.8
(5) 0 dB SNR 100.0 99.7
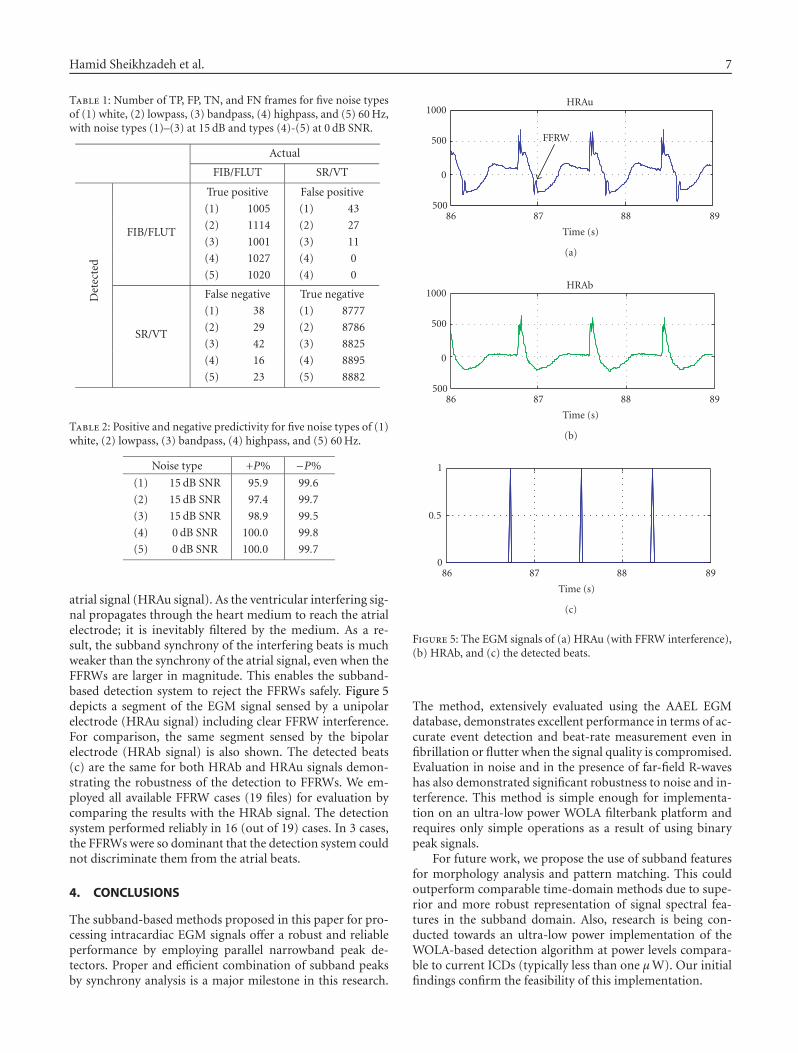
atrial signal (HRAu signal). As the ventricular interfering sig-nal propagates through the heart medium to reach the atrialelectrode; it is inevitably filtered by the medium. As a re-sult, the subband synchrony of the interfering beats is muchweaker than the synchrony of the atrial signal, even when theFFRWs are larger in magnitude. This enables the subband-based detection system to reject the FFRWs safely. Figure 5depicts a segment of the EGM signal sensed by a unipolarelectrode (HRAu signal) including clear FFRW interference.For comparison, the same segment sensed by the bipolarelectrode (HRAb signal) is also shown. The detected beats(c) are the same for both HRAb and HRAu signals demon-strating the robustness of the detection to FFRWs. We em-ployed all available FFRW cases (19 files) for evaluation bycomparing the results with the HRAb signal. The detectionsystem performed reliably in 16 (out of 19) cases. In 3 cases,the FFRWs were so dominant that the detection system couldnot discriminate them from the atrial beats.
4. CONCLUSIONS
The subband-based methods proposed in this paper for pro-cessing intracardiac EGM signals offer a robust and reliableperformance by employing parallel narrowband peak de-tectors. Proper and efficient combination of subband peaksby synchrony analysis is a major milestone in this research.
86 87 88 89
FFRW
�500
0
500
1000HRAu
Time (s)
(a)
86 87 88 89�500
0
500
1000HRAb
Time (s)
(b)
86 87 88 890
0.5
1
Time (s)
(c)
Figure 5: The EGM signals of (a) HRAu (with FFRW interference),(b) HRAb, and (c) the detected beats.
The method, extensively evaluated using the AAEL EGMdatabase, demonstrates excellent performance in terms of ac-curate event detection and beat-rate measurement even infibrillation or flutter when the signal quality is compromised.Evaluation in noise and in the presence of far-field R-waveshas also demonstrated significant robustness to noise and in-terference. This method is simple enough for implementa-tion on an ultra-low power WOLA filterbank platform andrequires only simple operations as a result of using binarypeak signals.
For future work, we propose the use of subband featuresfor morphology analysis and pattern matching. This couldoutperform comparable time-domain methods due to supe-rior and more robust representation of signal spectral fea-tures in the subband domain. Also, research is being con-ducted towards an ultra-low power implementation of theWOLA-based detection algorithm at power levels compara-ble to current ICDs (typically less than one μW). Our initialfindings confirm the feasibility of this implementation.
8 EURASIP Journal on Advances in Signal Processing
The proposed robust WOLA-based detection methodmay beneficially be combined with time-domain methodswhen time response is crucial (e.g., in pacing).
REFERENCES
[1] M. Astrom, S. Olmos, and L. Sornmo, “Wavelet-based eventdetection in implantable cardiac rhythm management de-vices,” IEEE Transactions on Biomedical Engineering, vol. 53,no. 3, pp. 478–484, 2006.
[2] M. L. Brown, J. L. Christensen, and J. M. Gillberg, “Improveddiscrimination of VT from SVT in dual-chamber ICDs bycombined analysis of dual-chamber intervals and ventricularelectrogram morphology,” in Proceedings of of the 29th AnnualMeeting on Computers in Cardiology, pp. 117–120, Memphis,Tenn, USA, September 2002.
[3] L. A. Koyrakh, J. M. Gillberg, and N. M. Wood, “Wavelet trans-form based algorithms for EGM morphology discriminationfor implantable ICDs,” in Proceedings of the 26th Annual Meet-ing on Computers in Cardiology, pp. 343–346, Hannover, Ger-many, September 1999.
[4] J. L. Rojo-Alvarez, A. Arenal-Maiz, and A. Artes-Rodriguez,“Discriminating between supraventricular and ventriculartachycardias from EGM onset analysis,” IEEE Engineering inMedicine and Biology Magazine, vol. 21, no. 1, pp. 16–26, 2002.
[5] B. Schaer and S. Osswald, “Methods of minimizing inappro-priate implantable cardioverter-defibrillator shocks,” CurrentCardiology Reports, vol. 2, no. 4, pp. 346–352, 2000.
[6] R. Brennan and T. Schneider, “Flexible filterbank structure forextensive signal manipulations in digital hearing aids,” in Pro-ceedings of IEEE International Symposium on Circuits and Sys-tems (ISCAS ’98), vol. 6, pp. 569–572, Monterey, Calif, USA,May 1998.
[7] B.-U. Kohler, C. Hennig, and R. Orglmeister, “The principlesof software QRS detection,” IEEE Engineering in Medicine andBiology Magazine, vol. 21, no. 1, pp. 42–57, 2002.
[8] V. X. Afonso, W. J. Tompkins, T. Q. Nguyen, and S. Luo,“ECG beat detection using filter banks,” IEEE Transactions onBiomedical Engineering, vol. 46, no. 2, pp. 192–202, 1999.
[9] R. L. de Queiroz, “Uniform filter banks with nonuniformbands: post-processing design,” in Proceedings of IEEE Interna-tional Conference on Acoustics, Speech and Signal Processing(ICASSP ’98), vol. 3, pp. 1341–1344, Seattler, Wash, USA, May1998.
[10] Ann Arbor Electrogram Libraries, Ann Arbor MI, USA, http://electrogram.com/.
Hamid Sheikhzadeh obtained his B.S.(1986) and M.S. (1989) degrees in electri-cal engineering both from Amirkabir Uni-versity of Technology (AUT) in Tehran. Hereceived his Ph.D. degree from the E&CEDepartment of the University of Waterlooin Canada in 1994 and continued his re-search as a Postdoctoral Fellow for about ayear. From October 1994, he served as a Fac-ulty Member of the EE Department of AUTfor six years. In the meantime, he held positions as Vice Chair-man of Academic Affairs and Head of Communications Group ofthe EE Department for about two years each. In November 2000,he joined the early research team at AMI Semiconductor Canada(then Dspfactory Ltd.) and since then has been working as a Senior
Member of the R&D team. Also, since April 2001, he has been col-laborating with the E&CE Department of University of Waterlooas an Adjunct Professor. His research interests include digital signalprocessing, speech and audio processing, modeling of the centraland peripheral auditory system, adaptive signal processing, signalprocessing for ultra-low power and portable devices, and biomedi-cal signal processing. He is a Senior Member of IEEE and a Memberof ISCA.
Robert L. Brennan received the B.A.Sc.,M.A.Sc. degrees in electrical engineeringfrom the University of Waterloo in Canadain 1985 and 1986, respectively. He receivedhis Ph.D. degree in 1991 from the Univer-sity of Waterloo, investigating algorithmsand architectures for extremely low bit-rate speech coders. At Unitron, a Canadianmanufacturer of hearing aids, he led thecompany toward developing high perfor-mance digital architectures replacing the almost exclusive analogtechnology deployed at the time. This work has expanded and con-tinued through the formation of Dspfactory and now, AMI Semi-conductor. As a Senior Scientist, he continues working on digitalsignal processing and filterbank multirate methods in audio, in-dustrial, automotive, and medical applications.
Simon So is in his final year of the under-graduate program at the Systems DesignEngineering Department of the Universityof Waterloo. In 2005, during his work termat AMI Semiconductor Canada Company inWaterloo, he worked as a Member of the re-search and development team on CardiacRhythm Management project, contributingto the current paper. His current inter-ests include digital signal processing, digitalvideo and image processing, and video/audio compression algo-rithms.
![Automatic Detection of Cardiac Arrhythmia through ECG ...€¦ · Cardiac Arrhythmia [3], also known as irregular heartbeat, is a group of conditions in which the heartbeat is irregular,](https://img.pdfslide.us/doc/110x75/607210056cc22557db7f5efb/automatic-detection-of-cardiac-arrhythmia-through-ecg-cardiac-arrhythmia-3.jpg)


![Classification of Arrhythmia from ECG Signals using MATLAB€¦ · ECG signal and arrhythmia affected signal with 96.5% accuracy [26]. In the paper Detection of Cardiac Arrhythmia](https://img.pdfslide.us/doc/110x75/6017481464a3214e134e0e6f/classification-of-arrhythmia-from-ecg-signals-using-matlab-ecg-signal-and-arrhythmia.jpg)