Embed Size (px)
Citation preview
Real Time 3D Visualization of DEM Combined with a
Robust DCT Based Data-Hiding Method
Alexandre Martin, Gilles Gesquiere, William Puech, Sebastien Thon
To cite this version:
Alexandre Martin, Gilles Gesquiere, William Puech, Sebastien Thon. Real Time 3D Visualiza-tion of DEM Combined with a Robust DCT Based Data-Hiding Method. Electronic Imaging,Jan 2006, San Jose, CA, United States. 18th IS&T Annual Symposium Electronic Imagingon Visualization and Data Analysis, SPIE (6060), pp.60600G, 2006, Visualization and DataAnalysis. <10.1117/12.643265>. <lirmm-00109684>
HAL Id: lirmm-00109684
https://hal-lirmm.ccsd.cnrs.fr/lirmm-00109684
Submitted on 25 Oct 2006
HAL is a multi-disciplinary open accessarchive for the deposit and dissemination of sci-entific research documents, whether they are pub-lished or not. The documents may come fromteaching and research institutions in France orabroad, or from public or private research centers.
L’archive ouverte pluridisciplinaire HAL, estdestinee au depot et a la diffusion de documentsscientifiques de niveau recherche, publies ou non,emanant des etablissements d’enseignement et derecherche francais ou etrangers, des laboratoirespublics ou prives.
Real Time 3D Visualization of DEM Combined with aRobust DCT Based Data-Hiding Method
A. Martina, G. Gesquiereb, W. Puecha and S. Thonb
aLaboratory LIRMM, UMR CNRS 5506, University of Montpellier II161, rue Ada, 34392 MONTPELLIER CEDEX 05, FRANCEbLaboratory LSIS, UMR CNRS 6168, University of Marseille
IUT de Provence, rue R. Follereau, Route de Crau, 13200 ARLES CEDEX, FRANCE
ABSTRACT
Using aerial photography, satellite imagery, scanned maps and Digital Elevation Models implies to make storageand visualization strategy choices. To obtain a three dimensional visualization, we have to link these imagescalled texture with the terrain geometry named Digital Elevation Model. These information are usually storedin three different files (One for the DEM, one for the texture and one for the geo-referenced coordinates). Inthis paper we propose to store these information in only one file. In order to solve this problem, we present atechnique for color data hiding of images, based on DC components of the DCT-coefficients. In our applicationthe images are the texture, and the elevation data are hidden in each block. This method mainly protects againstJPEG compression and cropping.
Keywords: 3D Visualization, DEM, Data Hiding, Image Compression
1. INTRODUCTION
Geographical Information Systems (GIS) are important in a lot of domains. But using aerial photography,satellite imagery, scanned maps and Digital Elevation Models(DEM) implies to make storage and visualizationstrategy choices. These problems are inflated by a demand for increased accuracy that implies a finer resolutiondata. Sub meter satellite imagery, available to the general public, is now a reality. Images exceeding severalgigabytes in size are common. To obtain a three dimensional visualization, we have to link these images calledtexture with the terrain geometry named Digital Elevation Model. This link is allowed by geo-referenced coor-dinates (longitude / latitude) which depend on projection system used. These information are usually storedin three different files (One for the DEM, one for the texture and one for the geo-referenced coordinates). Wewould like to store these information in only one file.
Our goal is to develop a client- server application for 3D visualization with real time constraints. In theserver we store images with different compression levels. The level choice depends on the network connection.
Several techniques have been proposed in the literature to embed information in digital images.1–3 Thesetechniques provide various degrees of robustness. Data hiding applications include copyright protection, authen-tication, embedded and hidden information. Watermarking systems that are intended for copyright protectionrequire a very high degree of robustness. Data hiding methods for embedding information require resistanceagainst moderate level of modification due to routine image processing such as compression or cropping. Ourcolor watermarking method belongs to this last group of data hiding systems. Furthermore, in our application,the length of embedded data can relatively be important. In each block of the image (32× 32 pixels), we embed2 bytes of information. The data correspond to elevation defined in meter. Coding with 2 bytes is sufficient forthe elevation measured on earth.
The current paper presents a technique for color data hiding of images,4 based on DC components of theDCT-coefficients5–8 (Discrete Cosine Transform). In our application the images are the texture, and the elevationdata are hidden in each block. This method mainly protects against JPEG compression and cropping.
The paper is organized as follows. In Section 2 we introduce the DEM and the 3D visualization. Section 3describes our color data hiding method. In Section 4, we present and analyze some concluding results.
[email protected], [email protected], [email protected], [email protected]
2. REPRESENTATION OF A 3D TERRAIN
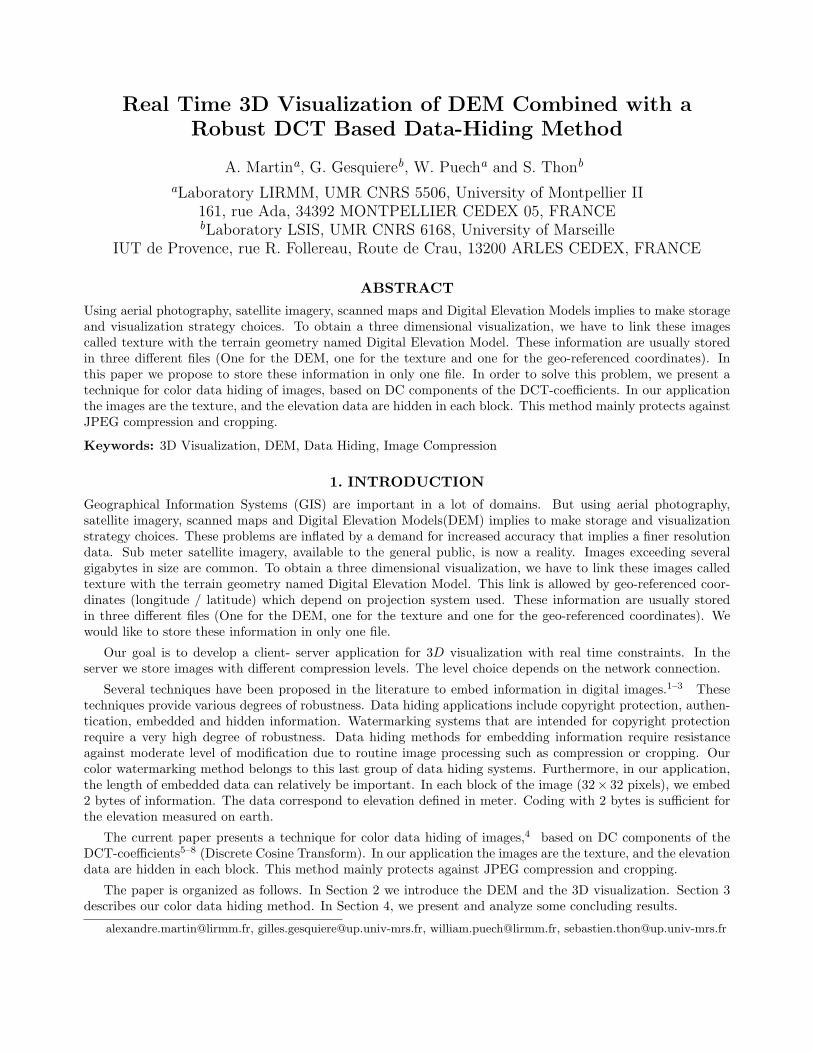
Terrain representation implies to use two kinds of data combined for the visualization:
• Height field data which correspond to the elevation of terrain (Figure 1.a). Theses points are used togenerate the geometry and are connected by triangles (Figure 1.b).
• Different aerial photography can be computed in different spectrum (visible, infrared, etc). Theses onesare used to map 3D triangles previously computed (Figure 1.c).
2.1. Terrain elevation model (DEM)To obtain a 3D visualization, the simplest solution consists in using a uniform discretization of the terrain, whichgives a good precision but led to a very important number of triangles. For example, if we use a uniform grid,with a step of 50 meters in each direction (see Figure 1.a) the department of the Bouches du Rhone in Francecorresponds to more than ten millions triangles (Around 13000 km2). This implies a very important memorycost for the 3D visualization for a wide area.
(a) (b)
(c)
Figure 1. a) Visualization of the DEM Grid with isolevel, b) 3D triangulated surface of the DEM model, c) With aerialphotography texture mapping.
Many methods were proposed to reduce the number of triangles provided by the uniform discretization, whilepreserving a good approximation of original surface.
One of the main approach consists in obtaining an irregular set of triangles (TIN : Triangulated IrregularNetwork). A great number of works were developed in order to create the TIN starting from a height field byusing for example a Delaunay triangulation9 . Hierarchical representations of these triangulations were proposedmaking it possible to introduce the concept of level of details10 . It is thus possible to obtain various levels ofsurfaces with an accuracy which is similar to a uniform grid but with a lower number of triangles.
Another approach consists in breaking up the terrain in a set of nested regular grid of different level ofdetails11–13 . This approach has the advantage of allowing an optimal use of the capacities of the graphics
boards, and thus an increased speed of visualization. The main problem remains to connect the set of gridsbetween them without cracks.
2.2. Textures mapping
Mapping aerial photography as textures on 3D DEM, induce important memory size. Indeed, the photographyaccuracy used is 50 cm per pixel, which leads to volumes of data of the order of Tera-bytes to visualize adepartment in France like the Bouches du Rhone for example. It is thus necessary to think about strategies ofcompression, storage and optimized reading to reach a real time visualization of data.
There are many methods of images compressions, most powerful in term of compression ratio if we are allowedto degrade the image quality, like JPEG and JPEG 2000. Several client- server architectures have been proposedto store important number of data often used on several stations14 . In order to visualize these data quickly, thestrategies of cutting a set of nested regular grid15 and with different levels of details are used16 .
2.3. The proposed coupled storage of DEM and Texture
In this paper we want to visualize in a client large datasets (DEM, Aerial images). These data are stored ona distant server. Data are sent in small packets to reduce connection latency. These information are usuallystored in three different files (One for the DEM, one for the texture and one for the geo-referenced coordinates).We would like to store these information in only one file. We propose to embed the DEM and geo-referencedcoordinates in the aerial photography. An altitude will be stored in a block of pixels of an image. We choose tostore one altitude in a 32× 32 pixel packet as explained in Section 3.
3. DCT-BASED DATA-HIDING
The usual way to be robust to JPEG compression is to work in the same frequential domain, the DCT one.Some well-known methods work in this way.
3.1. Classic DCT-based data-hiding methods
Data-hiding in the DC components is based on the knowledge of the influence of the DC component over thespatial domain: it is directly related to the mean of the intensity of the pixels. A secret bit is embedded in eachDC component by substitution of the less significant bit (LSB):
F ′DH(u, v) = F ′(u, v)− F ′(u, v)%2 + bt, (1)
where F ′(u, v) is a DCT coefficient after quantization,17 x%y is the rest of the integer division of x by y, andbt, the bit to embed.
This method presents two advantages: its simplicity and its robustness. The mean intensity of a block is aglobal indicator and resists well pixel modifications. On the opposite, this data-hiding method has a low capacitysince only one bit is embedded in each 8x8 blocks, the secret information cannot exceeded 0.19% of the originalimage size.
The Jpeg/Jsteg method,7 extends the idea of the previous one to all components of absolute value greaterthan 1. One secret bit is embedded in each coefficient with respect to this requirement. The restriction over thecoefficients aims at preserving the null coefficients and, thus, a good compression rate. We can considerate thatthis method is content-based. Indeed, a homogeneous block contains few non-null coefficients and will embedfew secret bits whereas heterogeneous one contains more non-null coefficients and will embed more information.This data-hiding agrees with an obvious Human Vision System (HVS) principle: modifications are less visible inheterogeneous regions than in homogeneous ones. Capacity, robustness and invisibility of data-hiding methodsare very related and opposed. So, the improvement of the capacity has negative incidence at least on therobustness. The secret information is more sensible to local modifications. Nevertheless the real negative pointis the unknown capacity. It can vary between 0% and 12,5% of the original image size. As it is designed to beapplied on real image, the capacity remains often better than for the previous method. The following methodsattempt to ensure a higher minimum capacity.
A data-hiding by modification of the quantization matrix has been proposed by.8 Depending on the qualityfactor selected for the JPEG compression, a quantized DCT coefficient variation can lead to important changesin the image. This data-hiding method proposes to choose coefficients which will not be quantized and couldembed secret bit without degrading the image too much. The capacity is known in advance and depends on theselected number of non quantized coefficients. The original method propose to select 26 coefficients correspondingto average frequencies over the 64 of a block and to embed two secret bits in each by substitution of the twoLSBs. So the fixed capacity is 10.16% of the original image size. The quantized matrix is present in the JPEGfile in order to rebuild the information. Consequently, it is easy to detect the presence of hidden data. So, theinvisibility provided by this method is not very satisfactory.
3.2. The proposed DCT-based data-hiding method
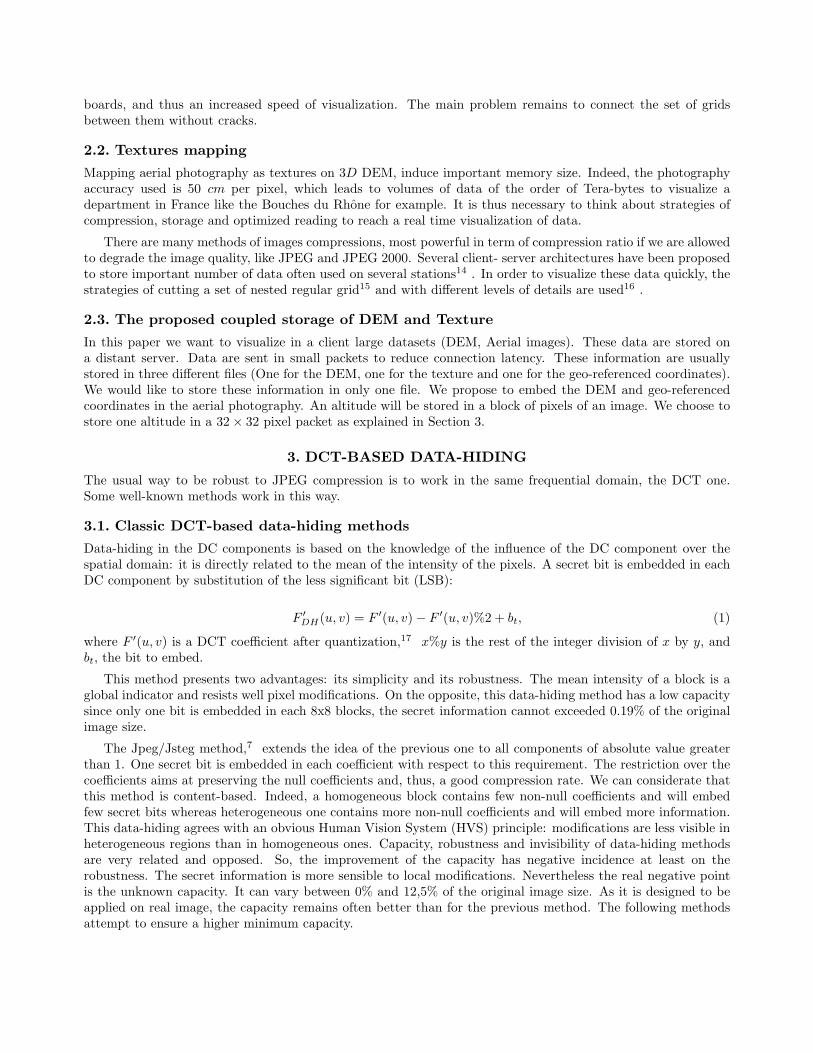
For this application we propose to use data-hiding method in the DC components of a color image JPEG (seefigure 2). We embed the information of the Y luminance component of the color image. The method consists ofdividing this component into square (of 8× 8 pixels) blocks and applying the DCT to each block. Each altitudeis coded on 2 bytes, then we need 16 blocks to embed the information of an altitude of the DEM. So we havechosen to use 4×4 blocks of pixels to embed an altitude. Consequently each block of 32×32 pixels of the originalimage will be synchronized with an altitude coded on 2 bytes. Then if we crop the image with a multiple of 32pixels we are still able to extract the embedded message. With this proposed method the texture is in color andwe can compress the image with a chosen quality factor. The embedded message is extracted before the inversequantization of JPEG.
Figure 2. Data-hiding method for coding the altitude in the JPEG texture.
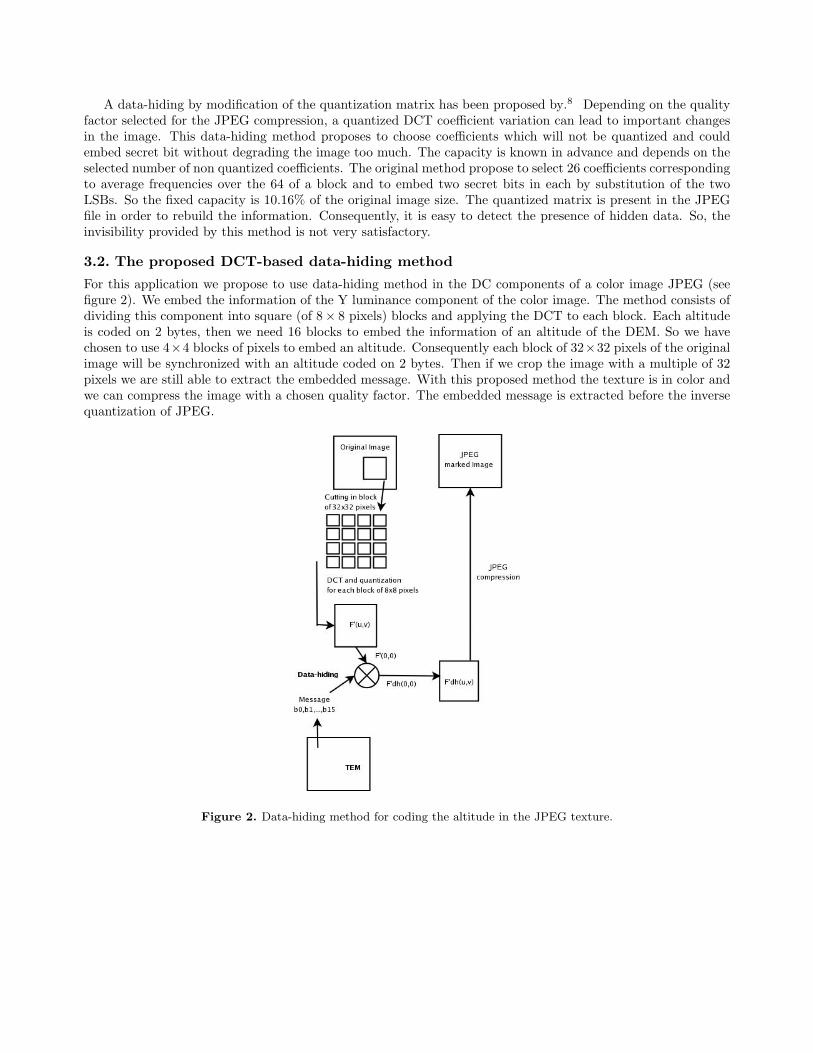
4. RESULTSIn this Section we apply our data hiding method on the image represented on figure 3.a. The message to embedis the altitudes of the DEM which correspond to this texture (Figures 3.b and 3.c). The original image size ofthe Figure 3.a is 800 × 800 pixels (1876 kilobytes) and the size of the data to embed is 25 altitudes of 2 bytes(1250 bytes).
(a) (b)
(c)
Figure 3. a) Original image of texture, b) DEM, c) Map of the altitude.
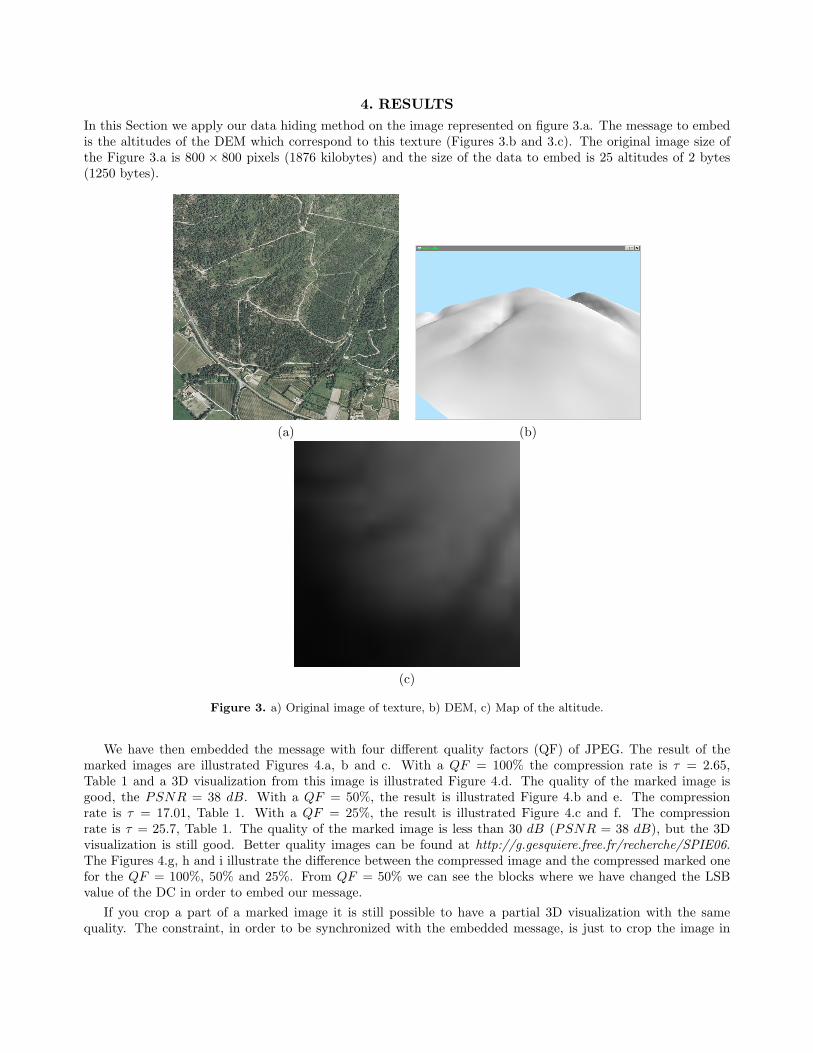
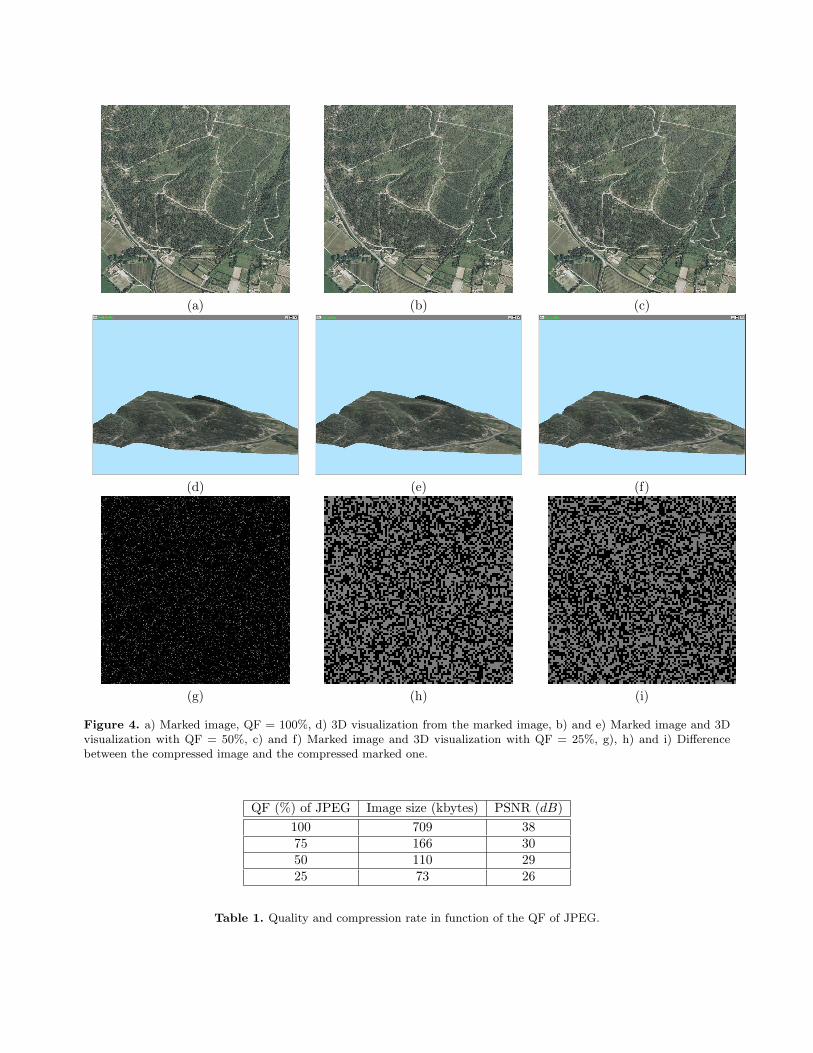
We have then embedded the message with four different quality factors (QF) of JPEG. The result of themarked images are illustrated Figures 4.a, b and c. With a QF = 100% the compression rate is τ = 2.65,Table 1 and a 3D visualization from this image is illustrated Figure 4.d. The quality of the marked image isgood, the PSNR = 38 dB. With a QF = 50%, the result is illustrated Figure 4.b and e. The compressionrate is τ = 17.01, Table 1. With a QF = 25%, the result is illustrated Figure 4.c and f. The compressionrate is τ = 25.7, Table 1. The quality of the marked image is less than 30 dB (PSNR = 38 dB), but the 3Dvisualization is still good. Better quality images can be found at http://g.gesquiere.free.fr/recherche/SPIE06.The Figures 4.g, h and i illustrate the difference between the compressed image and the compressed marked onefor the QF = 100%, 50% and 25%. From QF = 50% we can see the blocks where we have changed the LSBvalue of the DC in order to embed our message.
If you crop a part of a marked image it is still possible to have a partial 3D visualization with the samequality. The constraint, in order to be synchronized with the embedded message, is just to crop the image in
(a) (b) (c)
(d) (e) (f)
(g) (h) (i)
Figure 4. a) Marked image, QF = 100%, d) 3D visualization from the marked image, b) and e) Marked image and 3Dvisualization with QF = 50%, c) and f) Marked image and 3D visualization with QF = 25%, g), h) and i) Differencebetween the compressed image and the compressed marked one.
QF (%) of JPEG Image size (kbytes) PSNR (dB)100 709 3875 166 3050 110 2925 73 26
Table 1. Quality and compression rate in function of the QF of JPEG.
(a) (b)
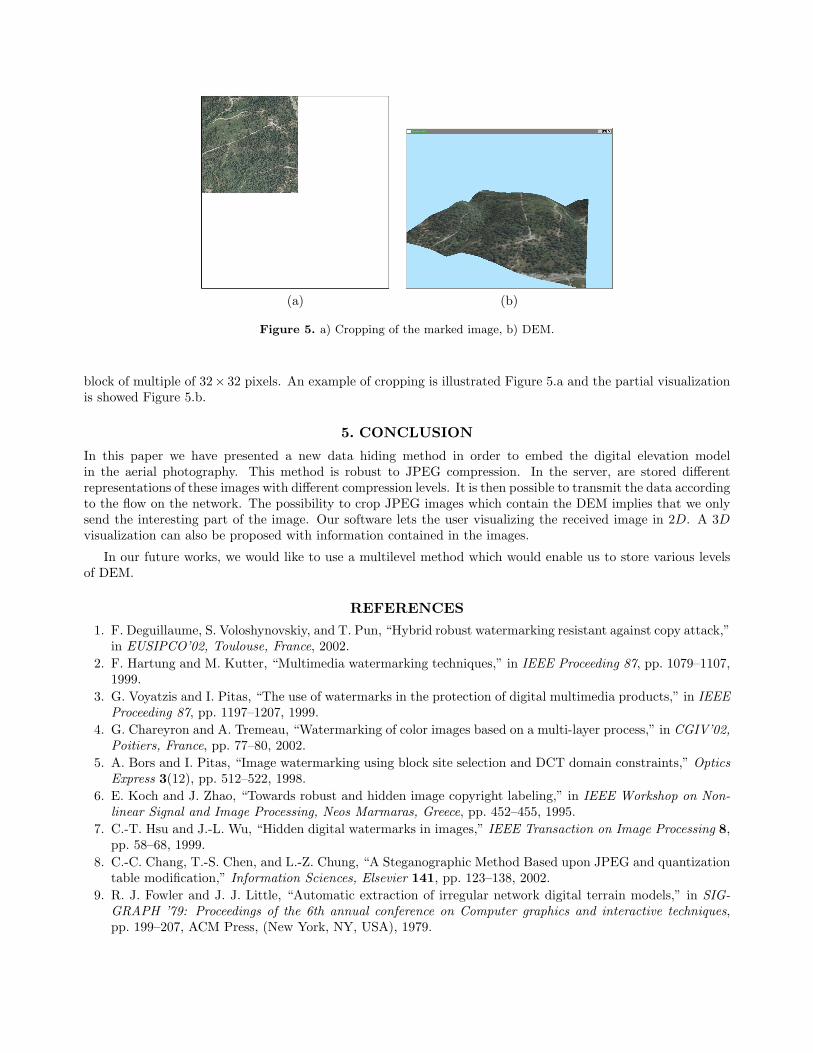
Figure 5. a) Cropping of the marked image, b) DEM.
block of multiple of 32× 32 pixels. An example of cropping is illustrated Figure 5.a and the partial visualizationis showed Figure 5.b.
5. CONCLUSION
In this paper we have presented a new data hiding method in order to embed the digital elevation modelin the aerial photography. This method is robust to JPEG compression. In the server, are stored differentrepresentations of these images with different compression levels. It is then possible to transmit the data accordingto the flow on the network. The possibility to crop JPEG images which contain the DEM implies that we onlysend the interesting part of the image. Our software lets the user visualizing the received image in 2D. A 3Dvisualization can also be proposed with information contained in the images.
In our future works, we would like to use a multilevel method which would enable us to store various levelsof DEM.
REFERENCES1. F. Deguillaume, S. Voloshynovskiy, and T. Pun, “Hybrid robust watermarking resistant against copy attack,”
in EUSIPCO’02, Toulouse, France, 2002.2. F. Hartung and M. Kutter, “Multimedia watermarking techniques,” in IEEE Proceeding 87, pp. 1079–1107,
1999.3. G. Voyatzis and I. Pitas, “The use of watermarks in the protection of digital multimedia products,” in IEEE
Proceeding 87, pp. 1197–1207, 1999.4. G. Chareyron and A. Tremeau, “Watermarking of color images based on a multi-layer process,” in CGIV’02,
Poitiers, France, pp. 77–80, 2002.5. A. Bors and I. Pitas, “Image watermarking using block site selection and DCT domain constraints,” Optics
Express 3(12), pp. 512–522, 1998.6. E. Koch and J. Zhao, “Towards robust and hidden image copyright labeling,” in IEEE Workshop on Non-
linear Signal and Image Processing, Neos Marmaras, Greece, pp. 452–455, 1995.7. C.-T. Hsu and J.-L. Wu, “Hidden digital watermarks in images,” IEEE Transaction on Image Processing 8,
pp. 58–68, 1999.8. C.-C. Chang, T.-S. Chen, and L.-Z. Chung, “A Steganographic Method Based upon JPEG and quantization
table modification,” Information Sciences, Elsevier 141, pp. 123–138, 2002.9. R. J. Fowler and J. J. Little, “Automatic extraction of irregular network digital terrain models,” in SIG-
GRAPH ’79: Proceedings of the 6th annual conference on Computer graphics and interactive techniques,pp. 199–207, ACM Press, (New York, NY, USA), 1979.
10. L. D. Floriani and E. Puppo, “Hierarchical triangulation for multiresolution surface description,” ACMTrans. Graph. 14(4), pp. 363–411, 1995.
11. L. Bishop, D. Eberly, T. Whitted, M. Finch, and M. Shantz, “Designing a pc game engine,” IEEE Comput.Graph. Appl. 18(1), pp. 46–53, 1998.
12. D. Wagner, “Terrain geomorphing in the vertex shader,” in In ShaderX2: Shader Programming Tips andTricks with DirectX 9, Wordware Publishing, 2004.
13. F. Losasso and H. Hoppe, “Geometry clipmaps: terrain rendering using nested regular grids,” ACM Trans.Graph. 23(3), pp. 769–776, 2004.
14. P. Baumann, P. Furtado, R. Ritsch, and N. Widmann, “Geo/environmental and medical data managementin the rasdaman system,” in VLDB’97, Proceedings of 23rd International Conference on Very Large DataBases, August 25-29, 1997, Athens, Greece, M. Jarke, M. J. Carey, K. R. Dittrich, F. H. Lochovsky,P. Loucopoulos, and M. A. Jeusfeld, eds., pp. 548–552, Morgan Kaufmann, 1997.
15. J. Yu and D. J. DeWitt, “Processing satellite images on tertiary storage: A study of the impact of tile sizeon performance,” in 5 th NASA Goddard Conference on Mass Storage Systems and Technologies, 1996.
16. P. Hansen, “Opengl texture-mapping with very large datasets and multi-resolution tiles,” in SIGGRAPH’99: ACM SIGGRAPH 99 Conference abstracts and applications, p. 262, ACM Press, (New York, NY,USA), 1999.
17. W. Pennebaker and J. Mitchell, “JPEG: Still Image Data Compression Standard,” Van Nostrand Rein-hold 45, 1993.