Embed Size (px)
Citation preview

Real Scale Experimentations ofSLURM Resource and Job Management System
Yiannis GeorgiouPhD Candidate, BULL R&D Software Engineer
October 4, 2010
1 / 34
Plan
1 IntroductionExperimentation in High Performance Computing
2 Real-Scale Experimentation for Resource and Job Management SystemsMethodology - Platforms and Workloads
3 SLURM Experimental Analysis and Performance EvaluationScheduling EfficiencyScalabilityEnergy Efficient ManagementNetwork Topology Aware Placement
4 Conclusions and Ongoing Works
5 Appendix - References
2 / 34

Introduction
Introduction
Technological evolutions have introduced extra levels of hiererchies that need tobe treated by the resource management system
The scientific needs and the increasing demands for computing power byapplications made users more demanding in terms of robustness and certainquality of services.
Continuous growth of cluster’s sizes and network diameters lead to issuesconcerning scalability, scheduling efficiency for optimal communication speeds,fault tolerance and energy efficient management.
How can we make sure that a Resource and Job Management System will be ableto deal with those challenges?
3 / 34

Introduction Experimentation in High Performance Computing
Experimental Methodologies for HPC
The study of HPC systems depends on large number of parameters andconditions.
Experimentation in HPC makes use of simulators or emulators which presentadvantages (control of experiments, ease of reproduction) but they fail to captureall the dynamic, variety and complexity of real life conditions.
Real-scale experimentation is needed in HPC for study and evaluation of allinternal functions as one complete system.
4 / 34

Introduction Experimentation in High Performance Computing
Workload Modelling
Performance evaluation by executing a sequence of jobs. This sequence is theactual workload that will be injected to the system.
Two common ways to use a workload for system evaluation.1 Either a workload log (trace): record of resource usage data about a stream of
parallel and sequential jobs that were submitted and run on a real parallel system,2 or a workload model (synthetic workload): based on some probability distributions to
generate workload data, with the goal of clarifying their underlying principles (ESPbenchmark).
Workload Trace Decomposition
Workload Trace Analysis and Part Selection for Execution
Workload Conversion and Normalization for Submission
Trace Part Submission for Execution
Synthetic Workload Generation Real Workload Trace Treatment
Workload Trace Analysis and Post-treatment for validation
Results Collection and Jobs data conversion to Workload Trace
Adapted Workload Generation from input parameters
Workload Trace Analysis
Workload Trace File
Workload Execution upon Cluster
Workload Trace file
Initial Workload Trace fileInput Parameters
Applicat ions Used for Execution# simple sleep jobs# Linpack
# NAS NPB 3.3
# MCFOST Astrophysical
# Mandelbrot
Workload Trace Analysis# System Uti l izat ion
# Jobs Arrival Rate
# Jobs StrechTime
# Energy Consumption
# Jobs Waiting Time
# pchksum
Workload Logs
5 / 34
Introduction Experimentation in High Performance Computing
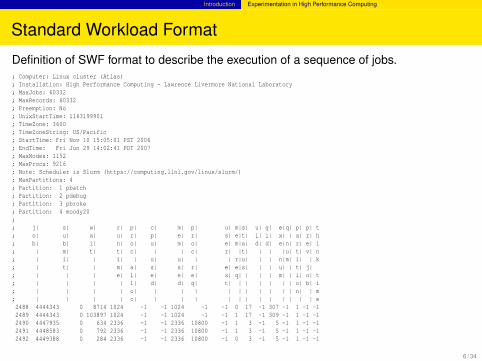
Standard Workload Format
Definition of SWF format to describe the execution of a sequence of jobs.; Computer: Linux cluster (Atlas); Installation: High Performance Computing - Lawrence Livermore National Laboratory; MaxJobs: 60332; MaxRecords: 60332; Preemption: No; UnixStartTime: 1163199901; TimeZone: 3600; TimeZoneString: US/Pacific; StartTime: Fri Nov 10 15:05:01 PST 2006; EndTime: Fri Jun 29 14:02:41 PDT 2007; MaxNodes: 1152; MaxProcs: 9216; Note: Scheduler is Slurm (https://computing.llnl.gov/linux/slurm/); MaxPartitions: 4; Partition: 1 pbatch; Partition: 2 pdebug; Partition: 3 pbroke; Partition: 4 moody20;; j| s| w| r| p| c| m| p| u| m|s| u| g| e|q| p| p| t; o| u| a| u| r| p| e| r| s| e|t| i| i| x| | a| r| h; b| b| i| n| o| u| m| o| e| m|a| d| d| e|n| r| e| i; | m| t| t| c| | | c| r| |t| | | |u| t| v| n; | i| | i| | u| u| | | r|u| | | n|m| i| | k; | t| | m| a| s| s| r| e| e|s| | | u| | t| j|; | | | e| l| e| e| e| s| q| | | | m| | i| o| t; | | | | l| d| d| q| t| | | | | | | o| b| i; | | | | o| | | | | | | | | | | n| | m; | | | | c| | | | | | | | | | | | | e2488 4444343 0 8714 1024 -1 -1 1024 -1 -1 0 17 -1 307 -1 1 -1 -12489 4444343 0 103897 1024 -1 -1 1024 -1 -1 1 17 -1 309 -1 1 -1 -12490 4447935 0 634 2336 -1 -1 2336 10800 -1 1 3 -1 5 -1 1 -1 -12491 4448583 0 792 2336 -1 -1 2336 10800 -1 1 3 -1 5 -1 1 -1 -12492 4449388 0 284 2336 -1 -1 2336 10800 -1 0 3 -1 5 -1 1 -1 -1
6 / 34
Real-Scale Experimentation for Resource and Job Management Systems
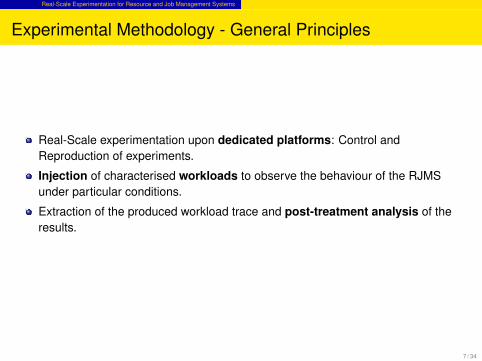
Experimental Methodology - General Principles
Real-Scale experimentation upon dedicated platforms: Control andReproduction of experiments.
Injection of characterised workloads to observe the behaviour of the RJMSunder particular conditions.
Extraction of the produced workload trace and post-treatment analysis of theresults.
7 / 34
Real-Scale Experimentation for Resource and Job Management Systems Methodology - Platforms and Workloads
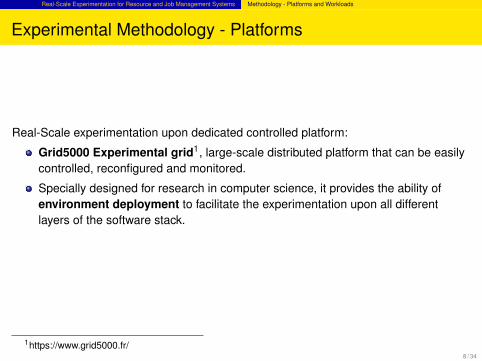
Experimental Methodology - Platforms
Real-Scale experimentation upon dedicated controlled platform:
Grid5000 Experimental grid1, large-scale distributed platform that can be easilycontrolled, reconfigured and monitored.
Specially designed for research in computer science, it provides the ability ofenvironment deployment to facilitate the experimentation upon all differentlayers of the software stack.
1https://www.grid5000.fr/8 / 34
Real-Scale Experimentation for Resource and Job Management Systems Methodology - Platforms and Workloads
Experimental Methodology - Workloads
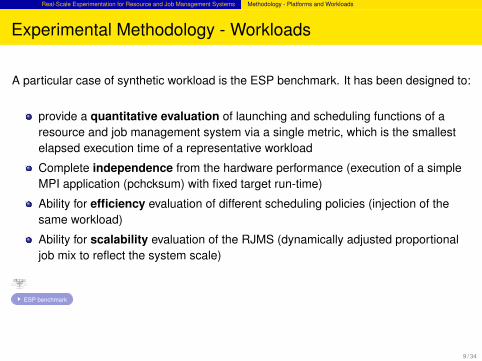
A particular case of synthetic workload is the ESP benchmark. It has been designed to:
provide a quantitative evaluation of launching and scheduling functions of aresource and job management system via a single metric, which is the smallestelapsed execution time of a representative workload
Complete independence from the hardware performance (execution of a simpleMPI application (pchcksum) with fixed target run-time)
Ability for efficiency evaluation of different scheduling policies (injection of thesame workload)
Ability for scalability evaluation of the RJMS (dynamically adjusted proportionaljob mix to reflect the system scale)
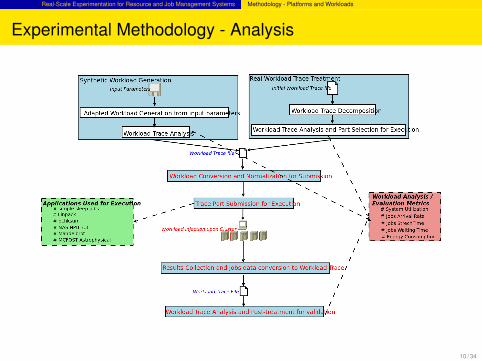
Workload Trace Decomposition
Workload Trace Analysis and Part Selection for Execution
Workload Conversion and Normalization for Submission
Trace Part Submission for Execution
Synthetic Workload Generation Real Workload Trace Treatment
Workload Trace Analysis and Post-treatment for validation
Results Collection and Jobs data conversion to Workload Trace
Adapted Workload Generation from input parameters
Workload Trace Analysis
Workload Trace File
Workload Execution upon Cluster
Workload Trace file
Initial Workload Trace fileInput Parameters
Applicat ions Used for Execution# simple sleep jobs# Linpack
# NAS NPB 3.3
# MCFOST Astrophysical
# Mandelbrot
Workload Trace Analysis# System Uti l izat ion
# Jobs Arrival Rate
# Jobs StrechTime
# Energy Consumption
# Jobs Waiting Time
# pchksum
ESP benchmark
9 / 34
Real-Scale Experimentation for Resource and Job Management Systems Methodology - Platforms and Workloads
Experimental Methodology - Analysis
10 / 34
SLURM Experimental Analysis and Performance Evaluation Scheduling Efficiency
Scheduling Policies Comparisons - Experimentation
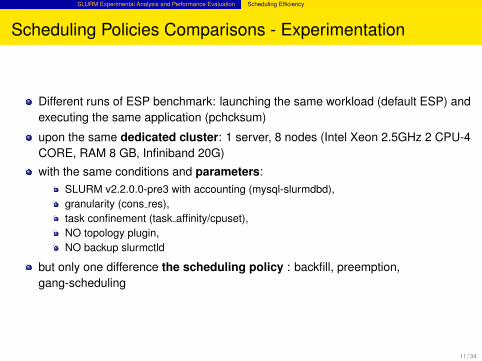
Different runs of ESP benchmark: launching the same workload (default ESP) andexecuting the same application (pchcksum)
upon the same dedicated cluster: 1 server, 8 nodes (Intel Xeon 2.5GHz 2 CPU-4CORE, RAM 8 GB, Infiniband 20G)
with the same conditions and parameters:SLURM v2.2.0.0-pre3 with accounting (mysql-slurmdbd),granularity (cons res),task confinement (task affinity/cpuset),NO topology plugin,NO backup slurmctld
but only one difference the scheduling policy : backfill, preemption,gang-scheduling
11 / 34
SLURM Experimental Analysis and Performance Evaluation Scheduling Efficiency
Scheduling Policies Comparisons - Results
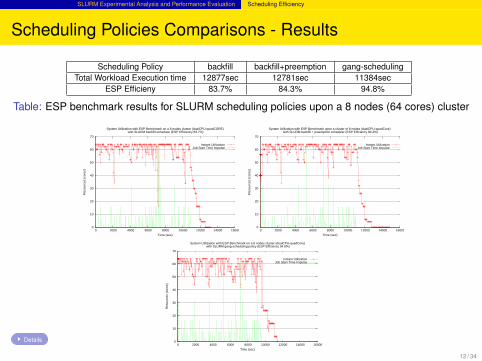
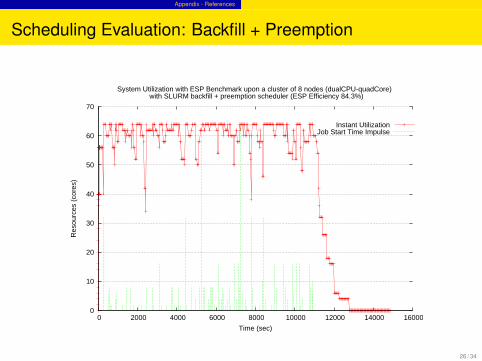
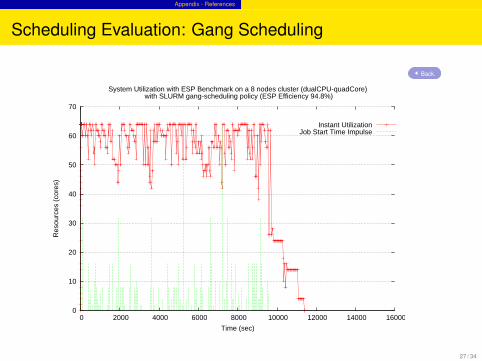
Scheduling Policy backfill backfill+preemption gang-schedulingTotal Workload Execution time 12877sec 12781sec 11384sec
ESP Efficieny 83.7% 84.3% 94.8%
Table: ESP benchmark results for SLURM scheduling policies upon a 8 nodes (64 cores) cluster
0
10
20
30
40
50
60
70
0 2000 4000 6000 8000 10000 12000 14000 16000
Res
ourc
es (
core
s)
Time (sec)
System Utilization with ESP Benchmark on a 8 nodes cluster (dualCPU-quadCORE) with SLURM backfill scheduler (ESP Efficiency 83.7%)
Instant UtilizationJob Start Time Impulse
0
10
20
30
40
50
60
70
0 2000 4000 6000 8000 10000 12000 14000 16000
Res
ourc
es (
core
s)
Time (sec)
System Utilization with ESP Benchmark upon a cluster of 8 nodes (dualCPU-quadCore) with SLURM backfill + preemption scheduler (ESP Efficiency 84.3%)
Instant UtilizationJob Start Time Impulse
0
10
20
30
40
50
60
70
0 2000 4000 6000 8000 10000 12000 14000 16000
Res
ourc
es (
core
s)
Time (sec)
System Utilization with ESP Benchmark on a 8 nodes cluster (dualCPU-quadCore) with SLURM gang-scheduling policy (ESP Efficiency 94.8%)
Instant UtilizationJob Start Time Impulse
Details
12 / 34

SLURM Experimental Analysis and Performance Evaluation Scheduling Efficiency
Scheduling Policies Comparisons - Analysis
gang scheduling the best performance, allowing the efficient filling up of all the’holes’ in the scheduling space
however this is due to the simplicity of the particular application suspend/resumehappens on memory , no swapping needed
preemption better than backfill: due to the 2 higher priority ”all resources jobs”.
13 / 34
SLURM Experimental Analysis and Performance Evaluation Scalability
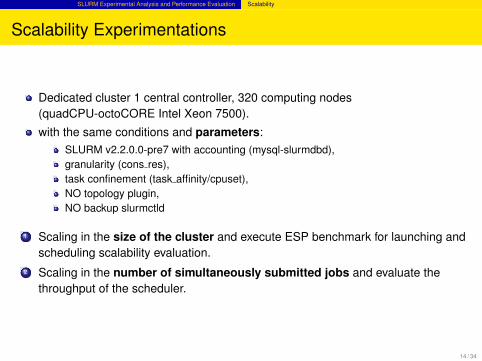
Scalability Experimentations
Dedicated cluster 1 central controller, 320 computing nodes(quadCPU-octoCORE Intel Xeon 7500).
with the same conditions and parameters:SLURM v2.2.0.0-pre7 with accounting (mysql-slurmdbd),granularity (cons res),task confinement (task affinity/cpuset),NO topology plugin,NO backup slurmctld
1 Scaling in the size of the cluster and execute ESP benchmark for launching andscheduling scalability evaluation.
2 Scaling in the number of simultaneously submitted jobs and evaluate thethroughput of the scheduler.
14 / 34
SLURM Experimental Analysis and Performance Evaluation Scalability
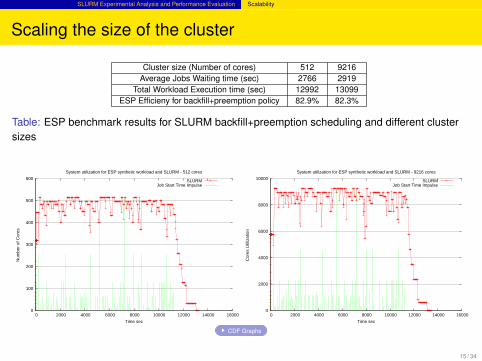
Scaling the size of the cluster
Cluster size (Number of cores) 512 9216Average Jobs Waiting time (sec) 2766 2919
Total Workload Execution time (sec) 12992 13099ESP Efficieny for backfill+preemption policy 82.9% 82.3%
Table: ESP benchmark results for SLURM backfill+preemption scheduling and different clustersizes
0
100
200
300
400
500
600
0 2000 4000 6000 8000 10000 12000 14000 16000
Num
ber
of C
ores
Time sec
System utilization for ESP synthetic workload and SLURM - 512 cores
SLURMJob Start Time Impulse
0
2000
4000
6000
8000
10000
0 2000 4000 6000 8000 10000 12000 14000 16000
Cor
es U
tiliz
atio
n
Time sec
System utilization for ESP synthetic workload and SLURM - 9216 cores
SLURMJob Start Time Impulse
CDF Graphs
15 / 34

SLURM Experimental Analysis and Performance Evaluation Scalability
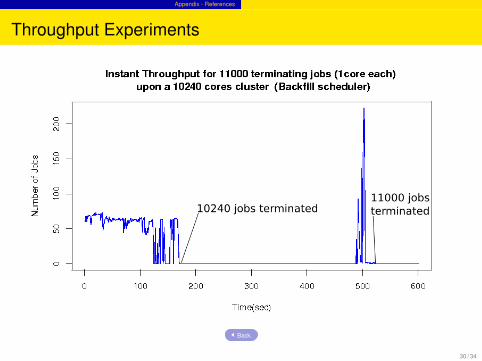
Scaling the number of submitted jobs:Backfill policy
Submission burst of small granularity jobs (srun -n1 sleep 1000)
Good throughput performance for backfill scheduler
16 / 34

SLURM Experimental Analysis and Performance Evaluation Scalability
Scaling the number of submitted jobs:Backfill with Preemption policy
Submission burst of small granularity jobs (srun -n1 sleep 1000)
No different priorities between jobs, hence no possibility of preemption
Degredation problems with backfill+preemption
0 50 100 150 200 250 300
050
100
150
Instant Throughput for 7000 submitted jobs (1core each) upon a 10240 cores cluster (Backfill+Preemption Mode)
Time(sec)
Num
ber
of J
obs
Proposed Optimization
17 / 34
SLURM Experimental Analysis and Performance Evaluation Energy Efficient Management
Energy Efficient Resource Management
Dedicated cluster 1 SLURM central controller, 32 computing nodes (DualCPU,2GB, Gigabit Ethernet).
with the same conditions and parameters SLURM-2.1
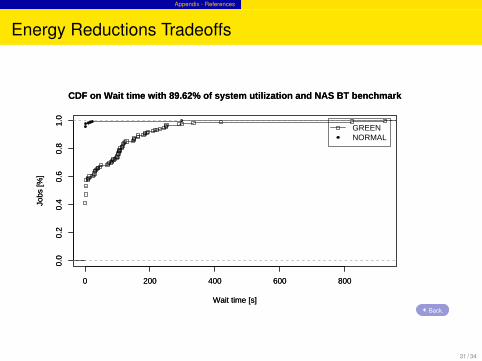
launch a workload based on a trace file with 89.7% system utilization, executeNAS BT class C applications and measure the energy consumption of the wholecluster
only difference: enable or not the power saving mode.
Energy Consumption collected by Watt-meters (per node measures).
18 / 34
SLURM Experimental Analysis and Performance Evaluation Energy Efficient Management
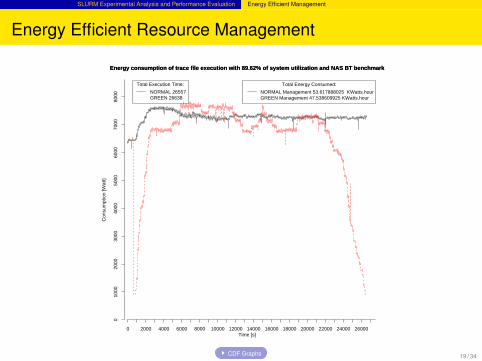
Energy Efficient Resource Management
Energy consumption of trace file execution with 89.62% of system utilization and NAS BT benchmark
010
0020
0030
0040
0050
0060
0070
0080
00
Con
sum
ptio
n [W
att]
0 2000 4000 6000 8000 10000 12000 14000 16000 18000 20000 22000 24000 26000Time [s]
Energy consumption of trace file execution with 89.62% of system utilization and NAS BT benchmark
Total Energy Consumed:
NORMAL Management 53.617888025 KWatts.hourGREEN Management 47.538609925 KWatts.hour
Total Execution Time:
NORMAL 26557GREEN 26638
CDF Graphs 19 / 34
SLURM Experimental Analysis and Performance Evaluation Network Topology Aware Placement
Network Topology Aware Placement Evaluations
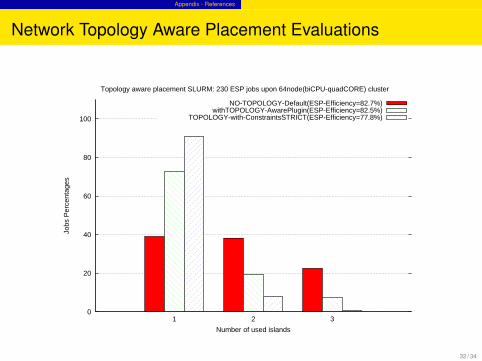
Dedicated cluster 1 SLURM central controller, 128 computing nodes(quadCPU-octoCORE Intel Xeon 7500).
network topological constraints, 2 different islands , 64 nodes per island : higherbandwidth in the same island
with the same conditions and parameters SLURM v2.2.0.0-pre7
launch a workload based on ESP workload but without fixed run time forapplications so as to observe the real execution time of the application
in place of pchksum execute NAS MPI CG class D applications (sensitive incommunications) and observe the total execution time of the whole workload
only difference: enable or not the topology plugin.
20 / 34
SLURM Experimental Analysis and Performance Evaluation Network Topology Aware Placement
Network Topology Aware Placement Evaluations
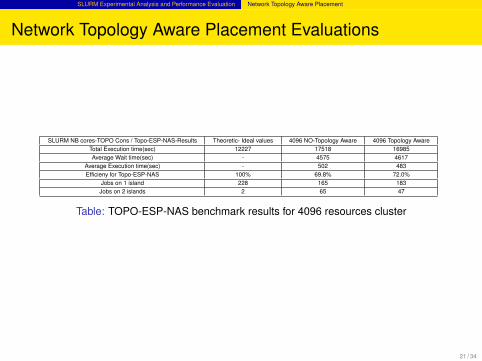
SLURM NB cores-TOPO Cons / Topo-ESP-NAS-Results Theoretic- Ideal values 4096 NO-Topology Aware 4096 Topology AwareTotal Execution time(sec) 12227 17518 16985Average Wait time(sec) - 4575 4617
Average Execution time(sec) - 502 483Efficieny for Topo-ESP-NAS 100% 69.8% 72.0%
Jobs on 1 island 228 165 183Jobs on 2 islands 2 65 47
Table: TOPO-ESP-NAS benchmark results for 4096 resources cluster
21 / 34
Conclusions and Ongoing Works
Conclusions SLURM
SLURM Resource and Job Management System has been choosen for BULL HighPerformance Computing Petaflopic Offer:
Scalable, Efficient and Robust
Passing the Petaflop barrier allowed us to experiment with scalability levels thatare attained for the first time,
Real scale - controlled experimentation guarantees that SLURM performanceand efficiency will stay as expected.
Research for ways of simulating an even larger platform in order to prepare theResource and Job Management Systems for the next level of scalability.
Deeper Workload Traces Modelization and replays of trace models for possibleoptimization (application performance, energy consumption) by considering theside-effects, tradeoffs
22 / 34

Conclusions and Ongoing Works
Ongoing Works and Collaborations
BULL’s Team for SLURM Developments and Support: Martin Perry (cgroups),Nancy Kritkausky, David Egolf(Licenses Management), Rod Schultz(topologyextraction), Eric Lynn, Dan Rusak(sview), Doug Parisek(Power Management), BillBrophy (strigger,scheduling optimizations), Yiannis Georgiou
Collaborations with CEA: Matthieu Heutreux, Francis Belot
Research continuous in modelization and experimentation Gael Gorgo (BULL,INRIA), Joseph Emeras (INRIA, CEA), Olivier Richard (INRIA)
23 / 34

Conclusions and Ongoing Works
24 / 34
Appendix - References
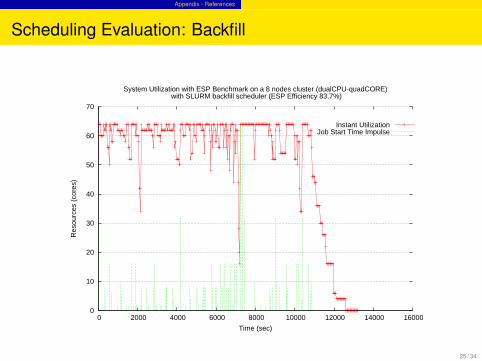
Scheduling Evaluation: Backfill
0
10
20
30
40
50
60
70
0 2000 4000 6000 8000 10000 12000 14000 16000
Res
ourc
es (
core
s)
Time (sec)
System Utilization with ESP Benchmark on a 8 nodes cluster (dualCPU-quadCORE) with SLURM backfill scheduler (ESP Efficiency 83.7%)
Instant UtilizationJob Start Time Impulse
25 / 34
Appendix - References
Scheduling Evaluation: Backfill + Preemption
0
10
20
30
40
50
60
70
0 2000 4000 6000 8000 10000 12000 14000 16000
Res
ourc
es (
core
s)
Time (sec)
System Utilization with ESP Benchmark upon a cluster of 8 nodes (dualCPU-quadCore) with SLURM backfill + preemption scheduler (ESP Efficiency 84.3%)
Instant UtilizationJob Start Time Impulse
26 / 34
Appendix - References
Scheduling Evaluation: Gang Scheduling
0
10
20
30
40
50
60
70
0 2000 4000 6000 8000 10000 12000 14000 16000
Res
ourc
es (
core
s)
Time (sec)
System Utilization with ESP Benchmark on a 8 nodes cluster (dualCPU-quadCore) with SLURM gang-scheduling policy (ESP Efficiency 94.8%)
Instant UtilizationJob Start Time Impulse
Back.
27 / 34

Appendix - References
Jobs Waiting Time
0 1000 2000 3000 4000 5000 6000
0.0
0.2
0.4
0.6
0.8
1.0
Cumulated Distribution Function on Waiting time for ESP benchmark and SLURM backfill+preemption scheduler
Wait time [sec]
Jobs
[%]
0 1000 2000 3000 4000 5000 6000
0.0
0.2
0.4
0.6
0.8
1.0
Cumulated Distribution Function on Waiting time for ESP benchmark and SLURM backfill+preemption scheduler
Wait time [sec]
Jobs
[%]
SLURM512SLURM9216
Back.
28 / 34
Appendix - References
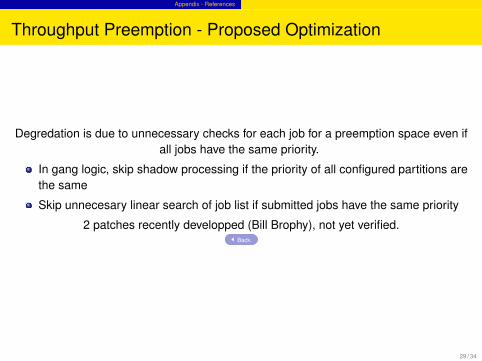
Throughput Preemption - Proposed Optimization
Degredation is due to unnecessary checks for each job for a preemption space even ifall jobs have the same priority.
In gang logic, skip shadow processing if the priority of all configured partitions arethe same
Skip unnecesary linear search of job list if submitted jobs have the same priority
2 patches recently developped (Bill Brophy), not yet verified.Back.
29 / 34
Appendix - References
Throughput Experiments
Back.
30 / 34
Appendix - References
Energy Reductions Tradeoffs
0 200 400 600 800
0.0
0.2
0.4
0.6
0.8
1.0
CDF on Wait time with 89.62% of system utilization and NAS BT benchmark
Wait time [s]
Jobs
[%]
0 200 400 600 800
0.0
0.2
0.4
0.6
0.8
1.0
CDF on Wait time with 89.62% of system utilization and NAS BT benchmark
Wait time [s]
Jobs
[%]
GREENNORMAL
Back.
31 / 34
Appendix - References
Network Topology Aware Placement Evaluations
0
20
40
60
80
100
1 2 3
Jobs
Per
cent
ages
Number of used islands
Topology aware placement SLURM: 230 ESP jobs upon 64node(biCPU-quadCORE) cluster
NO-TOPOLOGY-Default(ESP-Efficiency=82.7%)withTOPOLOGY-AwarePlugin(ESP-Efficiency=82.5%)
TOPOLOGY-with-ConstraintsSTRICT(ESP-Efficiency=77.8%)
32 / 34

Appendix - References
Archive of Real Parallel Workloads
Workload Traces From Until Months CPUS Jobs Users Utilization %LANL O2K Nov 1999 Apr 2000 5 2,048 121,989 337 64.0
OSC Cluster Jan 2000 Nov 2001 22 57 80,714 254 43.1SDSC BLUE Apr 2000 Jan 2003 32 1,152 250,440 468 76.2
HPC2N Jul 2002 Jan 2006 42 240 527,371 258 72.0DAS2 fs0 Jan 2003 Jan 2004 12 144 225,711 102 14.9DAS2 fs1 Jan 2003 Dec 2003 12 64 40,315 36 12.1DAS2 fs2 Jan 2003 Dec 2003 12 64 66,429 52 19.5DAS2 fs3 Jan 2003 Dec 2003 12 64 66,737 64 10.7DAS2 fs4 Feb 2003 Dec 2003 11 64 33,795 40 14.5
SDSC DataStar Mar 2004 Apr 2005 13 1,664 96,089 460 62.8LPC EGEE Aug 2004 May 2005 9 140 244,821 57 20.8LLNL uBGL Nov 2006 Jun 2007 7 2,048 112,611 62 56.1LLNL Atlas Nov 2006 Jun 2007 8 9,216 60,332 132 64.1
LLNL Thunder Jan 2007 Jun 2007 5 4,008 128,662 283 87.6
Table: Logs of Real Parallel Workloads from Production Systems [Feitelson’s Logs Archive
http://www.cs.huji.ac.il/labs/parallel/workload/logs.html]
Back.
33 / 34
Appendix - References
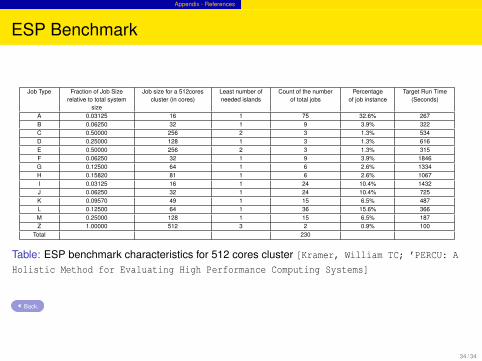
ESP Benchmark
Job Type Fraction of Job Size Job size for a 512cores Least number of Count of the number Percentage Target Run Timerelative to total system cluster (in cores) needed islands of total jobs of job instance (Seconds)
sizeA 0.03125 16 1 75 32.6% 267B 0.06250 32 1 9 3.9% 322C 0.50000 256 2 3 1.3% 534D 0.25000 128 1 3 1.3% 616E 0.50000 256 2 3 1.3% 315F 0.06250 32 1 9 3.9% 1846G 0.12500 64 1 6 2.6% 1334H 0.15820 81 1 6 2.6% 1067I 0.03125 16 1 24 10.4% 1432J 0.06250 32 1 24 10.4% 725K 0.09570 49 1 15 6.5% 487L 0.12500 64 1 36 15.6% 366M 0.25000 128 1 15 6.5% 187Z 1.00000 512 3 2 0.9% 100
Total 230
Table: ESP benchmark characteristics for 512 cores cluster [Kramer, William TC; ’PERCU: A
Holistic Method for Evaluating High Performance Computing Systems]
Back.
34 / 34