Embed Size (px)
Citation preview
RealOptionsDecisionFrameworkforResearchandDevelopment:ACaseStudyonaSmall
CanadianHigh-TechnologyStart-Up
by
SallyJamalMattar
Thisthesisissubmittedinpartialfulfillmentoftherequirementsforthedegreeof
MasterofScience
in
EngineeringManagement
DepartmentofMechanicalEngineeringUniversityofAlberta
©SallyMattar,2017
ii
Abstract
ResearchandDevelopment(R&D)projectscanbeboth innovativeandhighlyuncertain.Allowing
for managerial flexibility and adopting real options methods and incorporating technology
readiness level scales to assess the maturity of technologies progressing through development
stages,canhelpmanagershedgetheunforeseenrisksthatariseduringthesestages.Managerscan
makedecisionsthatavoidthedownsideandcapturetheupsideoftheserisks.Thismethodologyis
adecision-making framework forresearchorganizations,wherepotentialvaluesofdecisionsand
projects across aportfolio canbe evaluated.Theproposed framework analyzes the risks as they
progressthroughthetechnologyreadinesslevelscale,andenablesR&Dmanagementtoplayactive
roles in project evaluations and justify continued spending on risky, long term projects that are
expectedtobeofhighfuturevalue,anareawheretraditionalvaluationmethodsfallshort.Acase
studyon a small Canadian technology start-up is used todiscuss the importanceof adopting the
proposedmethodology.

iii
Preface
ThisthesisisoriginalworkbySallyMattar.Thecasestudy,whichispartofChapter4ofthethesis
received research ethics approval from the University of Alberta Research Ethics Board, Project
Name“Realoptionsanalysisapplication”,Pro0073487,July20,2017.Thisworkwasnotpublished
anywhereelseanddoesnotcontaincollaborativework.
iv
Acknowledgements
IwouldliketothankmysupervisorDr.LipsettforgivingmetheopportunitytocompleteaMasters
inEngineeringManagement.Iamgratefulforallhissupportandguidancethroughoutthecourseof
mydegreeandIhaveenjoyedworkingwithhimimmensely.Itwasalwaysapleasuretochatwith
himandhealwayshadsomethingintelligentandinterestingtosay.Hewasacontinuoussupport
andwithouthim,thisprojectcouldnothavebeencompleted.
Iwould also like to thankDr. Lianne Lefsrud. Ever since taking her class in the Fall semester of
2016,shehasbeenaninspirationandrolemodel,andIaspiretobe likeheroneday.Shealways
offered support and gave valuable advice when needed. She also provided guidance on the
structureandorganizationofthisthesisandIamverygratefulforallherhelp.
v
TableofContents
Abstract.....................................................................................................................................................................................iiPreface......................................................................................................................................................................................iiiAcknowledgements.............................................................................................................................................................ivTableofContents..................................................................................................................................................................vListofFigures.....................................................................................................................................................................viiiListofTables..........................................................................................................................................................................ixChapter1Introduction.......................................................................................................................................................11.1ThesisMotivation&BusinessCase.......................................................................................................................11.2ObjectiveofThesis........................................................................................................................................................21.3ThesisStructure.............................................................................................................................................................4Chapter2ReviewoftheLiterature...............................................................................................................................52.1R&DandTechnologyDevelopment......................................................................................................................52.1.1R&DandTechnologyDevelopment...................................................................................................................62.1.2ExamplesofTechnologyDevelopmentModels.........................................................................................102.1.3TechnologyPush–MarketPull........................................................................................................................132.1.4CapabilitiesofaFirm............................................................................................................................................142.2TechnologicalMaturity............................................................................................................................................142.2.1TechnologyReadinessLevelsOverview.......................................................................................................142.2.2TRLs:CharacteristicsatEachLevel................................................................................................................162.2.3OtherTRAToolsandTechniques....................................................................................................................222.2.4LimitationsofTRLs................................................................................................................................................232.3TechnologyRiskManagement..............................................................................................................................242.3.1RisksinR&D&TechnologyDevelopment...................................................................................................242.3.2RiskManagementinR&D...................................................................................................................................302.3.3RiskManagementTools&Techniques.........................................................................................................312.4FinancialValuationMethods.................................................................................................................................332.4.1TraditionalValuationMethods.........................................................................................................................332.4.2FinancialOptionsTheoryOverview...............................................................................................................362.4.3Black-ScholesModel..............................................................................................................................................372.4.4BinomialModel........................................................................................................................................................382.5RealOptionsValuation.............................................................................................................................................412.5.1IntroductiontoRealOptions:ValueasaDecision-MakingTool........................................................41
vi
2.5.2RealOptionsValuation:FinancialOptionsvs.RealOptions................................................................432.5.3TypesofRealOptions...........................................................................................................................................452.6RealOptionsAnalysis...............................................................................................................................................482.6.1ApplyingRealOptions:TheSteps....................................................................................................................482.6.2Monte-CarloSimulations.....................................................................................................................................502.6.3RealOptionsinIndustry......................................................................................................................................51Chapter3DevelopmentoftheROADecisionFramework...............................................................................543.1FrameworkMethodology.......................................................................................................................................543.2Phase1:CollectionofData&InitialPlanning................................................................................................563.3Phase2:TechDevelopmentStages-gates&TRLAssessment................................................................573.4RisksinTechnologyDevelopment......................................................................................................................623.5Phase3:RealOptionsAnalysis.............................................................................................................................693.5.1Base-CaseDiscountedCashFlow&SensitivityAnalysis......................................................................693.5.2Monte-CarloSimulation.......................................................................................................................................703.5.3RealOptionsProblemFraming&OptionValuation................................................................................72Chapter4ApplicationtoCaseStudy:CopperstoneTechnologies................................................................764.1Phase1:DataCollection&Background...........................................................................................................764.1.1CompanyBackground:CopperstoneTechnologies.................................................................................774.1.2InterviewwithBusinessDevelopmentManager......................................................................................784.1.3InformationfromRelevantSources...............................................................................................................794.2Phase2:CurrentTRLandCriticalRisks...........................................................................................................804.2.1ARCurrentTechnologicalMaturity................................................................................................................814.2.2CriticalRiskFactors...............................................................................................................................................834.3Phase3:ROAApplication.......................................................................................................................................864.3.1ROAProblemSet-up..............................................................................................................................................864.3.2Base-caseDCF..........................................................................................................................................................874.3.3SensitivityAnalysis&Monte-CarloSimulation.........................................................................................894.3.4ROValuationatTRL4...........................................................................................................................................924.3.5ROValuationatTRL6...........................................................................................................................................974.3.6SensitivityAnalysisforExercisedOption..................................................................................................1084.3.7OtherCaseStudyConsiderations..................................................................................................................1094.4.NationalResearchCouncilofCanadaCaseStudy.....................................................................................1104.4.1NRCCaseBackground........................................................................................................................................110
vii
4.4.2RecommendationsforFutureNRCPortfolios..........................................................................................111Chapter5Conclusion.....................................................................................................................................................1135.1Conclusion...................................................................................................................................................................1135.2FrameworkLimitations.........................................................................................................................................1165.3RecommendationsforFutureResearch.........................................................................................................117References...........................................................................................................................................................................119Appendix1SupportingInformationforLiteratureReview..........................................................................1291.1DefinitionsofTRLs..................................................................................................................................................1291.2GOARiskAssessment.............................................................................................................................................1311.3PotentialRisksinR&D...........................................................................................................................................132Appendix2CaseStudySupportingInformation................................................................................................1342.1CopperstoneTeamBios.........................................................................................................................................1342.2ActivitiesTimeline...................................................................................................................................................1362.3CopperstoneTechnologiesFinancials.............................................................................................................1372.4SampleofInterviewQuestionswithBusinessDevelopmentManager............................................1372.5SummaryfromRelevantThesisDocument..................................................................................................138Appendix3RealOptionsAnalysisSupportingCalculations.........................................................................1403.1Base-CaseDCF...........................................................................................................................................................1403.2SensitivityAnalysis..................................................................................................................................................1413.3BuildingCapabilitiesOptionValuation...........................................................................................................1443.4MarketPivotOptionValuation...........................................................................................................................1453.5MonitoringServicesOptionValuation............................................................................................................1463.6SalesOptionValuation...........................................................................................................................................1473.7LicensingOptionValuation..................................................................................................................................148Appendix4EthicsApproval........................................................................................................................................149
viii
ListofFigures
Figure1.EREStagesofDevelopmentModel..............................................................................................................11
Figure2.DoD'sTechnologyStagesofDevelopment..............................................................................................11
Figure3.LeeandGartner’s.DevelopmentModel.....................................................................................................12
Figure4.Tritleetal.StagesofDevelopment..............................................................................................................13
Figure5.Technology-Push&Market-Pull....................................................................................................................13
Figure.6DoDTRAProcess.................................................................................................................................................21
Figure7.TechnologyRiskAcrossTRLsforHighTechnologies.........................................................................27
Figure8.3x3ProbabilityImpactMatrix.......................................................................................................................32
Figure9.GenericBinomialLattice..................................................................................................................................39
Figure10.ThestructureofRealOptions....................................................................................................................42
Figure11.FrameworkSetup.............................................................................................................................................56
Figure12.StagesofTechnologyDevelopmentAgainstTRLs.............................................................................57
Figure13.FrameworkSetupofStage-gates&RealOptions...............................................................................60
Figure14.GenericSADTModel........................................................................................................................................61
Figure15.CriticalRiskFactorsforR&D.......................................................................................................................62
Figure16.CriticalRiskFactorsDuringStagesofDevelopment.........................................................................64
Figure17.Riskprofileofmajorrisksduringtechnologydevelopment.........................................................66
Figure18.Resourcerequirementsduringtechnologydevelopment..............................................................67
Figure19.PossibleRealOptionsConsideredatTRL4..........................................................................................68
Figure20.Monte-CarloStochasticUncertaintyModeling....................................................................................71
Figure21.BinomialLatticeExample.............................................................................................................................73
Figure22.CSTCurrentTRLPositioning.......................................................................................................................81
Figure23.TornadoDiagramRangeofNPVResults................................................................................................91
Figure24.DecisionTreeatTRL4...................................................................................................................................93
ix
Figure25.MarketPivotLatticeValuation...................................................................................................................95
Figure26.BuildCapabilitiesLatticeValuation..........................................................................................................96
Figure27.DecisionTreeatTRL6.................................................................................................................................100
Figure28.MonitoringLatticeValuation.....................................................................................................................102
Figure29.LicensingLatticeValuation........................................................................................................................104
Figure30.SalesLatticeValuation..................................................................................................................................106
Figure31.PotentialRisks.................................................................................................................................................132
ListofTables
Table1.NASATechnologyReadinessLevels............................................................................................................15
Table2.R&D3LevelsandDescriptionsandTNVandDescriptions..................................................................20
Table3.MajorR&DRisksinLiterature.........................................................................................................................25
Table4.DCFAssumptionsvsDCFrealities.................................................................................................................34
Table5.FinancialOptionsvs.RealOptions................................................................................................................43
Table6.RisksandOptionsTypes....................................................................................................................................47
Table7.ExampleofPossibleEffectsRiskonProfit.................................................................................................85
Table8.Base-caseDCFResults.........................................................................................................................................87
Table9.DCFSensitivityAnalysisResults.....................................................................................................................90
Table10.SummaryofCommercializationOptionsProsandCons...................................................................98
Table11.TRLSoftwareDefinitions..............................................................................................................................129
Table12.TRLHardwareDefinitions............................................................................................................................130
Table13.GOATRASteps...................................................................................................................................................131
1
Chapter1Introduction
1.1ThesisMotivation&BusinessCase
There is a lack of simple tools that can be used to guide and value decision-making processes
associated with technology development, and provide managers with the flexibility to make
decisionsthatcancaptureopportunitiesduringatechnologyorresearchanddevelopment(R&D)
project.Thereisaneedforastreamlinedmethodologythatcanaiddecision-makersindevelopinga
setof rubricswhereacommonunderstandingofhowcritical riskelementscan influenceproject
success for technology andR&Dprojects at different stages. Themethods need to be adapted in
ordertomodelhowexpendituresatearlystagesofR&DcanleadtodiscoveriesthatbenefitCanada.
Researchers,managers,anddecision-makers inR&Dandtechnologyorganizationsarechallenged
withhow to evaluate thepotential business benefits of early stageprojects and assess the value
that these technologies will bring to the firm compared to the costs associated with their
development[1].R&Dandtechnologyprojectsneedtoolsthatmanagerisksandallowmanagersto
make decisions accordingly as conditions change and information is gained [2]. This is the
motivationbehindtheresearchconductedforthisthesisasthereisacurrentgapwherethereare
missing tools that reflect thedynamicnatureofR&Dandcanbeapplied for these longandrisky
projects. The work conducted during this research will work to fill those gaps by developing a
decision-frameworkthatutilizesastructuredapproachtotechnologydevelopmentandevaluation.
Understandingthepotentialvalueofatechnologyisusefulformanagersthatarechoosingbetween
projects and trying to understand the benefit of committing financial and human resources to a
project, and for the researchers that try to structure these projects tomaximize the value of the
potential technology [3]. R&D and technology projects can be long and unpredictable making it
challengingformanagerstoforecasttheeffortrequiredtodevelopthesenewtechnologies[4]and
their likelihood of success once pursued. These uncertainties may lead to high risks and could
result inproject failures [5].The currentlyusedvaluationmethods suchasdiscounted cash flow
(DCF)andnetpresentvalue(NPV)arenotsufficienttoolstousefortheseprojects.
2
These traditional methods assume there is only one possible route to achieve project goals or
targetsandplacemanagersinpassiverolesthatassumethatinitialpredictionsmadeandresource
commitmentsestablished,cannotbechangedevenifconditionsrequirethemtodoso[6].Thislack
ofmanagerial flexibility couldundervalueaproject [7] suchasR&Dor technologydevelopments
thathave longerhorizonsanddonothave immediatepayoffs.Organizationsmayoverlook these
projectsas theymayhavenegativenetpresentvalues [8],neglecting thepotential futurebenefit
and the opportunity to grow [9]. In addition, organizations who rely exclusively on financial
methods to assess projects are less successful at developing new products than those that also
consideredqualitativeaspects[3].Thesetraditionalapproachesusestandardinvestmentdecision-
makingthatsolelydependsonprofitcreationwhichisnotusefulforR&Dfirmswhoseultimategoal
maynotbetocreateprofit[10].Forexample,somegoalsmaybetocreateaproductimprovethe
environment,asopposedtomarketandselltothegeneralpublic.
For these reasons discussed, a methodology must be developed to overcome these gaps in
technology development management and valuation. The details behind the proposed approach
andresearchobjectivesarediscussedinthefollowingsection.
1.2ObjectiveofThesis
The objective of this research is to develop a framework that allowsmanagers, researchers, and
decision-makers to exercise flexibility through decision-making and value their technology
investments.Theframeworkwillcombinethetechnologyreadinesslevelscale(TRL)andastage-
gate approach thatwill be the logical pointswhere a project’s activities, requirements and risks
changeandshouldbereassessed.Thiswillsupportdecision-makingthroughaconsistentmethod
thatwillassessatechnology’smaturityandprogress.Theframeworkwillutilizearealoptions(RO)
approach by recommending a small number of options to be placed along the TRL scale where
managerial decisions can be evaluated through real options analysis (ROA) and encourage
management to make evidence-based decisions for technology development and project
continuation.
3
TheapplicationofTRLsandtheROmethodcanenablemoreconsistentdiscussionsonhowrisks
changefromonephaseofaprojecttoanother,andthecomparativevalueofdifferentdecisions,or
differentprojectsacrossaportfolio.Thisapproachcanbevaluablefororganizationsasitcanhelp
exploreopportunitiesandjustifyspendingonlongerandriskierprojectswithpotentiallyveryhigh
futurevaluestoCanada.
“Realoptions”,anextensionoffinancialoptiontheory,referstoadecisionpertainingtoatangible
asset as opposed to stock. It refers to the ability of managers to exercise flexibility through
decisions such as growth, delay, or abandonment of a project as technology, financial,market or
other conditions change [11]. This active decision-makingmethod can improve the likelihood of
scientific success and the positive commercial benefit to Canada. Real options will allow
organizations to establish key decision points during R&D stages for projects across a research
program. It is a structured analysis method for determining success factors as a technology
progresses through the development stages, and the comparative influence of making early
investmentsinR&Dactivitiesthatmitigatetechnicalandcommercialrisk.
ByincorporatingTRLsintoadecision-framework,thiscansupportthesedecision-makingprocess
duringdevelopmentandimplementation[12].Itisanapproachthatworkstoreduceriskthrough
proof-of-concept and system success [13]. Furthermore, incorporating real optionsmethods into
this framework can provide researchers and managers with a tool that allows them to better
understand risk.Realoptions canmakeup forwhat traditionalmethods lack,which isproviding
flexibility. It allowsmanagers to alter the course of uncertain projects by incorporating strategic
options,thatincreasetheoverallvalueoftheproject[9].ROcanbethoughtofasguidesthatallow
managerstomakedecisionsatdifferentstagesoftheproject,suchas,whetheraprojectshouldbe
continued or terminated [9]. The sequence of decision-making during these projects allows for
justifieddecisionsofwhentoundertakeanopportunity[14].
4
The framework will be applied to a small Canadian high-technology start-up that is currently
developingautonomousrovers (AR).TheseARsallowaccess to tailingsponds thatareotherwise
inaccessible using the current measuring equipment. The case study will examine current
technological maturity using the TRL scale and the proposed stage-gate approach and identify
critical risks that would threaten progress and the ability for the start-up to meet their
organizationalandprojectgoals.Thebehaviourofthesecriticalrisksandhowtheyareexpectedto
developandtheireffectsonprojectgoalswillbediscussed.ROwillthenbeappliedtovaluearange
ofpotentialdecisionsatkeystagesoftheproject.Theseoptionswillbecomparedanddiscussed.
Thestudywillalsobrieflyintroducegeneralconceptsrelatedtoapplyingthisframeworktoalarge
government research organization’s portfolio. Framework limitations and application challenges
willbeconsideredandrecommendationsforfutureresearchwillbediscussed.
1.3ThesisStructure
This thesis is organized into five chapters. Following the introduction, Chapter 2 is a literature
review that introduces and discusses relevant topics to R&D and technology development,
technology readiness levels and assessment methodologies, real options theory and application,
andframeworksusedinvariousindustries.Chapter3establishestheproposedframeworkandthe
approach behind how it can be applied to assess decisions and value options. The framework is
then applied to a case study in Chapter 4, and potential application to a government research
organization’sportfolio isalsoexamined.Theanalysisandresultsarediscussed.Toconclude the
work, Chapter 5 provides a summary and discusses the limitations of the framework and
recommendationsforfutureresearch.
5
Chapter2ReviewoftheLiterature
This chapter reviews the main topics related to the development of the real options decision
frameworkthatwillbedescribedinChapter3.
GeneralconceptsoftechnologydevelopmentandR&Darediscussed,alongwiththecommonstages
of development discussed in the literature. This conceptualization acts as the baseline for
discussing technology readiness levels (TRL), where general activities, common assessment
methodologies, challenges and applications in industry are outlined. Common risks in R&D and
technologyprojectsarethendefinedwithillustrativeexamples.ThissectionisaprimerforChapter
3,astheseriskswillthenbemappedalongthedevelopmentstagesandTRLscale.
Risk management concepts and tools used in the R&D context are reviewed. Finally, valuation
methodsarediscussed.Traditionalvaluationmethodsandfinancialoptiontheoriesareintroduced.
Real option types, application and industry use are discussed. The steps and important
considerationsforapplyingrealoptionswillbeexamined,withadditionaldetailprovidedduringits
applicationinChapter3andChapter4.
2.1R&DandTechnologyDevelopment
R&D and technology projects deliver a combination of new knowledge, new technology or
capability, or a platform of technologies [15]. Technology R&D efforts should improve the
performanceandreliabilityofatechnologyandthuscontributetooverall technologymaturation,
whileinvestmentsmadeateachstageshouldresultinrisksbeingreduced[16].
Organizational, portfolio and project goals must be properly prioritized in R&D programs [17].
ProperresourceallocationiscriticalinR&Ddecision-making,wheremanagersmustbalancemany
organizational short-term and long-term goals that may be weighted differently by different
stakeholders [17]. Firms need to be able to work effectively within financial and resource
constraints[18].Short-termandlong-termgoalsbothalsoneedtobeconsideredaccordingly[17].
6
The need to problem solve and quickly adapt to changing conditions in high-technology R&D is
magnifiedbythepresenceofunforeseenrisksassociatedwithtechnologyintegration,performance
levels, schedule andproject budgets [19]. Tools that help assess the impacts of projects and any
overlapwithotherprojectsincludeportfolioanalysis1anddevelopmentstage-gates[18].Stage-gate
methodsemploygateswherethetechnologyisassessedagainstasetofcriteriaanda“continue/go
orstop/kill”decisionismade[15].Stage-gatesanddevelopmentmodelsarediscussedin2.1.1and
2.1.2.
R&Dandtechnologyprojectsareoftencompromisedwhen inappropriatetoolsandprocesses(or
financial criteria) are applied tomanage them [15]. Examples of such tools are discussed in 2.4.
Because of the uniqueness of such projects, applying traditional methods to manage innovative
projectsmaycauseharm,asitcouldresultinterminatingahigh-profitpotentialproject[15].
2.1.1R&DandTechnologyDevelopment
Developinganewtechnologymayposehighriskstoanorganizationastheycarryalargeamountof
technical uncertainty and other unknowns [15]. Uncertainties in R&D are expected as these
projects have intensive activities associated with knowledge discovery, problem-solving,
overcoming failure, dealing with change and making breakthroughs [19]. New technology
developmentsareunpredictable,and it is–bydefinition - impossible toschedulea technological
breakthrough,whichmakesithardtoestimatefutureefforts[4].
R&D projects are separated into development phases, and milestones are set as a method to
determine and control project progress [20]. These phases behave as checkpoints where
organizationalorprojectgoalsarerealizedandprogress isassessed[17].A lackofspecificstage-
gatedecisionpointswithpre-setcriteriaresults in incorrectproductconcepts,wastedresources,
technologyfailureandexcessivespending[21].
1Portfolioanalysisreferstotheprocessesthatinvolveassessingandaddressingtheuncertainties
inprojects,allocatingandbalancingresourcesamongprojectswhilemeetingorganizationalgoals.
7
At theearlystagesof theproject, there isnoconcreteevidenceorknowledgeabout thepotential
successofatechnology[22],theprobabilityoftechnicalsuccessmaybequitelowastechnological
capability has not yet been recognized [23][15]. However, as a technology progresses andmore
information isobtained, theestimateofsuccessbegins to improve[22].Manyorganizationshave
implemented requirements for their R&D and high-technology projects, where specific business
plans and commercialization options are laid-out however, the challenge managers face when
dealingwiththeselongandhighlyuncertainprojects,istheirinabilitytocorrectlycompletesome
of the requirements of these processes [15]. For example, envisioning themarket landscape and
conducting a market and competitor analysis is difficult for a technology that is still at the
fundamentalresearchstage,andhasnotyetbeenfullydefined[15].
DuringtheconceptualphasesofR&D,theremaybeachangeinprojectdirectionastechnologyand
marketinformationbecomesapparent,itisimportantformanagerstohavetheflexibilitytomake
these changes2 [17]. Fundamental research phases may be heavily relying on studies, technical
literature, preliminary lab studies, economical valuations and patent surveys [18]. The applied
phaseofR&Dtypicallyinvolveslaboratoryworkthataimsatrefiningthetechnology’sfeatures,and
initialassessmentoffeasibilityandpotentialmarketforproductsandservicesembodyingthenew
technology.Thetechnologyshouldnowhaveaspecificpotentialapplicationorpurpose[18].These
early phases develop concepts and ideas, where pattern recognition3 and future scenario
development isvaluable [17]. It is important to identify technologies thatare feasibleandhavea
potentialformarketacceptance[24].
2This is thevalue in realoptions.Realoptionsaredefined in2.4. It allows thesedecisions tobe
estimatedandconsideredfromaspectsrelatedtotime,costs,resourcerequirements,etc.
3 Pattern recognition is the skill needed to be able to spot trends in data (if any) or projects.
Recognizingpatternsand trendanalysisgohand-in-hand, andmanagers canutilize suchskills to
improveprojectplanningandresourceallocationiftheychooseto.
8
During the technologydevelopmentphase, the focusbecomesondesign,prototyping,and testing
[18][14]. The ultimate goal during the technology development phase is to eventually be able to
deliveraproduct toauser [25].At thispoint, the technologymusthaveproven toaddeconomic
value [12].Thepilot testingof technologywouldhavemoved from laboratory to operational (or
relatively operational) environment [26]. This is also where scale-up activities may begin (and
continue into the next phase). During the process of scale-up, new information about risks is
realized [26].The scale-upactivities are separated intobatch sizes,where smaller sizes canbea
proof-of concept, and the larger batches test for the effects of larger scalemanufacturing on the
quality or viability of the technology [26]. There is also an inherent process that occurs during
development,which is the “technology transfer”.This iswhere thedevelopmentprocesschanges
fromtechnologyandsciencecreationtoproductcreation.Furthermore,thereisatransitionwhere
the project is transferred from scientific personnel to the commercialization andmarket experts
[27].Therefore, it is important formanagement toensure that functionalgroupsworkefficiently
withoneanother[27],andkeepabalanceoftheteamandindividualresponsibilities[17].
The decision to commercialize is usually made when uncertainties from the R&D stages are
resolved [14]. The commercializationwarrants a shift in tasks as the organization is involved in
market positioning and competition [24]. This phase may involve activities that involve
manufacturing, process and product launches done through marketing [14]. During the
commercializationphase,issuessuchasthecostofgoodssold(COGS),thesizeofmarketandsale
pricemaybecriticalissues[17].Commercializationofnewtechnologiescouldincludelicensingor
donating intellectual property that is not active (i.e. dormant) [9]. The commercialization phase
bringsnew technologies to themarket and can includeactivities suchasmanufacturing, refining
thetechnologyanddistributiontocustomers[25].Thelackofcommercialskillsandashortageof
financeswillpreventanorganizationfrombeingabletomoveforwardwithnewtechnologies[28].
CooperandKleinschmidt[21]discusstheresultsfromtheirresearchwheretheyfoundthatmany
companies dive far into later stages of development without any consideration for
commercialization, only to realize later their expectations of themarket are incorrect [21]. This
brings up an important concept that should be discussed, technology-push and market-pull
technologies.Thisisdiscussedin2.1.3.
9
ActivitiesinthestagesofdevelopmentarespecifictotheprojectbutCohenetal.[29]discussnine
dimensions for basic gate decision criteria that are the framework for identifying issues. The
criteria remain the same but the details evolve as a technology progresses from one gate to
another4.Thesedimensionsforbasicgatecriteriaareasfollows[29]:
• Strategicfit:businessstrategiesandneeds
• Marketandcustomer:potentialbreadthofthetechnologyinthemarket
• Businessincentivesandrisks:keyissuesanduncertainties
• Technicalfeasibilityandrisks:scienceandtechnologyuncertainties
• Competitiveadvantage:technologyorbusinessbenefitsoverthecompetition
• Killervariables:thatcompletelystopaproject
• Legalandregulatorycompliance:health,safety,environmentaloroperationalintegrity
• Criticalfactorsforsuccess
• Plantoproceed:planstoachievegoals,milestonesandtargetdatesforthenextgate.
Hoegletal.[30]discusstheimportanceofteamdynamics(andcoordination)duringallthephases
of development and emphasize that proper team dynamics in the early conceptual phases of
developmentcanultimatelyhavemajoreffectsonperformanceinthelaterstagesofdevelopment
[30].During thedifferent stagesof theproject,managers canexpect tohavedifferent views that
overall influence the project. Criteria for decision making should be integrated within all
developmentalphases[18].Managersordecision-makerscanbethoughtofasgate-keepersduring
aprojectwheretheycanstopprojectsthatarenotproducingaccordingtosetstandards,butmust
alsobeabletospotpotential innewideas,andmakechangesduringtheprojecttocapturethese
opportunities[29].
Metricsmustbesetbymanagementearly-on inorder forprogressevaluationtobecompletedat
each stage. As the project progresses from conceptual stages all the way to commercialization,
informationandevaluationmetricschange[17].
4 For example, for research, initially thequestion askedmaybewhether the research is feasible.
Stagesaftermaybecomeaboutwhethertheconceptsinvestigatedarefeasible.
10
It isalso importanttonotethatR&Dorganizationsmaynotbecorporateenvironmentsandtheir
goal may not be to maximize revenue5[10]. It is important to note that the nature of available
informationchangesduringtechnologydevelopment.Intheinitialstages,datacanbeexpectedto
be of the qualitative nature,while in the later stages of commercialization,managers can expect
morequantitativeinformation[17].
Terminationphases areoftennot included inR&Dprojects, however, reasons for terminationor
failure of a project should be considered6 as it could improve and drive the decision-making
processesinaproject[17].Figure4illustrateshowtheterminationphaserelatestootherstagesof
developmentandhowitfitswithinamodel.
2.1.2ExamplesofTechnologyDevelopmentModels
Another common tool used by organizations is the stage-gate development method where the
technology is assessed against a set of criteria and decisions aremade at each gate [15]. Exxon
Research andEngineering (ERE)7 Companyuses a stage-gate systemwhereR&D activities begin
with fundamental research, applied research development, validation, and concludes with a
commercializationstage[29].EREthenaddedthreenewresearchgatesthatprecedethestandard
stage-gateprocessdiscussed.Thisadditionincludedidentifyingopportunitiesandenablingscience
andideagrowth[29].Kelmetal.[24]emphasizethatregardlessofthedifferencesinthetheoretical
developmentmodelsinindustry,andthespecificsbehindeachphase,thereisanoverallconsensus
thattheearlystagesofatechnologydevelopedareheavilyinvolvedintechnicalinnovation,while
thelaterphasesarefocusedoncommercialization[24].
5Anorganizationmayhaveitsownideaofmetricsofsuccess.Forexample,anot-for-profitcould
aimtoonlywanttohavepositivesocietalimpactinthepublic.
6Thisiscanbedonethroughriskassessments.
7ThishasnowbecomeExxon-Mobil(EMRE)
11
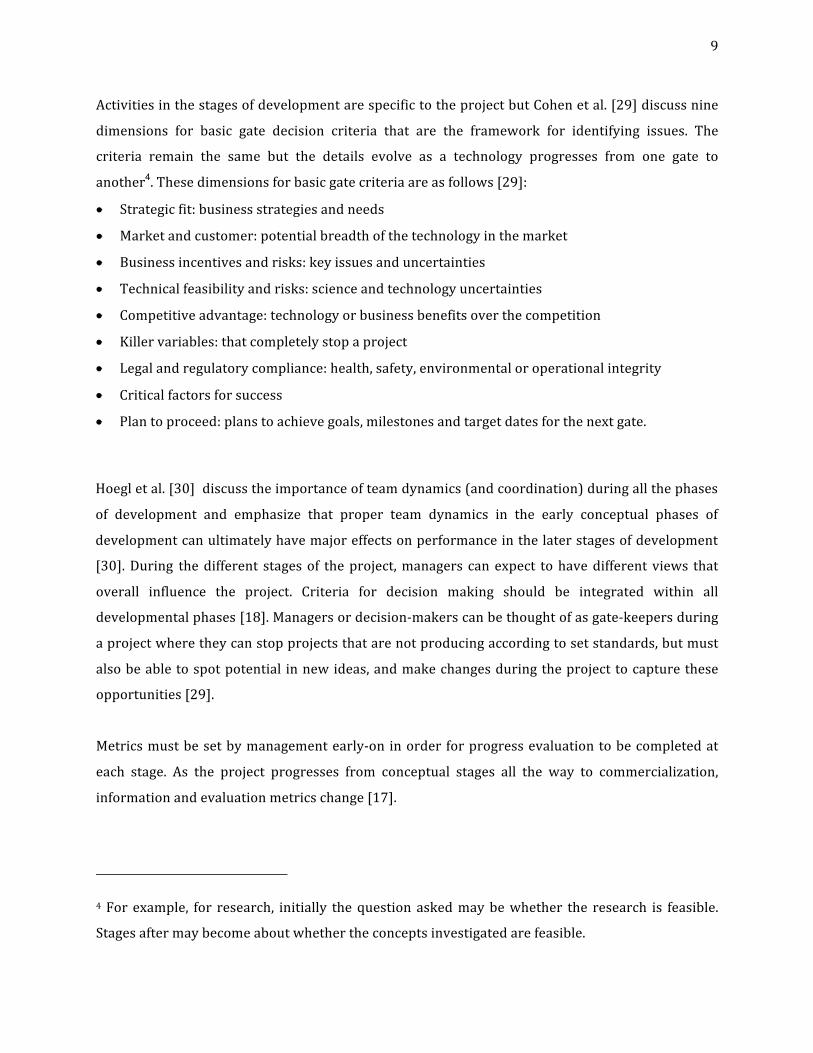
Figure1.EREStagesofDevelopmentModel[Adaptedfrom[29]]
StageAshowninFigure1iswherebusinessmanagersandresearchersbegintotrytoestablisha
businesscaseandcompetitiveedgeforthepotentialtechnology,throughadetailedplanthatsets
technical and scientific variables. The plan includes resource requirements as well as plans of
action of how these deliverables can be met [29]. Stage B is where the plan from Stage A is
executed,andissuesrelatedtoscientificprocessandleadstobusinessopportunitiesareidentified
[29].
Usingthegate-processisastructuredmethodtoassessresearchprogressandallowsfordecisions
tomade in a timelymannerwhile tracking project progress fromboth a science and technology
aspect,aswellascommercializationaspect[29].Atthegateofeachstage,risksanduncertainties
andotherdriving factors shouldbediscussedandcommunicatedwithkeypersonnel [17].There
are many versions of technology development models in literature that have been adapted for
differentpurposesandindustries[17][29][31][32].
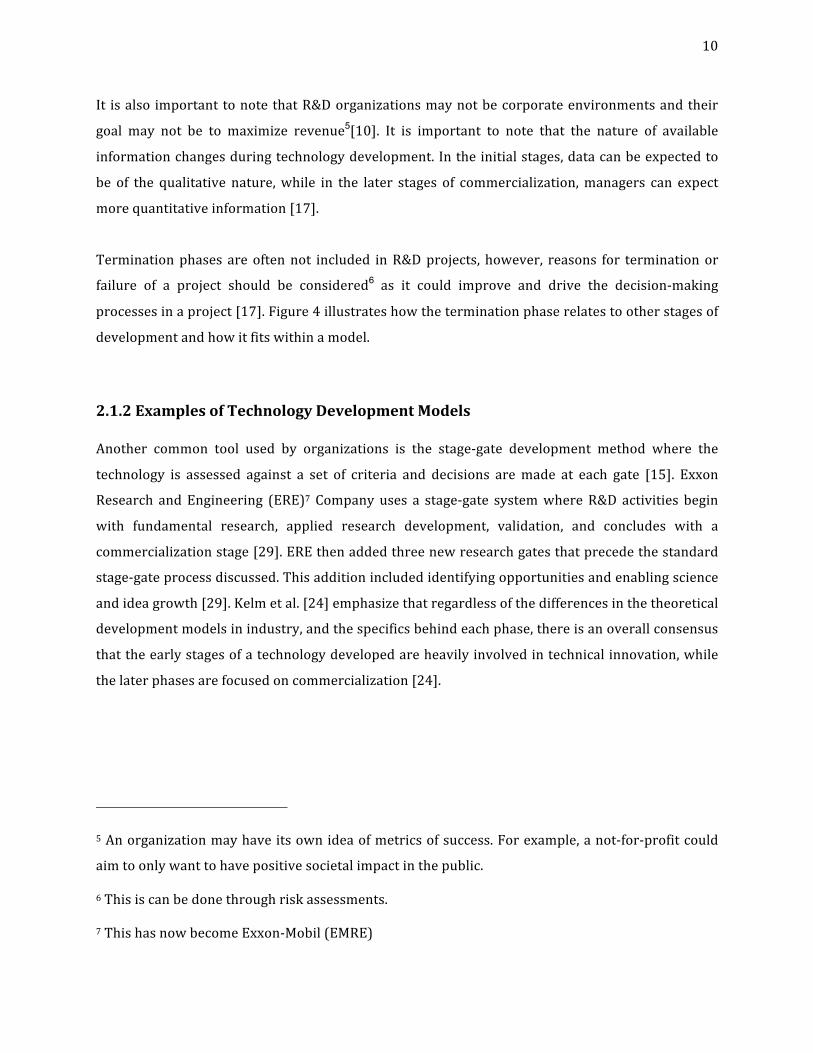
Figure2.DoD'sTechnologyStagesofDevelopment[Adaptedfrom[33]]
ConceptRefining
TechnologyDevelopment
SystemDevelopment&Demonstration
Production&Deployment
OperationsandSupport
DecisionMilestones
A B C
12
Figure2demonstratesthetechnologydevelopmentmodelusedbytheUSDepartmentofDefense
(DoD). Their model is comprised of five stages: concept refinement, technology development,
systemdevelopmentanddemonstration,productionanddeployment,andoperationsandsupport
[34][35]. The model identifies three major milestones as logical stops where technology
opportunitiescanbecaptured[34].This isshownattechnologyreadinesslevel(TRL)4,6,and7,
andOlechowskietal.suggestthatmappingTRLstostagesofdevelopmentisausefulpractice[36].
They argue that it allows expectations to be clear and consistent for all projects [36]. Concepts
related to technology readiness levels will be discussed in Section 2.2. The Milestone Decision
Authority(MDA)workswithstakeholdersinordertoassesswhetherthereisenoughinformation
at eachphase, beforemoving on to the next [34]. A projectmay start at any stage of themodel,
however, it is still a requirement that itmeet the entrance requirement of anyupcomingphases
[34].
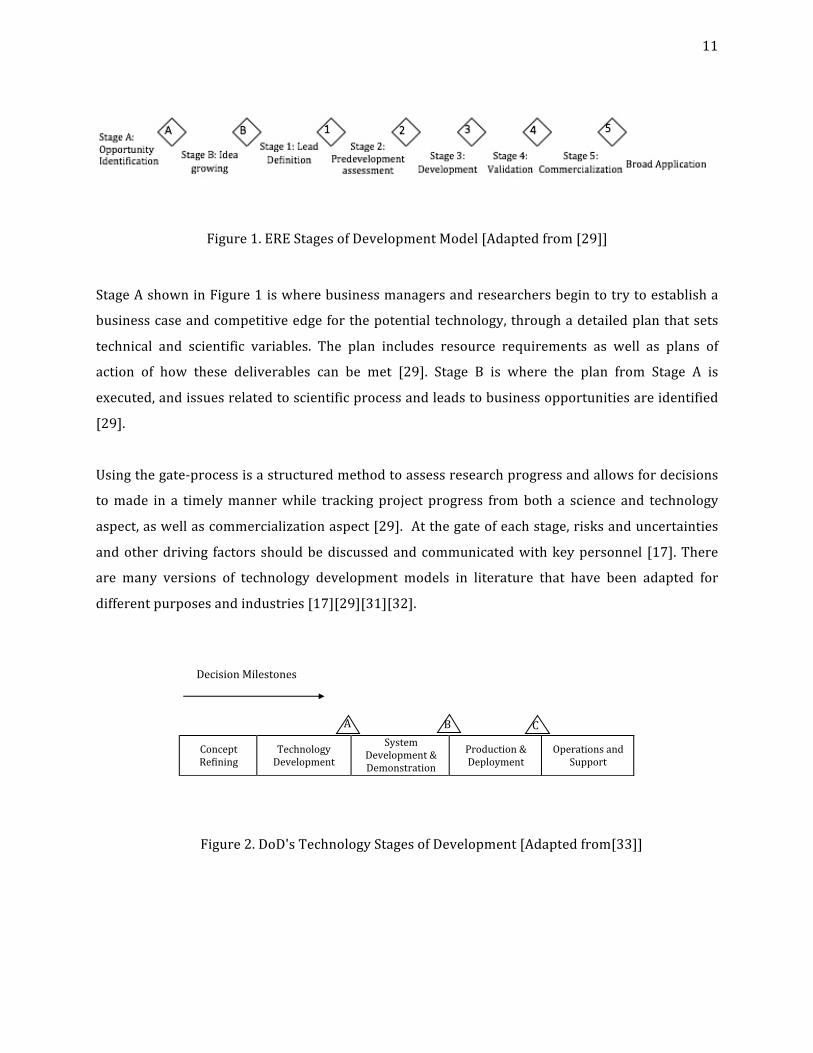
LeeandGartner[25]discussedstagesoftechnologydevelopmentinasimplifiedmodelillustrated
inFigure3.Thereisonlyonephaseofresearchasopposedtotheclassicbasicandappliedresearch
phases and three major gates. This model does not view development as a linear sequential
process, instead, it is an iterativeprocess that responds to themarket andcompetition [25].The
potentialofwhetheratechnologicalbreakthroughhasanycommercialviabilityisdoneatthefirst
stagewiththehelpofamarketspecialist[25].
Figure3.LeeandGartner’s.DevelopmentModel[Adaptedfrom[25]]
TechnologyDevelopment
BasicResearch
TechnologyCommercialization Marketand
IndustryGo/NoGo Go/NoGo Go/NoGo
13
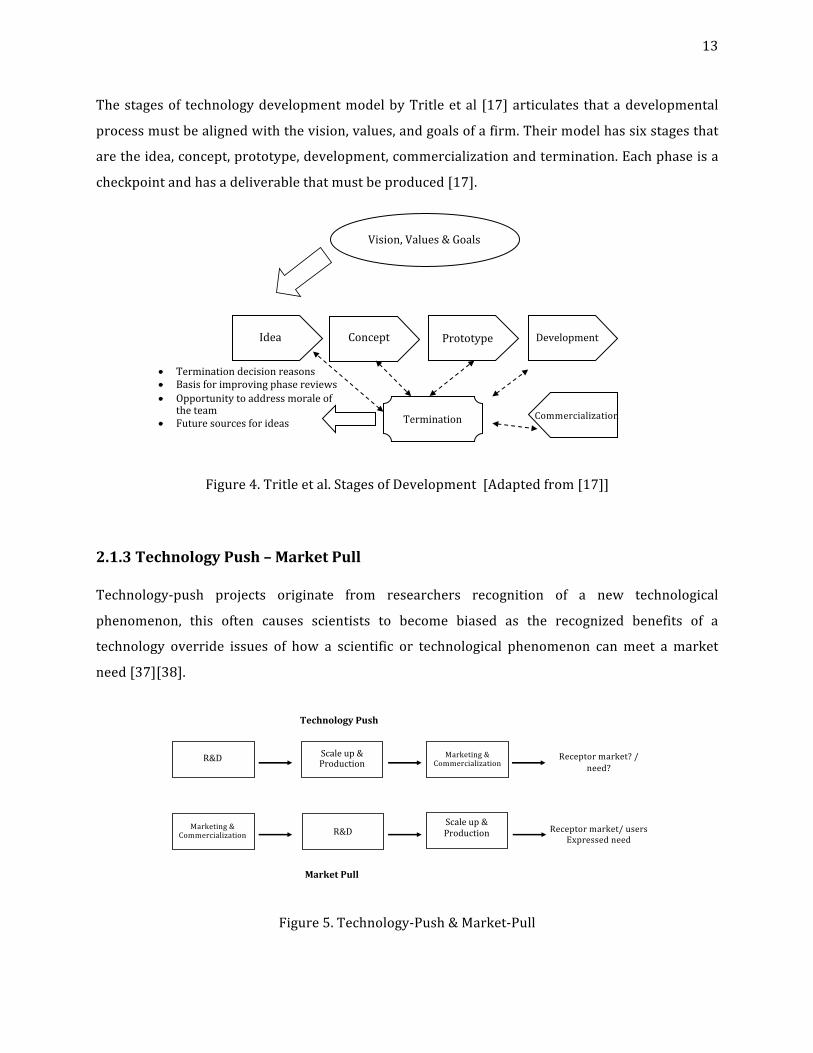
Thestagesof technologydevelopmentmodelbyTritleetal [17]articulates thatadevelopmental
processmustbealignedwiththevision,values,andgoalsofafirm.Theirmodelhassixstagesthat
aretheidea,concept,prototype,development,commercializationandtermination.Eachphaseisa
checkpointandhasadeliverablethatmustbeproduced[17].
Figure4.Tritleetal.StagesofDevelopment[Adaptedfrom[17]]
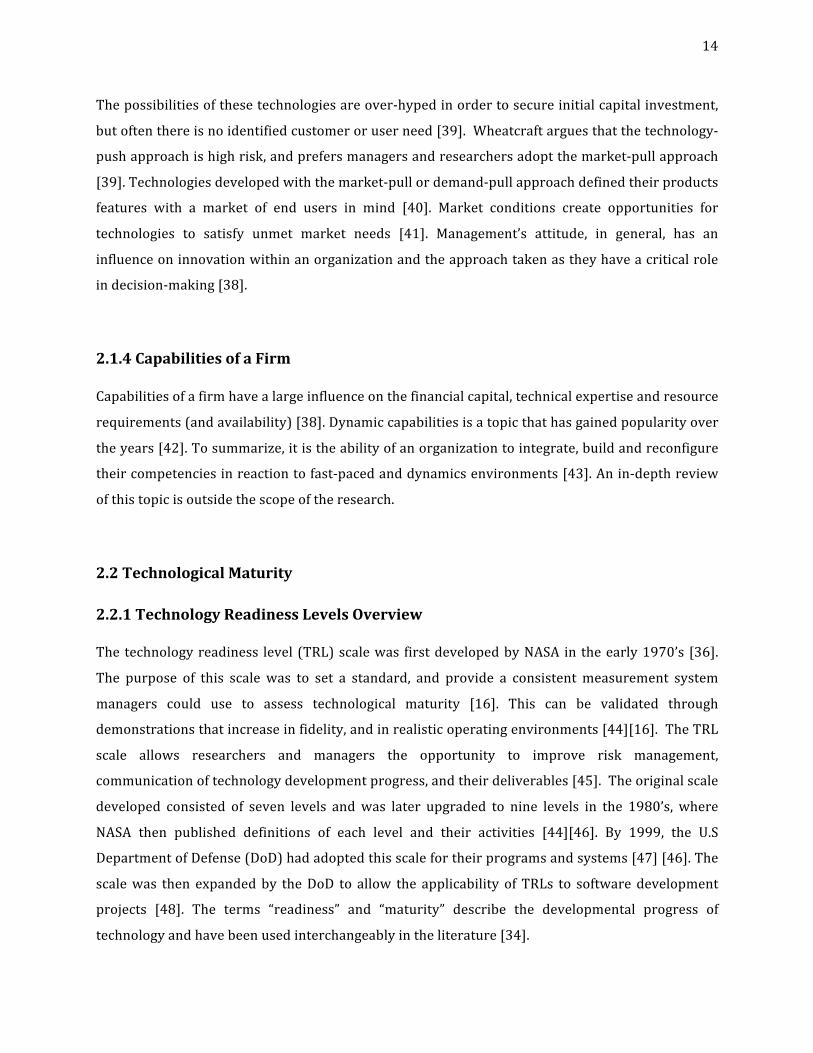
2.1.3TechnologyPush–MarketPull
Technology-push projects originate from researchers recognition of a new technological
phenomenon, this often causes scientists to become biased as the recognized benefits of a
technology override issues of how a scientific or technological phenomenon canmeet a market
need[37][38].
Figure5.Technology-Push&Market-Pull
Vision,Values&Goals
Idea Concept Prototype Development
CommercializationTermination
• Terminationdecisionreasons• Basisforimprovingphasereviews• Opportunitytoaddressmoraleof
theteam• Futuresourcesforideas
Receptormarket?/need?
R&D Scaleup&Production
Marketing&Commercialization
Marketing&Commercialization R&D
Scaleup&Production
Receptormarket/users
Expressedneed
TechnologyPush
MarketPull
14
Thepossibilitiesofthesetechnologiesareover-hypedinordertosecureinitialcapitalinvestment,
butoftenthereisnoidentifiedcustomeroruserneed[39].Wheatcraftarguesthatthetechnology-
pushapproachishighrisk,andprefersmanagersandresearchersadoptthemarket-pullapproach
[39].Technologiesdevelopedwiththemarket-pullordemand-pullapproachdefinedtheirproducts
features with a market of end users in mind [40]. Market conditions create opportunities for
technologies to satisfy unmet market needs [41]. Management’s attitude, in general, has an
influenceoninnovationwithinanorganizationandtheapproachtakenastheyhaveacriticalrole
indecision-making[38].
2.1.4CapabilitiesofaFirm
Capabilitiesofafirmhavealargeinfluenceonthefinancialcapital,technicalexpertiseandresource
requirements(andavailability)[38].Dynamiccapabilitiesisatopicthathasgainedpopularityover
theyears[42].Tosummarize,itistheabilityofanorganizationtointegrate,buildandreconfigure
theircompetenciesinreactiontofast-pacedanddynamicsenvironments[43].Anin-depthreview
ofthistopicisoutsidethescopeoftheresearch.
2.2TechnologicalMaturity
2.2.1TechnologyReadinessLevelsOverview
Thetechnologyreadiness level (TRL)scalewas firstdevelopedbyNASA in theearly1970’s [36].
The purpose of this scale was to set a standard, and provide a consistentmeasurement system
managers could use to assess technological maturity [16]. This can be validated through
demonstrationsthatincreaseinfidelity,andinrealisticoperatingenvironments[44][16].TheTRL
scale allows researchers and managers the opportunity to improve risk management,
communicationoftechnologydevelopmentprogress,andtheirdeliverables[45].Theoriginalscale
developed consisted of seven levels andwas later upgraded to nine levels in the 1980’s, where
NASA then published definitions of each level and their activities [44][46]. By 1999, the U.S
DepartmentofDefense(DoD)hadadoptedthisscalefortheirprogramsandsystems[47][46].The
scalewas then expandedby theDoD to allow the applicability of TRLs to softwaredevelopment
projects [48]. The terms “readiness” and “maturity” describe the developmental progress of
technologyandhavebeenusedinterchangeablyintheliterature[34].
15
WithlargeglobalcompaniessuchasGoogle,Bombardier,JohnDeere,BPandBoeingusingTRLs,it
is the most commonly used scale, utilized across many industries [31][36][49]. Evaluating
technologymaturityisimportantasitgivesmanagersinsightintosomeoftherisksassociatedwith
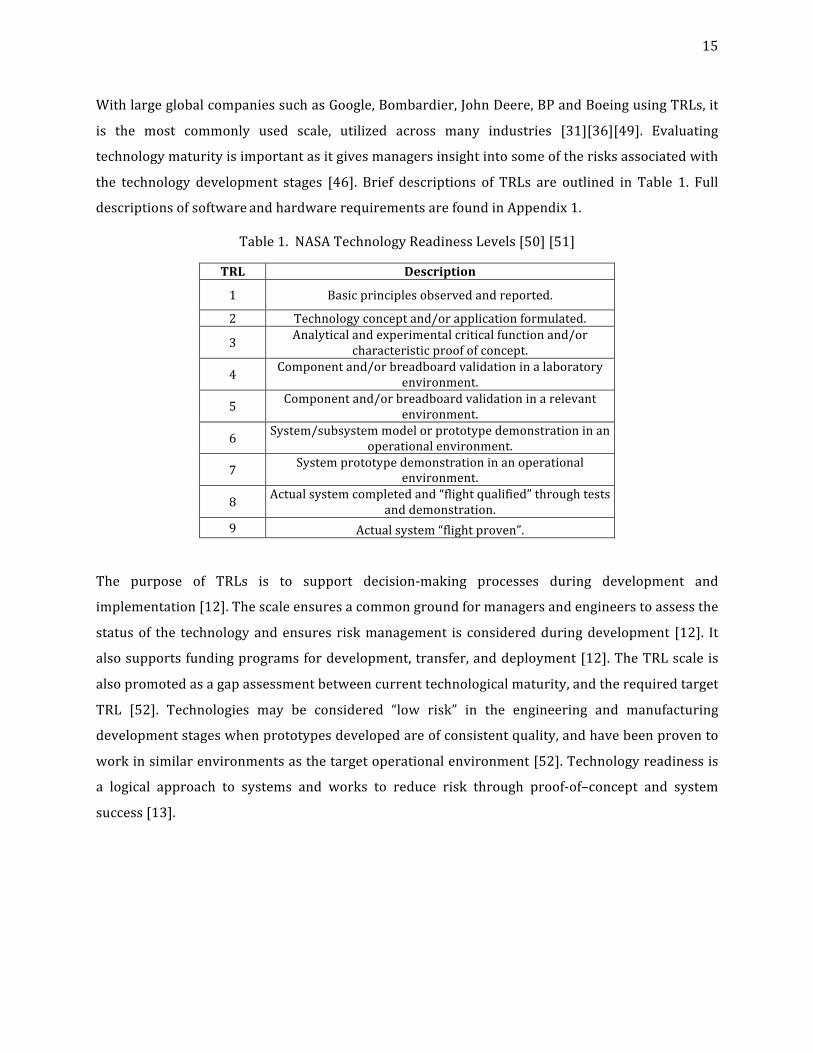
the technology development stages [46]. Brief descriptions of TRLs are outlined in Table 1. Full
descriptionsofsoftwareandhardwarerequirementsarefoundinAppendix1.
Table1.NASATechnologyReadinessLevels[50][51]
TRL Description
1 Basicprinciplesobservedandreported.
2 Technologyconceptand/orapplicationformulated.
3 Analyticalandexperimentalcriticalfunctionand/orcharacteristicproofofconcept.
4 Componentand/orbreadboardvalidationinalaboratoryenvironment.
5 Componentand/orbreadboardvalidationinarelevantenvironment.
6 System/subsystemmodelorprototypedemonstrationinanoperationalenvironment.
7 Systemprototypedemonstrationinanoperationalenvironment.
8 Actualsystemcompletedand“flightqualified”throughtestsanddemonstration.
9 Actualsystem“flightproven”.
The purpose of TRLs is to support decision-making processes during development and
implementation[12].Thescaleensuresacommongroundformanagersandengineerstoassessthe
statusof the technologyandensures riskmanagement is consideredduringdevelopment [12]. It
alsosupportsfundingprogramsfordevelopment,transfer,anddeployment[12].TheTRLscaleis
alsopromotedasagapassessmentbetweencurrenttechnologicalmaturity,andtherequiredtarget
TRL [52]. Technologies may be considered “low risk” in the engineering and manufacturing
developmentstageswhenprototypesdevelopedareofconsistentquality,andhavebeenprovento
workinsimilarenvironmentsasthetargetoperationalenvironment[52].Technologyreadinessis
a logical approach to systems and works to reduce risk through proof-of–concept and system
success[13].
16
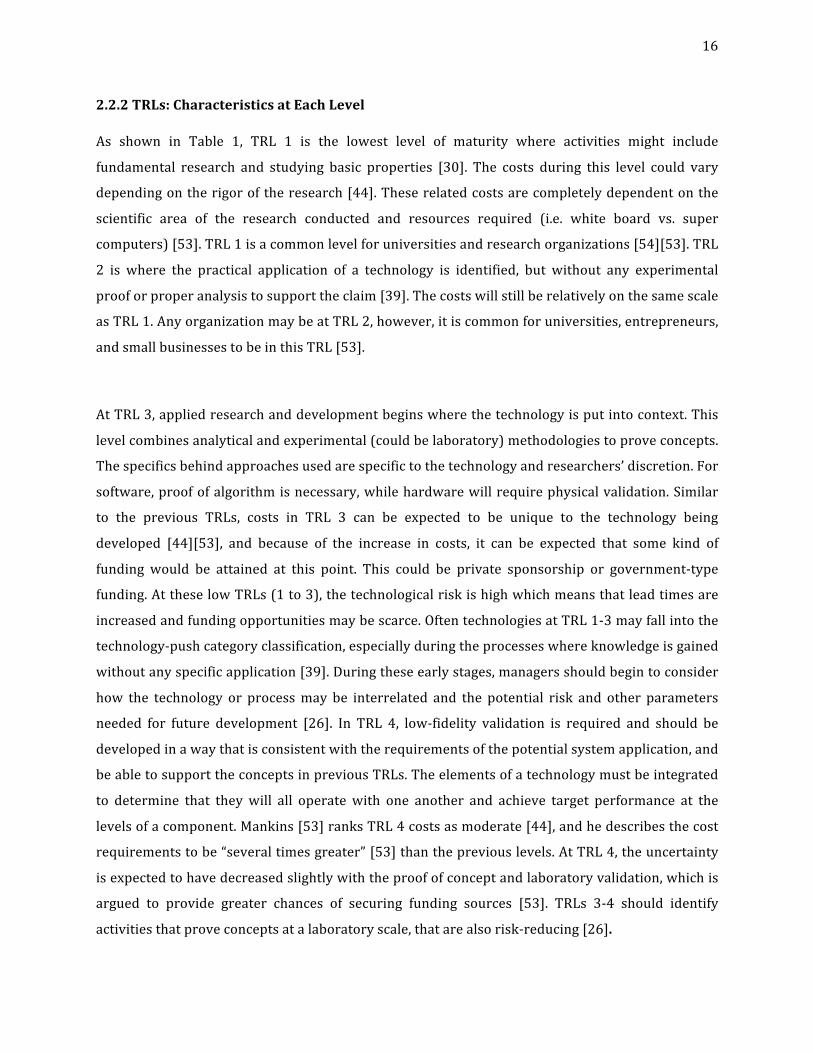
2.2.2TRLs:CharacteristicsatEachLevel
As shown in Table 1, TRL 1 is the lowest level of maturity where activities might include
fundamental research and studying basic properties [30]. The costs during this level could vary
dependingontherigoroftheresearch[44].Theserelatedcostsarecompletelydependentonthe
scientific area of the research conducted and resources required (i.e. white board vs. super
computers)[53].TRL1isacommonlevelforuniversitiesandresearchorganizations[54][53].TRL
2 is where the practical application of a technology is identified, but without any experimental
prooforproperanalysistosupporttheclaim[39].Thecostswillstillberelativelyonthesamescale
asTRL1.AnyorganizationmaybeatTRL2,however,itiscommonforuniversities,entrepreneurs,
andsmallbusinessestobeinthisTRL[53].
AtTRL3,appliedresearchanddevelopmentbeginswherethetechnologyisputintocontext.This
levelcombinesanalyticalandexperimental(couldbelaboratory)methodologiestoproveconcepts.
Thespecificsbehindapproachesusedarespecifictothetechnologyandresearchers’discretion.For
software,proofofalgorithmisnecessary,whilehardwarewillrequirephysicalvalidation.Similar
to the previous TRLs, costs in TRL 3 can be expected to be unique to the technology being
developed [44][53], and because of the increase in costs, it can be expected that some kind of
funding would be attained at this point. This could be private sponsorship or government-type
funding.AttheselowTRLs(1to3),thetechnologicalriskishighwhichmeansthatleadtimesare
increasedandfundingopportunitiesmaybescarce.OftentechnologiesatTRL1-3mayfallintothe
technology-pushcategoryclassification,especiallyduringtheprocesseswhereknowledgeisgained
withoutanyspecificapplication[39].Duringtheseearlystages,managersshouldbegintoconsider
how the technology or processmay be interrelated and the potential risk and other parameters
needed for future development [26]. In TRL 4, low-fidelity validation is required and should be
developedinawaythatisconsistentwiththerequirementsofthepotentialsystemapplication,and
beabletosupporttheconceptsinpreviousTRLs.Theelementsofatechnologymustbeintegrated
to determine that theywill all operate with one another and achieve target performance at the
levelsofacomponent.Mankins[53]ranksTRL4costsasmoderate[44],andhedescribesthecost
requirementstobe“severaltimesgreater”[53]thanthepreviouslevels.AtTRL4,theuncertainty
isexpectedtohavedecreasedslightlywiththeproofofconceptandlaboratoryvalidation,whichis
argued to provide greater chances of securing funding sources [53]. TRLs 3-4 should identify
activitiesthatproveconceptsatalaboratoryscale,thatarealsorisk-reducing[26].
17
TRL 5 requires that elements of a technology be integrated into a component, sub-system or
system-level.Thismaymeanthatmoretechnologiescouldbe involved inthedemonstration.The
fidelityofthecomponenttestedinthislevelincreasesgreatly.CostsforR&DincurredinTRL5are
describedasmoderatetohigh[44],wheretheyaretwo(ormore)timesgreaterthanthatinTRL4
[44].TheactivitiescompletedinthisTRLaremostlikelydonebyR&Dorganizationswithaccessto
corporate laboratories. Therefore, it is expected that funding required increases due to these
increasedcosts[55].AtTRL6,theprototypesystemistestedinarelevantoperationalenvironment
andprovensuccessful.At thispoint,maturation isdrivenby instillingconfidence inmanagement
(inthetechnology’sfuturedeployment),ratherthantheR&D.Demonstrationmaybeofthesystem
applicationandanyothertechnologiesthatcouldbeintegrated.CostsinTRL6areexpectedtobe
highdue to intensive demonstrations of the technology [44]. Almost always, there is a source of
fundingwhetherfromthegovernmentorindustry.Pilot-scaletestingactivitiesinTRLs5-6address
risksandexposefurtherinformationabouttheconcept,andfurtherreducethem[26].Thecostsare
describedtobe“twoormoretimes”lessthantheinvestmentrequiredinTRL7[55].
LevelsbeyondTRL6aremajormaturationsteps.InTRL7,theprototypeshouldbecloseto,orat
the operational scale necessary, with the demonstrations occurring in the relevant operational
environments[44].Thepurposeofthislevelistoensuresystemengineering,aswellastodevelop
management confidence in concepts related to the market. Costs associated with TRL 7 are
describedas“veryhigh”[44].Dependingonthescaleandfidelityofthesystem,thiscouldbealarge
amount of the ultimate system cost, thus would always require formal sponsorship. TRL 8
representstheendofrealsystemdevelopmentformostelements[55].Thislevelmayincludenew
technologiesbeingintegratedintothesystem.CostsinTRL8arespecifictotherequirementsofthe
systemandareclassifiedas“veryhigh”withthemagnitudeofcostsbeing5-10timesgreater(this
isbecauseoffull-scalesystemdevelopment)[44]thanallthepreviousTRLscombined,andagain,
wouldexpectformalfunding.TRL9isthefinallevelwherethesystemisdeployed,andthefixingof
systembugsandglitchesbegins.AtTRLs7-9,researchersandmanagersshouldbeabletoassess
customer acceptance and real-world impact as the new product is introduced (or about to be
introduced) intothemarket[26].Thisalsoassumesthatcustomers’acceptanceofthetechnology
willbepositive,therefore,itisimportantthatthebusinesscaseisreviewedduringthistime[26].
18
It is important to note that reducing risk across TRLs is not done linearly in terms of cost [56].
Mankins[53]notedthatthecosttoincreasefromTRL5toTRL6ismorethan4timesthecostsof
the previous levels, and progressing to TRL 7 comes with even greater costs. He refers to
progression past TRL 6 as “the valley of death” [53][56] and discusses the struggle between
scientistsandmanagers.Withanynewtechnology,reducingriskisapriorityformanagerssothat
projectbudget andproject schedules arenot affected,while the scientists justwant tomaximize
theiradvancesanddiscoveries[56].MoreonthiswillbediscussedinChapter3.
2.2.2TRLAssessmentMethodologies
A technology readiness assessment (TRA) is the process of assessing the maturity level of a
technology [31]. This process relies on information during the technology development stages.
However, theU.SGovernmentAccountabilityOffice(GOA)suggests thatperformingaTRAbefore
developmentbeginsprovidesvaluableinformationformanagement[31].Mankins[16]statesthat
animportantpointduringdevelopmentiswhenmanagementmustdecideonwhethertechnologies
neededaspartofasystemhaveallcollectivelyreachedthetargetmaturity,risk,andperformance
levelforprogress[16].TheassessmentofTRLscanbeconductedattimesthatmanagementdeems
necessary,asaTRAneedstobespecificinthecontextofthetechnologyandtheaudiencethatwill
useit[31].TheabilitytoconductathoroughTRAwillultimatelydependontheavailabilityofdata,
reports,andaccuracyofitall[31].Inthecaseofnewtechnologydevelopments,scopeisnotalways
availableorunderstood[31].
Because theTRLscalemay lackobjectivityandrely toomuchon tacitknowledge,somematurity
assessmentmodelsandmethodshavebeendevelopedtotacklethisissue[34].Thesemodelshave
notonlybeenusedtoassessmaturity,buttoalsoassessriskssomanagementcanbetteranticipate
theminlaterstages[44][16].
19
Mankins [44] recommends that a general model to assess a technology should include five
categories:
1. Abasicresearchphasewheregoalsandtargetsareidentified.
2. An applied or focused research phase where a specific technology is considered for specific
applications.
3. Technologydevelopmentandprototypingforeveryidentifiedapplication(priortofullsystem
development).
4. Fullsystemscale-upandtesting.
5. Technologylaunchandoperations.
Mankinsalsosuggeststhatanassessmentshouldpossessthefollowingcharacteristics[16]:
• Clarity: cleardecision-making criteria todetermine risksand readiness.Criteria shouldallow
forindependentevaluationandverification.
• Transparency: technology risk assessment should be formal and consensus based, where all
participantseasilyunderstandtheassessmentprocessesandresults.
• Crispness:decisionsmadeduringtheassessmentshouldbetimelyanduptoprogrambudget
planningrequirements.
• Usefulinprogramadvocacy:processesusedduringtheassessmentshouldhavethebasicsfor
advocacyofaresult.
The model Mankins [16] introduces is an integrated technology readiness and risk assessment
framework (TRRA). This is a quantitative approach [34].He argues thatTRLs fail to address the
difficulty inR&Dprogress,andtheeffortrequiredtomovefromaTRLtothenextwithinasetof
criteriaorrequirements. ThismodelbuildsonanotherpaperbyMankins[57]anddescribes the
“research and development degree of difficulty” (R&D3) as a measure of the difficulty that is
expected during the process of maturation for a technology [55]. The purpose of this is to
supplementTRLmetrics[57].Itdeterminestheprobabilityofsuccess(orfailure)foragivensetof
technologyrequirementsatdifferentstagesofdevelopment [16].TheR&D3consistsof five levels
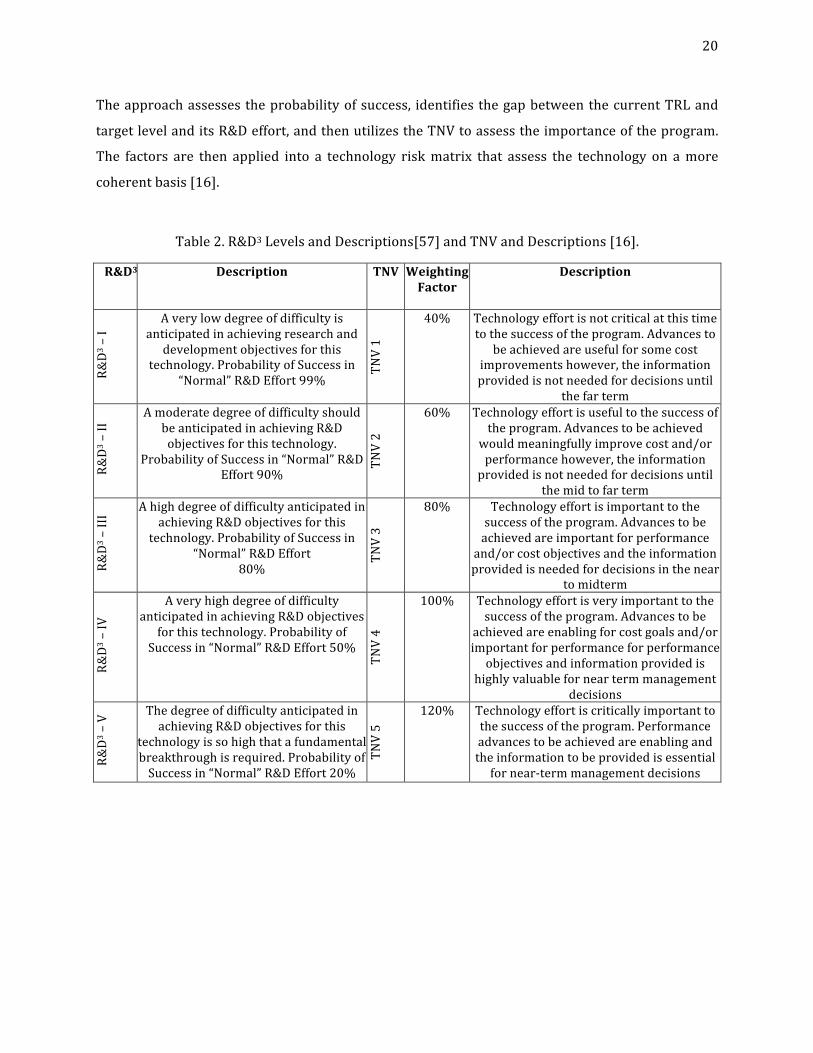
thataredescribedinTable2.The integratedassessmentmethoddevelopedincorporatesanother
dimension, “the technologyneedvalue” (TNV) [16].TheTNV isaweighting factor that isapplied
relative to the assessment of the importance of technological development (shown in Table 2)
[16][55].
20
Theapproachassessestheprobabilityofsuccess, identifiesthegapbetweenthecurrentTRLand
targetlevelanditsR&Deffort,andthenutilizestheTNVtoassesstheimportanceoftheprogram.
The factors are then applied into a technology riskmatrix that assess the technology on amore
coherentbasis[16].
Table2.R&D3LevelsandDescriptions[57]andTNVandDescriptions[16].
R&D3 Description TNV WeightingFactor
Description
R&D3–I
Averylowdegreeofdifficultyisanticipatedinachievingresearchanddevelopmentobjectivesforthis
technology.ProbabilityofSuccessin“Normal”R&DEffort99%
TNV1
40% Technologyeffortisnotcriticalatthistimetothesuccessoftheprogram.Advancesto
beachievedareusefulforsomecostimprovementshowever,theinformationprovidedisnotneededfordecisionsuntil
thefarterm
R&D3–II Amoderatedegreeofdifficultyshould
beanticipatedinachievingR&Dobjectivesforthistechnology.
ProbabilityofSuccessin“Normal”R&DEffort90%
TNV2
60% Technologyeffortisusefultothesuccessoftheprogram.Advancestobeachieved
wouldmeaningfullyimprovecostand/orperformancehowever,theinformationprovidedisnotneededfordecisionsuntil
themidtofarterm
R&D3–III Ahighdegreeofdifficultyanticipatedin
achievingR&Dobjectivesforthistechnology.ProbabilityofSuccessin
“Normal”R&DEffort80%
TNV3
80% Technologyeffortisimportanttothesuccessoftheprogram.Advancestobeachievedareimportantforperformanceand/orcostobjectivesandtheinformationprovidedisneededfordecisionsinthenear
tomidterm
R&D3–IV
AveryhighdegreeofdifficultyanticipatedinachievingR&Dobjectives
forthistechnology.ProbabilityofSuccessin“Normal”R&DEffort50%
TNV4
100% Technologyeffortisveryimportanttothesuccessoftheprogram.Advancestobe
achievedareenablingforcostgoalsand/orimportantforperformanceforperformanceobjectivesandinformationprovidedis
highlyvaluableforneartermmanagementdecisions
R&D3–V Thedegreeofdifficultyanticipatedin
achievingR&Dobjectivesforthistechnologyissohighthatafundamentalbreakthroughisrequired.ProbabilityofSuccessin“Normal”R&DEffort20%
TNV5
120% Technologyeffortiscriticallyimportanttothesuccessoftheprogram.Performanceadvancestobeachievedareenablingandtheinformationtobeprovidedisessentialfornear-termmanagementdecisions

21
Azizianetal.[34]discusstheTRAprocessusedbytheDoDfordefenseacquisitionprograms.Itisa
six-stepprocessthat isshowninthe figurebelow.Theprocess isstartedbysettingaschedule in
order for importantmilestones tobemet [34].Theassessment thencontinuesby identifying the
criticalelements8(CTE)acrossaWorkBreakdownStructure,dataisthencollectedandpresented
toanaudience(expertsintechnology)thatisindependentoftheteam[35].Reviewersthenassess
thematurityofCTEsagainstthemetricsthathavebeendecidedonandthenpassedupforapproval
bythechainofcommand[34][35].Ifnotapproved,then,theymayconductanotherTRA[35].
InthecasewhenacomponentisnotatthesameTRLastherestofthetechnologies,theDoDmay
doanyof the following [35]:restructure theprogramso thatonlymature technologiesareused;
delay the program in order to mature the technology; change the program requirements; not
initiatetheprogramandconsideranothersolution.
Figure.6DoDTRAProcess[Adaptedfrom[34]]
8 (CTE) is defined as an element that the system being acquired depends on in order to meet
operationalrequirements[64].
SetSchedule
IdentifyCriticalElements
CoordinateCriticalElements
AssessCriticalElements:PrepareTRA
Coordinate&SubmitTRA
OversightReview
DataCollection
22
TheU.SGovernmentAccountabilityOffice(GOA)drewuponthetechniquesandpracticesatNASA
and the DoD and produced their own TRA methodology that is often called the “best practice”
[58][31].Thepublished150pageguideoutlinesthesixstepstoimplementingthismethodindetail
[31].Thesestepsaresummarized inAppendix1.Anotherapproach toconductingTRAconsiders
moreholisticmethodstoredrawtheboundariesoftheproblemsandexaminestherateatwhicha
technology can mature, and larger issues related to technology-life cycles9, specifically its
obsolescence.Formoreinformationsee[59].
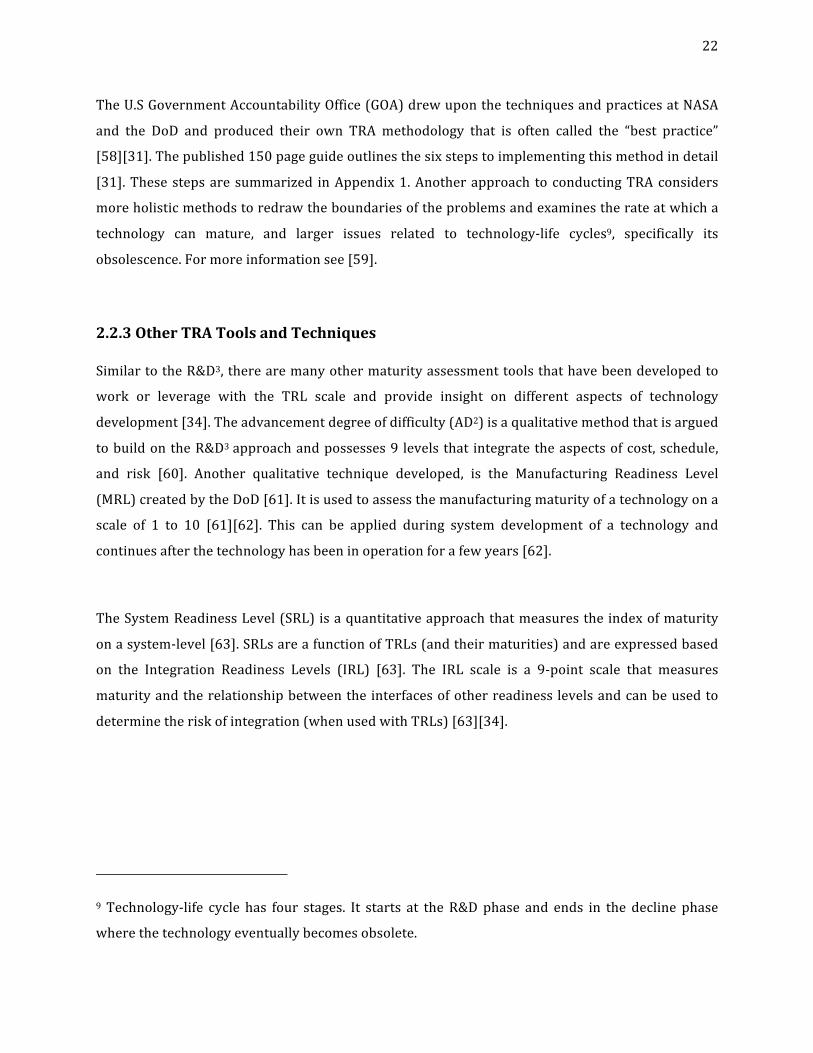
2.2.3OtherTRAToolsandTechniques
SimilartotheR&D3,therearemanyothermaturityassessmenttoolsthathavebeendevelopedto
work or leverage with the TRL scale and provide insight on different aspects of technology
development[34].Theadvancementdegreeofdifficulty(AD2)isaqualitativemethodthatisargued
tobuildontheR&D3approachandpossesses9 levels that integratetheaspectsofcost,schedule,
and risk [60]. Another qualitative technique developed, is the Manufacturing Readiness Level
(MRL)createdbytheDoD[61].Itisusedtoassessthemanufacturingmaturityofatechnologyona
scale of 1 to 10 [61][62]. This can be applied during system development of a technology and
continuesafterthetechnologyhasbeeninoperationforafewyears[62].
TheSystemReadinessLevel(SRL)isaquantitativeapproachthatmeasurestheindexofmaturity
onasystem-level[63].SRLsareafunctionofTRLs(andtheirmaturities)andareexpressedbased
on the Integration Readiness Levels (IRL) [63]. The IRL scale is a 9-point scale that measures
maturityandtherelationshipbetweentheinterfacesofotherreadiness levelsandcanbeusedto
determinetheriskofintegration(whenusedwithTRLs)[63][34].
9 Technology-life cycle has four stages. It starts at theR&Dphase and ends in the decline phase
wherethetechnologyeventuallybecomesobsolete.
23
Automated tools to measure maturity are also available, where they quantitatively assess the
maturitybasedontheinformationfedbytheuser[34].Themostwell-knownbeingtheTechnology
ReadinessLevelCalculator[58](andMRLcalculator).ThisisaMicrosoftExceltoolthatcalculates
the TRL level as an output at a specific time [58]. The calculator provides no information about
risksor theprobabilityofsuccessbutcangivemanagementageneral ideaabout therisk(as the
assumptionisthehighertheTRL,thelowertheoverallrisk[39]).
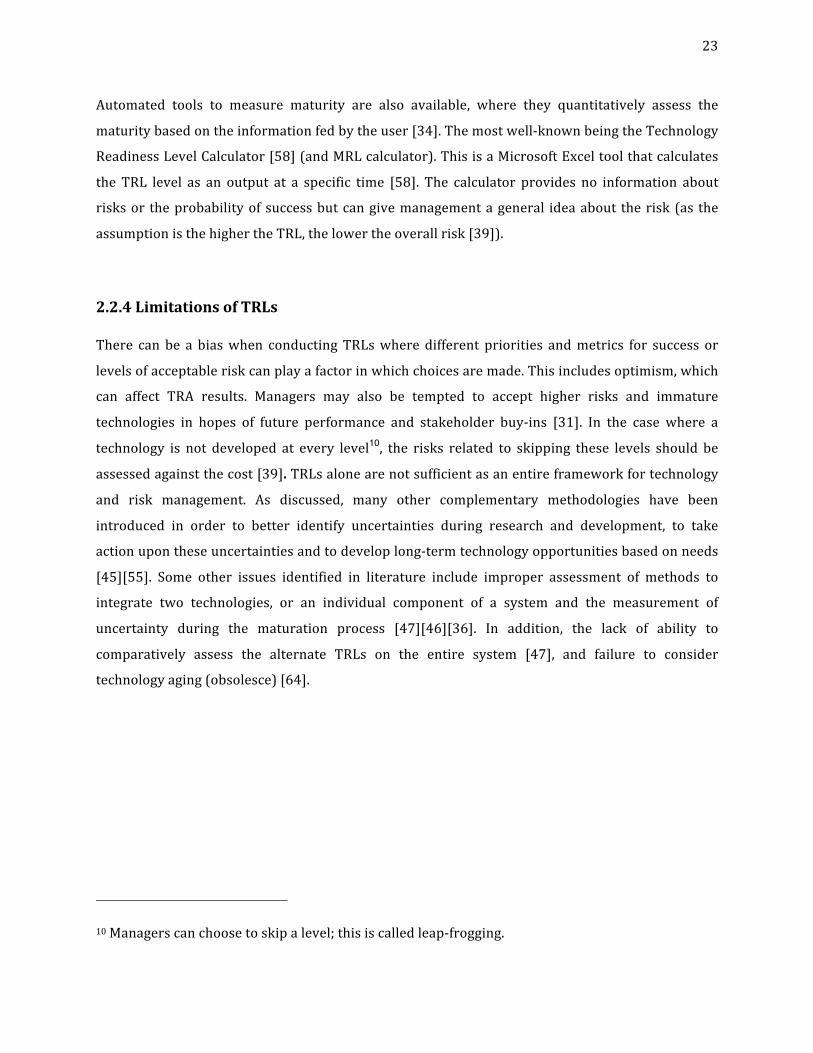
2.2.4LimitationsofTRLs
There can be a biaswhen conductingTRLswhere different priorities andmetrics for success or
levelsofacceptableriskcanplayafactorinwhichchoicesaremade.Thisincludesoptimism,which
can affect TRA results. Managers may also be tempted to accept higher risks and immature
technologies in hopes of future performance and stakeholder buy-ins [31]. In the case where a
technology is not developed at every level10, the risks related to skipping these levels should be
assessedagainstthecost[39].TRLsalonearenotsufficientasanentireframeworkfortechnology
and risk management. As discussed, many other complementary methodologies have been
introduced in order to better identify uncertainties during research and development, to take
actionupontheseuncertaintiesandtodeveloplong-termtechnologyopportunitiesbasedonneeds
[45][55]. Some other issues identified in literature include improper assessment of methods to
integrate two technologies, or an individual component of a system and the measurement of
uncertainty during the maturation process [47][46][36]. In addition, the lack of ability to
comparatively assess the alternate TRLs on the entire system [47], and failure to consider
technologyaging(obsolesce)[64].
10Managerscanchoosetoskipalevel;thisiscalledleap-frogging.
24
Finally, a paper published in 2015 by Olechowski et al. [36] identified amajor challenge as the
failuretoalignTRLswithtechnologydevelopmentstage-gates.Theyacknowledgethefactthatthe
aligningispracticedinindustry;however,arguethattherehasbeenlimiteddiscussionaboutthisin
theacademicworld.Theyarguethatthelackofpropermappingdoneinindustryandprocessesof
determining the minimum acceptable TRLs is related to the lack of understanding of the
consequencesofmissedmilestonesandreachingtargetTRLs11.
2.3TechnologyRiskManagement
2.3.1RisksinR&D&TechnologyDevelopment
There is a significant amountof risk that canbeexpectedduringanew technologydevelopment
project[27].ThereisalargeamountofliteraturethatidentifiescommonrisksassociatedwithR&D
andhigh-technologyprojects.However,thereisaweaknessinaligningtheserisksalongthestages
of development for a technology project and identifying trends of how one risk might affect
another.Thissectionhighlightsthemajortypesandcategoriesofrisksonagenerallevel.Chapter3
willapplythetopicssummarizedinthissectionanddiscussitinarelevantcontextthatbuildson
the framework inamanner thatcanbemappedoutalong technologystagesofdevelopmentand
generalcorrelationsofhowrisksmayberelated.Appendix1listsexamplesofpotentialrisksthat
mayariseduringdevelopmentasoutlinedby[65].
Thereisaninherentdifferencebetweenriskanduncertainty.Risksaredescribedasthedegreeof
whichanuncertaintyandlossmayoccurinanevent[32].Thereforeriskisaquantifieduncertainty
andoutcome[66].R&Dprojectsarelabeledas“risky”iftheprobabilityofabadoutcomeishigh,the
ability to control the risks within time and resource constraints is difficult, and if the potential
impact of the consequences is substantial [65]. The high uncertainty in R&D leads to high risks,
which may lead to project failure. Improving R&D probability of success requires managers to
controlrisksduringallstagesoftheproject[5].
11GoogleandJohnDeereweretheexamplesdiscussed.
25
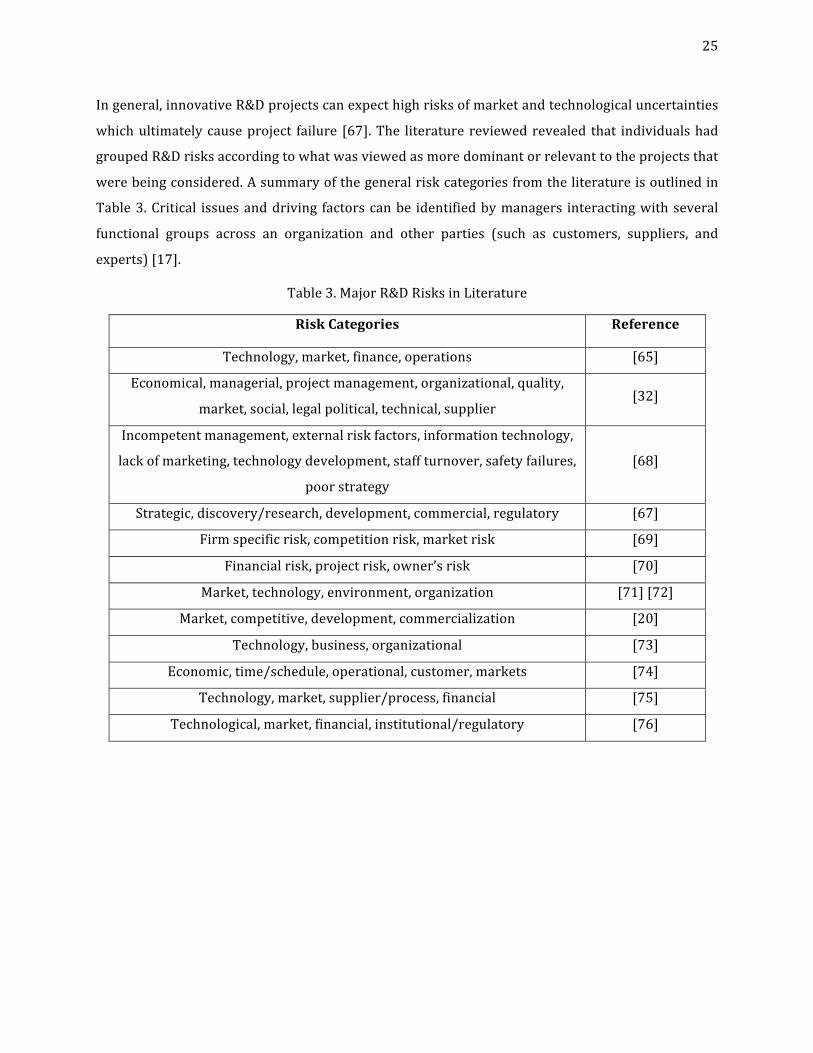
Ingeneral,innovativeR&Dprojectscanexpecthighrisksofmarketandtechnologicaluncertainties
whichultimatelycauseproject failure [67].The literaturereviewedrevealed that individualshad
groupedR&Drisksaccordingtowhatwasviewedasmoredominantorrelevanttotheprojectsthat
werebeingconsidered.Asummaryofthegeneralriskcategoriesfromtheliteratureisoutlinedin
Table3.Critical issuesanddriving factorscanbe identifiedbymanagers interactingwithseveral
functional groups across an organization and other parties (such as customers, suppliers, and
experts)[17].
Table3.MajorR&DRisksinLiterature
RiskCategories Reference
Technology,market,finance,operations [65]
Economical,managerial,projectmanagement,organizational,quality,
market,social,legalpolitical,technical,supplier[32]
Incompetentmanagement,externalriskfactors,informationtechnology,
lackofmarketing,technologydevelopment,staffturnover,safetyfailures,
poorstrategy
[68]
Strategic,discovery/research,development,commercial,regulatory [67]
Firmspecificrisk,competitionrisk,marketrisk [69]
Financialrisk,projectrisk,owner’srisk [70]
Market,technology,environment,organization [71][72]
Market,competitive,development,commercialization [20]
Technology,business,organizational [73]
Economic,time/schedule,operational,customer,markets [74]
Technology,market,supplier/process,financial [75]
Technological,market,financial,institutional/regulatory [76]
26
Technologyriskscanbedescribedasthoserelatedtodesign,platformdevelopment,manufacturing
technology,IP[65],andtechnologylife-cycles[77],whiletechnicalrisksaredefinedasthetechnical
issues that comeupwithnew technologies (suchasglitches) [78].Otherexamplesof technology
riskelements includenotreducingthetechnologytopracticeorfailuretodemonstratefeasibility
[78],ortheabilitytoremainfeasibleleadingtobecomingobsolete[69].Technologyandtechnical
risksareimportantduringtheearlydevelopmentstagesofatechnologyastheyhaveaninfluence
onmilestones and feasibility. ThoseR&D firms that are able topossess technologieswithhigher
capabilitiesgenerallytendtohaveinvestorsthatlookforqualitiessuchasafirm’sabilitytomeet
technologychallenges[24].
Technicaluncertaintiesmaycreatepressureonmanagerstoinvestinordertolowertherisk[79].
Thelogicbehindthisisthatdelayinginvestment(i.e.actionsanddecisionstomitigatetheserisks)
may cause exposure to an increase in competition [79] and delayed market entry
(commercialization) could result in significant failure, as competition that possesses the right
resources may act quicker and enter the market (competitive risk) [69]. However, aggressively
enteringamarket tooearlymayposemanychallenges suchas large increases in costdue to the
infrastructure needed [79]. Another risk could be competition’s response to the new technology
launch, as their actions (releasing similar or better products) could destroy a firm’s competitive
advantage [69]. These competitive risks that could arise are directly related to actions by
competitorswhichcancausevaryinglevelsoflossesinprojectopportunities[69].
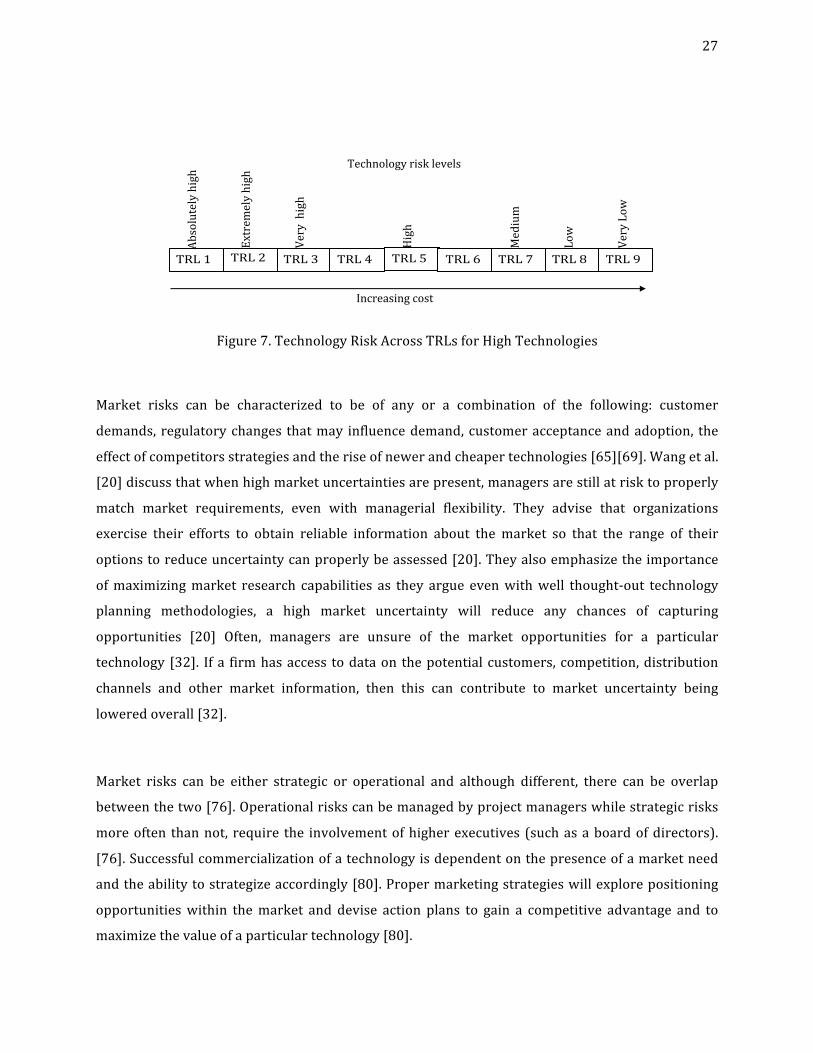
Manufacturingtechnologyrisksarealsoimportant,forexample,properscale-up(andthepotential
forscale-up)[65]isnecessarytoachievesuccessinlaterstages[65].Figure7illustratesthegeneral
trend for technology risk12 as technologiesmature acrossTRLs, as suggestedbyBatkovsky et al.
[12]. The figure depicts an increase in investment in funding requirements as higher TRLs are
reached.TheactualgrowthtrendasTRLsincrease(i.e.linear,exponential,etc.,)isnotreflectedin
Figure7.
12 The paper [12] only showed a table that outlined the relative qualitative magnitudes of risk
acrosstheTRLs.
27
Figure7.TechnologyRiskAcrossTRLsforHighTechnologies
Market risks can be characterized to be of any or a combination of the following: customer
demands, regulatorychanges thatmay influencedemand,customeracceptanceandadoption, the
effectofcompetitorsstrategiesandtheriseofnewerandcheapertechnologies[65][69].Wangetal.
[20]discussthatwhenhighmarketuncertaintiesarepresent,managersarestillatrisktoproperly
match market requirements, even with managerial flexibility. They advise that organizations
exercise their efforts to obtain reliable information about the market so that the range of their
optionstoreduceuncertaintycanproperlybeassessed[20].Theyalsoemphasizetheimportance
ofmaximizingmarket research capabilities as they argue evenwithwell thought-out technology
planning methodologies, a high market uncertainty will reduce any chances of capturing
opportunities [20] Often, managers are unsure of the market opportunities for a particular
technology [32]. Ifa firmhasaccess todataon thepotentialcustomers, competition,distribution
channels and other market information, then this can contribute to market uncertainty being
loweredoverall[32].
Market risks can be either strategic or operational and although different, there can be overlap
betweenthetwo[76].Operationalriskscanbemanagedbyprojectmanagerswhilestrategicrisks
moreoften thannot, require the involvementofhigherexecutives (suchasaboardofdirectors).
[76].Successfulcommercializationofatechnologyisdependentonthepresenceofamarketneed
andtheabilitytostrategizeaccordingly[80].Propermarketingstrategieswillexplorepositioning
opportunitieswithin themarket and devise action plans to gain a competitive advantage and to
maximizethevalueofaparticulartechnology[80].
TRL1 TRL3TRL2
TRL4 TRL5
TRL6 TRL7 TRL8 TRL9
Increasingcost
Absolutelyhigh
Extreme
lyhig
h
Veryhigh
High
Mediu
m
Low
VeryLow
Technologyrisklevels
28
Thiscalls forsomeonewithmarketingexpertise thatwouldbeable toconduct thisallwithin the
organizational (internal) and external constraints [80]. Formulation of marketing strategies for
early stage technology projects is an important milestone [80]. The concepts behind marketing
which strategies to select and when are outside the scope of this thesis. However, they are
recognizedasanimportantaspectofdevelopmentthatshouldbestudiedandconsidered.
Financeorfinancialrisks13canrefertotherisksassociatedwiththelimitedfinancingavailablefor
development in a project [69][76] and the challenges associated with obtaining funding for a
project[70].Thisisanimportantcategoryofrisk,astheavailabilityoffundingiscriticalincapital
intensive projects [65]. Scale-up costs of technology, time to develop, and human resource
additionstoanR&Dteamcanallbeexamplesofdevelopmentalrisksthatcancausefinancialrisks
to increase [17]. Technology viability, pricing sensitivities, inadequate investments, low-profit
marginsareexamplesoffinancialrisks[65].
Organizational risks can be firm-specific risks, related to internal organization factors or those
relatedtoR&Dteams’relationshipswiththirdparties[65].Regardlessofthetechnological,market
orfinancialopportunities,ifafirmisunabletoactuallyputoutaproductintothemarket(froma
resource point of view), then, they possess high organizational risks. Unavailability of resources
andmissedmilestonesareimportantrisks[68].Thesecangenerallybeattributedtoweaknessesin
management, structure of the organization, stakeholders [81], and failure of internal parties to
cooperate[69].R&Dmanagersmustalsofindabalancebetweenshort–termandlong-termproject
goals so that allocationof resources canbemanagedaccordingly, as theyareoftenan important
sourceofuncertainty[17].
13FinancialrisksarenotwidelydiscussedforR&Dandtechnologyprojects. Ibelievethatbecause
mostoftheliteratureisabouttheimportanceofobtainingcapital investments(andvaluingthese
projects), thus, its importance is inferred from literature that exposes the role of financing in
researchanddevelopment.
29
Organizationsshouldestablishmetricsforprojectsthatallowforclearguidelinesthatoutlinewhen
abandoningorterminatingaprojectbecomesnecessary14[17]assometimesthepersonalfeelings
or pride towards a belief about the potential applicability of a technology increase the overall
project risk andmay become amajor factorwhy delaying or ignoring termination of a project15
(thisthenbecomesanissueoftechnology-push)[17].
Environmental risks can be related to several facets such as political or social factors, public
interestandacceptance,andpublicacceptabilityoftheproduct[71].Regulatoryriskssuchaslegal,
industrialpolicies,andsourcingrequirementscanallbeclassifiedasenvironmental[76].
Theneed for competentmanagers is crucial inorder toavoidcosts,delaysoroverall failureofa
project [17], as it challenging for organizations to identify underlying latent causes of the
uncertainties [20]. R&D managers must define and address critical risks as soon as they are
identified [17]. Cooper and Kleinschmidt [21] argued that only having a “formal development
process” had no correlation with performance results. They state that many companies found
importanttaskssuchasmarketanalysisandcustomerresearchwerenotdoneordonetoolatein
thedevelopmentprocess.Theyadviseonfocusingonthequalityandnatureoftheseprocessesin
ordertobuildbestpractices,asthisiswhatwillreallydriveperformanceandpreventcompanies
fromfalselythinkingtheyareprogressing16[21].JanneyandDess[82]acknowledgethecomplexity
of risks and uncertainties in R&D projects. They believe the best approach for managers is to
identifyaprimaryuncertainty,trytocontrolitandexaminewhetheritaffectsotheruncertainties.
They argue that if different aspects of uncertainties are considered, the greater the chance is of
observingpotentialbenefits[82].
14Uponterminationreallocationofresourcesisnotonlyrequired,butalsoefficientfortheoverall
performanceoftheorganization.Noneedtotieupresourceswheretheycanbeusedelsewhere.
15Other factorscouldalsobereactions tocompetitorsorcustomersor technologyadvancements
[17].
16Asopposed to employees thinking they improvingprojectperformance solelybasedon “going
throughthemotions”oftheseassessmentsandprocesses.
30
2.3.2RiskManagementinR&D
The literature review conducted on risk assessment methodologies is a summary of the most
commonly used tools. There are qualitative andquantitativemethods that are used in industry.
Thepurposeofthisresearchisnottofocusonriskmanagementmethodsandtools.However,itis
important to discuss the possible optionsmanagersmay choose to incorporate in their projects.
Thesediscussedmethodsdonotrepresentanexhaustivelist.
“Risk”isatermthatcanreflectopportunities(i.e.positiverisk)orthreats(i.e.negativerisk).The
mostcommonusageofthisterm,however,usuallyreferstothedownside[83].Anytimetheterm
“risk”willbeusedthroughoutthisthesis,itwillreflectnegativerisk.Riskmanagementreferstothe
processesthatfirmsutilizetounderstand,evaluate,andtakeappropriateactionstodealwithrisks,
where project failure is reduced and the probability of success increased [74]. Therefore, risk
managementisacriticalfactorforbusinesssuccessandisavitalpartoftheoverallmanagementof
aproject[68].Thesubsectionswilloutlinetheimportantconstructsthatmakeupriskmanagement
thatcanbeapplied.
Thegeneralriskmanagementapplicationcanbesummarizedinafewsteps.Theseareidentifying
therisks,assessingthem,andfinally,applyingriskmanagementstrategiesthatcouldmitigateand
monitortherisks[74].
Riskidentificationisparticularlyimportantasitallowsmanagerstorecognizethecriticalrisksthat
mayprevent reachingproject goals [67].These critical risks canbe identified inmanyways that
may include, but not limited to, using the Delphi technique, scenario analysis, cause-and-effect
diagrams,fault-treeanalysis,interviews,surveys,questionnaires,aswellashistoricalandempirical
data[72][67][84].Identifyingcriticalriskscanbedividedintothreesteps:1)riskidentification,2)
riskanalysisand3)riskprioritization[67].
31
2.3.3RiskManagementTools&Techniques
Risks assessments are important as they rank and prioritize identified risks by estimating the
likelihood of occurrence, and severity of the consequence, either qualitatively, quantitatively or
semi-quantitatively[72].Therearemanyriskassessmentmethodsthatcanbeused.Failuremode
andeffectsanalysis(FMEA)isananalysistoolthatassessesforpossiblewaysfailurescouldoccur
andtheireffects[84].
Thecommonweakness in thesemethodologies (andmanyothers) is that they fail to identify the
correlation or relationships of different risk factors and compute their conditional probabilities
[72]. Sharma and Chanda [72] use the Bayesian Belief Network model (BBN) to establish
relationshipsbetweenriskfactorsinanR&Dproject.TheBBNapproachbeginsbyidentifyingthe
risksusinganyofthepreviouslymentionedmethods,thenidentifiestherisktriggers(causes)17and
theconsequencesof therisk factors.Finally, theBBNcanbeconstructed[72].Theapproaches to
constructingtheBBNareoutsidethescopeofthisthesis,however,see[85]forafullexplanationon
riskassessmentsandtheuseofBBNs.TheBBN’sinterfaceallowsdecision-makerstocalculatethe
conditionalprobabilities and their correspondingeffectsondependent risk factors in theproject
[72].
Aprobabilityriskmatrixcanbeused toqualitativelyassessrisks [86]. It isapopularandwidely
usedtoolasitsimpletounderstandandcanbecustomizedforriskcategoriesandlevelsthatreflect
management’sthresholdandtoleranceforrisk[87].Thematrixissimpletounderstandastherisks
areassessedwherethelikelihoodofoccurrenceandtheimpactoforconsequencearedetermined
based on predeterminedmetrics or scores [86]. Figure 8 is an example of a general probability
matrix.Amajordrawbackwiththeuseofprobabilityriskmatricesisthepotentialofinconsistent
assessmentsastheyarehighlysubjectivetoamanager(ororganization’s)aversiontorisk[87].
17 The authors identify risk triggers such as new technology, insufficient quality personnel, and
inexperiencedprojectleaders.Thesearecausesoftheactualriskfactors.
32
Figure8.3x3ProbabilityImpactMatrix
An arguably more comprehensive framework for evaluating business, organizational, and
technologyrisksforinnovativetechnologyprojectsistheRiskDiagnosingMethodology(RDM)that
wasstartedbyPhillipsElectronics[5].AstudybyKeizeret.aldiscussesUnilever’sadoptionofthis
methodology,whereemployeesunanimouslyagreedthattheRDMprocessesallowedthemtograsp
whatthecriticalriskswereandhowtohandlethembetterthantheirpreviousad-hoctechniques
[65].RDMisan8-stepprocessthatiscompletedwiththeexpertiseofriskfacilitatorsthathaveno
stakesintheprojectandcanprovideguidanceinanobjectivemanner[65].
In 1992, Kaplan and Norton developed the balanced scorecard method [88] that drives
management to connect their objectives to strategies, by prioritizing processes that are most
important [89]. A framework developed by Wang et al. [65] discusses that balanced scorecard
(BSC)isastrategictoolthatcanbeappliedtoR&Dprojectsforriskmanagementpurposes. They
proposethatBSCandqualityfunctiondeployment(QFD)beusedtocreateastreamlinedmethod
where managers can manage risks from a top-down approach. Risks are identified, assessed,
planned(mitigationplans)andcontrolled.FormoreinformationonHauser’sQFDandhowitwas
usedtoreducecycletimeofnewproductdevelopment,see[90].
Impact
Likelihood
Low Medium High
Low
Medium
High
33
2.4FinancialValuationMethods
2.4.1TraditionalValuationMethods
There isa largeamountof literatureavailable thatdiscussesvaluationmodelsandmethodsused
throughout the years. The two main approaches to value that have been used widely used to
forecastarethediscountedcashflow(DCF)andthenetpresentvalue(NPV)[91].
The biggest assumption associated with these methods is that the initial decisions made at the
beginning of the project are static and will not change [92][93]. These are now-or-never
approachestoinvestments[10]andtheydonottakeintoconsiderationmanagement’scapabilityto
strategizeduringprojectexecution,andability toactivelymanageaproject throughout itsentire
duration[92].Thecashflowsanddiscountratescarryahighamountofpotentialuncertainty,and
thedecision-making risk is high [94].Despite the limitationsof these approaches, the traditional
methodsshouldnotbescrappedastheyarestillnecessaryinputstoanoptions-basedapproachto
avaluation[6].
The benefits of these traditional valuation approaches are that they are fairly simple, widely
accepted,andareabletoreflectthemagnitudeoftheeconomicbenefits fromaninvestmentplan
[3][94]. DCF methods are derived from financial theory, however, Meyers argues that finance
theory and strategic planning have a large gap, which contributes to reasons behind their
shortcomings [95].Table4outlines theDCFassumptionsvs. therealitiesassummarizedbyMun
[7].

34
Table4.DCFAssumptionsvsDCFrealities[89]
DiscountedCashFlowAssumptions DiscountedCashFlowRealities
Decisionsdecidedup-frontandallcashflowsarestaticforthefuture
Uncertaintyandvariabilityinfutureoutcomes.Notalldecisionsaremadetodayassomemaybedeferredtothe
future,whenuncertaintybecomesresolved.
Projectsare“minifirms”,andinterchangeablewithwholefirms
Withtheinclusionofnetworkeffects,diversification,interdependencies,andsynergy,firmsareportfoliosof
projectsandtheirresultingcashflows.Sometimesprojectscannotbeevaluatedasstand-alonecashflows.
Allprojectsarepassivelymanagedoncetheylaunch
Projectsareusuallyactivelymanagedthroughprojectlifecycle,includingcheckpoints,decisionoptions,budgetconstraints,
etc.Futurefreecashflowstreamsare
deterministicandhighlypredictable
Itmaybedifficulttoestimatefuturecashflowsastheyareusuallystochasticandriskyinnature.
Projectdiscountrateusedistheopportunitycostofcapitalwhich
istheproportionaltonon-diversifiablerisk18
Therearemultiplesourcesofbusinessriskswithdifferentcharacteristics,andsomearediversifiableacrossprojectsor
time.
Allrisksarecompletelyaccountedforbythediscountrate.
Firmandprojectriskcanchangeduringthecourseofaproject.
AllfactorsthatcouldaffecttheoutcomeoftheprojectandvaluetotheinvestorsarereflectedintheDCFmodelthroughtheNPV
orIRR.
Becauseofprojectcomplexityandso-calledexternalities,itmaybedifficultorimpossibletoquantifyallfactorsintermsofincrementalcashflows.Distributed,unplannedoutcomes(e.g.,strategicvisionandentrepreneurialactivity)canbesignificant
andstrategicallyimportant.Unknown,intangible,or
immeasurablefactorsarevaluedatzero.
Manyoftheimportantbenefitsareintangibleassetsorqualitativestrategicpositions.
DCFmodelcanbepresentedbythefollowing[95]:
𝑃𝑉 = %&(()*)&
,-.( Where[95]:
PVisthepresentvalue
Ctistheincrementalcashflow
Tistheprojectlife
ristheexpectedrateofreturn
And,
NPV=PV–cashoutlayattime=0
18Non-diversifiableriskcanrefertoriskssuchasmarketorsystemicrisks.
35
Traditional NPV was initially established for stocks and bonds valuation, and assumes an
organizationholds realassetspassively [96].Thismethoddiscountsexpectedcash flowsand the
terminalvalueoftheprojectataspecificdiscountrate[97][8][10].Thechosendiscountrateusedis
a reflectionof theproject risks [97].Thisputsmanagersanddecision-makers inpassive rolesas
thisassumesthattheprojectwillplayoutasplannedandignoresthepossibilityoffuturechanges
intheproject[10][6][97].Becauseofthelackofmanagerialflexibility(whichisseentoaddvalueto
projects), it is seen that the traditional approach may actually undervalue a project [98][7],
especially forprojectsthatare longer,highlyuncertain,andpossesshigher interestrates,suchas
technologyandR&Dprojects[97][93].Theweightedaveragecostofcapital(WACC)isoftenused
as the discount rate as it is thought of as the opportunity cost of capital [99]. This, however, is
challenging for early R&D projects [99]. Managers involved in these types of projects require
methodologiesthatallowthemtojustifystrategiesfordevelopment[93]sinceR&Dprojectshave
differentphasesandshouldbeviewedasaseriesofdecisions,withvaryingrisksanduncertainties
[14]. The static NPV approach makes it seem like these qualities damage the investment
opportunity’s value19 [97]. Traditional DCF and NPV also assume that projects are independent,
whichisnotthecase.Thereareinherentinterdependenciesbetweenprojectsandtheseshouldbe
seenas links ina chainofprojects [97].Thesemethodsare suitable for short-termprojectswith
lowuncertainties,makingthesemethodslimitedforR&Denvironmentsthatarenaturallydynamic
andfluctuate[14][94].Thetraditionalvaluationmethodsmaybeadouble-edgedsword.Managers
maygiveupprojectswithnegativeNPVs[8]thathaveopportunitiestogrow,whiletheotherside
ofthisisthatmanagersmayendupmissingopportunitiesthatmaycomeupbecauseoftheinitial
positiveNPVthatwascalculated[9].
Another technique that is sometimesused is thepaybackperiod, and similar toDCF andNPV, it
lacks the ability to account for risks whichmay causemanagers to reject many long-term R&D
projects,as thismethodfavorsquickpayback[100].DCF,NPV,payback,andIRRarequantitative
valuationmethods.Aqualitativemethodthathasbeenusedisscorecardsthatguidemanagersto
shapetheirjudgmentsandstructurereasoning[1].Thismethodscoresprojectsqualitatively,such
ashowapplicableatechnologyisandranksthembasedontheirrespectivescores[101][3].
19Thisisnotalwaysthecaseastheoptiontodeferpartsoftheinvestmentcanbeconsidered[97].
36
Aweaknessofthisapproachisthatit isdifficulttojustifywhyascorewasgiven,andchallenging
formanagerstounderstandhowtoimprovethevalueofaproject[3].
2.4.2FinancialOptionsTheoryOverview
This section discusses general concepts that apply to the option theory models. Block [102]
identifiedthatthemostpopularvaluationapproachesincludedthebinomialmodel,Black-Scholes
model, and Monte-Carlo simulations [102]. The most popular models to solve options are the
binomialapproachandtheBlack-Scholes[103].Thebinomialmethodwasthemostfrequentlyused
asusersfoundittobesimplerwhencomparedtoothermethods,suchasMonte-Carlo[102].
Thevariablesinfinancialoptionsaretheunderlyingasset,volatility,exerciseprice,expirationdate,
interest rate and the dividends [104]. These variables are typically deterministic, except in real
options where these values are based on real assets and require more effort to define [104].
Volatility isan importantvariable inoptionpricingmodelsas it is theparameter that represents
uncertainty[104].Manyofthesevariablesarenotavailableforrealoptions,asparameterssuchas
timetomaturityortheexpiration,aredifficulttoestablishwhenmanagementhastheflexibilityto
makedecisionsthatalterthesevaluesduringtheproject[102].Theseoptiontheorieshaveabasis
on how discount rates are assigned depending on the levels of risk and uncertainty. This could
cause problems where the reliability of the valuation is questioned if there is no proper
documentation and justification [17]. Instead of varying the discount rate, factors that drive the
risksoftheNPVshouldbeidentifiedanddiscussed,andNPV(andrisk)rangesassessed[17].
Thesemethodsrelyheavilyonvolatilityvalues.Therelativevolatilityoftheoptionisnotconstant
anddependsonvariablessuchasthestockpriceandmaturity[105].Commonlyusedmethodsto
computevolatilityarenotapplicableforrealassets,andthereisanargumentthatthisvaluemaybe
manipulatedinordertoattainspecificdecisions[104].Managementmustensureanyassumptions
madeareonconservativegroundsfortheanalysistobepersuasive[104].Therearemanymethods
todeterminevolatility,however,thesemethodswillnotbediscussedastheyareoutsidethescope
ofthisthesis.Forfurtherreferenceondifferentmethodstocalculatevolatilitysee[7]and[106].
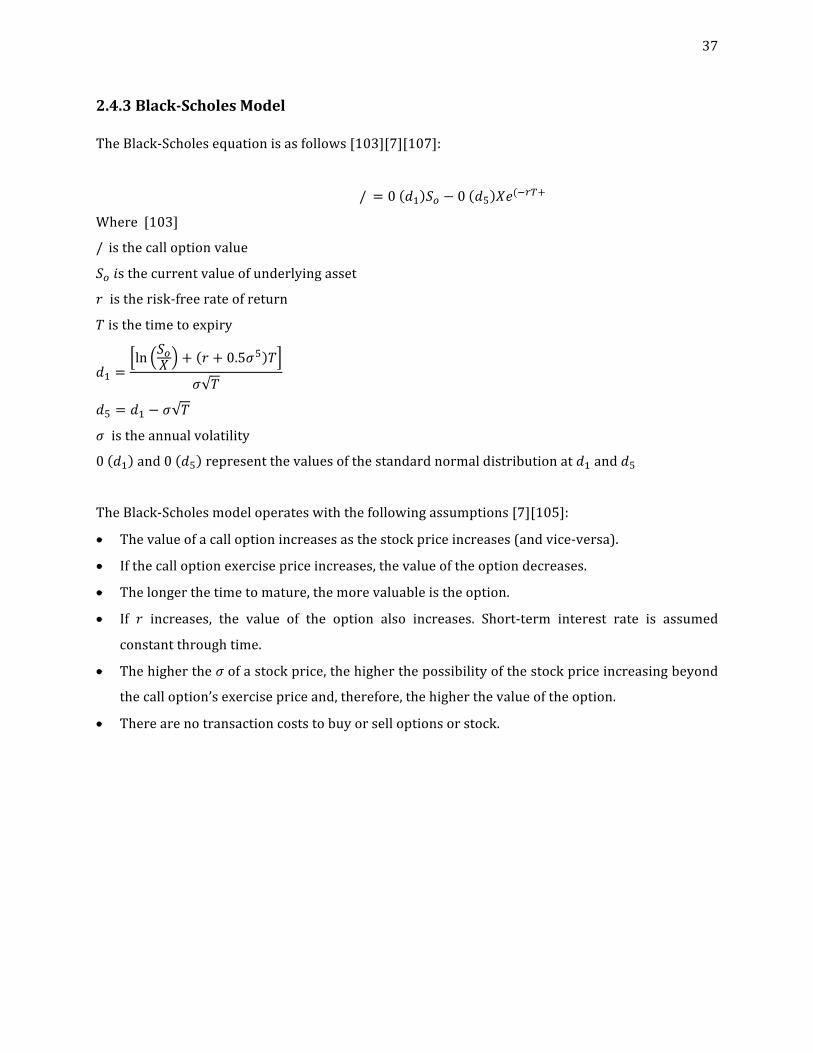
37
2.4.3Black-ScholesModel
TheBlack-Scholesequationisasfollows[103][7][107]:
𝐶 = 𝑁 𝑑( 𝑆3 − 𝑁 𝑑5 𝑋𝑒(8*,)
Where[103]
𝐶isthecalloptionvalue
𝑆3𝑖sthecurrentvalueofunderlyingasset
𝑟istherisk-freerateofreturn
𝑇isthetimetoexpiry
𝑑( =ln 𝑆3
𝑋 + 𝑟 + 0.5𝜎5 𝑇
𝜎 𝑇
𝑑5 = 𝑑( − 𝜎 𝑇
𝜎istheannualvolatility
𝑁 𝑑( and𝑁 𝑑5 representthevaluesofthestandardnormaldistributionat𝑑(and𝑑5
TheBlack-Scholesmodeloperateswiththefollowingassumptions[7][105]:
• Thevalueofacalloptionincreasesasthestockpriceincreases(andvice-versa).
• Ifthecalloptionexercisepriceincreases,thevalueoftheoptiondecreases.
• Thelongerthetimetomature,themorevaluableistheoption.
• If 𝑟 increases, the value of the option also increases. Short-term interest rate is assumed
constantthroughtime.
• Thehigherthe𝜎ofastockprice,thehigherthepossibilityofthestockpriceincreasingbeyond
thecalloption’sexercisepriceand,therefore,thehigherthevalueoftheoption.
• Therearenotransactioncoststobuyorselloptionsorstock.
38
Otherlimitationsinclude[103]:
• Itassumestheunderlyingassetsallowsfollowsalognormaldistribution20,thisisnotalwaysthe
casewithrealassets
• Itdoesnottakeintoaccountanyupsanddownsintheassetvalueandassumesthatincreases
invaluearecontinuousasdirectedbythevolatility
• The derivation of the equation is very complex mathematically and this causes a loss in
intuitionformanagerstryingtoapplyit,whichmakesitdifficultforthemtogetonboard
• Themodelwasdeveloped forEuropeanoptions that canonlybeexercisedona certaindate.
Thisdoesnotreflectthetruenatureofrealoptionsthatcanbeexercisedatanytime.
• Adjustments can bemade to themodel to help improve it, however, they tend tomake the
modelevenmorecomplex.
The Black-Scholes option theory has been used in industry to value real assets and investments
such as R&D and technology [105]. However, this model has limitations when applied to such
projects that are often exposed to varying types and levels of uncertainty. These projects that
usuallyincorporateaseriesofoptionsthatmayinteractwithoneanother(i.e.compoundoptions)
cannot be properly estimated by the Black-Scholes model, thus producing a value that may be
higherorlowerthantheactual[69].
2.4.4BinomialModel
Cox et al. [108] introduced the binomial model. This model is a discrete-time model that uses
binomial trees to show the changes in stock price with time. It assumes there are market
opportunities that createpayoff patterns for options [14]. There are twoapproaches to applying
thesemodels,risk-neutralprobabilitiesandmarket-replicatingportfolios[109].However,market-
replicating is amore complicated approach [7]. The risk-neutral approach assumes the option is
independentoftheriskpreferenceofaninvestor[108][110].Moreontheseapproachesin2.5.2.
20Variancerateisproportionaltothesquareofthestockpriceandthevariancerateofthereturn
onthestockisconstant[105].
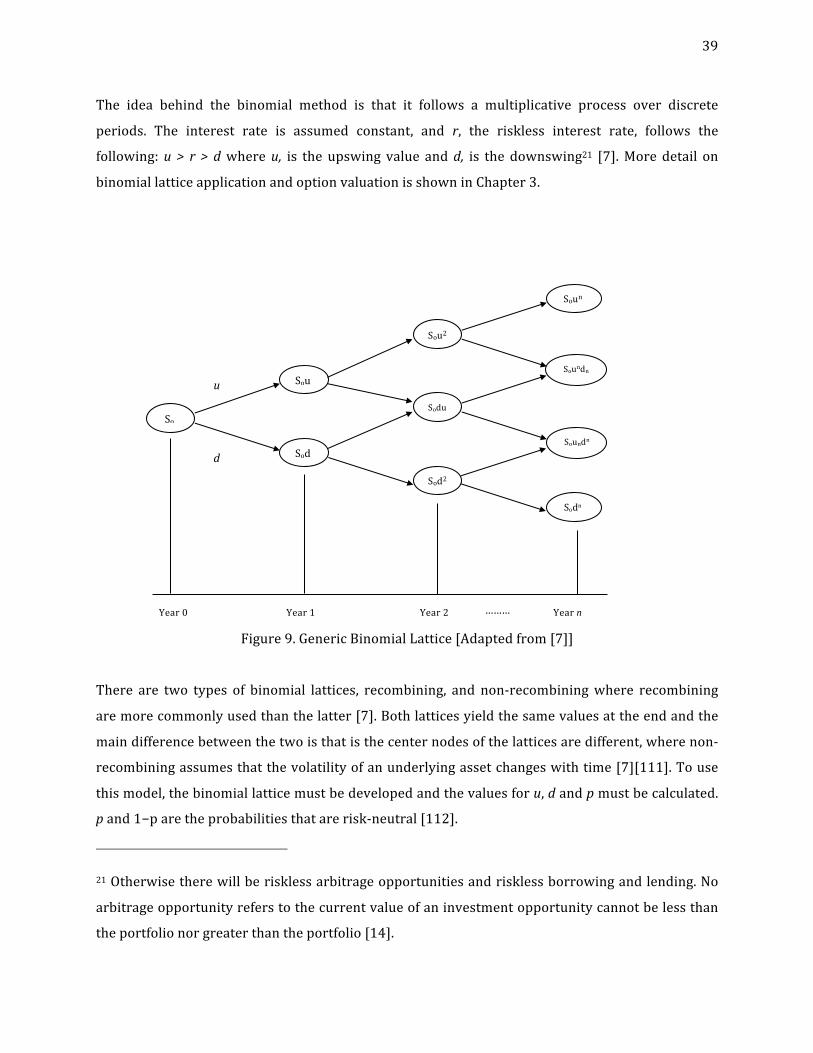
39
The idea behind the binomial method is that it follows a multiplicative process over discrete
periods. The interest rate is assumed constant, and r, the riskless interest rate, follows the
following:u > r > dwhereu, is the upswing value andd, is the downswing21 [7].More detail on
binomiallatticeapplicationandoptionvaluationisshowninChapter3.
Figure9.GenericBinomialLattice[Adaptedfrom[7]]
There are two types of binomial lattices, recombining, and non-recombiningwhere recombining
aremorecommonlyusedthanthelatter[7].Bothlatticesyieldthesamevaluesattheendandthe
maindifferencebetweenthetwoisthatisthecenternodesofthelatticesaredifferent,wherenon-
recombiningassumesthatthevolatilityofanunderlyingassetchangeswithtime[7][111].Touse
thismodel,thebinomiallatticemustbedevelopedandthevaluesforu,dandpmustbecalculated.
pand1−paretheprobabilitiesthatarerisk-neutral[112].
21Otherwisetherewillberisklessarbitrageopportunitiesandrisklessborrowingandlending.No
arbitrageopportunityreferstothecurrentvalueofaninvestmentopportunitycannotbelessthan
theportfolionorgreaterthantheportfolio[14].
u
So
Sou
Sod
Sodu
Sou2
Sod2
Soun
Soundn
Soundn
Sodn
d
Year0 Year1 Year2 Yearn………
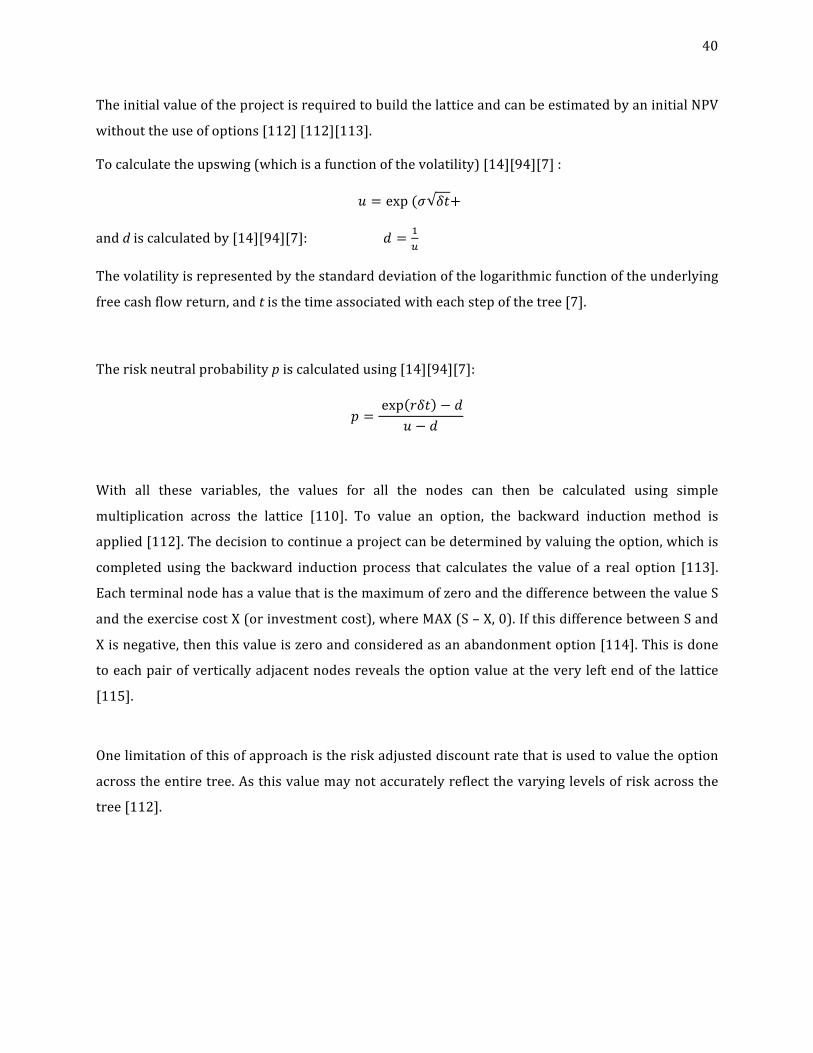
40
TheinitialvalueoftheprojectisrequiredtobuildthelatticeandcanbeestimatedbyaninitialNPV
withouttheuseofoptions[112][112][113].
Tocalculatetheupswing(whichisafunctionofthevolatility)[14][94][7]:
𝑢 = exp(𝜎 𝛿𝑡)
anddiscalculatedby[14][94][7]: 𝑑 = (W
Thevolatilityisrepresentedbythestandarddeviationofthelogarithmicfunctionoftheunderlying
freecashflowreturn,andtisthetimeassociatedwitheachstepofthetree[7].
Theriskneutralprobabilitypiscalculatedusing[14][94][7]:
𝑝 =exp 𝑟𝛿𝑡 − 𝑑
𝑢 − 𝑑
With all these variables, the values for all the nodes can then be calculated using simple
multiplication across the lattice [110]. To value an option, the backward induction method is
applied[112].Thedecisiontocontinueaprojectcanbedeterminedbyvaluingtheoption,whichis
completedusing thebackward inductionprocess that calculates the valueof a real option [113].
EachterminalnodehasavaluethatisthemaximumofzeroandthedifferencebetweenthevalueS
andtheexercisecostX(orinvestmentcost),whereMAX(S–X,0).IfthisdifferencebetweenSand
Xisnegative,thenthisvalueiszeroandconsideredasanabandonmentoption[114].Thisisdone
toeachpairofverticallyadjacentnodesrevealstheoptionvalueattheveryleftendofthelattice
[115].
Onelimitationofthisofapproachistheriskadjusteddiscountratethatisusedtovaluetheoption
acrosstheentiretree.Asthisvaluemaynotaccuratelyreflectthevaryinglevelsofriskacrossthe
tree[112].
41
2.5RealOptionsValuation
This section introduces fundamental concepts of real options (RO) and their value to R&D and
technologyprojectsthathavebeenwidelydiscussedintheliterature.
2.5.1IntroductiontoRealOptions:ValueasaDecision-MakingTool
RO research has been an important source contributing to financial economics and strategic
managementthroughanapproachthatencompasses investmentmethodologiesandflexibilityfor
decision-makersunderuncertainenvironments[9].StrategyresearchhasbeenfocusedonhowRO
adoption can create, sustain and improve an organization’s competitive advantage [9]. In 1977,
StewartMyerscoinedtheterm“realoptions”[116].TheROframeworkgivesdecision-makersthe
ability to invest, grow or abandon a project as more information is realized [117][112]. This
frameworkisanextensionoffinancialtheory,however,itreferstorealassets[112].Realoptions
valuation(ROV)wasdevelopedtoevaluatecapitalinvestmentsthatrequiredmanagerialflexibility
[112]. Option pricing methodology has been used to value real assets in the natural resources
industry but has now been applied in R&D, new technology developments and other areas [97].
Thereareseveralrealoptionsanalysisapproachesthatcanbeusedtotechnologyinvestmentsand
R&Ddecision-making[118][20].
ROtheoryisbuiltonthebeliefthatifdecision-makersareallowedtheflexibilitytoalterthecourse
of a highly uncertain project by incorporating strategic options, then, an organizations’ overall
valuecanincrease[9].Theserealoptionsarethoughtofasaguidethatcanleadtostrategicpaths
[9]andallowmanagers to favorablyutilizeuncertaintiesas theyevolve through theproject [10].
ROisavaluabletoolforriskyR&Dprojects[10]becauseitrecognizesthattheseprojectsoftenhave
longerhorizonsandarenotexpectedtogeneraterevenuesimmediately,butstillaccountsforthe
future potential [14]. This is accomplished by allowingmanagers tomake decisions at different
stages of theproject, such as,whether a project shouldbe continued [9][113]. This is unlike the
norm,wheremany financialdecisionsandresourcecommitmentsaremadeup-front,despite the
uncertainoutcomes[9].Abetterapproachwouldbetostagetheinvestments,asROallowsforthis
[9]. The sequence of decision-making allows managers to make justified decisions of when to
undertakeopportunities[14].
42
Manyofthetraditionalvaluationapproachesalso incorporatestandardinvestmentdecisionsthat
depend on creating profit, though thismay not be useful for R&D firms thatmay have different
goals,thatmaynotbetocommercializeandcreateprofit22[10].
TheframeworkforROemphasizesthatflexibilityofmanagementinhighlyuncertainenvironments
holdsagreatvalue[97].Thismethodgivesmanagerstheabilitytomakestrategicdecisionssuchas
stagingcapital investmentswhennecessary,wait tillmarketuncertaintiesaremanagedor future
prospectstobecomepromising,expand,orliquidatetheirassets[9].EachphaseofanR&Dproject
can be thought of as an option that depends on the success of previous stages (and options). If
successful,optionscanbeexercisedtomake larger investmentstocontinuetheprojectandgrow
(and launch a new technology), however, if there is a failure, then managers can decide to not
commitanylonger(andabandontheresearch)[3][20].Thislimitstheoverallrisktoonlytheinitial
investments of the project [3][20]. The RO managerial tool views strategic management as a
processthatallowsdecision-makerstoactivelyworktoreducethedownsidesofriskandcapture
the opportunities [119]. The application of RO affectsmanagers’ views on riskwhere it changes
from an attitude of avoiding it, to one that chooses to minimize or resolve it, leading to the
developmentofnewopportunitiesandotherpositiveoutcomes[82].
Figure10.ThestructureofRealOptions[Adaptedfrom[120]]
22Forexample,theycouldbedevelopingatechnologyforthe“greatergood”suchasaproductthat
isbeneficialtoimprovingtheenvironment.
Stage1
Stage2
LossofInitial
Investment
NetProfits
Donotinvest
InvestinOption
Unfavourablenews:AbandonOption
Favourablenews:exerciseoptionthroughfollow-upinvestment
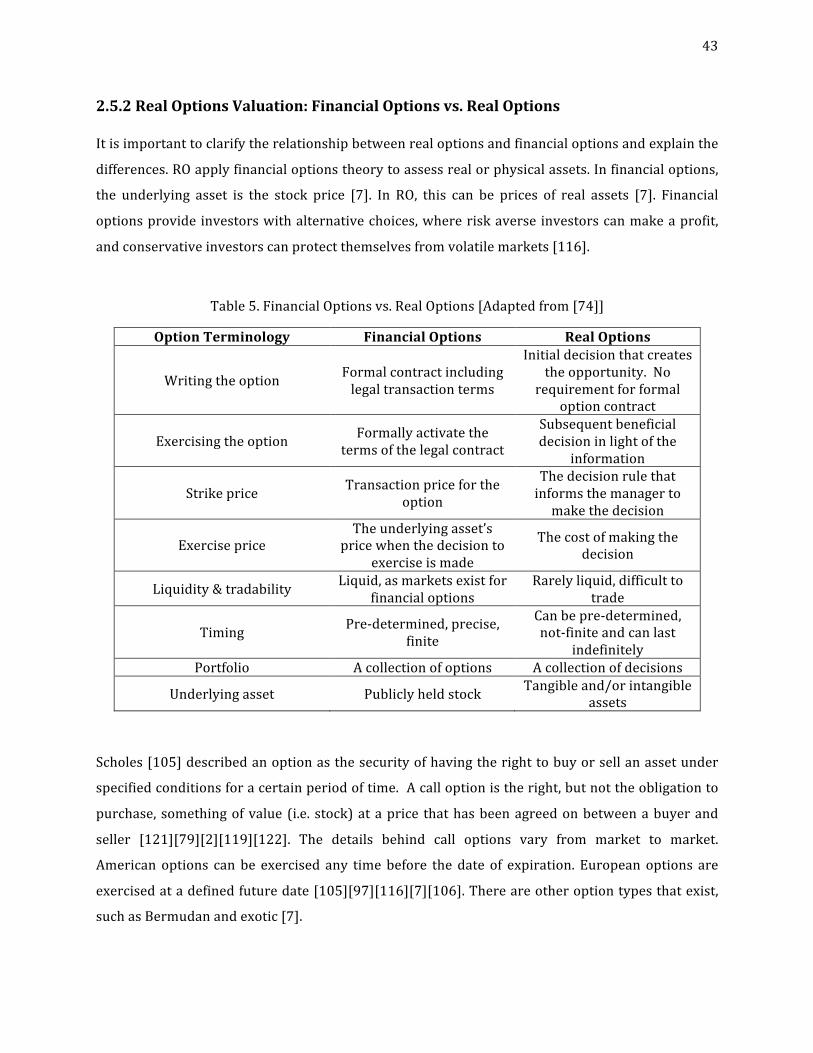
43
2.5.2RealOptionsValuation:FinancialOptionsvs.RealOptions
Itisimportanttoclarifytherelationshipbetweenrealoptionsandfinancialoptionsandexplainthe
differences.ROapplyfinancialoptionstheorytoassessrealorphysicalassets.Infinancialoptions,
the underlying asset is the stock price [7]. In RO, this can be prices of real assets [7]. Financial
optionsprovideinvestorswithalternativechoices,whereriskaverseinvestorscanmakeaprofit,
andconservativeinvestorscanprotectthemselvesfromvolatilemarkets[116].
Table5.FinancialOptionsvs.RealOptions[Adaptedfrom[74]]
OptionTerminology FinancialOptions RealOptions
Writingtheoption Formalcontractincludinglegaltransactionterms
Initialdecisionthatcreatestheopportunity.No
requirementforformaloptioncontract
Exercisingtheoption Formallyactivatethetermsofthelegalcontract
Subsequentbeneficialdecisioninlightofthe
information
Strikeprice Transactionpricefortheoption
Thedecisionrulethatinformsthemanagertomakethedecision
ExercisepriceTheunderlyingasset’s
pricewhenthedecisiontoexerciseismade
Thecostofmakingthedecision
Liquidity&tradability Liquid,asmarketsexistforfinancialoptions
Rarelyliquid,difficulttotrade
Timing Pre-determined,precise,finite
Canbepre-determined,not-finiteandcanlast
indefinitelyPortfolio Acollectionofoptions Acollectionofdecisions
Underlyingasset Publiclyheldstock Tangibleand/orintangibleassets
Scholes[105]describedanoptionasthesecurityofhavingtherighttobuyorsellanassetunder
specifiedconditionsforacertainperiodoftime.Acalloptionistheright,butnottheobligationto
purchase, somethingofvalue (i.e. stock)ataprice thathasbeenagreedonbetweenabuyerand
seller [121][79][2][119][122]. The details behind call options vary from market to market.
American options canbe exercised any timebefore the date of expiration. Europeanoptions are
exercisedatadefinedfuturedate[105][97][116][7][106].Thereareotheroptiontypesthatexist,
suchasBermudanandexotic[7].
44
Aputoption is the right to sell somethingofvalueataprice thathasbeenagreedonbetweena
buyerandaseller,withtheexpirationdateandoptionrulesspecified[116].Anexercisepriceor
strikepricereferstothepricethatwaspaidforanasset(or fixedshareprice)whenanoption is
exercised.The final daywhich anoptionmaybe exercised is referred to as thematuritydate or
expirationdate[105][7][94].AROisdefinedastheright,withouttheobligationtomakedecisions
(suchasdefer,abandon,alter,etc.)regardingrealassets[123][124].
Thenatureofuncertainties alsodiffersbetweenROand financial options,where theuncertainty
liesinstockpricesandthevariabilityofthepriceofunderlyingfinancialassets[119].Factorsthat
affectthevolatility,thusalsoaffectthevalueofafinancialoption[79].
Infinancialoptiontheory,thehigherthestockprice,thehighertheoptionvalue.Therefore,when
thepriceofastockishigherthantheexerciseprice,investorsareverylikelytoexercisetheoption
[105]. If the stockprice is less than theexerciseprice, investorsarenot likely toexercise, as the
valuewillbeclosetozero[105].Thevalueofanoptiontypicallydecreasesastheexpirationdate
nearsandifthestockpricedoesnotchange[105].
InROtheory23,thevalueliesintheunderlyingasset,andiftheassetvalueincreases,thensodoes
thevalueoftheRO.Likewise,iftheexercisepriceincreases,thentheROvaluedecreases.Ifthetime
tomaturity is increased, then the RO values are consequently increased [121]. A longer time to
expire allows more time to learn about the uncertainties, which increases option value [94]. If
uncertaintyincreases,thensodoestheROvalue,asmanagementcantakeactionandcapturethis
opportunity (andavoid thedownside). If therisk-freeratevalue increases, sodoes theROvalue.
Finally,ifdividendspaidout(byanunderlyingasset)increase,sodoestheROvalue[121].
23Definingthesevariablesallowsarealoptiontobevalued.

45
Therearetwomainapproachestorealoptionsanalysis(ROA),thefirstoneisamarket-replicating
portfoliomethodthatimitatesthepayoffsofaproject,wherethevalueofaprojectisvaluedusing
theno-arbitrageapproach[96][7].Thesecondapproachistherisk-freediscountratemethodthat
calculatesadjustedprobabilitiesusingarisk-freediscountrateinordertovaluetheproject[96][7].
Both these approaches model the project’s uncertainty using geometric Brownian processes or
binomialtrees[7][96][107].
2.5.3TypesofRealOptions
There is a large amount of literature that describes types of options and their details24. R&D
projectsaregenerallyassociatedwithmanyrealoptions [98], and there isnospecificnumberof
real option types that researchers and academics fully agree on [10]. The basic real options are
defer or stage, grow, alter the scale (expand, contract), switch, and abandon [125][126]. The
specificsbehindmanagement’smotivationwhyeachoptionisconsideredandultimatelyexercised
isuptothemandtheopportunityvalueoftheoption.ThemostcommonROsaresummarizedin
thissection.
Optiontodelay/defer:ifthecurrenttechnologyisnotuptoparintermsofperformance,maturity,
etc., thenmanagerscanchoosetostrategicallydelayaprojectbyaspecificamountof timeto try
andachievetheirtargets[127].Managementcanwaitaspecifiedamountoftimebeforetheyneed
toexercise[94].Thisoptionisalsoexercisedwhenuncertaintyneedstoberesolved,therefore,the
valueofthisoptionisaffectedbytheuncertainty[67].
Optiontoabandon(termination):thedecisiontostopaprojectisalmostalwaysanoption[7].Ifa
technology or project may not meet specific organizational requirements25 such as market
requirements, changes in regulation, under-estimation of required resources or over-estimating
potential,thenaprojectcanbeterminatedtoavoidadditionalloss[20][104][127].
24 “Detail” refers to actual specifics of the option. For example, growth option may refer to
commercialization,however,commercializationpathsaremanyandthisisuptoanorganizationto
decide.
25Orforexample,notmeetingTRLtargettoprogresstothenextlevel.
46
Optiontoexpandorcontract:thisallowsmanagementtomakechangessuchasexpandproduction
scale or speed up resource allocation whenmarket conditions are favorable. In the case where
conditionsarenotfavorable,thenmanagerscanchoosetoreducethescales(i.e.contract)[121].
Optiontoswitch: ifconditionssuchasdemandorpricechange(orothers), thenmanagementcan
choosetoswitchresourcesorshiftindustries[69].Itgivesmanagerstheabilitytoswitchbetween
technologies,marketsorproducts[97][20].Ifthereisachangeindemand,thenthetypeofproduct
producedmay be changed (i.e. product flexibility) or the inputs to produce the productmay be
changed(i.e.processflexibility)[94][121].
Optiontogrow:Growingtypicallyreferstoanincreaseofcommitmentorinvestmenttoimprovea
technology’s performance [20][69]. This option aims to further develop a technology or build
experience [69] and can sometimes be treated as a compound option where future options are
chosenandexercisedbaseddependonthisoption[92].
Otheroptionsthatcouldaddvaluetotechnologyprojectsinclude:
Stage or compound options: this option refers to staging the investments so that the option to
abandon is created midstream if poor information is realized[92]. This is important in R&D
intensivefirms,capitalintensiveandstart-upventures[69][6].Thisoptionisadevelopedformofa
growthoption, as it has successive stageswith increased volumeof activity that depends on the
previousones[92].ThisoptioncommonlyusedinR&Dasanoptiontodevelopatechnologymay
beexercised,thenasubsequentoptiontocommercialize26[128].
Outsourcingoptions:reasonsforconsideringthisoptionincludecost-cutting,lackofemployeesor
expertise,andenhancingcompetitiveadvantagethroughtheexpertiseofavendor[20].
License-inoption:thisoptioncangiveearly-stagetechnologyprojectsaccesstonecessaryanalytical
validation methods and saves R&D organizations time and cost [20]. This option allows
organizations to identifyearly stageopportunities [67].Many factors candelay—orconceal—the
needtoterminateprojects, includingpersonalpride,competitoractions,customerprocesses,and
technology advances. It is thus important to establish the criteria for termination,may increase
uncertaintyasthetechnologyisathird-partyproductwhichmaycauseproblemswithtechnology
transfer[20].
26Thenatureof thestagedoption inR&Dmakes it clear thatusing theBlack-Scholes formula,or
anyofitsvariancethatallowdividendpay-outswillnotbeanappropriatemethod[128].
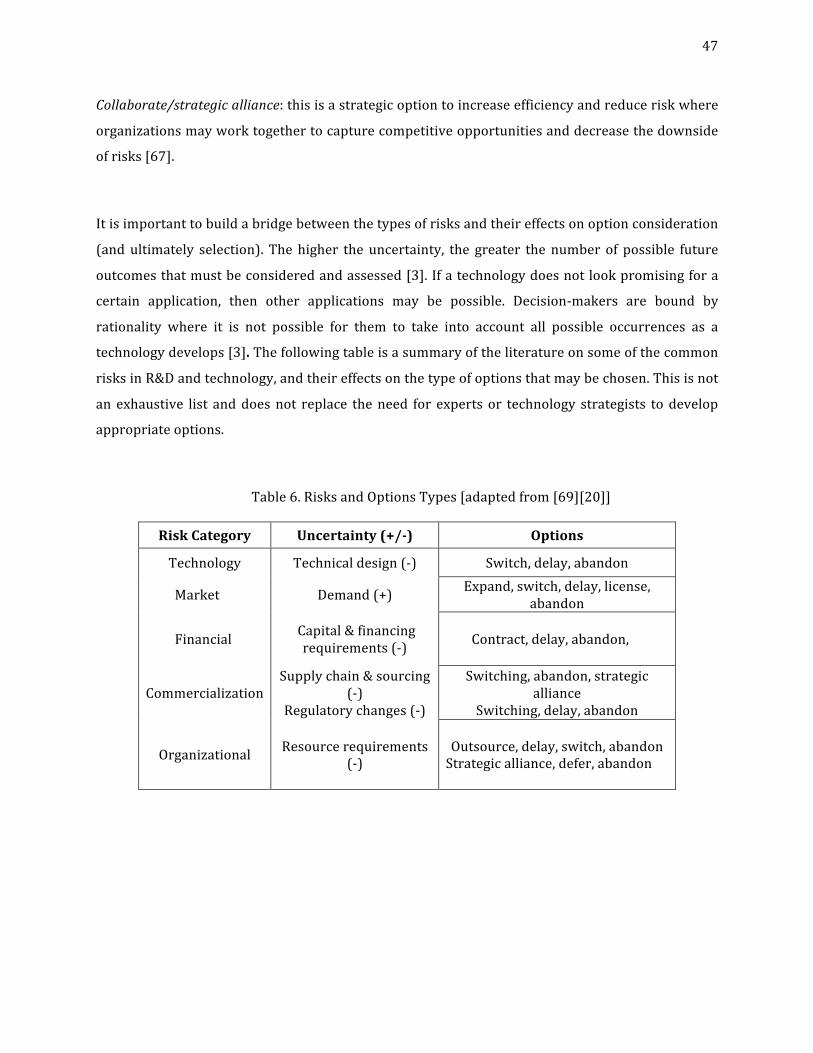
47
Collaborate/strategicalliance:thisisastrategicoptiontoincreaseefficiencyandreduceriskwhere
organizationsmayworktogethertocapturecompetitiveopportunitiesanddecreasethedownside
ofrisks[67].
Itisimportanttobuildabridgebetweenthetypesofrisksandtheireffectsonoptionconsideration
(andultimately selection). The higher the uncertainty, the greater the number of possible future
outcomesthatmustbeconsideredandassessed[3].Ifatechnologydoesnotlookpromisingfora
certain application, then other applications may be possible. Decision-makers are bound by
rationality where it is not possible for them to take into account all possible occurrences as a
technologydevelops[3].Thefollowingtableisasummaryoftheliteratureonsomeofthecommon
risksinR&Dandtechnology,andtheireffectsonthetypeofoptionsthatmaybechosen.Thisisnot
an exhaustive list anddoesnot replace theneed for experts or technology strategists todevelop
appropriateoptions.
Table6.RisksandOptionsTypes[adaptedfrom[69][20]]
RiskCategory Uncertainty(+/-) Options
Technology Technicaldesign(-) Switch,delay,abandon
Market Demand(+) Expand,switch,delay,license,abandon
Financial Capital&financingrequirements(-) Contract,delay,abandon,
CommercializationSupplychain&sourcing
(-)Regulatorychanges(-)
Switching,abandon,strategicalliance
Switching,delay,abandon
Organizational Resourcerequirements(-)
Outsource,delay,switch,abandonStrategicalliance,defer,abandon
48
2.6RealOptionsAnalysis
2.6.1ApplyingRealOptions:TheSteps
Although the specifics behind frameworks developed for each application may vary, the basic
methodisstandard.Thissectionwilloutlinethestepstoapplyingrealoptionsanalysis.Notethat
these steps listed are only the computational steps and do not include the steps that would be
required foracomplete framework for technologyandR&Dprojects(thedecision-makingaspect
too).Thestepsareasfollows[7][129][104][130][121]:
1. Computethebase-casetraditionalNPVanalysis
2. Modeltheuncertainty(usingMonte-Carlosimulationsorother)onthebase-case
3. Usingtheinformationfromsteps1and2,frametheROproblem:
a. Identifytheoptions
b. Select thevaluation toolormodel (Forexample:Black-Scholes,usinga replicating
portfolio[107])
c. Identifyallinputsforvaluation
4. ConductROA
a. Applythemodel
b. Obtaintheoptionvalue
c. Conductasensitivityanalysis
5. Reportandupdateanalysis
For example, if the binomialmodelwas applied, a general application canbe summarized in the
following steps [112][131]. A full application will be discussed in Chapter 3 and conducted in
Chapter4.ThestepstoapplyROAusingthebinomialmodelare:
1. Identifyalldecisionsequences,managerialflexibilities
2. Modeluncertaintiesbyspecifyingvariables’distributionsandrandomvariables
3. RunMonte-Carlosimulationsforthemodels(withouttheoptions)
4. Obtaincashflowforeachperiod
5. Estimatevolatilityoftheproject
6. Calculatebinomialmodelparameters(u,d,p)
7. Buildthebinomiallattice
8. Addoptionsandsolvethetreeusingtheriskfreerate(applybackwardinductiontovalue
option)
49
TheROvaluationmodelspreviouslyintroducedincorporateprobabilitieswhicharerequiredtobe
sufficiently reliable [66].Analystsusuallyestimate theprobabilityof successfuldevelopmentofa
projectoratechnologyfromstatisticsonsimilarprojectswhenthisisavailable[93].Thisisdifficult
toachievewithearly-stageR&Dprojects,however,itisbettertomodeluncertaintyandobtainbest
estimatesofprobabilities,as this typeofmodelingenablesmanagement tobetterchooseoptions
for different outcomes [66]. The process of valuing real options has several aspects, it estimates
financialgain,butalsostrategicpositioningandknowledgeisgained[107].
AnyROAshouldincludeasensitivityanalysisastheseR&Dprojectshavemanyassumptions[93].
Examplesofcommonsensitivityanalysisvariablesinclude[93]:
• Probabilityofsuccess(ofR&Dortechnologydevelopmenteffortorcommercialization)
• Costtoimplement
• Marketuncertainty
• Volatility
• Expirationoftheoption
Commonlyusedapproachestounderstandhowuncertaintybehavesinclude[117]:
• Conductingasensitivityanalysis
• Conducting a scenario analysis (best andworst-case scenarios to understand overall project
uncertainty)
• AMonte-Carlo simulation (probabilisticmethod that assesses the likelihoodof each outcome
andobtainsaprobabilitydistribution)
• ABayesiananalysis(toassesstherandomvariables)
Asdiscussedpreviously,volatilitystronglyinfluencestheoptionvalueoftheasset[117],andmany
of the R&D and technology projects do not have any historical or empirical data to accurately
estimate the volatility (and therefore, the probability of success) [117]. However, the literature
discussesestimatingthevolatilitywiththeuseofaMonte-Carlosimulationonthebase-casecash
flow,whereadistributionfortheprojectvalueisproducedandthestandarddeviationrepresents
thevolatility[130].

50
In general, technology projects carry a high amount of technology and market risk, which is
challengingtoestimatevaluesfortheparametersinthemodelduringtheinitialstages[20].During
theseearlyphases,ROcanbenaivelyappliedbymanagersastheuncertaintyinassumptionsmade
forvariablessuchasprobabilitiesofsuccessareexpectedtobehigh[1].
The use of RO as a decision-making tool has faced many organizational and implementation
challengesinpractice,asscholarshavenotbeenabletoencompasstheknowledgeinanorganized
and cohesivemanner [9]. Another point is that there is noway to actually enforcemanagers to
follow thedecision-makingoptions identified [102].Even though there is theoption to abandon,
managersmayalreadybedeeplyinvestedinthetechnologyandmaynotwanttoberecognizedas
havingpoorjudgementandriskbacklashfromhigherexecutives[102].
2.6.2Monte-CarloSimulations
ItisimportanttodiscussthemainpointsandideasbehindMonte-Carlosimulations.Moredetails
andstepstoapplyingarediscussedinChapter3.Tocountertheuncertaintyintheestimationsof
values in theROmodels,asensitivityanalysis isconducted toobservehowvalueschange,which
can be modeled using Monte-Carlo methods [3]. The name “Monte-Carlo” simulation originated
during World War II as a method applied to the development of the atomic bomb [132]. This
method isused to solvemanyproblemswithstochasticvariables in statistics thatarenot solved
analytically [132]. Monte-Carlo simulations are valuable tools in the financialworld and in real
options[117],andtheprocessisprogramming-intensive,withoutcomesthatarehardtoverify,as
theyrequirerigorousassumptionsaboutprobabilitydistributionsoftheinputparameters[104].
Usually,asensitivityanalysisisfirstperformedonthediscountedcash-flowmodel;thatis,setting
thenetpresentvalueorROIastheresultingvariable;wecanchangeeachofitsprecedentvariables
andnotethechangeintheresultingvariable[133].Precedentvariablesincluderevenues,costs,tax
rates,discountrates,capitalexpenditures,depreciation,andsoforth,whichultimatelyflowthrough
themodeltoaffectthenetpresentvalueorROI.Bytracingbackalltheseprecedentvariables,we
canchangeeachonebyapre-setamountandseetheeffectontheresultingnetpresentvalue[133].
Input variables to themodel are assigned probability distributions. Formore information about
howtoselectprobabilitydistributions,see[132][7].
51
Thesimulationallowscontinuousdistributionstobemodeled,resultinginafullrangeofvariability
ofparameters[132].Theoutputsofthesimulationprovideimportantinsightintothebehaviourof
variablesandmaybeusedasinputsfortheROvaluation.Atornadochartisthenproducedwhere
the most sensitive input variable is shown first. Using this information, managers can then
determinewhichvariablesaredeterministicandwhichareuncertain.Someofthesefactorsmaybe
correlated,which could requiremultidimensional simulations. Correlations are often determined
fromhistoricaldata[133].
2.6.3RealOptionsinIndustry
Therearemanycompaniesthathaveadoptedrealoptionsframeworksaspartoftheirinvestment
methods such as Airbus, GE, Hewlett Packard, Intel, and Toshiba [119]. Hewlett-Packard has
employedRO tomatch supplyanddemandsand the trade-offsbetween the costsof components
andtheflexibility[104].IntelandToshibahavebeenusingROtoevaluatelicensingopportunities,
whilemany companies inSiliconValleyhaveadoptedROas ithas led to increased collaboration
between companies [104]. Pharmaceutical company,27 Merck, has famously analyzed their R&D
investments using RO frameworks, allowing them to evaluate their decisions under high risks
[104].TheyhavealsousedBlack-Scholestovaluethebenefitsofjointventures[109].Eventhough
theBlack-Scholesmodel isnotappropriateforR&Dcompoundoptions,Merckbelievedtheyhave
enoughhistoricaldatafromtheirR&Dprojectstobeabletomakeappropriateassumptions[128].
ShellOilusesROAtoassesscapitalprojectsand their investmentstrategiesand tomodel for the
perfectextractiontimesfortargetoil-fields[104].
27ForanotherapplicationofRObinomialapproachinthepharmaceuticalindustrysee[98].
52
OtherindustriesthathaveheavilyusedROincludeITandtheenergysector(renewableandnon-
renewable)[121][134][2][104][94].AlthoughtherearemanydifferentapplicationsofRO28usedin
different industries,most have been utilized to value capital investments and project selections.
Although useful, this is not themain point of this thesis. For this reason, only themost relevant
frameworksrelatedtoR&D29andtechnologydevelopment(andtheirrisks)willbediscussed.
Perhapsthe frameworkthatmostcloselyresemblestheworkproposed inthis thesis isShishko’s
andEbbler’s frameworkapplication [135][136] toNASA’s technologies.Theirworkexplores real
options and decision-making in a technology context that uses TRLs [135][136]. The model
developed targets long, high-risk technology investments up to and including TRL 6 [135][136].
Themodel isacommon frameworkapplicable to the threeclassesof technologiesatNASA:cost-
reducing,mission-enhancingandmission-enabling [136]. Theydiscuss themostobviousrisks in
theinitialstagesoftheirdevelopmentandtheexpectedshifttomarketrisksbeyondTRL6[136].
They identifiedthat theunderlyingassumptionsofBlack-Scholeswasnotapplicable for theearly
stageprojectsandcomplementedtheirmethodologywiththeuseofMonte-Carlosimulationsand
decision trees to model the variability of their stochastic variables [135] [136]. Their main
challengewas estimating the risk-neutral probabilities for these long-termprojects, the need for
assumptionstobemade,andwhetherNASAasawholeshouldberisk-neutral[135][136].
Wangetal.[20]developedaROframeworkforR&Dplanningthatspecificallytargetstechnology-
based organizations, and allows managers to identify risks and capture opportunities in three
stages. The first stage is opportunity identification, using market-product-technology linkages
wheremarketdriversareidentifiedandperformancetargetsareset.Thesecondstagedevelopsthe
opportunities,where the effects of uncertainties on the technology or performance are assessed
andidentifiedintermsofpossibleoptions[20].
28 There have been many ROmodels that have been adapted depending on the application, for
examplesee[93] forahybridmodeldevelopedforriskyproducts.Thismodelsplitsanalysis into
financialandtechnologicalaspectsoftherisk.
29LookingatR&Dasastep-by-developmentalprocessandconsideringallaspectsofrisk.
53
Forexample,specificuncertaintieswereanalyzedonwhethertheywouldpositivelyornegatively
influencetheproject,andasetofoptionsforeachpotentialriskwasconsidered.Thethirdstageis
theopportunityevaluation,wherethedecisionsareevaluatedandproductdiffusionspeedandits
effectonpayoffsarestudied[20].Theframeworkaccountsfortheevaluationofoptimaldecisions
tomaximizemarketopportunitiesundervariousdemandstructuresusingthediffusionmodel[20].
This work was applied to an R&D biochip project and results showed that by assessing
uncertainties and exploring options tomanage them, the expectedmarket payoff increased [20].
Wanget al. emphasize the importanceof growinga firm’smarket researchcapability inorder to
fully capture market requirements, and avoid the technology-push approach. They suggest
considering theuseofMonte-Carlomethods in futureresearch, to fullyunderstand the impactof
uncertaintiesondecisions[20].
Thenextchapterbuildsonconceptsdiscussedintheliteraturereviewtodevelopaframeworkthat
canbeappliedbymanagers,engineers,anddecision-makersintechnologyandR&Dprojects.
54
Chapter3DevelopmentoftheROADecisionFramework
ThepurposeofthischapteristodeveloparealoptionsframeworkthatcanbeappliedacrossR&D
and technology projects. The framework is expected to guide decision-makers into exercising
flexibilityduringprojectssothattheupsideofopportunitiesismaximizedduringriskytechnology
development processes. The proposedmethods establish the groundwork formanagers to start
thinkingahead,andtoconsiderthechallengesandpotentialopportunitiesoffuturestagessuchas
commercialization, in order to create innovative productswith amarket need. It creates a basic
understandingoftheprominentrisksduringdevelopmentandaimstodrawonsomeofthebasic
trendsandbehavioursoftheserisksduringdifferentstagesofaproject.Thetrendsintheserisks
arelinkedtocommonlyoverlookedfactorssuchasresourcerequirements.
3.1FrameworkMethodology
The proposed framework for risk evaluation of a technology development project combines a
stage-gateprocessfordecision-makingbasedontechnologyreadinesslevelwiththeriskprojection
methodofrealoptionsvaluation.
Theframeworkdescribesaprocessforrecommendingasmallnumberofoptionstobeplacedalong
theTRL scale and identifies important risks associatedwith technologyprojects. The framework
alsodiscussesanapproachtoapplyingROvaluationmethodstoguidemanagerstoevidence-based
decisions in an individual technology-developmentproject andacross aportfolioof projects that
mayeachentailadifferentlevelofrisk.
The rationale behind using TRLs as opposed to any other maturity assessment approach was
primarily due to the popularity of this toolwith large organizations (as discussed in Chapter 2),
suchasNASAandNationalResearchCouncilofCanada[54]thatfrequentlyuseit.Theapplication
of RO captures the expected value of decisions at different stages of development, using the
binomial lattice approach. The remainder of this chapter explains how to select points for
determininginvestmentoptions,howtodevelopthevaluation,andimportantconsiderationswhen
usingthisframework.
55
This frameworkcanbedivided into threephases. The first twophasesbeing largelyqualitative,
with management screening for appropriate strategies and projects to consider. Defining
organizational goals, project milestone planning using TRLs, identifying risks, and conducting
analysisareallcompletedduringthesephases.ThethirdphaseistheapplicationofROvaluationto
decisionoptions.
Phaseonefocusesondefiningtheproblem,collectingdataandrelatedinformationforpreliminary
planning and analysis. Phase two consists of understanding requirements needed to advance to
higherTRLsinthecontextofthetechnologyandorganization.Thiscallsforformal&completeTRL
assessments,wheretechnologydevelopmentphasesaredescribedinsixgeneraltypesofactivities:
• Scientificresearch
• Engineeringdevelopment
• Marketing
• Businessdevelopment
• Financing
• Commercialization
Critical risk factors are identified and assessed using relevant risk assessment tools. Decision
milestone schedules and a plan to collect information to improve estimates as project proceeds
(marketing, technology readiness, etc.) are developed. Managers must identify these key risk
factors that drive the decisions behind optionalities and affect their overall value. Phase three
quantifies the value of different options through the use of the binomial lattice approach. The
decisionsarevaluedandthevariabilitiesofparametersareanalyzedanddiscussed.
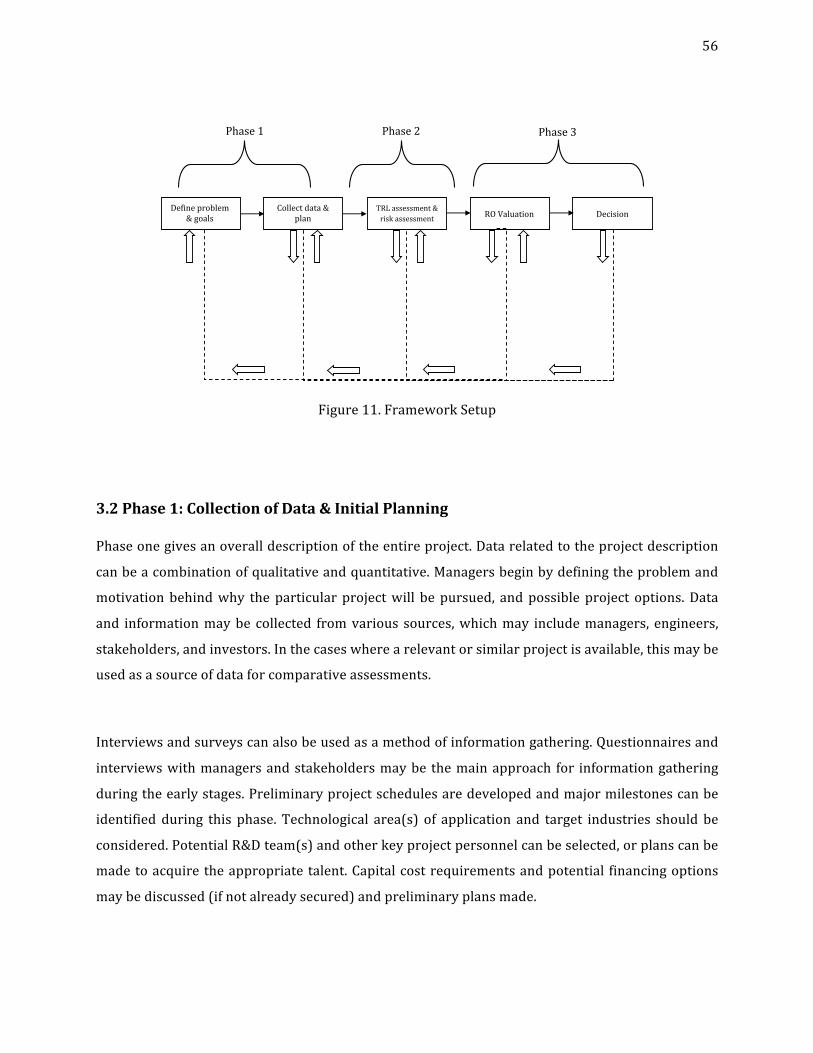
56
Figure11.FrameworkSetup
3.2Phase1:CollectionofData&InitialPlanning
Phaseonegivesanoveralldescriptionoftheentireproject.Datarelatedtotheprojectdescription
canbeacombinationofqualitativeandquantitative.Managersbeginbydefiningtheproblemand
motivationbehindwhy theparticularprojectwill bepursued, andpossibleproject options.Data
and informationmaybe collected fromvarious sources,whichmay includemanagers, engineers,
stakeholders,andinvestors.Inthecaseswherearelevantorsimilarprojectisavailable,thismaybe
usedasasourceofdataforcomparativeassessments.
Interviewsandsurveyscanalsobeusedasamethodofinformationgathering.Questionnairesand
interviewswithmanagersandstakeholdersmaybe themainapproach for informationgathering
duringtheearlystages.Preliminaryprojectschedulesaredevelopedandmajormilestonescanbe
identified during this phase. Technological area(s) of application and target industries should be
considered.PotentialR&Dteam(s)andotherkeyprojectpersonnelcanbeselected,orplanscanbe
madetoacquiretheappropriatetalent.Capitalcostrequirementsandpotential financingoptions
maybediscussed(ifnotalreadysecured)andpreliminaryplansmade.
Defineproblem&goals
Collectdata&plan
TRLassessment&riskassessment ROValuation Decision
Phase1 Phase2 Phase3
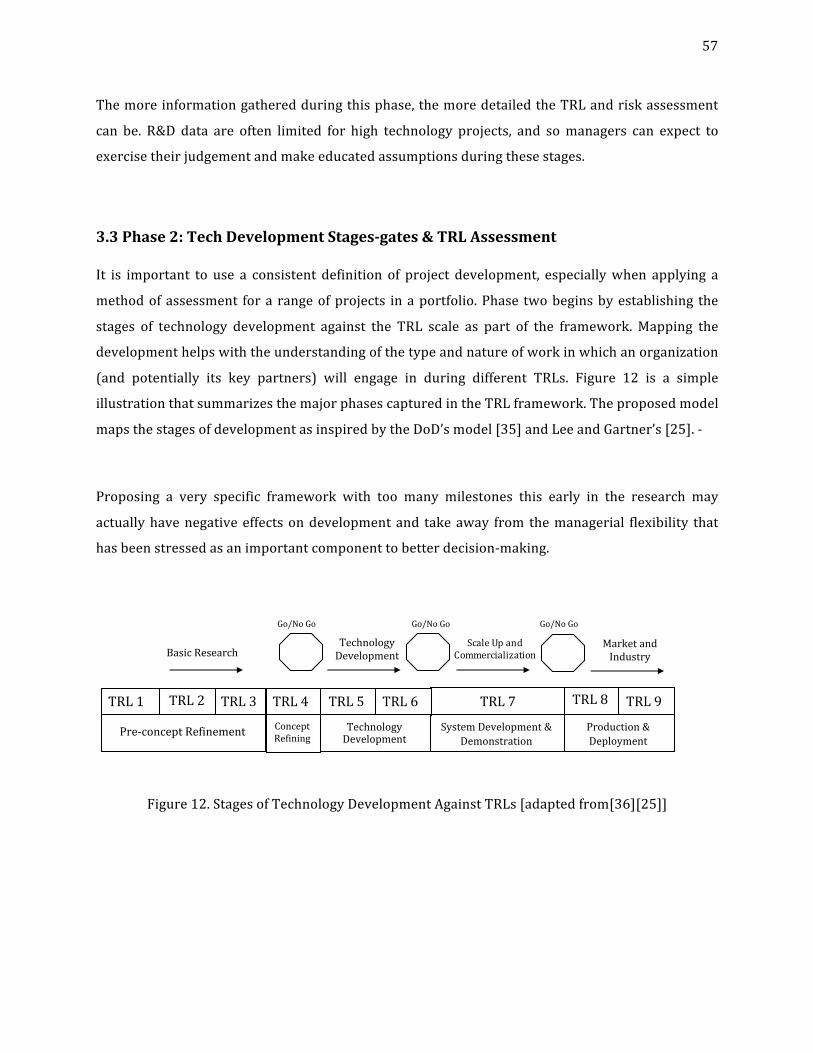
57
Themoreinformationgatheredduringthisphase,themoredetailedtheTRLandriskassessment
can be. R&D data are often limited for high technology projects, and somanagers can expect to
exercisetheirjudgementandmakeeducatedassumptionsduringthesestages.
3.3Phase2:TechDevelopmentStages-gates&TRLAssessment
It is important to use a consistent definition of project development, especiallywhen applying a
methodofassessment fora rangeofprojects inaportfolio.Phase twobeginsbyestablishing the
stages of technology development against the TRL scale as part of the framework. Mapping the
developmenthelpswiththeunderstandingofthetypeandnatureofworkinwhichanorganization
(and potentially its key partners) will engage in during different TRLs. Figure 12 is a simple
illustrationthatsummarizesthemajorphasescapturedintheTRLframework.Theproposedmodel
mapsthestagesofdevelopmentasinspiredbytheDoD’smodel[35]andLeeandGartner’s[25].-
Proposing a very specific framework with too many milestones this early in the research may
actuallyhavenegativeeffectsondevelopmentand takeaway from themanagerial flexibility that
hasbeenstressedasanimportantcomponenttobetterdecision-making.
Figure12.StagesofTechnologyDevelopmentAgainstTRLs[adaptedfrom[36][25]]
SystemDevelopment&Demonstration
TRL7TRL1 TRL3TRL2
TRL4 TRL5 TRL6 TRL8 TRL9TechnologyDevelopment
Production&DeploymentS
yst
Pre-conceptRefinement ConceptRefining
ScaleUpandCommercializationBasicResearch
TechnologyDevelopment
MarketandIndustry
Go/NoGo Go/NoGoGo/NoGo
58
The pre-concept refinement refers to the fundamental research conducted to support
understandingscientificphenomenon.Thecostassociatedwith resourcesduring these levelsare
typically low (compared to commercial implementation activities at later TRLs). More resource
requirements,costsandtherelativeriskswillbediscussedin3.4.DuringTRLs1to3,researchers
should be in the business of linking scientific and technological advancements with a potential
market,toavoidthepitfallsassociatedwithtechnology-pushproducts.Therefore,earlymarketand
feasibility studies are important during this stage, as well as direct contact with first potential
users.Conceptrefinement inTRL4refers toappliedresearchwhereresearchershave linked the
technologytoapotentialapplicationandoperatingenvironment.TRL4isalsowherethecreation
of IP assets begins, and patent strategy decisions are made. Industry and competition studies
shouldalsobecompletedduringtheearlyTRLs.
Thetechnologydevelopmentstage(TRLs5to6),isprototypingandpilot-testingintensive.Atthe
endofthisstage,thetechnologyshouldprovetoaddeconomicvalueforitsintendedapplicationor
industry.Duringtheselevels,organizationsmaybeginstrategicallianceswithotherorganizations
of interest30. TRL 4 to 6 is a critical period during development as there is a dramatic shift in
financialandresourcerequirementsandobservedrisks.Thefunctionalcapabilityofthetechnology
moves from a laboratory environment, to an operational environment, and activities that rely
heavilyonscale-up.Thisperiod isoftenreferredtoas the technology“valleyofdeath”andmany
organizations face great difficulties progressing beyond TRL 6 [56] due to the predominant risk
factorsinthisstage,whichisdiscussedfurtherinthenextsection.
NearingtheendofTRL6,atechnologyprototypeshouldhavebeensuccessfullydemonstratedina
relevant operating environment. Early-stage IP should shift to validated IP, as this has a strong
influenceoncommercializationoptionsandfinancingandinvestmentactivities.Afiledorpending
patentmaybea favorable featuretosomeinvestorsas itprotectsaspectsof thetechnologyfrom
competitorsandmaybea“securityblanket”assellingtherightstothepatentmayyieldareturn
[137]ifthingsdonotgoaccordingtoplans.
30Forexample,ifthereisacompetitorinthesamemarket,thenastrategicoptionmaybetoThis
joinforcesandcollaborateinsteadofabandoningaprojectcompletelyorlosingtocompetition.
59
TRLs past TRL 6 are heavily involved in scale-up work, and aggressively seeking marketing
opportunities and other commercialization options. Business development managers and other
marketingexpertsrequiredtofillknowledgegapsshouldhavebeenhiredbythisstage.However,
buildingamulti-disciplinaryteamshouldbeginatearlyTRLs.ByTRL7,commercializationoptions
shouldhavebeenconsidered(andpossiblyselected).Strategicmarketinganddistributionplansfor
technology positioningwithin an industry should also be completed. This includesmarket entry
strategiesaswellmarketpenetrationplans,andcompetitivedifferentiation(ifany).Organizations
should begin building relationships with key market players and early customers and the
community.AttheendofTRL7,theproductshouldhavebeenproventohavecommercialization
ability.Thefinancingexpectationstoreachtargetmaturitylevelsshouldbeexplicitandconsistent.
This is to ensure that the technology can pass through the relevant stage-gate assessments and
reviews.
ThefinalstageofproductionanddeploymenttakesplaceinTRLs7through9.Thetechnologyhas
been proven suitable for full commercial use (as the technology is now fully implemented and
tested).Humanandorganizationalrequirementsarestillhigh,asnewchallengestomeetdemands
arise.MaintainingandcontrollingIPisimportantduringthisstage.Relationshipswithkeymarket
playersandusersaremaintainedandstrengthened.Thesocialimpactoftechnologyshouldalsobe
considered.Fixingofsystembugsandtechnicalglitchesisalsoexpectedwiththelaunchofanew
technologyandinnovationiscontinuouslydrivenbyfeedbackfromendusers.
Theframeworksuggestsaminimumofthreemainstage-gatesoneatTRL4,TRL6,andTRL7.The
frameworkisalsodevelopedwiththeassumptionthatorganizationsutilizingthisframeworkhave
TRLtargetsbeyondTRL6.However, this frameworkcanbeappliedforthosethatdonotwishto
commercializeandlaunchandwishtoremainatlowerTRLs.
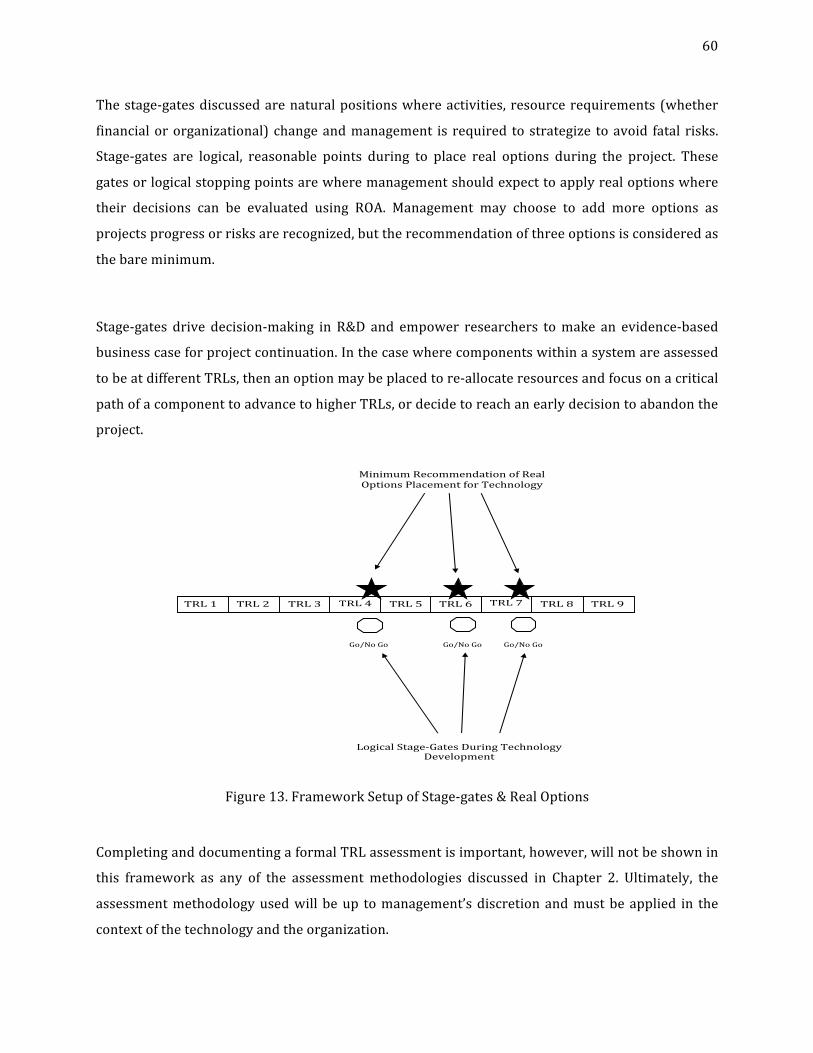
60
Thestage-gatesdiscussedarenaturalpositionswhereactivities, resourcerequirements(whether
financialororganizational) changeandmanagement is required to strategize toavoid fatal risks.
Stage-gates are logical, reasonable points during to place real options during the project. These
gatesorlogicalstoppingpointsarewheremanagementshouldexpecttoapplyrealoptionswhere
their decisions can be evaluated using ROA. Management may choose to add more options as
projectsprogressorrisksarerecognized,buttherecommendationofthreeoptionsisconsideredas
thebareminimum.
Stage-gates drive decision-making in R&D and empower researchers tomake an evidence-based
businesscaseforprojectcontinuation.Inthecasewherecomponentswithinasystemareassessed
tobeatdifferentTRLs,thenanoptionmaybeplacedtore-allocateresourcesandfocusonacritical
pathofacomponenttoadvancetohigherTRLs,ordecidetoreachanearlydecisiontoabandonthe
project.
Figure13.FrameworkSetupofStage-gates&RealOptions
CompletinganddocumentingaformalTRLassessmentisimportant,however,willnotbeshownin
this framework as any of the assessment methodologies discussed in Chapter 2. Ultimately, the
assessmentmethodologyusedwillbeup tomanagement’sdiscretionandmustbeapplied in the
contextofthetechnologyandtheorganization.
Go/NoGo
TRL1 TRL2 TRL3 TRL4
TRL5 TRL6 TRL7 TRL8 TRL9
Go/NoGo Go/NoGo
MinimumRecommendationofRealOptionsPlacementforTechnology
Development
LogicalStage-GatesDuringTechnologyDevelopment

61
AsampleTRAusingtheNASAworkbook[138]requiresorganizationstoidentifyalternativeroutes
in the case the technology does not mature according to plans. NASA recommends developing
schedules that includemilestones, how thesemilestones will be assessed, and requirements for
funding during the first stages to help achieve target TRLs. Potential (known) costs and risks
associatedwithtransitioningfromearlyresearch,toproductionandbeyond,shouldbeidentified.
This ties in well with the proposed framework as the project plan guides decision-making
processes. It also allows managers to consider a variety of applicable options that support
technologydevelopment.
Forcompleteness,theuseofthestructuredandanalysisdesigntechnique(SADT)isrecommended
tobeusedtohelpfurtherthebreakdownanddevelopmentoftheapplicationofaTRLs.Usingthese
block diagrams can help visualize each TRL as a process with a specific set of inputs, outputs,
resource requirements and constraints. These parameters may be specific to a particular
technologyorfirm.FormoredetailsonSADTprocesses,see[139].
Figure14.GenericSADTModel
UnderstandingtheactivitiescompletedateachTRLandwhatproperlydocumentingandtracking
projectprogressisimportantasitcanenablebetterriskidentificationandassessmentduringthis
phase.Thenextsectionlinksthediscussionofactivitieswithassociatedrisksandtheirbehaviours
andeffectsontheproject.
Process Output(s)Input(s)
Resources
Constraints
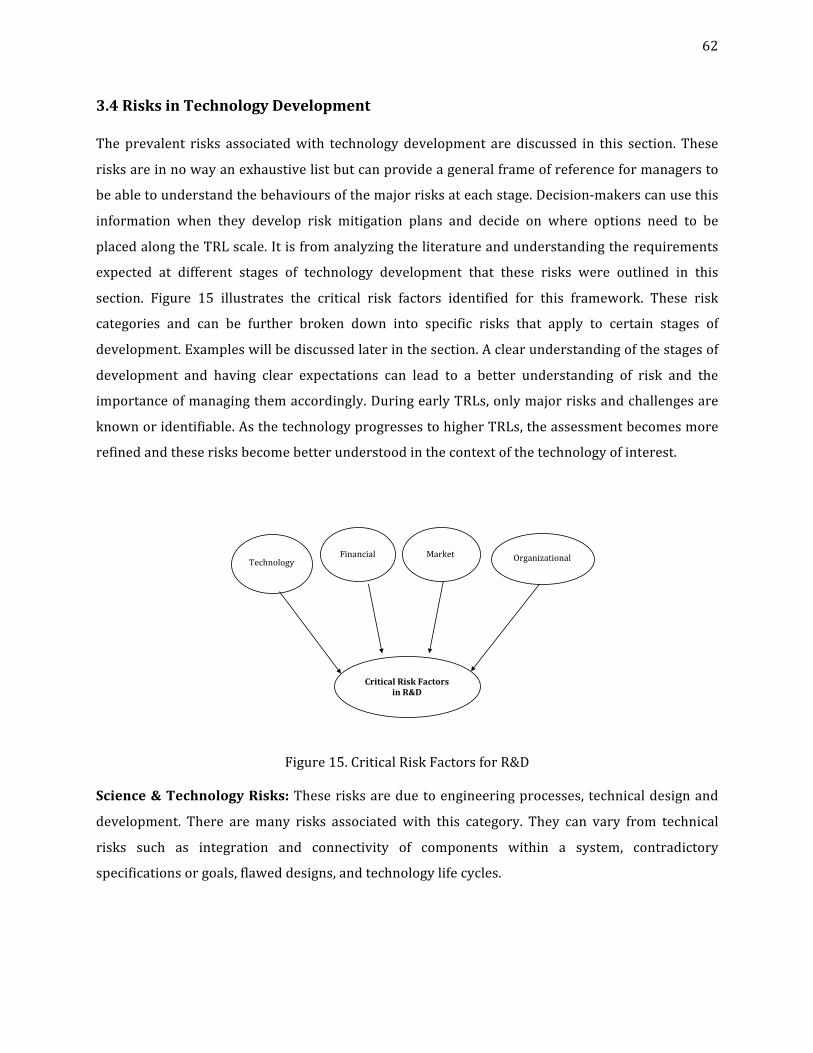
62
3.4RisksinTechnologyDevelopment
Theprevalent risks associatedwith technology development are discussed in this section. These
risksareinnowayanexhaustivelistbutcanprovideageneralframeofreferenceformanagersto
beabletounderstandthebehavioursofthemajorrisksateachstage.Decision-makerscanusethis
information when they develop risk mitigation plans and decide on where options need to be
placedalongtheTRLscale.Itisfromanalyzingtheliteratureandunderstandingtherequirements
expected at different stages of technology development that these risks were outlined in this
section. Figure 15 illustrates the critical risk factors identified for this framework. These risk
categories and can be further broken down into specific risks that apply to certain stages of
development.Exampleswillbediscussedlaterinthesection.Aclearunderstandingofthestagesof
development and having clear expectations can lead to a better understanding of risk and the
importanceofmanagingthemaccordingly.DuringearlyTRLs,onlymajorrisksandchallengesare
knownoridentifiable.AsthetechnologyprogressestohigherTRLs,theassessmentbecomesmore
refinedandtheserisksbecomebetterunderstoodinthecontextofthetechnologyofinterest.
Figure15.CriticalRiskFactorsforR&D
Science&TechnologyRisks:Theserisksareduetoengineeringprocesses, technicaldesignand
development. There aremany risks associated with this category. They can vary from technical
risks such as integration and connectivity of components within a system, contradictory
specificationsorgoals,flaweddesigns,andtechnologylifecycles.
FinancialTechnology
Market
CriticalRiskFactorsinR&D
Organizational
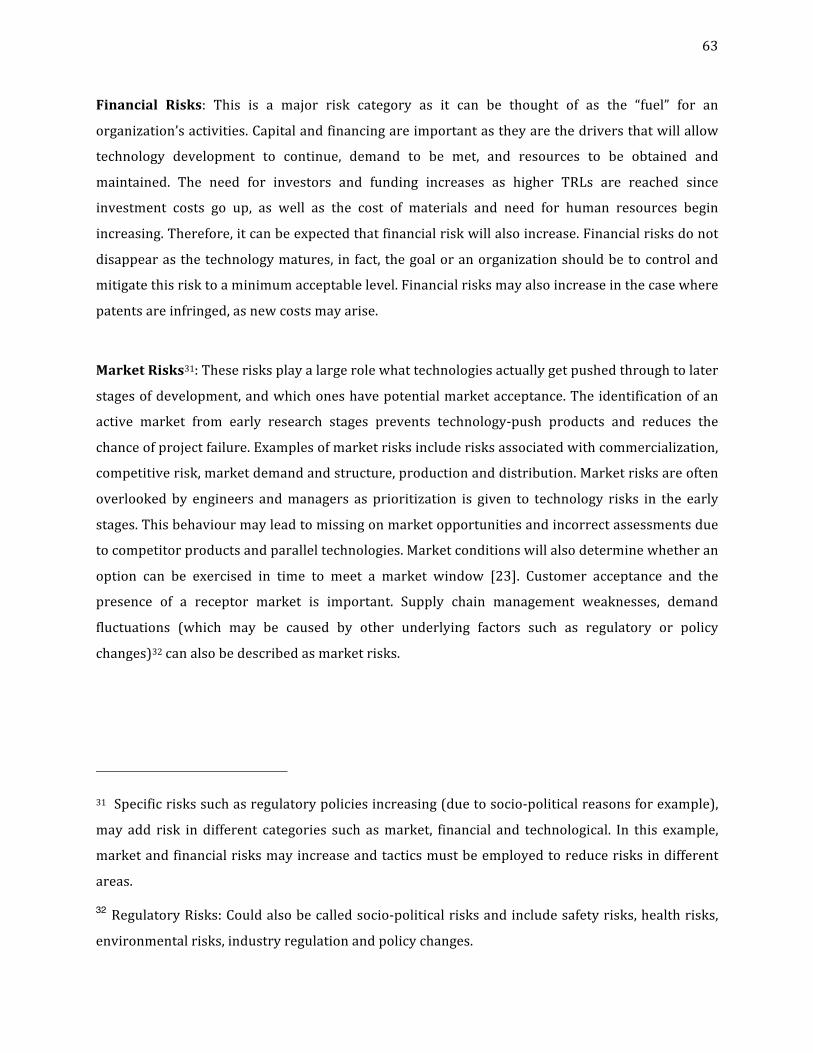
63
Financial Risks: This is a major risk category as it can be thought of as the “fuel” for an
organization’sactivities.Capitalandfinancingareimportantastheyarethedriversthatwillallow
technology development to continue, demand to be met, and resources to be obtained and
maintained. The need for investors and funding increases as higher TRLs are reached since
investment costs go up, as well as the cost of materials and need for human resources begin
increasing.Therefore,itcanbeexpectedthatfinancialriskwillalsoincrease.Financialrisksdonot
disappearasthetechnologymatures, infact, thegoaloranorganizationshouldbetocontroland
mitigatethisrisktoaminimumacceptablelevel.Financialrisksmayalsoincreaseinthecasewhere
patentsareinfringed,asnewcostsmayarise.
MarketRisks31:Theserisksplayalargerolewhattechnologiesactuallygetpushedthroughtolater
stagesofdevelopment,andwhichoneshavepotentialmarketacceptance.Theidentificationofan
active market from early research stages prevents technology-push products and reduces the
chanceofprojectfailure.Examplesofmarketrisksincluderisksassociatedwithcommercialization,
competitiverisk,marketdemandandstructure,productionanddistribution.Marketrisksareoften
overlooked by engineers andmanagers as prioritization is given to technology risks in the early
stages.Thisbehaviourmayleadtomissingonmarketopportunitiesandincorrectassessmentsdue
tocompetitorproductsandparalleltechnologies.Marketconditionswillalsodeterminewhetheran
option can be exercised in time to meet a market window [23]. Customer acceptance and the
presence of a receptor market is important. Supply chain management weaknesses, demand
fluctuations (which may be caused by other underlying factors such as regulatory or policy
changes)32canalsobedescribedasmarketrisks.
31Specificriskssuchasregulatorypoliciesincreasing(duetosocio-politicalreasonsforexample),
may add risk in different categories such asmarket, financial and technological. In this example,
marketandfinancialrisksmayincreaseandtacticsmustbeemployedtoreducerisksindifferent
areas.
32 RegulatoryRisks:Couldalsobecalledsocio-politicalrisksandincludesafetyrisks,healthrisks,
environmentalrisks,industryregulationandpolicychanges.
64
Organizational Risks: These risks are characterized by the organizational structure, leadership
available,stakeholders,andtheorganization’sculture[72].Theserisksresult fromfailed internal
processes, includinghumanresourcesandorganizationaldynamics.PoorselectionofR&Dteams,
talentacquisitionandretentionandthedomainknowledgeofteamsduringkeystagesofconcept
development.Weakprotectionandmanagementofintellectualpropertyrightscanalsobeasource
oforganizationaluncertaintyandweakness.
Figure16.CriticalRiskFactorsDuringStagesofDevelopment[Adaptedfrom[140]]
It is important to understand that these risk categoriesmay be correlated. For example, during
TRLs4 to6, technologydevelopmentrisksshouldbegin todecreaseasactive learningcontinues,
knowledge is gained, and technical risks are defined and controlled.However, intensive physical
modeling and prototyping require large financing requirements, this is turn increases financial
risks, since the lack of financing threatens the quality of work and ability to complete tasks
required.This,inturn,mayincreasetechnologyrisksinceprogressmaybestoppeduntilfinancing
is obtained. It is critical to note that the consequences of any one of these risks could be
catastrophic to the entire likelihoodof successof theproject, as risks are interrelated. Figure16
illustrateshowclassesofriskmaychangeacrossthestages.Therelativemagnitudeoftheclassesof
risksisnotaccuratelydepictedinFigure16.Thisisdiscussedlaterinthissection.
65
Understanding relative risk creates a frame of reference for determining the effort that may be
required tomitigatemajor risks that changeas theprojectevolves.Technologyandmarket risks
aremorecloselyrelatedthanonewouldthink,astechnicalrisksaresometimesdependentonthe
knowledgeavailableaboutmarketssincetechnologyspecificationsareoftenconstrainedbymarket
opportunities.Therefore, themoremanagementunderstands themarket, the lower the technical
risk may be [78]. Financial risks could also be correlated with market risks, as well as
organizational risk. For example, market demand could increase, but because of financial
constraints (reduced margins) or organizational inabilities to meet demands, overall profit
decreaseswhich in turn increases financial risks.Theserelationshipsshouldbeconsideredwhen
organizationsbegin tobuild theirprofitmodelsduring their financialanalysis. It isnecessary for
management to consider suitable strategies during the analysis. The motivation behind the
selectionofthesestrategiesisoutofthescopeofthisthesis.
Figure17illustratestheriskprofilesofmajorrisksandtheirrelativemagnitudesduringstagesof
development.BytheendoftheTRL9,thegoalofmanagementshouldbetoreducetheriskswhere
theytaperofftoanacceptablecontrolledlevel.It isvaluabletounderstandhowrisksbehaveand
the relativedegreeofprominenceas it canalloworganizations tobettermanage these risksand
establishresourcerequirements.PlanningiscriticalinR&Dandstart-upsbecausethesefirmsface
challengesdue to sporadic cash flows,which can cause limitationson their ability toprogress to
higherTRLs.

66
Figure17.Riskprofileofmajorrisksduringtechnologydevelopment
Technology risk is expected to be high in the early stages of fundamental research and applied
research.Theriskofmissingamarketneed,incorrectscale-up,andconflictingrequirementsexist
during this period. Technology risks begin to decrease as technological capabilities grow around
TRL 4 and 5. This risk decreases with time and maturity, however at the time of launch
(implementation), it can be expected to increase slightly. This is due new system bugs, glitches
commonly seen with new technologies [26]. The scale up/commercialization and market
entry/production stages reached cause a shift in the nature of risks. Financial risks and
organizationalrisksareexpectedtoincreaseduetothefollowing:asthestart-uptriestogrow,this
becomesariskypointduringthelifeoftheprojectashavingenoughcapitalandaccesstohuman
resources (organizational) becomes vital. This implicates start-ups to streamline these business
processesquickly(leanoperationsaswell)astheyhavelimitedavailableresources.Thefocusisno
longerontechnologyinnovationandknowledgecreation,instead,itshiftstoproductcreationand
theknowledgedomainrequiredandnatureofmanagerialcompetencieschanges.Therebecomesa
needformarketexpertisewherecustomersareacquiredandretained.
CommercializationBasicResearch TechnologyDevelopment
High
Low
Risk
Time
Implementation
Science&Technology
Financial
Organizational
Market
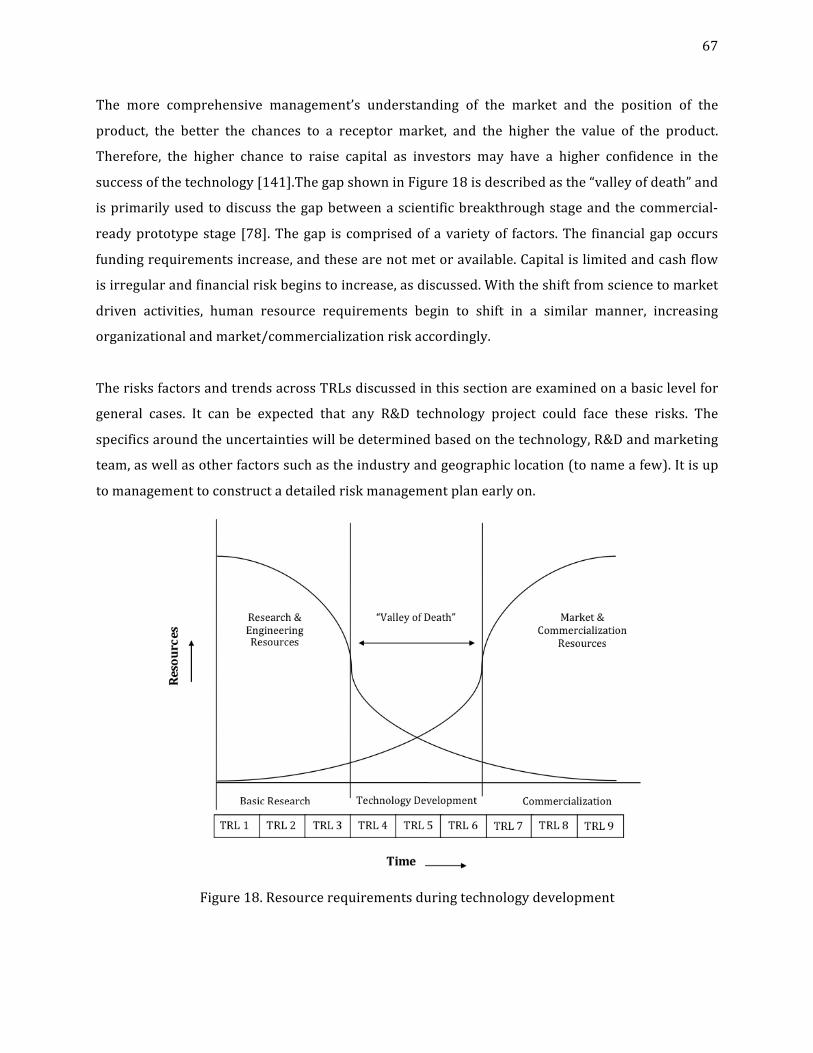
67
The more comprehensive management’s understanding of the market and the position of the
product, the better the chances to a receptor market, and the higher the value of the product.
Therefore, the higher chance to raise capital as investors may have a higher confidence in the
successofthetechnology[141].ThegapshowninFigure18isdescribedasthe“valleyofdeath”and
isprimarilyusedtodiscuss thegapbetweenascientificbreakthroughstageandthecommercial-
readyprototypestage [78].Thegap is comprisedofavarietyof factors.The financialgapoccurs
fundingrequirementsincrease,andthesearenotmetoravailable.Capitalislimitedandcashflow
isirregularandfinancialriskbeginstoincrease,asdiscussed.Withtheshiftfromsciencetomarket
driven activities, human resource requirements begin to shift in a similar manner, increasing
organizationalandmarket/commercializationriskaccordingly.
TherisksfactorsandtrendsacrossTRLsdiscussedinthissectionareexaminedonabasiclevelfor
general cases. It can be expected that any R&D technology project could face these risks. The
specificsaroundtheuncertaintieswillbedeterminedbasedonthetechnology,R&Dandmarketing
team,aswellasotherfactorssuchastheindustryandgeographiclocation(tonameafew).Itisup
tomanagementtoconstructadetailedriskmanagementplanearlyon.
Figure18.Resourcerequirementsduringtechnologydevelopment
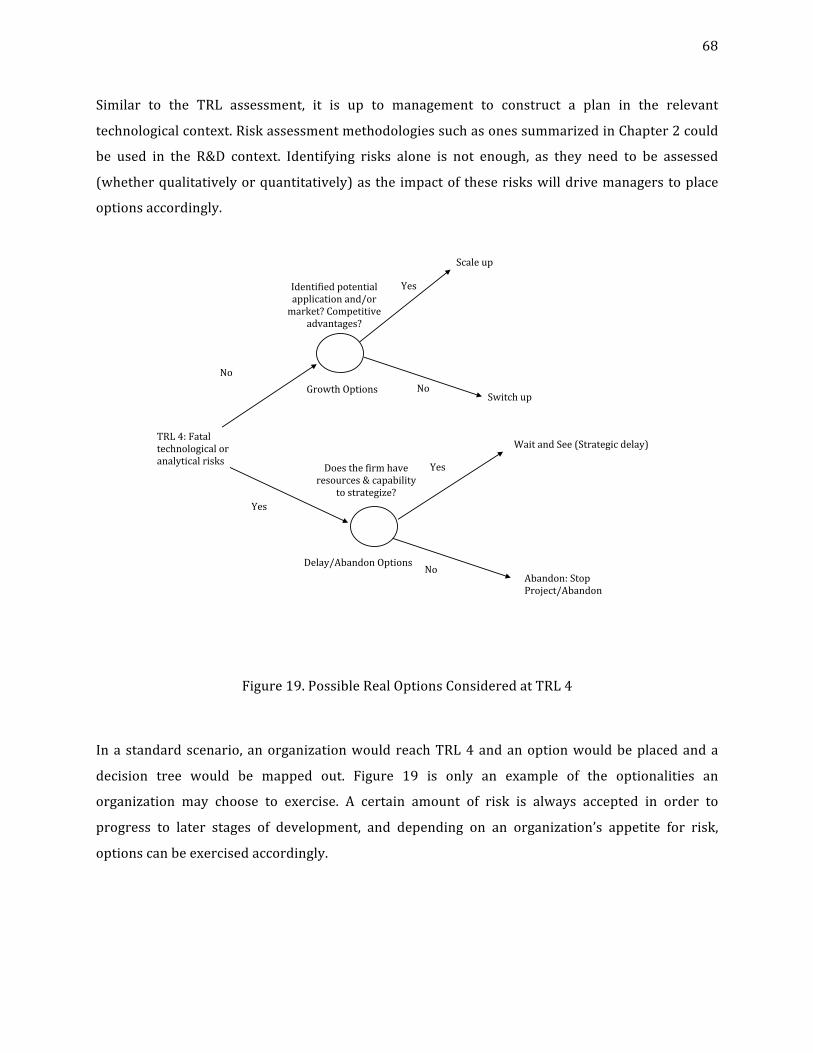
68
Similar to the TRL assessment, it is up to management to construct a plan in the relevant
technologicalcontext.RiskassessmentmethodologiessuchasonessummarizedinChapter2could
be used in the R&D context. Identifying risks alone is not enough, as they need to be assessed
(whetherqualitativelyorquantitatively)asthe impactof theseriskswilldrivemanagerstoplace
optionsaccordingly.
Figure19.PossibleRealOptionsConsideredatTRL4
Ina standardscenario, anorganizationwould reachTRL4andanoptionwouldbeplacedanda
decision tree would be mapped out. Figure 19 is only an example of the optionalities an
organization may choose to exercise. A certain amount of risk is always accepted in order to
progress to later stages of development, and depending on an organization’s appetite for risk,
optionscanbeexercisedaccordingly.
Scaleup
GrowthOptions Switchup
TRL4:Fataltechnologicaloranalyticalrisks
Yes
Abandon:StopProject/Abandon
Identifiedpotentialapplicationand/ormarket?Competitive
advantages?
Yes
No
Doesthefirmhaveresources&capability
tostrategize?
No
Yes
Delay/AbandonOptions
WaitandSee(Strategicdelay)
No
69
3.5Phase3:RealOptionsAnalysis
The previous sections outlined the qualitative portion of the framework. At this point of the
analysis, there should be a basic understanding of the important stages of development the
technologywillhave togo throughand the important logical stops that signify the change in the
natureofthedevelopmentandrisksassociated.Withanylongandriskyhigh-technologyandR&D
project, management should establish well-defined connections between the investment
opportunityandarealoptionbyproperlyframingtheproblem.Then,theoptioncanthenbevalued
[142].
GeneralconsiderationsforROvaluationcanbesummarizedasfollows:
• Themorevolatileaproject,theriskierit isandtheriskofsuccessandriskoffailureareboth
increased.
• Whenprobabilitydistributionfunctionsarenotavailablefromanalogouspriorprojects,expert
opinionisusedtodevelopestimatesofprobabilities.
• Plans to improve estimates as project proceeds should be made and the analysis should be
revisitedasdecisionsareincorporated.Thisapproachisiterative.
• Allassumptionsneedtobestatedsothatdiscussionswithstakeholdersareonacommonbasis
ofunderstanding.
3.5.1Base-CaseDiscountedCashFlow&SensitivityAnalysis
As discussed in Chapter 2, the forecast revenues produced through the use of DCF are highly
uncertainandunreliablefornewtechnologydevelopmentprojects.DCFcalculationsarestillused
asabase-casewhereassumptionscanbedevelopedandappliedfortheROanalysis.Withlimited
data and financial history for new start-ups and technology projects, accurate estimations and
rationalassumptionsarecriticalindrivingthedecisionsinthelaterstagesoftechnologyprojects.
The valuation begins by conducting DCF and NPV calculations for projects that have passed the
qualitativescreening[7]andinitialplanningstagesofthetechnology.Equationsusedtocalculate
theNPVarein2.4.1.Thenumberofyearsusedtoforecast,aswellasthediscountratesused,areup
to the discretion of themanagers. A particular challengewhen calculating DCF is estimating the
weightedaveragecostofcapital(WACC)whichisoftenusedasthediscountrate.
70
General practice assumes that the entire firm and the project share the same risks, and this
approach is not appropriate for innovative technology programs. This means that management
mustuse their judgement in selecting theproject’s discount rate [110]. Estimating theminimum
acceptable rate of return (MARR) for a new start-up is also a challenge in the early stages of a
technology when an organization does not yet know parameters such as administrative and
overheadcostsanddonothaveanypositivecashfloworrevenue.
AsensitivityanalysisshouldbecompletedfortheDCFtogiveasnapshotofthevariabilityofprofit
and other parameters. The analysis should be completed for key variables, with special
considerationtothedrivingriskfactorsidentifiedalongtheTRLs.Thesensitivityanalysisscenarios
chosenbymanagementshouldbebasedonthe“what-ifs”ofperceivedrisksandtheirinfluencethe
variables.TheeffectsonthesevariablesarethennotedandthechangesinNPVvaluesaretracked.
Sensitivityanalysisresultsmaydrivethestrategicoptionsplacedduringthecourseoftheproject.
3.5.2Monte-CarloSimulation
The Monte-Carlo simulation is an extension of the sensitivity analysis where continuous
distributionscanbemodeledgivingmanagersafullrangeofvariabilityofparameters.Theoutputs
of the simulation provide important insight into the behaviour of variables andmay be used as
inputs for the RO valuation. The application of a Monte-Carlo simulation can be challenging for
early-stagetechnologiesasthereislimitedinformationthatcanbeusedtoproducereliableresults.
ThisisdiscussedinmoredetailinChapter4ofthecasestudy.Thisisanoverviewoftheapplication
asitassumedthereaderiswell-versedwithbasicprobabilisticmethods.Theprocessisthesystem
model,where themodel could be a profitmodel in the case ofmany organizations thatwant to
reachhigherTRLs.Theuncertaintyintheparametersisestimated.Theassumptionsforthe“worst-
case” and “best-case” scenarios from the sensitivity analysis can be carried and used for the
simulation.Thiscanbereflectedintheassignedupperandlowerboundsofthevariables,andother
parametersassociatedwithselecteddistributions.Probabilitydistributionsforinputvariablesare
oftenusingempiricaldata,actuarialdataorothersystemmodels[143].Thiscanbechallengingfor
R&Dwhenthereisnodataavailable.

71
Figure20.Monte-CarloStochasticUncertaintyModeling[Adaptedfrom[144]]
Asimplifiedmethod todeterminedistributionscanbedonebyexaminingavariable’s conditions
based on the analysis conducted in the previous stages of the analysis. Distributions are either
continuous or discrete. For parameters that can possess negative values such as NPV, a normal
distributioncanbeassigned.Forparametersthatcannotpossessnegativevaluesbutincreasewith
nolimitorbecomepositivelyskewed,alognormaldistributionmaybeassigned[129].Forvalues
whereminimum andmaximummay occurwith equal likelihood, a uniform distributionmay be
assigned.Forvariablesorscenarioswhereaminimum,maximumandmost-likelyvaluesmayoccur
(themost-likelyfallssomewherebetweenthetwofixedbounds),atriangulardistributionmaybe
assigned [7]. These distributions do not represent a complete list and aremere examples of the
commonlyuseddistributions.However,otherdistributionsmaybeused.Ahome-grownsimulation
tool canbeused inMicrosoftExcel,MATLABoranyother commercial simulation toolwhere the
numberoftrialscanbeselected.Thesimulationoutputyieldsanestimateoftheprobabilityofthe
NPV, a stochastic DCF distribution [143]. As discussed in previous sections, variables may be
correlated.Thesecorrelationsarenotaccountedforinthisframework.
Model
f(x)
y1 y2yn
x1x2 xn
72
3.5.3RealOptionsProblemFraming&OptionValuation
Atthisstageoftheanalysis,managementshouldhaveagoodunderstandingoftheelementsofrisk,
theirvariabilityandtheeffectonprofit.Actionneedstobetakentonotonlymitigatethedownside
oftherisksbutalsotakeadvantageoftheupswings.
Byframingtheproblemduringthequalitativestagesofassessment,strategicoptionalitiesatTRLs
becomemoreapparent,asmoreknowledgeisgained[133].Atechnologydevelopmentprojectcan
be considered as a series of optionswhere each stage is an option on the value of future stages
[145]andmostdevelopmentswillhavemorethanoneoptionapplicabletothematonestageand
all need to be consideredduring valuation [6][96]. Thenature of the options considered at each
TRLdepends on these risk elements’ effect on themodel.Managers should be proactive in their
approach to R&D planning. The options considered, and ultimately selected, are ones that are
deemedtomaximizethevalueofatechnology.Thiscouldbeobservedduringashorttimeframeor
over a longer period (for example, for the delay option). Ultimately, their goal should be to
competitivelycapturemarketopportunities,whichrequirescarefulconsiderationof thepotential
endusersandmarketlandscapeandwarrantsmarketexpertise.
Thisframeworkutilizesthebinomiallatticeapproach(discussedinChapter2),astheyareeasyto
implement,flexible,andsimpletoexplaintomanagement[7].Inaddition,mostmanagerswithout
technicaltraininginrealoptionswouldfindthebinomialtreerepresentationstraightforwardand
the modeling of problems to have a more intuitive appeal, as well as the ability to include
underlyinguncertaintiesandaligningtheoptionsmoreeasilythanotherapproaches[110].Figure
21isarepresentationofasimplebinomiallatticethatisusedtovalueanoption.
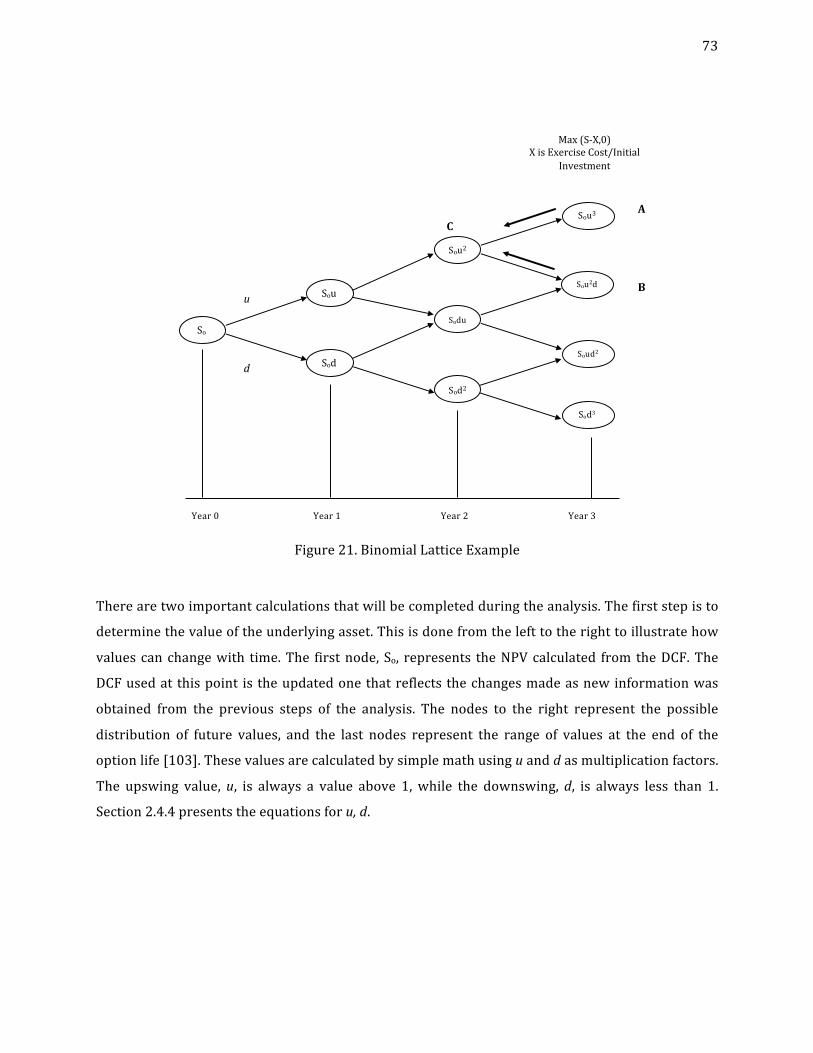
73
Figure21.BinomialLatticeExample
Therearetwoimportantcalculationsthatwillbecompletedduringtheanalysis.Thefirststepisto
determinethevalueoftheunderlyingasset.Thisisdonefromthelefttotherighttoillustratehow
valuescanchangewith time.The firstnode,So, represents theNPVcalculated fromtheDCF.The
DCFusedatthispoint is theupdatedonethatreflectsthechangesmadeasnewinformationwas
obtained from the previous steps of the analysis. The nodes to the right represent the possible
distribution of future values, and the last nodes represent the range of values at the end of the
optionlife[103].Thesevaluesarecalculatedbysimplemathusinguanddasmultiplicationfactors.
The upswing value,u, is always a value above 1,while the downswing,d, is always less than 1.
Section2.4.4presentstheequationsforu,d.
u
So
Sou
Sod
Sodu
Sou2
Sod2
Sou3
Sou2d
Soud2
Sod3
d
Year0 Year1 Year2 Year3
A
B
C
Max(S-X,0)XisExerciseCost/Initial
Investment
74
Usingthebinomialmodeltocalculatevaluessuchasu,dandp(s)ischallengingforearlystageR&D
projects.Thesevaluesarea functionofvolatility,whichcannotbecalculated formost innovative
technologyprojects.Fromvolatility, theprobabilityof success,p(s), canbeestimated.Becauseof
thelimiteddataavailablefortheseprojects,managementshouldexpecttoestimatetheprobability
of success during the early stages. At low TRLs, estimating p(s) = 0.5may be accepted by some
managersandinvestors.TheentirepremiseofstrategicROapplicationistodrivethevalueofthe
projectwith time. This should overall improve the conditional probability of success in the later
stages.Thisisveryimportantasmarketrisksbecomemoredominantduringthelaterstagesandif
improvementsinp(s)arenotobserved,abandonmentbecomesanoption.
Thenextstepisthelatticevaluation–alsoreferredtoasbackwardinduction[112](arrowsgoing
righttoleftfromthetoprightnodeshownonFigure21).Thisprocessdetermineswhattheoptimal
decision(oroptionvalue)isateachperiod[112].Eachterminalnodehasvaluesofthemaximumof
zeroandthedifferencebetweenvalueSandexercisecostX(orinvestmentcost),whereMAX(S–X,
0). If thisdifferencebetweenSandX isnegative, then this iszeroandconsideredasanabandon
option.Thisisdonetoeachpairofverticallyadjacentnodesrevealstheoptionvalueattheveryleft
endofthelattice.
Whenestimatingvaluessuchastheprobabilityofsuccess,itcanbeexpectedthatthiswillbelowat
lowerTRLs.Thevalueofexercisinganoptionandacceptingtherisk,isastrategytolowerriskas
thetechnologyprogressesalongtheTRLscale.Thus,intuitivelyincreasingvaluefortheprobability
ofsuccess.Closertoimplementation,theprobabilityofsuccessbecomesmoreunderstoodthanthat
intheexploratoryphase.Estimatesofthelikelihoodofsuccessfuldevelopmentofatechnologycan
beestimatedfromstatistics,anddata fromcomparableprojectswithinaportfolio,which ismore
likely ina largeR&D-intensiveorganization.Inthecasewherethis isnotpossible,seekingexpert
adviceisacommonpracticetoobtaintheseestimates[93].Thisisaniterativeprocessandasmore
informationbecomesknown,calculationsandassumptionsshouldberevisited.
Other considerations are to develop metrics for non-economic factors that influence an
organization’sreputation.This isofparticular importance forgovernmentresearchorganizations
and smaller start-ups that need to build relationships with clients and their respective
communities.
75
Unlikefinancialoptions,ROsdonothaveexpirationdates.Generallyspeaking,managersshouldbe
able toestimatea time-frame forwhenthedecisionneeds tobemadeandbecauseofchanges in
businessconditions,competitionandtechnology,checkpointsthroughouttheprojectareneeded,
andshouldbeplacedaccordingly[104][103].Thisstrengthenstheframework’sneedforoptionsto
beplaced(atleast)atstage-gatesidentifiedintheprevioussection.
SimilartothesensitivityanalysisconductedontheDCF,managersshouldanalyzethevariabilityof
theoption.Thevalueinthisanalysisitwillhelpestimatetherangeofthebenefits,theprobabilityof
successoftheresearcheffort,thecosttoimplement,andthemarketuncertainty.
TheoutcomeoftheentireROanalysisshouldgivejustificationtomanagerialdecisionstoinvestina
technology, despite a negative NPV. This can also allow for better resource allocation across a
projectorportfolio.
76
Chapter4ApplicationtoCaseStudy:CopperstoneTechnologies
Thischapter isa casestudyonCopperstoneTechnologies (CST),where theproposed framework
willbeapplied.Thechapterwillbeginbyintroducingbackgroundinformationrelatedtothecase
study.Theanalysiswillbedividedintothreephases.Phase1willdiscusshowrelevantinformation
wascollectedandsummarizethedata.Phase2willdiscusstheresultsfromphase1,outlinemajor
risks,anddiscusscurrenttechnologicalmaturity.Phase3willapplyROthinkinginordertoassess
decisionsatkeystagesoftheproject.
Not all aspects of the proposed framework were formally completed. This includes a formal
documentedriskassessmentandaTRA.Thiswasduetothe limitedaccesstodata fromCSTand
what information theywerewilling to share for this thesis. Despite the limitations, critical risks
were identified and discussed in 4.2.2. The analysis will conclude by discussing some of the
limitations of the calculations and assessments and how they could be improved for future
applicationsthatarespecifictoCST.
Ashortsectionofthischapterwillbrieflydiscusshowtheframeworkcouldbeappliedtoaproject
withinalargeportfolioatNationalResearchCouncilofCanada.Unfortunately,afullanalysiscould
notbecompletedastherewasnoinformationavailableaboutthetechnology,projectsorportfolio.
Importantpointsabouthowtheframeworkcanbeusedasacomparativeassessmenttoolwithina
portfoliowillbediscussedforfutureapplications.
4.1Phase1:DataCollection&Background
The main challenge of the analysis for this case study was collecting enough data. Available
information was very limited and CST was going through many changes within their company,
where new talent was being acquired and investors were aggressively being sought after. This
madeitdifficulttoobtaininformationefficiently.
77
The main method used for information gathering was through informal discussions with CST’s
ChiefTechnologyOfficer(CTO)33.Thesediscussionshelpedshapetheoptionalitiesconsideredand
the estimated values. The remaining portion of data collectedwas through ameetingwith CST’s
business development manager, and a thesis published by one of CST’s founders. The thesis
discussed details around the technology developed and some of the team challenges. Any other
miscellaneousinformationwasobtainedthroughonlinesourcesfromCST’scompanywebsite.
4.1.1CompanyBackground:CopperstoneTechnologies
CopperstoneTechnologies(CST)isanengineeringstart-upfoundedin2014bythreeUniversityof
Alberta students. CST currently develops amphibious robots (AR), they also offer electrical,
mechanical, and consulting services related to the field of robotics. CST currently has office
locations in Edmonton and Calgary, Alberta, Canada. The current team is comprised of four
founders, and a business development manager – who is responsible for all marketing, sales &
businessstrategyrelatedwork.AfulldescriptionofCST’scurrentteambiosandthepositionsthey
are looking to fill in thenear futureare inAppendix2.CST is currentlydevelopingstrategies for
futuregrowthopportunitiesinmarketingandsales,customerservice,andproductdevelopment.A
summaryoftheirtimelineofactivitiesisinAppendix2.
CST’smain product offering is the AR technology. This technology allows access to soft andwet
fresh tailings ponds that are inaccessible using current sampling andmeasuring equipment. The
rover is unmanned and therefore poses a lower risk to personnel safety when compared to
traditionallyusedequipment[146].TheARtechnologyalsorequireslesspersonnelsupportoverall
andprovidesautonomousoperationforsamplingandmeasurements.TheARcanbeusedforseed
broadcasting and planting for reclamation, and tailings mapping and monitoring. CST’s main
potential customers are oil sands producers, and they are looking at applications that target
customersinthemining,goldandpotashindustry[147].
33CST’scurrentCTOisDr.Lipsett.
78
CST has been awarded one patent for their “Soft Soil Sampling Device and System” on June 16,
2016.Thescopeofthispatentprotectsadevicecollectingsurfacesamplesneededforcalibrations
forother instrumentsandtomeasuretailings’properties.Thepatentalsoprotects themethodof
deployment. They also have another pending patent filed in 2016, “All-terrain Vehicle”, which
protects the frame, instrumentdeploymentanddriveconfiguration,andanymodifications to the
drivesystem.CSTplanstoacquiremorepatentsasthetechnologydevelopsfurther.Theaimisto
protect all new drive and control mechanisms for operations in soft terrains, autonomous
operations of robots and their instrumentation for monitoring and data processing algorithms
[146].
4.1.2InterviewwithBusinessDevelopmentManager
Ameetingwith CST’s current business developmentmanagerwas conducted. Thismeetingwas
valuableas itrevealed informationaboutCST’s futuregrowthplans,marketing,andsalestargets.
Someofthekeytakeawaysfromthemeetingwere:
• Thelargestriskispoorrevenuegeneration.
• Latent causes of potential failures were discussed. Competition, market scale-up, and legal
regulatoryrequirementswereconcerns.
• The initial market analysis conducted was almost non-existent. Now requiring a rigorous
approachtosizethemarketandacquire(andmaintain)customers.
• CSTiscurrentlylookingforinvestors.
• Conflicting team goals is a large risk. The risk of founders leaving may be unfavorable to
investorsandcanbeseenasunstable.
• MarketscalingofARhasbeenaconcernforCST.
• CST iscurrentlyconsidering the followingcommercializationandmarketpositioningoptions:
salesofARunits,licensingofIP,orenvironmentalmonitoring.
• An informal market risk assessment for CST’s current positioning was done. There was no
formaldocumentation.
• CSTiscurrentlyfieldtestingwithalmostallcomponentsfullyintegratedwithinthesystem.
• CSThasonecompetitorintheenvironmentalmonitoringmarketintheoilsands.
79
TheultimategoalistothepenetratetheAlbertatailingpondsmarketandgrowthecompanywhile
continuingtoinnovate.TherewasnoinformationobtainedaboutCST’ssalesandrevenuetargets.
Maximizationofprofitpotentialwasan important factor forCST.Therefore,aconsistentrevenue
stream is preferable. Selling AR units may not be the most viable opportunity for CST due to
potential inconsistent revenueassociatedwith sales.Theorganizationdoesnothaveanycurrent
plans, or the resource capability to expand to othermarkets at this time. This, however,will be
considered in the future.CurrentARunitsarebuilt in-house,butCSTmaysourcemanufacturers
dependingonthedemandandchosencommercializationpath.Thebusinessdevelopmentmanager
was only recently hired, this indicated that therewere no realmarket considerations or studies
done.CSTplansonexpandingtheirhumantalentbaseandplansongrowingtheteam.Thereisalso
aneedforfundinginordertogrowandCSThasbeenworkingtotryandsecurefuturefunding.CST
alsohasplansfornewversionsoftheAR,withanexpandedrangeofapplications.Thiscouldbring
CST a new competitive advantage and can allow them to remain innovative. These future
applicationswillnotbeconsideredintheanalysis.Managerialvisionsandgoalswerediscussed,as
therewasadifferenceinopinionbetweenthefoundersonthebestcommercializationpathforAR.
Majorriskfactorsthataffectsuccessfulcommercializationwerediscussed.Moreontheserisks in
4.2.2.A sampleof the interviewquestions is inAppendix2.Thesequestionsarebynomeansan
exhaustivelist,buttheydosummarizesomeofthequestionsthatwereasked.
4.1.3InformationfromRelevantSources
OthersourcesofinformationusedincludedathesispublishedbyoneofthefoundersofCST,which
involved a case study on the AR project [148]. Detailed notes from the thesis are presented in
Appendix2.
Someofthekeypointsfromthecase-studyincluded:
• CST’s business model was not developed at the beginning of the project. Although
commercializationmodelsconsideredincluded:salesofARunits,rentalofARunits,leasingto
operators,ormonitoringservices.
• TherewashighuncertaintyinrequirementsandtechnicalrisksbecauseCSTfailedtoproperly
plan,collectdata,andassesstheoperatingenvironment.Thisledtoadecreaseinthetechnical
successoffieldtrialsconductedandresultedinfield-testingbeingdelayed.Thiscauseddelays
inthescheduleandbudgetoverruns.
80
• No formal market analysis or verification of market conditions was conducted. CST’s initial
marketanalysiswascompletedusingqualitativedatafromasmalldataset.Thereweremany
uncertaintiesrelatedtothemarketastherewaslimitedunderstandingoftherequiredtechnical
specifications wanted by customers. CST collaborated with potential customers through
informaldiscussionstotryandestimatethesespecifications.Thepotentialprimarymarketfor
ARsis inenvironmentalmonitoring,withonlyasmallnumberofpotentialclients,buta large
amountofpotentialapplication(land).
• Therewasnoformalriskmanagementcompletedduringdesign.However,safeworkpractices
andriskmitigationwereconductedduringfabricationandtesting.
• The project funding came internally fromwithin the organization. Therefore, available funds
werelimited.
ConversationswithCST’scurrentCTOalsorevealedthatCST’sARprojectbeganataroundTRL4
and is currently about to enterTRL734.Thiswasachieved throughan informalTRLassessment.
BasicfinancialprojectionswereobtainedfromCSTfortheROA.Thevaluesshownintheworkdone
in this sectionmay not reflect the true values for the AR project as CST did not share all their
financialsforthisthesis.CST’sfinancialsarediscussedin4.3.
4.2Phase2:CurrentTRLandCriticalRisks
Thissectionassessestheinformationanddatacollectedfromphase1.Aspreviouslymentioned,no
formalriskassessmentorTRAwasconducted.However, itwasrecommendedtoCSTthat formal
assessments be completed and documented. The assessment process should identify alternative
routes in the case the technology does not mature according to initial plans. TRA and risk
assessmentsshouldbeconductedthroughouttheprojectandnotjustatstage-gates,althoughthose
provideageneralrecommendationofwhenprojectprogressneedstobeassessed.
34AsofJuly2017.
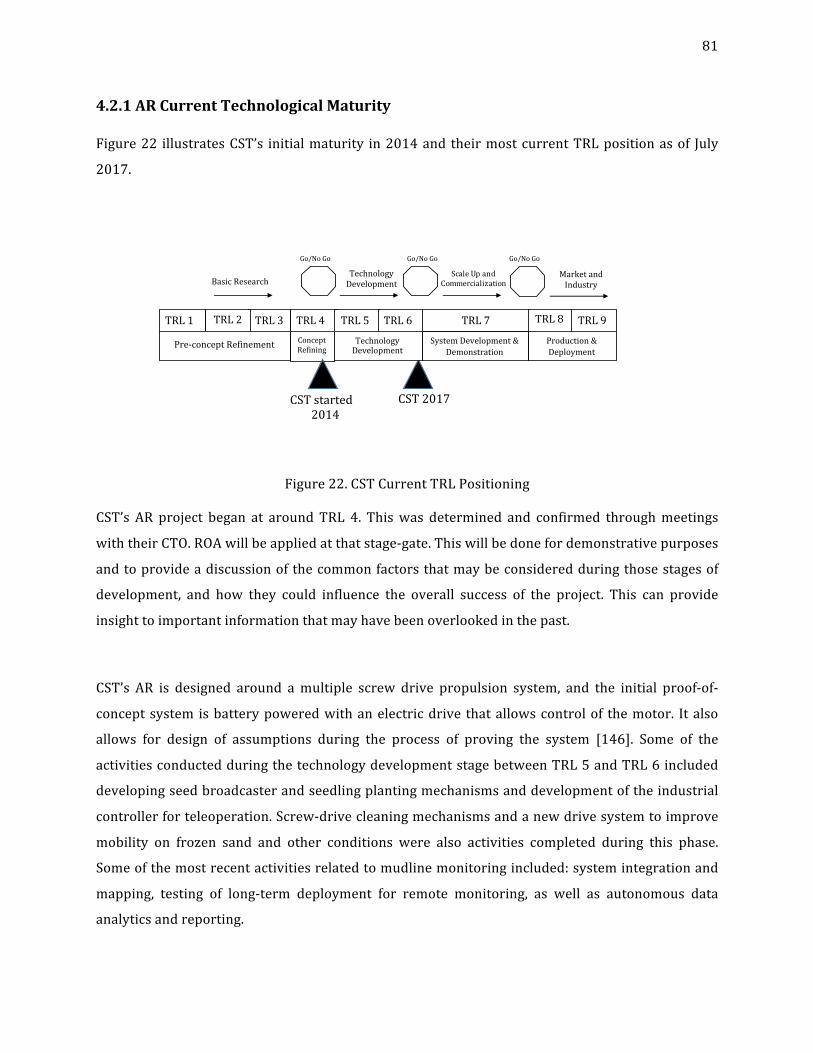
81
4.2.1ARCurrentTechnologicalMaturity
Figure22 illustratesCST’s initialmaturity in2014and theirmostcurrentTRLpositionasof July
2017.
Figure22.CSTCurrentTRLPositioning
CST’s AR project began at around TRL 4. Thiswas determined and confirmed throughmeetings
withtheirCTO.ROAwillbeappliedatthatstage-gate.Thiswillbedonefordemonstrativepurposes
andtoprovideadiscussionofthecommonfactorsthatmaybeconsideredduringthosestagesof
development, and how they could influence the overall success of the project. This can provide
insighttoimportantinformationthatmayhavebeenoverlookedinthepast.
CST’s AR is designed around amultiple screw drive propulsion system, and the initial proof-of-
conceptsystem isbatterypoweredwithanelectricdrive thatallowscontrolof themotor. Italso
allows for design of assumptions during the process of proving the system [146]. Some of the
activitiesconductedduringthetechnologydevelopmentstagebetweenTRL5andTRL6included
developingseedbroadcasterandseedlingplantingmechanismsanddevelopmentoftheindustrial
controllerforteleoperation.Screw-drivecleaningmechanismsandanewdrivesystemtoimprove
mobility on frozen sand and other conditions were also activities completed during this phase.
Someofthemostrecentactivitiesrelatedtomudlinemonitoringincluded:systemintegrationand
mapping, testing of long-term deployment for remote monitoring, as well as autonomous data
analyticsandreporting.
SystemDevelopment&Demonstration
TRL7TRL1 TRL3TRL2
TRL4 TRL5 TRL6 TRL8 TRL9TechnologyDevelopment
Production&DeploymentS
yst
Pre-conceptRefinement ConceptRefining
ScaleUpandCommercializationBasicResearch
TechnologyDevelopment
MarketandIndustry
Go/NoGo Go/NoGoGo/NoGo
CSTstarted2014
201
CST2017
82
Asof July2017, theARproject is in the systemdevelopment anddemonstrationphase, about to
enter TRL 7, where some of the field-testing has been completed. According to the proposed
framework,CSTisatthesecondstage-gatewheretheywouldconsider(commercialization)options
thatwouldsupportprogresstohigherTRLs.
Future R&D activities for commercial prototyping will include optimization of the screw-drive
propulsion system, innovations for long-term reliability for longer operational durations and
samplinganddeploymentcapabilities.Inaddition,CSTplanstousehigherdensitypowersources.
TherewasnoformaltimelineprovidedbyCST,however,theaimistohaveaninitiallaunchforAR
withmonitoringsystemanalyticscapabilitiesbetween2018and2019andanotherlaunchofARfor
deepdepositsandlongerdurationsaround2019.Asfordevelopmentrequirementsforthenext2-4
years,CSTpredictsfabricationresourcerequirementswillneedtobeexpanded,andalargershop
may be needed. A laser cutter,mill, andwelderwill be required for any future prototyping and
assemblywork.CSTpredictsthatonlyoneshopemployeewillbeneeded.Anyotherfabricationor
manpowerrequirement that isnot supportedbyCST’s capabilitieswillbeoutsourced.Forshort-
term requirements, CST requires a part-time electrician, as well as a technologist that will be
neededformanufacturingandproductionneeds.
In addition to the increase in resource requirements, additional fundingwill be required. CST is
currentlyseekingnewinvestors.Theneedformarketingexpertisehasalsobeenrecognizedatthis
stage. CST’s business manager is formulating growth strategies and strategies to keep CST’s
competitiveadvantagewithinthenichemarketofoilsands.Commercializationoptionshavebeen
identifiedbutnotyetselected.Moreoneachoptionwillbediscussedin4.3.5.
83
4.2.2CriticalRiskFactors
The general risk categories are financial, science & technology, marketing and organizational as
discussedinChapter3. Inordertobetterframetheproblemtoidentifythecriticalriskfactors, it
was important to assess the information from the interview, conversations and othermaterials.
CST’sultimategoalwastolaunchtheARtechnologyintothemarketandgenerateaprofit.Although
there had been discussions about possible commercialization paths (i.e.whether theywanted to
selltheirunits,license,etc.),thechoicewasstillunclear.ThisiswherethevalueofROAiscaptured.
These commercializationoptions canbe valued so that an evidence-baseddecision canbemade.
Themainrisksthatareconsideredtohaveadirect impactonprofitarediscussedinthissection.
Theserisksarenotanexhaustive list.Theyare,however, themost importantasviewedbyCST’s
teamatthispointintime(i.e.attheTRL6stage).Table735givesabriefrepresentationoftwoofthe
risksidentifiedandtheireffectsonprofit.
A factor that has a substantial effect on themarket risk for the AR project are regulatory laws.
Provincialandfederallawsshouldstronglybeconsidered.Ifregulatorypoliciesregardingtailings
are increased, CST could potentially see an increase in the customer demand, as the technology
currentlyfallsunderthecategoryofcomplianceindustry.Conversely, ifthepoliciesarenolonger
strictandarereduced,themarketforARscanexpecttodramaticallydecrease.It isimportantfor
managementtobeproactiveforfuturedevelopmentandapplicationsofthistechnology.CSTmust
strategically plan to position their AR technology for operational use, where the technology is
criticalforimprovingefficiencyandperformance,asopposedtobeingintheregulatorymonitoring
andcompliancespace.
35Thistabledoesnotaccuratelyreflectfulltheextentofhowmulti-dimensionalriskelementsare
andhowtheymayaffectoneanother.Thisaddressedinthissection.Asensitivityanalysiscanhelp
betterunderstandthebehavioursoftheserisks.
84
An area of concern for CST at this point is related to scaling-up, as there are three aspects to
consider.Thereisaneedforthedesignprocesstoencompassaphysicalscalingoftechnologyi.e.
from lab to operating environment. There is the market aspect of scaling up, where suppliers,
manufacturers and distribution channels need to be considered. Finally, there is a performance
relatedscale-upwheredesigncomplexityisaccountedfor.
Competition in themarket is alsoan important factor thatwas identified.Because financial risks
arealsodominantthroughouttheproject(sinceR&Discapitalintensive),thereistheconcernthat
if CST does not commercialize within an appropriate time-frame and capture current market
opportunities,ARtechnologyreplicasmayariseanddamageCST’sfutureplanstolaunch.Financial
constraints are an important risk identified that may delay technology growth and delay
commercialization.FinancialrisksarecurrentlybeingmitigatedasCSTtriestoacquirefundingand
plan accordingly. It is also important to be aware that each commercialization optionwill come
withitsownrisksandchallenges.Distributionandsupplychannelconstraintsarealsoanotherrisk
that may delay or prevent successful commercialization of technology to end users. In order to
mitigatethisrisk,CSTiscollaboratingwithservicecompaniesfortheirprototypingandfield-trials,
inhopesofhavingbetteraccesstocustomers.
Demand is also another important factor. It can also be linked to regulatory policies and
competition. For example, demandmay become lower if competition is high. Demandmay also
decreaseorincreasedependingonhowgovernmentregulatorypolicieschange.Iftheyincrease,the
demandcanexpecttogoup, if theyloosenthepoliciesthendemandmaydecrease.This isavery
one-dimensionalwaytolookathowvariablesmaychangeasitignorestheeffectsofotherpossible
variables. To elaborate, demand may be high, however, profit may still decrease due to CST’s
reducedmarginorinabilitytomeetdemand.Asensitivityanalysisoramulti-dimensionalMonte-
Carlosimulationcanbeusedtobetterunderstandhowthesevariablesmightaffectoneanother.
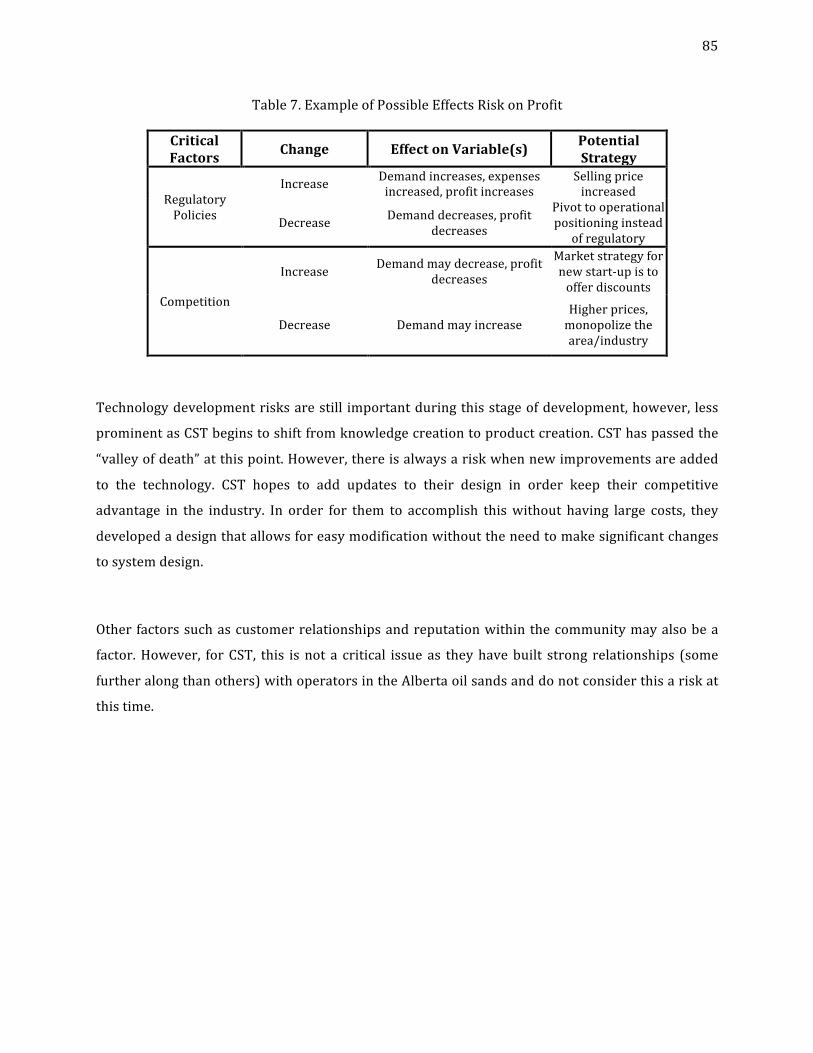
85
Table7.ExampleofPossibleEffectsRiskonProfit
CriticalFactors Change EffectonVariable(s) Potential
Strategy
RegulatoryPolicies
Increase Demandincreases,expensesincreased,profitincreases
Sellingpriceincreased
Decrease Demanddecreases,profitdecreases
Pivottooperationalpositioninginstead
ofregulatory
Competition
Increase Demandmaydecrease,profitdecreases
Marketstrategyfornewstart-upistoofferdiscounts
Decrease DemandmayincreaseHigherprices,monopolizethearea/industry
Technologydevelopmentrisksarestill importantduringthisstageofdevelopment,however, less
prominentasCSTbeginstoshiftfromknowledgecreationtoproductcreation.CSThaspassedthe
“valleyofdeath”atthispoint.However,thereisalwaysariskwhennewimprovementsareadded
to the technology. CST hopes to add updates to their design in order keep their competitive
advantage in the industry. In order for them to accomplish thiswithout having large costs, they
developedadesignthatallowsforeasymodificationwithouttheneedtomakesignificantchanges
tosystemdesign.
Other factorssuchascustomerrelationshipsandreputationwithinthecommunitymayalsobea
factor.However, forCST, this isnot a critical issueas theyhavebuilt strong relationships (some
furtheralongthanothers)withoperatorsintheAlbertaoilsandsanddonotconsiderthisariskat
thistime.
86
4.3Phase3:ROAApplication
TheapplicationofROA to theARproject assessesdecisions at two stages-gates.AlthoughTRL4
wasreachedinthepast,ROAwillstillbeappliedatthatstage-gate.Thiswillprovideadiscussion
onkeyfactorsassociatedwiththisstageofdevelopment.AttheTRL6stage-gate,optionsshouldbe
valuedbyCSTwherethedecisiononwhethercommercializationcostswillbepaidoutrightaway
or whether timing of the investment (waiting) may be an option. The trade-offs between
proceedingrightawayorachoosingtowaitcanbeaconsideredandevaluated.
4.3.1ROAProblemSet-up
Thefollowingwereassumptionsandconsiderationsappliedduringtheentireanalysis.Thesewill
remain consistent and be carried to the next steps of the analysis. Any changes to these
assumptionswill be noted in the relevant sections. The general assumptions and considerations
are:
• AllthefinancialsarebasedoninformationprovidedbyCST.Thebasefinancialevaluationswill
notbechanged(i.e.CST’sestimationforexpenses,grossrevenue,etc.).Thisisbecausethere
wasnotenoughinformationprovidedforthisthesis.Therefore,itisassumedthatCST’scurrent
plans,whichmayincludefield-testingwithcustomers,newR&Dinvestmentswillcontinueas
originallyplanned.TheROAwilladdontothebasefinancialsforCST(i.e.costsassociatedwith
optionswillbeaddedtotheoriginalestimatedexpenses).
• Allrevenueandexpensesfromconsultingactivitieswereomittedfromtheanalysis.Thisisnot
a core element of the AR project, and the revenue is considered minuscule compared to
potentialrevenuefromAR.
• Equityandfinancingwerealsoignoredduringtheanalysis.Thisismainlyduetounavailability
ofinformationaboutCST’scurrentandpreviousfinancingactivities.
• Year0at2014isthefoundingyearofCSTwheretheybeganatTRL4.AWACCof15%wasused
and a MARR of 20%. The WACC and MARR values were selected based on CST’s business
manager’s recommendation. A nine-year cash flow was completed. There is no underlying
reasonwhynineyearswereselected,thiswasCST’spreference.
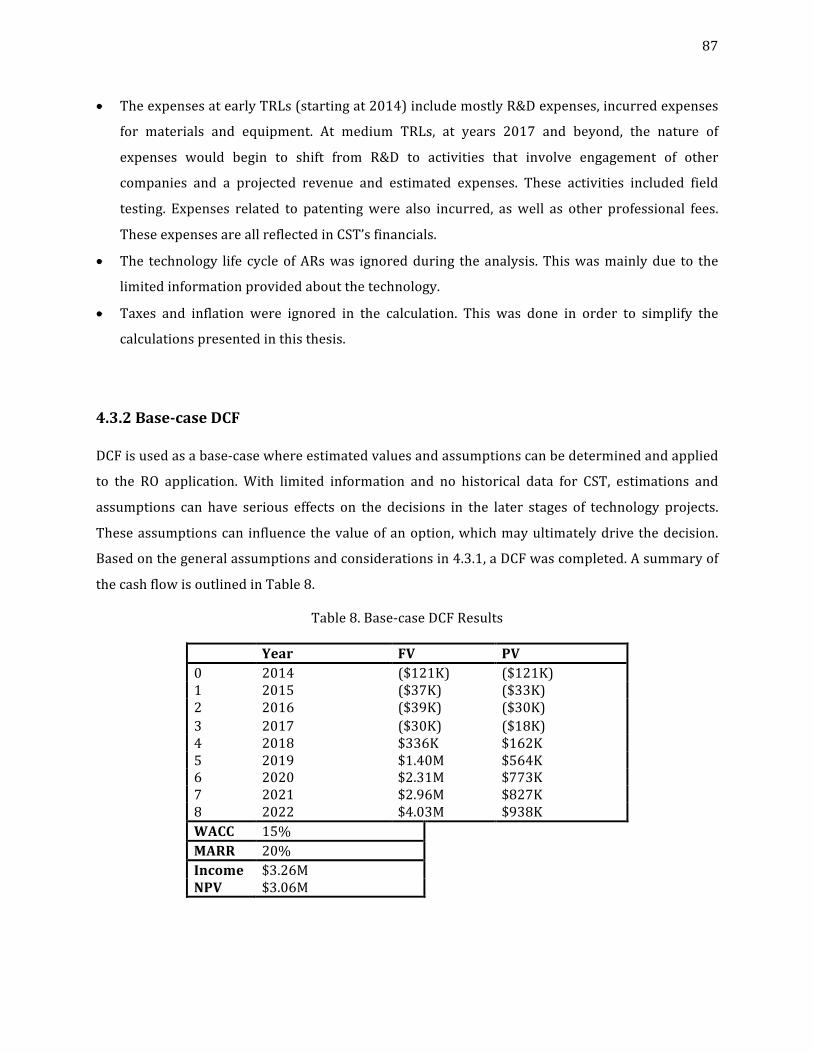
87
• TheexpensesatearlyTRLs(startingat2014)includemostlyR&Dexpenses,incurredexpenses
for materials and equipment. At medium TRLs, at years 2017 and beyond, the nature of
expenses would begin to shift from R&D to activities that involve engagement of other
companies and a projected revenue and estimated expenses. These activities included field
testing. Expenses related to patentingwere also incurred, aswell as other professional fees.
TheseexpensesareallreflectedinCST’sfinancials.
• The technology life cycleofARswas ignoredduring theanalysis.Thiswasmainlydue to the
limitedinformationprovidedaboutthetechnology.
• Taxes and inflation were ignored in the calculation. This was done in order to simplify the
calculationspresentedinthisthesis.
4.3.2Base-caseDCF
DCFisusedasabase-casewhereestimatedvaluesandassumptionscanbedeterminedandapplied
to the RO application. With limited information and no historical data for CST, estimations and
assumptions can have serious effects on the decisions in the later stages of technology projects.
Theseassumptionscan influencethevalueofanoption,whichmayultimatelydrive thedecision.
Basedonthegeneralassumptionsandconsiderationsin4.3.1,aDCFwascompleted.Asummaryof
thecashflowisoutlinedinTable8.
Table8.Base-caseDCFResults
Year FV PV0 2014 ($121K) ($121K)1 2015 ($37K) ($33K)2 2016 ($39K) ($30K)3 2017 ($30K) ($18K)4 2018 $336K $162K5 2019 $1.40M $564K6 2020 $2.31M $773K7 2021 $2.96M $827K8 2022 $4.03M $938KWACC 15%MARR 20%Income $3.26MNPV $3.06M

88
At first glance, the positive NPV looks promising. However, this is not a reliable source of
informationforayoungstart-upsuchasCST,andaninnovativetechnologyinitsearlystages,such
astheAR.Thiscalculationassumestherewillbenochangesthroughoutthedevelopmentalprocess
as thecompanygrowsand the technologymaturesalong theTRLscale,which is reflectedby the
constantdiscountrate.Thisanalysisdoesnottakeintoconsiderationpossiblechallengesthatmay
ariseduringthecourseoftheproject,andtheeffectsofdecisionsmaderelatedtodevelopmentand
commercialization.Forexample,CSTdoesnotcurrentlyknowwhichcommercializationpaththey
willpursue.Eachoptionconsideredwillrequiredifferentconditions.SellingofARunitswillrequire
differentresourcerequirementsthantheIP licensingoption.Therefore, it isnaïvetoassumethat
decisions made during the project will yield the static results in Table 8 and have no effect on
operatingcostsandincome.
AnotherissuewiththeDCFandNPVestimatesisthevalueusedfortheMARR.Thechoiceinvalue
fortheMARRwassubjective.WhendiscussingthiswithCST’sbusinessdevelopmentmanager,the
argumentwasCSTisataveryearlystageandthereisnoMARRatthistime.Thisisattributedto
CSTnotknowinganyoftheirparameters(suchasoverheadcosts),andareestimatedtothebestof
their abilities. This strengthens the argument that these values cannot be considered accurate
estimates.
Despite the unreliability of the DCF and NPV values, the results from the DCF should not be
overlooked,astheyareusedasabase-casecalculationfortheROanalysis.FromtheDCFresults,a
well thought-outsensitivityanalysiscanbeproduced,whichwillprovideCSTwith insightonthe
variabilityofparameters.
89
4.3.3SensitivityAnalysis&Monte-CarloSimulation
A sensitivity analysis is valuable as it provides managers with a tool to better understand how
factorsmay influenceprofitanddecisionsmadeduring theproject.ForCST’sanalysis,ascenario
analysis was chosen over the Monte-Carlo simulation. This is mainly due to unavailability of
informationonparametersandtheirvalue. Instead,a threescenarioanalysiswasanappropriate
andacceptableanalysisforCST.Theyweremoreinterestedintheboundsorlimitsofthecashflow
valuesbasedonthemainvariables.AMonte-Carlosimulationcouldhavebeeneasilyapplied,which
iswhyitwasfullyset-upinthissectionandwillbeexplained.AlthoughaMonte-Carlosimulation
wasnot completed, therewas insight from setting it up. It gaveperspectiveonhow someof the
parameters couldbehave andhow theymight be related to one another. The thought-process of
howthesensitivityanalysiswascompletedasoutlinedinthissection.
Thesensitivityanalysiscalculationsbeganbyfirstconsideringtheriskfactorsthatwereidentified
in 4.2.2. CST’s goal is to maximize profit. This meant that all major parameters needed to be
carefully examined. Demand was an important factor as it ultimately could be affected by
competition, regulatory changes, and other socio-political factors such as community trust and
reputation.Therefore,thesefactorsalsohaveadirecteffectonanyofthegrossrevenueobtained
from AR operated activities. If any of these factors change, they may cause CST to increase or
decreasetheircostsofservicesaccordingly.Operatingexpenseswerealsoasignificantfactorthat
mayaffectprofit,asanyincreaseinexpensesmayreduceprofitmargins.Asimpleprofitmodelthat
describedtheseparameterswasassumedtohavefixedindirectcostsasfollows:
𝑃𝑟𝑜𝑓𝑖𝑡 = 𝑆𝑒𝑙𝑙𝑖𝑛𝑔𝑃𝑟𝑖𝑐𝑒 − 𝐸𝑥𝑝𝑒𝑛𝑠𝑒𝑠 ×𝐷𝑒𝑚𝑎𝑛𝑑 − 𝐹𝑖𝑥𝑒𝑑𝐼𝑛𝑑𝑖𝑟𝑒𝑐𝑡𝐶𝑜𝑠𝑡𝑠
Wheretheunitsareasfollows:
𝑃𝑟𝑜𝑓𝑖𝑡𝑖𝑠𝑖𝑛$
𝑅𝑒𝑣𝑒𝑛𝑢𝑒𝑖𝑠$/𝐴𝑅𝑈𝑛𝑖𝑡
𝐸𝑥𝑝𝑒𝑛𝑠𝑒 𝑠 𝑖𝑠$/𝐴𝑅𝑈𝑛𝑖𝑡
𝐷𝑒𝑚𝑎𝑛𝑑𝑖𝑠𝐴𝑅𝑈𝑛𝑖𝑡𝑠
𝐹𝑖𝑥𝑒𝑑𝐴𝑑𝑚𝑖𝑛𝐶𝑜𝑠𝑡𝑠𝑎𝑟𝑒𝑖𝑛$
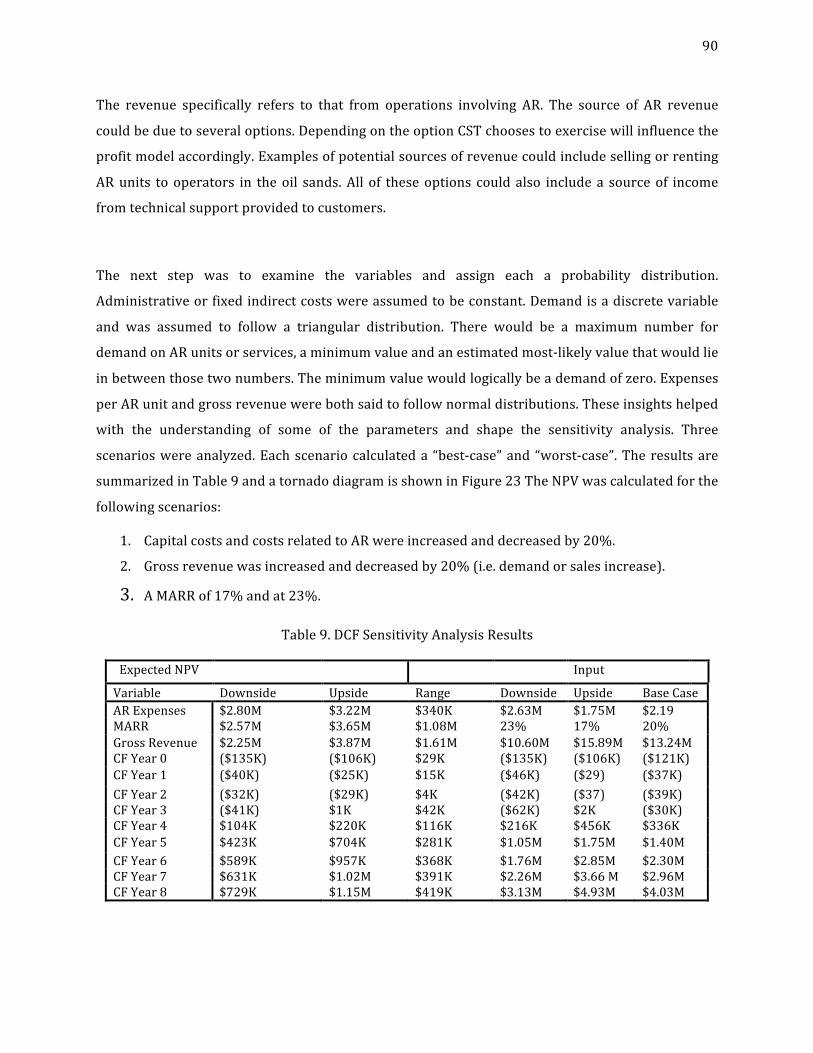
90
The revenue specifically refers to that from operations involving AR. The source of AR revenue
couldbeduetoseveraloptions.DependingontheoptionCSTchoosestoexercisewillinfluencethe
profitmodelaccordingly.Examplesofpotentialsourcesofrevenuecouldincludesellingorrenting
ARunits tooperators in theoil sands.All of theseoptions couldalso includea sourceof income
fromtechnicalsupportprovidedtocustomers.
The next step was to examine the variables and assign each a probability distribution.
Administrativeorfixedindirectcostswereassumedtobeconstant.Demandisadiscretevariable
and was assumed to follow a triangular distribution. There would be a maximum number for
demandonARunitsorservices,aminimumvalueandanestimatedmost-likelyvaluethatwouldlie
inbetweenthosetwonumbers.Theminimumvaluewouldlogicallybeademandofzero.Expenses
perARunitandgrossrevenuewerebothsaidtofollownormaldistributions.Theseinsightshelped
with the understanding of some of the parameters and shape the sensitivity analysis. Three
scenarioswereanalyzed.Eachscenariocalculateda “best-case”and “worst-case”.Theresultsare
summarizedinTable9andatornadodiagramisshowninFigure23TheNPVwascalculatedforthe
followingscenarios:
1. CapitalcostsandcostsrelatedtoARwereincreasedanddecreasedby20%.
2. Grossrevenuewasincreasedanddecreasedby20%(i.e.demandorsalesincrease).
3. AMARRof17%andat23%.
Table9.DCFSensitivityAnalysisResults
ExpectedNPV Input
Variable Downside Upside Range Downside Upside BaseCaseARExpenses $2.80M $3.22M $340K $2.63M $1.75M $2.19MARR $2.57M $3.65M $1.08M 23% 17% 20%GrossRevenue $2.25M $3.87M $1.61M $10.60M $15.89M $13.24MCFYear0 ($135K) ($106K) $29K ($135K) ($106K) ($121K)CFYear1 ($40K) ($25K) $15K ($46K) ($29) ($37K)CFYear2 ($32K) ($29K) $4K ($42K) ($37) ($39K)CFYear3 ($41K) $1K $42K ($62K) $2K ($30K)CFYear4 $104K $220K $116K $216K $456K $336KCFYear5 $423K $704K $281K $1.05M $1.75M $1.40MCFYear6 $589K $957K $368K $1.76M $2.85M $2.30MCFYear7 $631K $1.02M $391K $2.26M $3.66M $2.96MCFYear8 $729K $1.15M $419K $3.13M $4.93M $4.03M
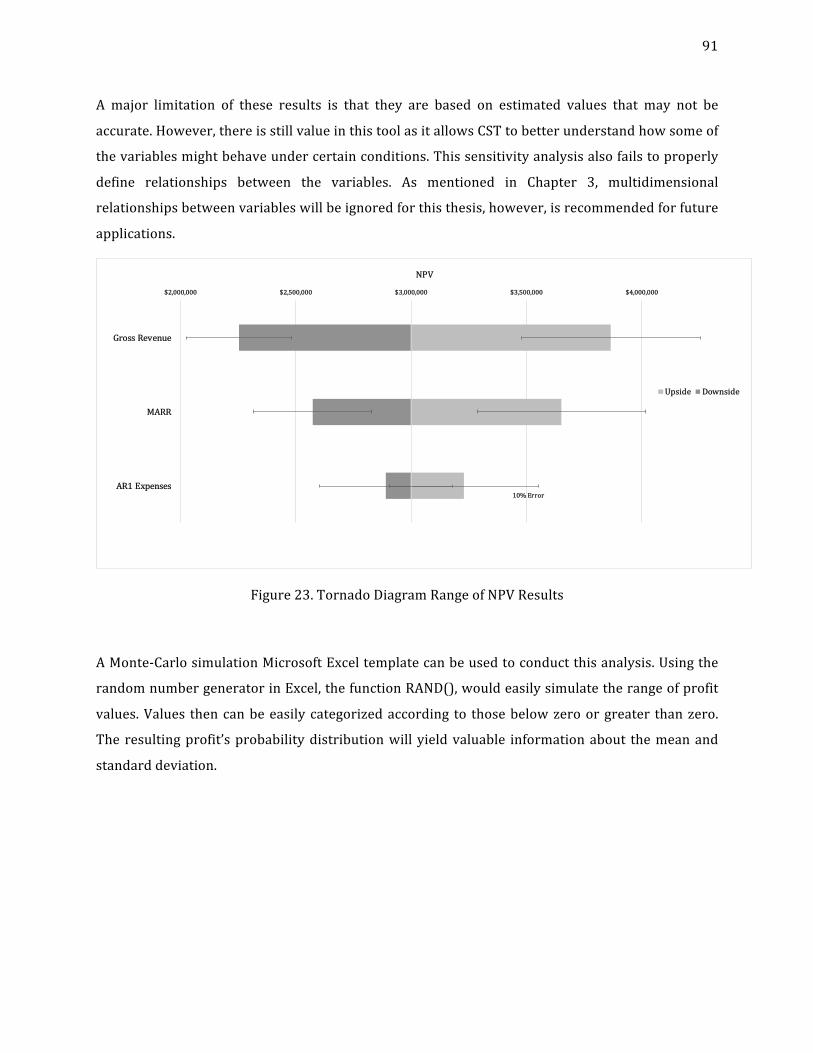
91
A major limitation of these results is that they are based on estimated values that may not be
accurate.However,thereisstillvalueinthistoolasitallowsCSTtobetterunderstandhowsomeof
thevariablesmightbehaveundercertainconditions.Thissensitivityanalysisalsofailstoproperly
define relationships between the variables. As mentioned in Chapter 3, multidimensional
relationshipsbetweenvariableswillbeignoredforthisthesis,however,isrecommendedforfuture
applications.
Figure23.TornadoDiagramRangeofNPVResults
AMonte-CarlosimulationMicrosoftExceltemplatecanbeusedtoconductthisanalysis.Usingthe
randomnumbergeneratorinExcel,thefunctionRAND(),wouldeasilysimulatetherangeofprofit
values.Values thencanbeeasilycategorizedaccording to thosebelowzeroorgreater thanzero.
The resultingprofit’sprobabilitydistributionwill yieldvaluable informationabout themeanand
standarddeviation.
$2,000,000 $2,500,000 $3,000,000 $3,500,000 $4,000,000
AR1Expenses
MARR
GrossRevenue
NPV
Upside Downside
10%Error
92
4.3.4ROValuationatTRL4
Aspreviouslydiscussed,CSTisabouttoenterTRL7andhascontinuedwiththeARproject.There
is value in applyingROA at TRL4. Thiswill help develop a complete analysis and allow gaps or
importantaspectsthatmayhavebeenoverlookedtobeidentified.Thismayalsohelpguidesomeof
the decision making that is done at TRL 6 and 7. At TRL 4, CST had completed the necessary
analytical studies and has assessed the context in which the technology will operate. Analytical
studies and assessments were completed through preliminarymodeling and simulation [23]. At
TRL4,CSTbegantestingtheanalyticalassumptionswithinthecontextoftherelevanttailingponds
environment.Between2014and2015,CSThadjuststartedandhadverylimitedfundsandlimited
humanresources.Thetechnologywasalsolimited,whereinitialfeasibilitystudiesanddetermining
applications and potential markets for the technology were in the process of being conducted.
Abandonmentorterminationofaproject isanoption inthe flexibleROapproachandbecauseof
theselimitationsmentioned,abandonmentwassetasthefirstpossibleoption.Itshouldbenoted
thatdelayingaproject isanimportantoptionthatcouldbeusedbyR&Dandtechnologyfirmsto
reassesstheirworkandtrytoaddresssomeofthefactorsorrisksdiscussed.AsmallfirmlikeCST
did not have the capital or resources to be able to delay the project and re-invest. This is why
delayingwasnotconsidered.
Theothertwooptionsconsideredweregrowthtypeoptions.IfCST’stechnologywasfoundtonot
have any fatal design risks, but managers had failed to identify a market application for their
technology, a market pivot could have been considered. There are several factors that may
contribute to the choosing of this option. For example, high competition or low demand, or no
identifiedmarketreceptors.ThisoptionwouldhaveaddedvaluetoCSTas itwouldhaveallowed
them tomodify thebusinessmodel andmakenecessary changes,without losingon theprevious
investmentanddomainknowledgetheteamhadacquiredsofar.ThiswouldhaveenabledCSTan
opportunity to exploit a prior investmentwith a sequential one [1]. Exercising themarket pivot
optionmayactuallyhavewarrantedtheneedforanotheroption(afewmonthstoayear)after it
had been exercised, depending on the CST’s requirements and their threshold for risk. This is
becausetherewouldbea“sanitycheck”thatmaybeneededafterchoosingtopivot,whereCSTmay
need togobackaftersometimeandreassessagain tomakesure theirshort-termand long-term
goalsarebeingconsidered.
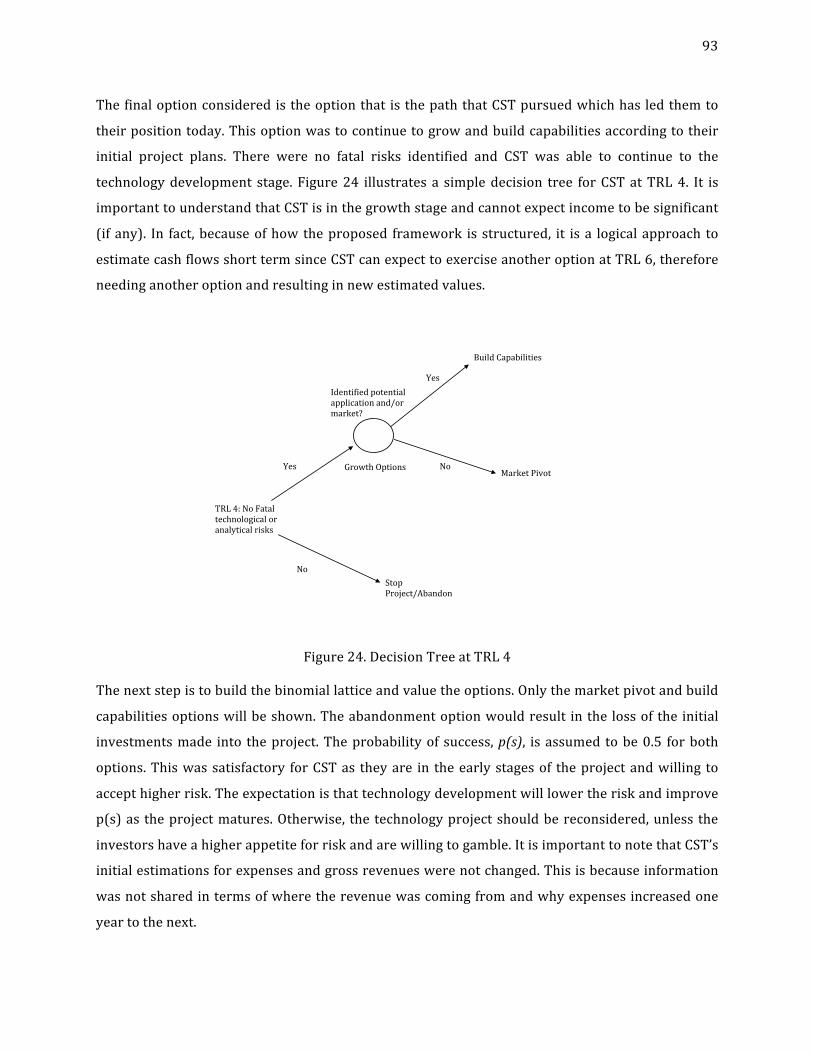
93
Thefinaloptionconsideredistheoptionthat isthepaththatCSTpursuedwhichhasledthemto
theirpositiontoday.Thisoptionwastocontinuetogrowandbuildcapabilitiesaccordingtotheir
initial project plans. There were no fatal risks identified and CST was able to continue to the
technologydevelopment stage. Figure24 illustrates a simpledecision tree forCSTatTRL4. It is
importanttounderstandthatCSTisinthegrowthstageandcannotexpectincometobesignificant
(ifany). In fact,becauseofhowtheproposed framework is structured, it isa logicalapproach to
estimatecashflowsshorttermsinceCSTcanexpecttoexerciseanotheroptionatTRL6,therefore
needinganotheroptionandresultinginnewestimatedvalues.
Figure24.DecisionTreeatTRL4
Thenextstepistobuildthebinomiallatticeandvaluetheoptions.Onlythemarketpivotandbuild
capabilitiesoptionswillbeshown.Theabandonmentoptionwouldresult inthe lossof the initial
investmentsmade into theproject.Theprobabilityof success,p(s), isassumed tobe0.5 forboth
options.Thiswassatisfactory forCSTas theyare in theearlystagesof theprojectandwilling to
accepthigherrisk.Theexpectationisthattechnologydevelopmentwilllowertheriskandimprove
p(s)as theprojectmatures.Otherwise, thetechnologyprojectshouldbereconsidered,unless the
investorshaveahigherappetiteforriskandarewillingtogamble.ItisimportanttonotethatCST’s
initialestimationsforexpensesandgrossrevenueswerenotchanged.Thisisbecauseinformation
wasnotsharedintermsofwheretherevenuewascomingfromandwhyexpensesincreasedone
yeartothenext.
BuildCapabilities
GrowthOptions MarketPivot
TRL4:NoFataltechnologicaloranalyticalrisks
Yes
NoStopProject/Abandon
Identifiedpotentialapplicationand/ormarket?
Yes
No
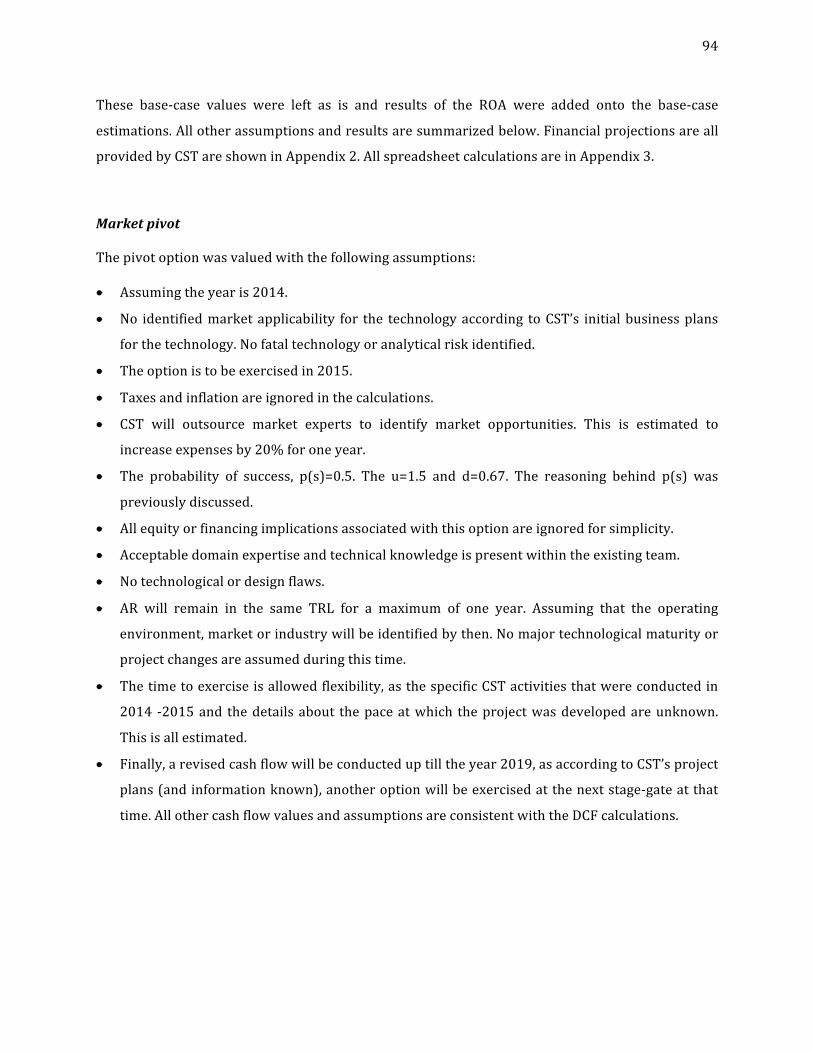
94
These base-case values were left as is and results of the ROA were added onto the base-case
estimations.Allotherassumptionsandresultsaresummarizedbelow.Financialprojectionsareall
providedbyCSTareshowninAppendix2.AllspreadsheetcalculationsareinAppendix3.
Marketpivot
Thepivotoptionwasvaluedwiththefollowingassumptions:
• Assumingtheyearis2014.
• No identifiedmarketapplicability for the technologyaccording toCST’s initialbusinessplans
forthetechnology.Nofataltechnologyoranalyticalriskidentified.
• Theoptionistobeexercisedin2015.
• Taxesandinflationareignoredinthecalculations.
• CST will outsource market experts to identify market opportunities. This is estimated to
increaseexpensesby20%foroneyear.
• The probability of success, p(s)=0.5. The u=1.5 and d=0.67. The reasoning behind p(s) was
previouslydiscussed.
• Allequityorfinancingimplicationsassociatedwiththisoptionareignoredforsimplicity.
• Acceptabledomainexpertiseandtechnicalknowledgeispresentwithintheexistingteam.
• Notechnologicalordesignflaws.
• AR will remain in the same TRL for a maximum of one year. Assuming that the operating
environment,marketorindustrywillbeidentifiedbythen.Nomajortechnologicalmaturityor
projectchangesareassumedduringthistime.
• Thetimetoexerciseisallowedflexibility,asthespecificCSTactivitiesthatwereconductedin
2014 -2015and thedetailsabout thepaceatwhich theprojectwasdevelopedareunknown.
Thisisallestimated.
• Finally,arevisedcashflowwillbeconducteduptilltheyear2019,asaccordingtoCST’sproject
plans(andinformationknown),anotheroptionwillbeexercisedatthenextstage-gateatthat
time.AllothercashflowvaluesandassumptionsareconsistentwiththeDCFcalculations.
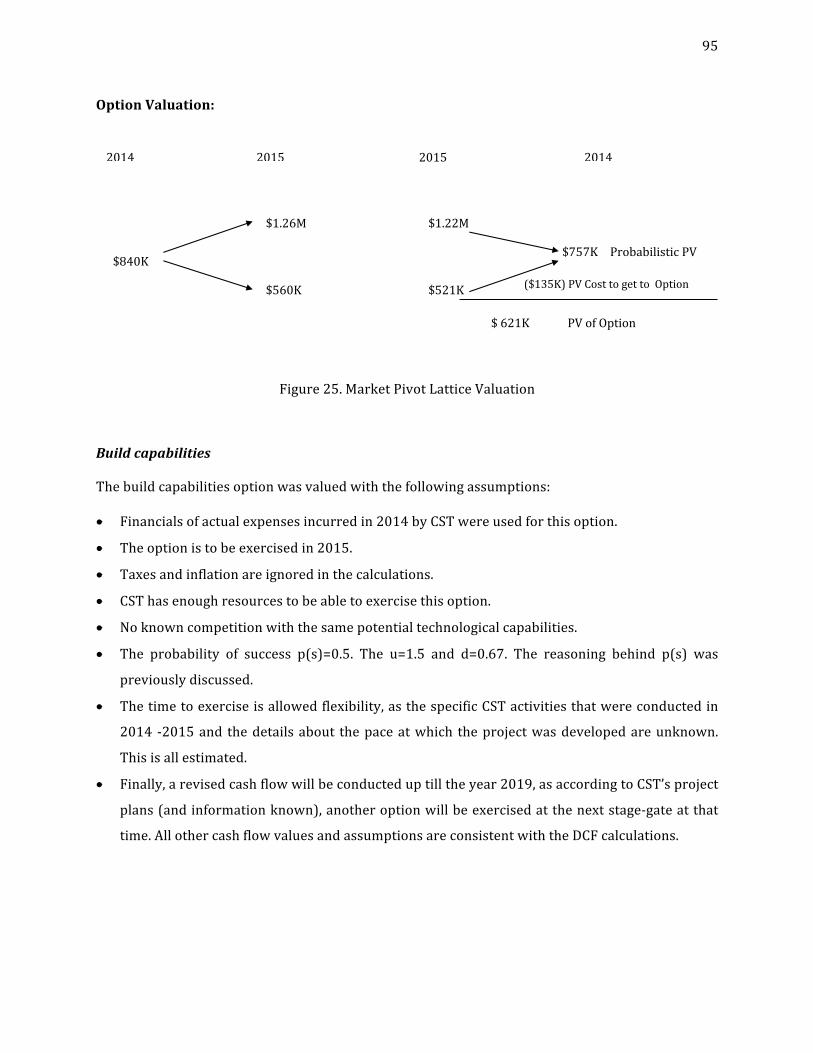
95
OptionValuation:
Figure25.MarketPivotLatticeValuation
Buildcapabilities
Thebuildcapabilitiesoptionwasvaluedwiththefollowingassumptions:
• Financialsofactualexpensesincurredin2014byCSTwereusedforthisoption.
• Theoptionistobeexercisedin2015.
• Taxesandinflationareignoredinthecalculations.
• CSThasenoughresourcestobeabletoexercisethisoption.
• Noknowncompetitionwiththesamepotentialtechnologicalcapabilities.
• The probability of success p(s)=0.5. The u=1.5 and d=0.67. The reasoning behind p(s) was
previouslydiscussed.
• Thetimetoexerciseisallowedflexibility,asthespecificCSTactivitiesthatwereconductedin
2014 -2015and thedetailsabout thepaceatwhich theprojectwasdevelopedareunknown.
Thisisallestimated.
• Finally,arevisedcashflowwillbeconducteduptilltheyear2019,asaccordingtoCST’sproject
plans(andinformationknown),anotheroptionwillbeexercisedatthenextstage-gateatthat
time.AllothercashflowvaluesandassumptionsareconsistentwiththeDCFcalculations.
2015
$757K$840K
2014 2015
$1.26M
$560K
2014
$1.22M
$521K
ProbabilisticPV
$621K PVofOption
($135K)PVCosttogettoOption
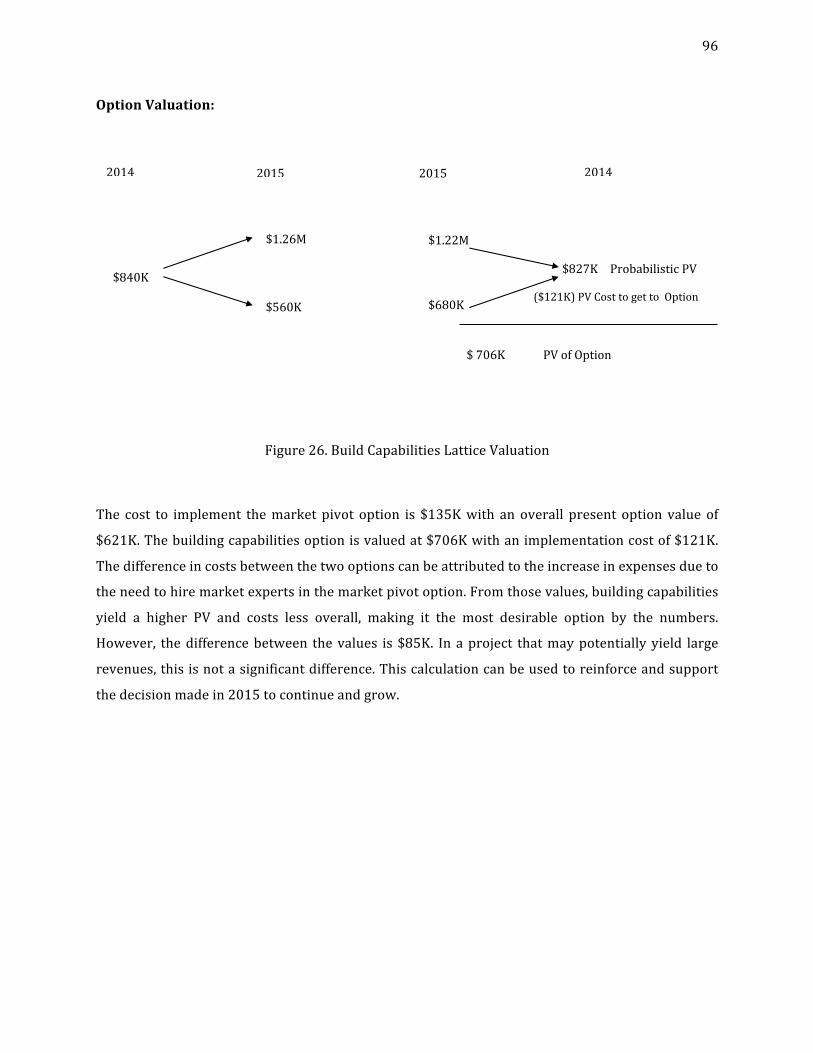
96
OptionValuation:
Figure26.BuildCapabilitiesLatticeValuation
The cost to implement themarket pivot option is $135Kwith anoverall present option value of
$621K.Thebuildingcapabilitiesoptionisvaluedat$706Kwithanimplementationcostof$121K.
Thedifferenceincostsbetweenthetwooptionscanbeattributedtotheincreaseinexpensesdueto
theneedtohiremarketexpertsinthemarketpivotoption.Fromthosevalues,buildingcapabilities
yield a higher PV and costs less overall, making it the most desirable option by the numbers.
However, thedifferencebetween thevalues is$85K. Inaproject thatmaypotentiallyyield large
revenues,thisisnotasignificantdifference.Thiscalculationcanbeusedtoreinforceandsupport
thedecisionmadein2015tocontinueandgrow.
2015
$827K$840K
2014 2015
$1.26M
$560K
2014
($121K)PVCosttogettoOption
$1.22M
$680K
ProbabilisticPV
$706K PVofOption
97
If CST had exercised themarket pivot option, then the need for another optionmay have been
warranted (staged-option). This can be argued to be necessary in order for managers to make
educatedandjustifieddecisionsbeforemovingforwardwiththeirnewredefinedgoals.Thevalue
oftheoptionsintheearlystagesisnotsomuchabouttheincomegeneration.It isimportantthat
managers do not become obsessedwith the numbers during early development. Awell-rounded
decisionconsidersallaspectsofanoption,thebenefits,andchallenges,andreferstothenumbers
to reinforce general estimates. The process of conducting ROA can open up important
conversationsaboutwhattheshort-termgoals, long-termgoalsandexpectationsmovingforward
are.Thecosttoimplementanoptioncanprovidesomeinsightonthemagnitudeofeffortrequired
andresourcesandfinancing.
4.3.5ROValuationatTRL6
CST is currently at the commercialization stage-gate. At this point,major AR system integration
issueshavebeenaddressedandahugeportionoftestinghasbeencompleted.CST’sactivitiesand
concerns have begun to shift from technology development, to the preparation for scale-up and
commercialization.Theresourcerequirementschangeatthisstagewheretheneedformarketand
scale-upexpertisebecomesanimportantkeyforsuccess.CSThasbeenlookingfornewinvestors
andclients,andaccordingtotheirbusinessmanager,theyhavepotentialclientsandinvestorsthat
are interested in the technology. There have been plans made for field trials with potential
customers.Atthispointintime,itisappropriateforCSTtoconsideroptionsthatsupporttheirgoal
to launch the technology into themarket. Growth for a small start-up such as CST is very risky
because of the need for human resources and financial capital, as the business shifts from
knowledgecreationtoproductcreation.It is importantthatbusinessprocessesmaturequicklyin
ordertobringthetechnologytothemarket.
The three options that were of particular interest to CST were to operate as a datamonitoring
servicefortailingponds,tolicensetheirIP,ortosellARunits.Figure27illustratesadecisiontree
atTRL6.CST’scurrentequityandfinancingpositionwasignoredduringtheanalysis,mainlydueto
limited information and ongoing investor related activities. Once the conditions are better
understood,theanalysisshouldbeincludedtoreflectthesechanges.
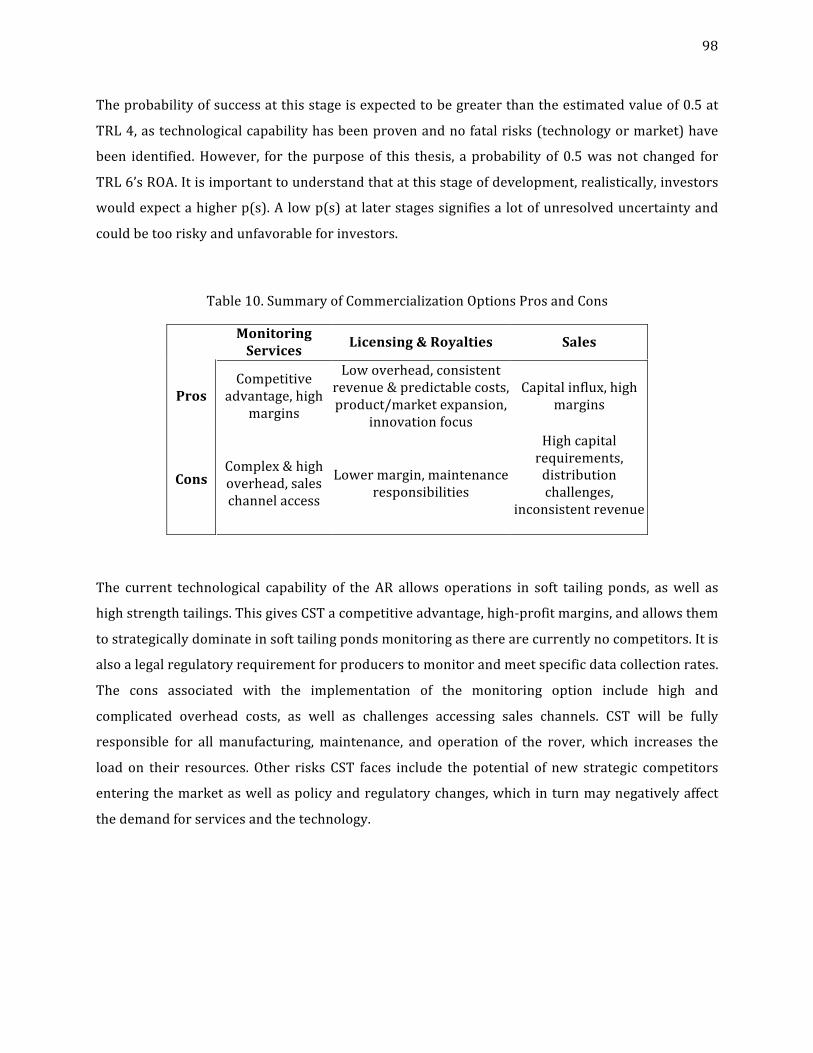
98
Theprobabilityofsuccessatthisstageisexpectedtobegreaterthantheestimatedvalueof0.5at
TRL4,astechnologicalcapabilityhasbeenprovenandnofatalrisks(technologyormarket)have
been identified.However, for thepurposeof this thesis, aprobabilityof0.5wasnot changed for
TRL6’sROA.Itisimportanttounderstandthatatthisstageofdevelopment,realistically,investors
wouldexpectahigherp(s).Alowp(s)atlaterstagessignifiesalotofunresolveduncertaintyand
couldbetooriskyandunfavorableforinvestors.
Table10.SummaryofCommercializationOptionsProsandCons
MonitoringServices Licensing&Royalties Sales
ProsCompetitive
advantage,highmargins
Lowoverhead,consistentrevenue&predictablecosts,product/marketexpansion,
innovationfocus
Capitalinflux,highmargins
ConsComplex&highoverhead,saleschannelaccess
Lowermargin,maintenanceresponsibilities
Highcapitalrequirements,distributionchallenges,
inconsistentrevenue
The current technological capability of the AR allows operations in soft tailing ponds, aswell as
highstrengthtailings.ThisgivesCSTacompetitiveadvantage,high-profitmargins,andallowsthem
tostrategicallydominateinsofttailingpondsmonitoringastherearecurrentlynocompetitors.Itis
alsoalegalregulatoryrequirementforproducerstomonitorandmeetspecificdatacollectionrates.
The cons associated with the implementation of the monitoring option include high and
complicated overhead costs, as well as challenges accessing sales channels. CST will be fully
responsible for allmanufacturing,maintenance, and operation of the rover, which increases the
load on their resources.Other risks CST faces include the potential of new strategic competitors
enteringthemarketaswellaspolicyandregulatorychanges,whichinturnmaynegativelyaffect
thedemandforservicesandthetechnology.
99
CSTmaychoosetolicenseoutoveratermorofferoutone-timeperpetuallicenses,andtheymayor
may not choose to implement royalties. The choice behind the licensing structures and fees are
ultimatelyuptoCST’spreference.However,CSTiskeenonaone-timelicensefeeasitmeantless
overall resource commitments to this project and a greater ability to continue developing new
technologiesandstayinginnovative.Areasonableoutcomewiththeimplementationofthisoption
wouldbethatCSTcontinuestobuildstrongrelationshipswiththeclientstheyarelicensingtoand
will later develop more products to sell or license to these customers, depending on the
circumstances.
Selling of AR units is the final option considered by CST. The major benefit is the high-profit
marginsandcapitalinfluxassociatedwithpursuingthisroute.However,forasmallstart-upsuchas
CST,thisoptionmayfacesomechallenges.Forexample,inconsistentrevenuethatmayarisedueto
factorssuchasdistributionchannelchallengesandhighcapital requirements tomanufacture the
rovers.ThereisalsothequestionofresourceconstraintsandwhetherCSTcouldhandlecustomer
demandswiththecurrentteamsizeandcapability.Amajor factorthatmustbeconsideredwhen
choosingthesalesrouteisthelifeofthetechnologyasthiscanimpacttherevenueanddemandfor
AR. Special consideration should be takenwith the sales option as it possesses capital intensive
requirements thatmay have negative effects on CST’s focus on innovation and their competitive
advantage. Some the requirements for this option include shop facilities, procurement channels,
staffforfabricationandprovisionstoofferwarrantyandafter-salesservices.Therefore,thisoption
maynotbeasustainablepathtochooseasnewtechnologydevelopmentprojectsmayneedtobe
put on hold if the sales option is exercised. In addition, assuming there is a fixed number of
potential clients for the next few years in Alberta, CST may sell one unit to a customer, and
depending on the choice of maintenance services, that customer may no longer be a source of
revenueforCST(i.e. theyareaone-timeclient).Therefore, important factorssuchasmarketsize
andwellastechnologylifeareimportant.
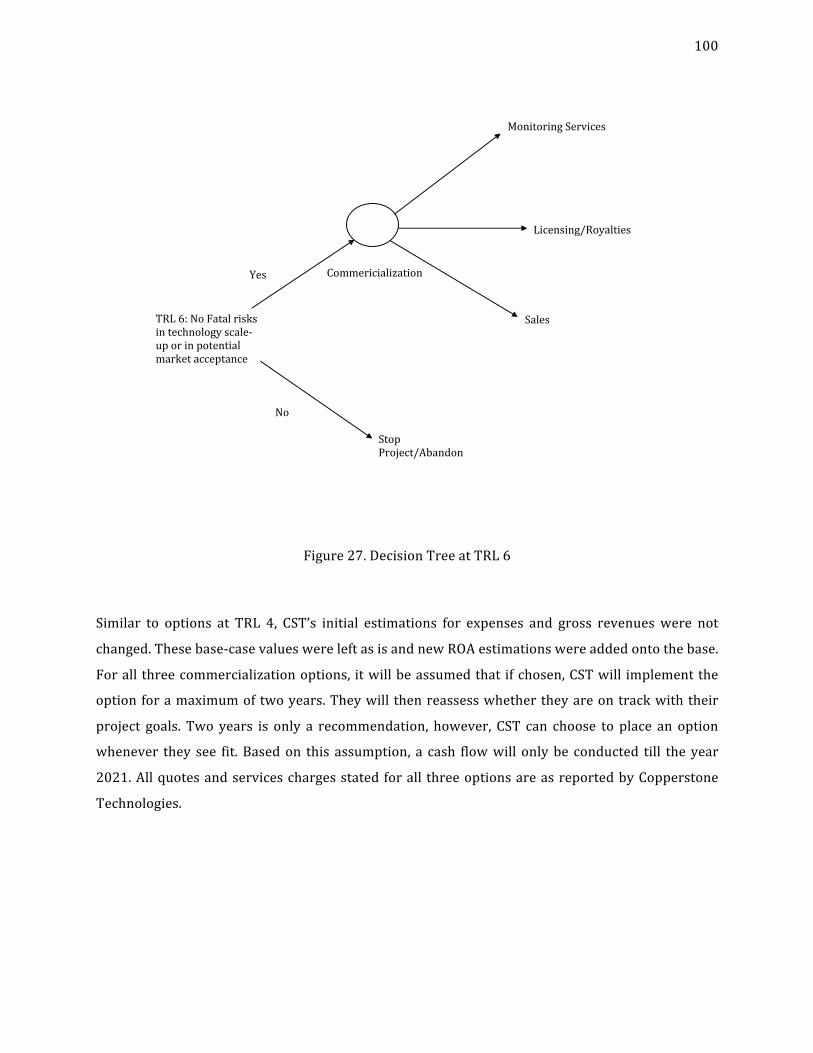
100
Figure27.DecisionTreeatTRL6
Similar to options at TRL 4, CST’s initial estimations for expenses and gross revenueswere not
changed.Thesebase-casevalueswereleftasisandnewROAestimationswereaddedontothebase.
Forall threecommercializationoptions, itwillbeassumedthat ifchosen,CSTwill implementthe
optionforamaximumoftwoyears.Theywill thenreassesswhethertheyareontrackwiththeir
project goals. Two years is only a recommendation, however, CST can choose to place an option
whenever they see fit.Basedon this assumption, a cash flowwill onlybe conducted till theyear
2021.Allquotesandserviceschargesstatedforall threeoptionsareasreportedbyCopperstone
Technologies.
MonitoringServices
Commericialization
Licensing/Royalties
SalesTRL6:NoFatalrisksintechnologyscale-uporinpotentialmarketacceptance
Yes
No
StopProject/Abandon

101
MonitoringServices
Themonitoringservicesoptionwasvaluedwiththefollowingassumptions:
• Thisoptionistobeexercisedin2019.
• Operations and rental of AR is quoted at $5,000/day for 8 hours of operation (for the
calculations,thepricewillremainconstantforthenexttwoyearsbutitmaybeastrategicmove
toraisepricesinayeariftherearestillnocompetitors).
• Minimummonitoring requirements of 100 days per year at 8 hours per day resulting in an
estimatedgrossrevenueof$500,000peryearpercustomer.
• Maintenanceandtechnicalsupportfeesarecoveredwithinthequotedmonitoringfees.
• Regular maintenance requirements are estimated at three weeks per year. This is based on
technicalexpertiseandknowledgeofengineersatCSTandexpectedminorglitchesorbugfixes
thatmaybeneededafterthetechnologyislaunched.
• ThemaintenanceexpensesforCSTarequotedat$25Kperclient.
• CSTwillrequireatleastamonthcommitmentsignedcontractbycustomers.
• Thebreakingof contractor cancellation isnot refundable, andany refundsareup to the full
discretionofCST’smanagement.
• There are no competitors in the monitoring of soft tailing ponds and assumed that no new
competitorswillarisewithinthenexttwoyears.
• Overhead costs and expenses associated with manufacturing and production are assumed
constantforthenexttwoyears.
• Noregulatoryorpolicychangesfortwoyearsaftertheoptionisexercised.
• CSTcurrent’sresourcesareabletosupportthepotentialcustomerdemandswithintheareaof
operation.InthecasewhereanewARunitneedstobebuilttomeetdemands,CSTwillbuildin-
house,financedfromprivateinvestors.
• Potentialof3customersforthefirsttwoyearsafterimplementation.ForROAbasecalculations,
thenexttwoyearswillhaveaconstantnumberofcustomers.
• CSTwillonlyoperateinAlbertafor2yearsafterimplementation.
• Taxesandinflationareignoredinthecalculations.
• Additional service charges imposed by CSTmay be added at their discretion in caseswhere
damagetoequipmentoccursonsiteandisdeemedthecustomer’sfault.
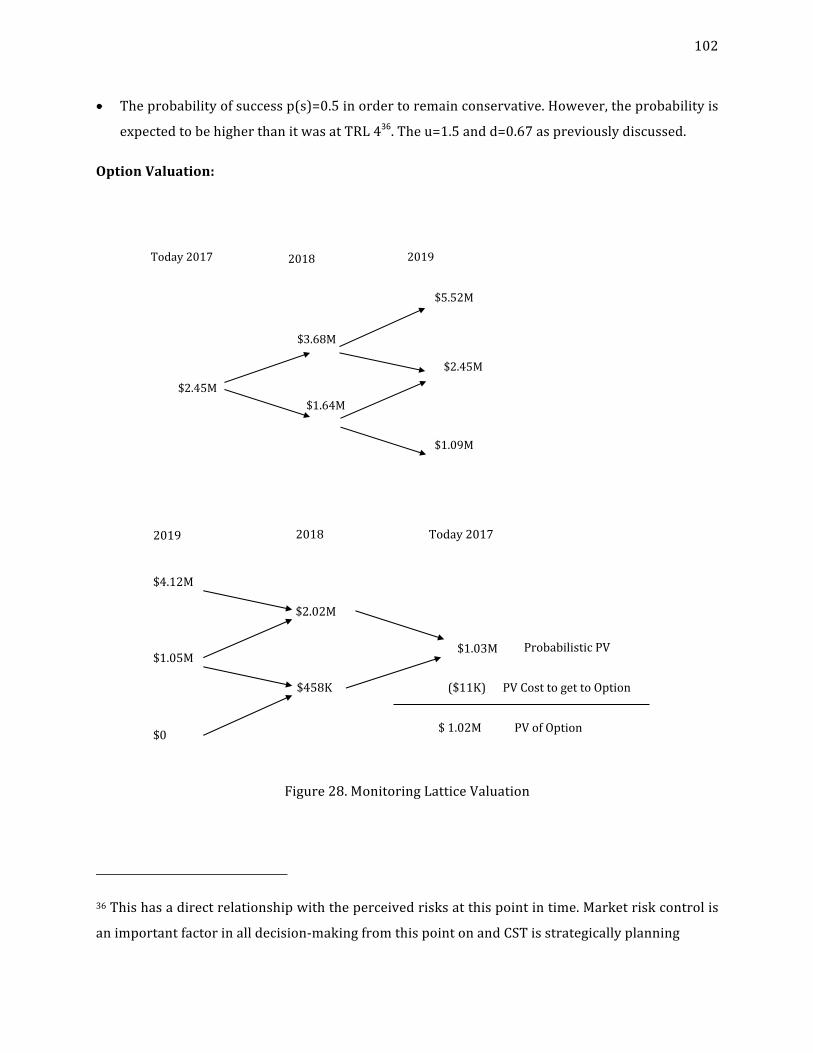
102
• Theprobabilityofsuccessp(s)=0.5inordertoremainconservative.However,theprobabilityis
expectedtobehigherthanitwasatTRL436.Theu=1.5andd=0.67aspreviouslydiscussed.
OptionValuation:
Figure28.MonitoringLatticeValuation
36Thishasadirectrelationshipwiththeperceivedrisksatthispointintime.Marketriskcontrolis
animportantfactorinalldecision-makingfromthispointonandCSTisstrategicallyplanning
$2.45M
Today2017 2018 2019
$3.68M
$1.64M
$5.52M
$2.45M
$1.09M
$1.03M
Today201720182019
$2.02M
$458K
$4.12M
$1.05M
$0
($11K)PVCosttogettoOption
ProbabilisticPV
$1.02M PVofOption
103
LicensingandRoyalties
Thelicensingoptionwasvaluedwiththefollowingassumptions:
• CSTwilllicensetheIPasaone-timeperpetuallicenseatafeeof$400K.
• TargetingonlythesmallmarketintheAlbertaoilsandsandIPusagerestrictedtoAlberta(i.e.
notworldwideuse).Limitationsofusewillbepresentedduringthelicensecontractoffering.
• Aconservativeassumptionoftwocustomersintwoyears.
• Implementationof licensingoptionwill increaseexpensesby10%as lawyersmaybeadvised
and other process or legal fees may be associated. This increase in expenses is expected to
occurin2018.
• Anyrequests for improvementsfromthe licenseewillresult inanadditionalcharge.Thiswill
benegotiateduponrequest.
• Maintenanceorconsultingservicesarechargedtocustomersat$150/hour.
• Thecostsassociatedwithmaintaining thepatentareconstantand factored into theexpenses
(sincetheIPhasalreadybeenapprovedandfeeshavebeenpaidout).
• AnyincomedirectlyfromtheuseofIPwillresultina20%royaltystructureforthefirst5years.
ROAwillnotincludethisinthecalculations,however,onceinformationisknown,theyshould
beupdatedtoreflectabetterestimate.
• Taxesandinflationareignoredinthecalculations.
• Theprobabilityofsuccessp(s)=0.5inordertoremainconservative.However,theprobabilityis
expectedtobehighthanitwasatTRL437.Thep(u)=1.5andp(d)=0.67aspreviouslydiscussed.
37Thishasadirectrelationshipwiththeperceivedrisksatthispointintime.Marketriskcontrolis
animportantfactorinalldecision-makingfromthispointonandCSTisstrategicallyplanning

104
OptionValuation:
Figure29.LicensingLatticeValuation
$2.43M
Today2017 2018 2019
$3.65M
$1.62K
$5.48M
$2.43M
$1.08M
$1.16K
Today201720182019
$2.20M
$449K
$4.07M
$1.03K
$0
($25K)PVCosttogettoOption
ProbabilisticPV
$1.14K PVofOption
105
Sales
Thesalesoptionwasvaluedwiththefollowingassumptions:
• CSTestimatestosell2unitsin2years.
• Theoptionistobeexercisedin2019.
• There will be no major technology improvements on the hardware or software and system
integrationwillbeassumedtobereadyformarketlaunch.
• Thesellingpriceperunitis$200K.
• The cost for CST to build anAR unit is approximately $120K including the cost of labor and
parts.
• Ifthisoptionischosen,CSTplanstobuildoneARunitin2017andoneunitin2018inorderto
meetexpectedfuturedemand.
• Any unit sold will also require customers to purchase maintenance services quoted at
$150/hour.Regularmaintenance isestimatedtobescheduled foramaximumof threeweeks
peryearandisbasedontechnicalexpertiseandknowledgeofengineersatCSTandexpected
minorglitchesandbugsthatmayariseafterlaunch.
• CST is theonly companyqualified toprovided technical supportormaintenance services.No
competitorscanprovidethisservice.
• Manufacturingcostsareassumedconstantforthenext2years.
• RefundsonARpurchasesareonlyconductedunderfulldiscretionofCST.
• Thecosttoimplementisbasedonthesamevaluesprovidedinthebase-caseanalysis(i.e.fixed
admincostsandotherexpenses, thegrowthofCST isnotanticipated for thenext twoyears-
however,ispossible).
• Thereisnodirectcompetitionforthenexttwoyearsaftertheoptionisexercised.
• Noregulatoryorpolicychangesforthenexttwoyearsaftertheoptionisexercised.
• Taxes and inflation are ignored in the calculations. Service charges imposed by CSTmay be
addedattheirdiscretion.
• CSThasthecapabilitiesandresourcestobuildin-housethefiveunitsestimatedtosellwithin
thefirstyear.
• Theroverswillbebuiltinhouseforthefirsttwoyears,andifdemandishigh(i.e.morethan5
unitsperyear)outsourcingoptionscanbeconsideredlateron.

106
• Theprobabilityofsuccessp(s)=0.5inordertoremainconservative.However,theprobabilityis
expectedtobehighthanitwasatTRL438.Thep(u)=1.5andp(d)=0.67,aspreviouslydiscussed.
OptionValuation:
Figure30.SalesLatticeValuation
38Thishasadirectrelationshipwiththeperceivedrisksatthispointintime.Marketriskcontrolis
animportantfactorinalldecision-makingfromthispointonandCSTisstrategicallyplanning
$1.72M
Today2017 2018 2019
$2.58M
$1.15M
$3.87M
$1.72M
$765K
$558K
Today201720182019
$1.14M
$139K
$2.48M
$320K
$0
($80K)PVCosttogettoOption
ProbabilisticPV
$479K PVofOption
107
Theestimatedpresentcosttoimplementthemonitoringoptionwas$11Kwithavalueof$1.02M.
Thepresent cost to implement the licensing optionwas estimated to cost around $25K andwas
valuedat$1.14Mandtheestimatedpresentcosttoimplementthesalesoptionwas$80Kwhilethe
optionwasvaluedat$479K.
Theassumptionsmadeduringthecalculationshaveasignificantimpactonthemagnitudeofvalues
forcostimplementationandvalue.Forexample,thecosttoimplementforsalescanbeconsidered
“low”because the assumption thatCSThad twoavailableunits for salewasmade, and that they
would build one unit in 2017 and one in 2018. This of coursewas based on an assumption for
potentialdemand.AdditionaloverheadcostswereassumedtoalreadybeincludedinCST’s initial
projections forgrowth.Therealisticcost to implement theseoptionsareexpected tobedifferent
once CST updates the values. A more accurate estimation was not possible during the study as
detailsbehindsomeofthevaluesontheirfinancialprojectionswerenotsharedanditwasdifficult
togaugeestimatesonexpensesandoverheadswhenCSTalreadyhadincorporatedtheirownplans
forgrowth in theseprojections.Themonitoringoptionalsodeemstohavea low implementation
cost; this is because it was assumed that CST had basic capabilities to meet minimum demand.
Similartothesalesoption,abetterestimationcanbeexpectedoncethesevaluesareupdated.This
isespeciallythecaseoncetruemaintenancecostsarereflectedinthecalculations.
Fromtheseresults, licensingandmonitoringcostsarecomparatively lowerthanthesalesoption.
Thisalignswellwith the initialassumptionsmadeabouteachoption.The licensingoptionyields
the highest value, again, reinforcing some of the expectations related to this option. As it is low
maintenanceandhighmargincosts.Ofcourse,tobetterhaveanideaoftherangeofthesevalues,a
sensitivityanalysisshouldbeconducted.
108
The value in ROA as explained throughout this thesis comes in the ability tomake stream-lined
decisionsbasedonimportantassessmentsmadethroughouttheapplicationofthisframework.The
choicebehindwhytheseoptionswereimplementedafterforaperiodofmaximumtwoyearshas
alreadybeenaddressedatthestartofthissection.Inthecasewhereanimplementedoptiondoes
notgoaccordingtoplan,managerscanreassess,orinextremeconditions,abandon.Theprocessof
estimatinghowmuchanoptionwillcostwillgiveinsightontheeffortthatwillberequiredandthe
resources.ThisisbeneficialforCSTbecauseitaidsintheprocessofprojectplanning.Estimatesof
theoptionvaluescanalsobeused tosupport theirprojectprogressdiscussionsand futureplans
whenspeakingtoinvestorsandtryingtosecurefinancingDuringthecourseofthisthesis,CSTdid
notselectanoption.
4.3.6SensitivityAnalysisforExercisedOption
Asensitivityanalysisshouldbeconductedontheoptionsconsidered,andmorespecificallyonthe
optionchosen.Whenconsideringmorethanoneoption,valuesofdifferentoptionsmaybeclosein
numbers.Itisimportanttoconductawellthought-outsensitivityanalysisinordertoobtainafull
range of values (or at least understand the boundaries), that show the variability in parameters.
Thisisalsosimilarfortheoptionchosen.
A full sensitivityanalysiswasnotcompleted in thiscasestudyas thecalculationsare trivial.The
valueisinthethoughtprocess,andthevariablesshouldbevariedwithriskelementsinmind.CST
did not select an option during the course of this study. However, it is recommended that CST
conduct a sensitivity analysis when they decide whether they will proceed with any of the
recommended options in this study, or any other options in the future. The list of the possible
scenarioslistedbelowfortheanalysisisnotanexhaustivelist.Someapplicablesensitivityanalysis
scenariosrelevanttoCSTinclude:
1. Varyingtheprobabilityofsuccess(thiscouldbefrom0.4to0.6orwhatCSTchooses).
2. Yeartheoptionisexercised.ThiswillallowCSTtostudyhowearlyorlateimplementation
ofanoptioncanaffectitsvalueandtheoverallPVofincome.
3. Varyingtheupswinganddownswingvaluesusedinthelatticevaluation.
4. Varyingtheexpensesrelatedtoimplementation(increase/decreaseby20%forexample).
5. Varyingcustomerdemandandcompetition.
6. Modelingtheeffectsofregulatorychanges(whichwillalsoaffectdemand).
109
4.3.7OtherCaseStudyConsiderations
Thecommercializationoptionsconsideredwererelativelywellunderstoodintermsofadvantages
anddisadvantages.However, inthecasewhereCSTmaybeconsideringbetweenoptionsthatare
not as clear, a SWOT analysis39 could be used to qualitatively assess these options. Ultimately,
marketconditionswilldeterminewhethertheoptionexercisedcandosointimetomeetamarket
window.
DataanalyticsandcollectionareanintegralpartofsuccessfulandefficientARoperations.Thereis
a need for the implementationof IT systems that allowaccess to real-timedata collectedbyAR.
Data exchange programs have been developed for oil and gas industry allowing for seamless
automation of data transfer and remote access. An example of such IT platforms include is the
Partner Data Exchange [2] that was developed by CGI. Integrating a platform as such into AR
technologycanallowforoilsandsproducers,governmentstointerpretrealtimedatafromtailings.
39Strengths,weaknesses,opportunities,threatanalysisthatorganizationsemploywhenassessing
theircapabilitiesandfactors(internalorexternal)thatcanimpactaprojectordecision.
110
4.4.NationalResearchCouncilofCanadaCaseStudy
TheinitialprojectplanforthisthesiswastoconductROAonaNationalResearchCouncilofCanada
(NRC) project. The project would be within the Security and Disruptive Technologies (SDT)
portfolio.Thegoalwasthatacomparativeassessmentwouldbecompletedusingasimilarproject
withinthatportfolio.
4.4.1NRCCaseBackground
OnepotentialapplicationoftheproposedframeworkwouldbetheNRCBoronNitrideNanotubes
(BNNT)technologywithintheSDTportfolio.Theprojectwaschallengedbymanyunforeseenrisks,
mainly due to misinterpreting the potential market. BNNT’s were discovered in 1995. They
remainedatalowerlevelofmaturitythanexpectedfortwodecadesandhavenotreachedastage
ofdevelopmentwhereanyreceptormarkethasbeen identified.Thishas ledBNNTs toremain in
theR&Dsphere.Althoughtherewasno identifiedbusinessorconsumermarket forBNNT’s,NRC
optedtousethestructurallysimilarCarbonNanotubes(CNT)asaproxymarket forBNNT[149].
BNNTssharesimilarmechanicalpropertiesandconductivityofCNTs.However,aremoresuperior
as they possess greater thermal and chemical stability, electrical insulation and the ability to
producecurrentwhensubjectedtomechanicalstress[150].
BNNTsarelight-weight,extremelystrongandtiny.Theyaredescribedtobe100timesthestrength
ofsteelandcanwithstandupto2,000degreesCelsius.Despitethesepositivequalities,NRCargues
thatthesequalitiesarealsothereasonthathasledtodifficultiestocommerciallyproduceBNNTs
[151]. The capabilities and potential future applications of BNNTs have been considered for
applicationsas transparentmilitaryarmor,strongenoughtoholdagainstexplosions,orasBNNT
coatings for buildings to shield against ultraviolet light and fire. For more information about
BNNTs,see[152].
111
4.4.2RecommendationsforFutureNRCPortfolios
TherewasnotenoughinformationprovidedbyNRCtoconductacomparativestudyontheBNNT
case.However,withenoughdata,theproposedmethodologyinthisprojectcouldbeconsideredas
a valuation tool across their entire SDT portfolio. It is important to identify the potential
approachestocommercializetheBNNTtechnology.ThereisanimplicationthatR&Dorganizations
can no longer fully rely on their internal R&D capacity and do not have the ability to cover all
disciplines that contribute to the firm [153]. Therefore, it is crucial that NRC employ external
marketexpertise(ifpossible)inordertoobjectivelystudythepotentialmarkets.Basedonseveral
informalconversationswithmanagersatNRC,thereisatendencyforthesamegroupofemployees
to staywithin the sameportfolio for several years (15+) [54]. Further researchon the skills and
competenciesacquiredanddevelopedovertime,andtheirinfluenceonthedecisionsandstrategies
during the cross-functional processes of developing and commercializing technologies should be
consideredbyNRC’sportfoliomanagers.Onepossibleway is toanalyzehistoricaldata frompast
projectsandidentifytrendsorpatternsindevelopmentalandmanagerialactivitiesthatmayhave
contributedtothesuccess,orincreasedtheriskoffailureforaparticularproject.
NRCisheavyonearlytheoreticalresearchandcanexpecttobeginanyprojectatTRL1-2.Theycan
expecttoexerciseatleastfouroptionsatTRL2,4,6and7.ThiswouldbeexpectedfortheBNNT
project.Projects forwhich there ishighNRCcapabilitybut lowpotential impact forCanada,may
not be pursued. Projects for which there is low NRC capability, but very high potential and
sustainableimpactforCanada,maybepursuedaspartofanevolvingNRCstrategyforprograms,
hiring, and facilities [23]. Contrary to RO application for CST, options exercised for NRCmay be
years frompresent time.Thiscanbeexpectedwithvery long,projectswithextensive theoretical
research. It is important thatPortfoliomanagers atNRCare able toplanandbudget accordingly
with importantmilestones clearly defined so that project progress can occur. This can avoid the
pitfallofendlessyearsoftheoreticalresearchwithnofutureapplicationandnoshort-termorlong
termgoals,tyingupresourcesthatcanbeallocatedelsewhere.
112
AgeneralrecommendationfortheBNNTcaseistobeginbyreassessinginformationavailableand
assessingtechnologicalmaturityasoftoday,usingaformalTRA.Anycomponentsthatarenotyet
at the target TRLneed to be addressed accordingly. The use of the CNTs’ success as a proxy for
BNNTs should be approached with caution to avoid oversimplifying assumptions and avoid
personalbiasesthatmaycausemanagerstoviewoutcomesmoreoptimistically.Theeffectsofthese
biases can encourage investments in technology-push projects that could have a higher risk of
failure. Distinctions between the CNT application and BNNT application must be made and any
marketoverlapshouldbeidentified.TheimpactofmarketoverlaponthesuccessoftheCNTsand
potentialBNNTsneedtobeconsidered.
Short-termand long-termprojectandportfoliogoalsneed toberedefined,andclearandspecific
milestones must be set. A formal market analysis needs to be conducted to reflect the market
landscape today. An option towait-and-see for one yearmay be possible forNRC depending on
theircurrentfinancialandresourceconstraints.NRCmustidentifyallcriticalrisksmovingforward
anddevisealternativeoptionsandback-upplans toavoidprojectoverrunsandsloworstagnant
projectprogress.UsingstagedoptionsisvaluablefortheBNNTprojectasitwillbreakdownavery
long project into smaller andmanageable tasks. Thiswaymanagers can keep updating progress
and value their decisions for short-term and long-term progress as they continue to grow. This
approach can overall help the SDT portfolio managers to better budget and allocate resources
accordinglywhilekeepingtheportfoliobalancedandrunningefficiently.
113
Chapter5Conclusion
5.1Conclusion
The aim of the research conducted was to develop a decision-making framework that can be
appliedtosingleR&Dandtechnologyprojects,oracrossentireportfolios.Theproposedframework
isastrategictoolformanagers,researchers,anddecision-makersusedtovaluedecisionsmadein
highlyriskyprojects.Itcombinesastage-gateapproachforrisk-baseddecision-makingbyusingthe
technologyreadinesslevelscalealongsidearealoptionsapproach.Thisapproachisarguedtodrive
organizations to make evidence-based decisions for technology development and project
continuation.
The framework recommends a minimum number of three real options to be placed along the
technology readiness levels at different points during the project. These are key decision points
during technology development as there is a significant change in activities, risks, resource
requirements and financial requirements. The first option is at the TRL 4 stage-gate where the
technologyisabouttoenterthetechnologydevelopmentphase.Thesecondoptionistobeassessed
atTRL6wheretheprojectshifts toproductcreation.Beyondthisstage,scale-up,marketing,and
commercialization activities are dominant. The final option is recommended at TRL 7, before a
technology is about to enter the production and deployment phase. The major risk categories
associatedwithtechnologyprojectsareidentifiedasscienceandtechnology,financial,marketand
organizational.Theresearchdiscussesthegeneralbehaviouraltrendsoftheseriskcategoriesand
how they change during a project, and their effects on different aspects of a technology
development. This is a flexible framework that allowsmanagement to addoptions as needed, as
more information is obtained during a project. This approach was developed as a streamlined
methodology that supports risky technology andR&Dprojects inways that traditional valuation
methodssuchasdiscountedcash-flow(DCF)andnetpresentvalue(NPV)couldnot.
114
Theframeworkwasthenappliedtoanautonomousrover(AR)projectcurrentlybeingdeveloped
byCopperstoneTechnologies(CST).CST’smaingoals fortheARprojectandtheoverallcompany
was tomake a profitwhile allowing the founders towork on new technologies and bringmore
innovations to the market. Factors such as competition, demand, and regulatory policies were
determined as critical risks through interviews with CST’s business development manager and
theirchieftechnologyofficer.
Theeffectsoftheserisksontheoverallprojectsuccessandpotentialprofitwerediscussed.Scale-
upactivitiesatthesecondstage-gatewerealsodeterminedtobeimportant.Technologyanddesign
riskswerealsodiscussed.The importanceofCSTensuringtheyhaveasystemdesignthatallows
futuremodifications thatreflect improvementswithouthaving tomake largedesignchangeswas
criticaltotheirsuccessandtheirfuturecompetitiveadvantage.
Options were retroactively valued at TRL 4. CST’s decision to continue development and build
capabilitiesbackin2014wasdeterminedtohavebeentheappropriateoptionforthematthetime.
Itwasin-linewithCST’sgoaltoremaininnovativeandthevaluationsupportedtheirinitialplanto
commercialize the technologyasa tool thatwillbeutilized in thenichemarketof theAlbertaoil
sands. Decisions were also valued at the second stage-gate, which is where CST’s currently
positioned today.Basedon the results from the interview, three commercializationoptionswere
consideredandassessed.LaunchingtheARtechnologyinthemarketandoperatingasamonitoring
service was the first option considered. The second option was to license the IP to oil sands
operators through a one-time perpetual license fee. The final option was to sell AR units.
Advantagesanddisadvantagesofeachoptionwerediscussed.Duringthecourseofthisthesis,CST
didnotselectacommercializationoption.Therefore,noadditionalinformationwascollectedafter
thevaluationatTRL6.
115
Monitoring and sales optionswere found to take away fromCST’s ability to continue to develop
newtechnologiesandremaininnovative.Thiswasduetothehighresourcerequirementsneeded
fromthesetwooptions.ThesalesoptionalsoposedissuesasitdidnotmeetCST’spreferencefor
anoption thatwill produce consistent revenue.Licensingof IPwasdetermined to allowCST the
most flexibility to continue to innovate and create new technologies. These observations were
proven through the cost to implement the option, aswell as the potential income that could be
generateduponimplementation.
Thereliabilityofthevaluationwasalsoaddressed.Duetothelimitedavailableinformationforthis
case study,many estimations and assumptionsweremade and stated accordingly. An important
assumption that had an effect on the valuation of option was the probability of success (p(s)).
DuringearlystagesofatechnologyitwasarguedthatCSTwaswillingtoaccepthigherriskasthey
enteredthetechnologydevelopmentphase.Realisticallyspeaking, thep(s)shouldhave increased
atthesecondstage-gatewherethetechnology’scapabilitieshadgrown,andrisksfromtheprevious
stageshadbeenmitigatedaccordingly.However,becauseofthelimitedavailabilityofdataforthis
study,thep(s)of0.5wasusedforbothstage-gatevaluations.Itwasexplainedthatinvestorswould
expectahigherp(s)athigherTRLsandloworunchangedp(s)atlaterstagessignifiedunresolved
uncertaintyandahighervolatilitywhichwouldandcouldbeunfavourableformanyinvestorsand
asignthattheprojectmayneedtobereassessedorabandoned.
Finally,apotentialapplicationtoaBoronNitrideNanotubes(BNNT)projectbyNationalResearch
CouncilCanada(NRC)wasintroduced,andthevalueoftheproposedframeworktotheirportfolio
wasbrieflydiscussed.Unfortunately,therewasnodataorinformationobtainedbyNRCinorderto
conductacomparativeassessment.
In conclusion, the framework developed is a useful tool that can allow managers to better
understand risks and how they change as a technology progresses relative to the TRL scale. It
enablesamoreconsistentdiscussionaboutthecomparativevalueofdifferentoptionsandcanbe
used to justify spending on long and risky technology development projects. Framework
limitations,challengesanddirectionsforfutureresearcharediscussedinthefollowingsections.
116
5.2FrameworkLimitations
The framework has limitations in its current applicability. It does not outline an alternative
approach to estimate upswing, downswing, and the probability of success for early-stage
technology projects, which may weaken the quantitative aspect of the assessment and raise
questions about reliability from managers and others using it. Difficulties in obtaining exact or
relativelyaccurateinputsforROAmayresultinsomemanagersunderminingthevalidityofresults
duringdecision-making.Although thiswasstressed throughoutChapter4, somedecision-makers
maybecomeobsessedwiththenumbersproducedfromtheROAanddisregardtherealvalueofthe
framework. The proposed methodology does not replace the need for technology development
strategists.Theoutlinedframeworkcouldbefurtherrefinedtoprovidecleartiesbetweenstrategy
andoptionselection.Valuedriverssuchasbuildingupofscaletogaincompetitiveadvantageina
market,orinnovativeproductdifferentiationshouldbeclearlylinkedtostrategiesandaportfolio
ofrealoptionsthatareapplicable.Thiscanhelpinexperienceduserscaptureopportunitiesifthey
are able to understand RO application better. This can also reduce some of the vagueness that
inexperienced managers may feel towards the concept of real options valuation. An improved
methodtopresenttheseconceptsinanorganizedmannerthatissimpleforeveryoneinvolvedina
project to understand is necessary. This can be done using step-by-step approaches to option
valuationorperhapsanin-housetoolbuiltspecificallytoaportfoliothatcanbeusedbydecision-
makers.
The framework discusses the possibility of correlated variables and risk elements but does not
outlineadefinedapproachtoassesstheserelationshipsandproperlyquantifythembeyondusinga
sensitivity analysis.More detailedmapping of risks along theTRL scale should be considered as
well as their potential effects on other categories. The research also stresses the importance of
havingavailableandappropriateresources,butdoesnotreallydefineamethodthatorganizations
can use to assess their capabilities and need for additional capabilities as a whole. A possible
approach toovercome this limitation is toperformanorganizational capabilitiesaudit.Formore
informationsee[154].
117
Thedevelopedframeworkdoesnotdirectlytakeintoconsiderationtechnology-lifecyclesandtheir
effect on the option value and cost to implement. During the development of the framework
(Chapter 3) and the analysis (Chapter 4), therewasmentionof the technology-life cycle and the
possibleeffectsonoptionvalue.Therewasnothingbeyondstatingthatthisfactorcaninfluencethe
value of option. The framework can be strengthenedby incorporating technology-life cycles into
theanalysis.Thiscanaidmanagerstobetterestimatewhenandwhether(andthedegreeofwhich)
thepotentialprofitswilloffsetR&Dcosts.This cansupportdecisionsas the technology-life cycle
can help organizations to predict adoption and decline of the technology and can providemore
insightonhowrisksmightaffectthelifespanofatechnology.Theeffectofintellectualproperty(IP)
may also have an influence on the technology-life cycle. This should be considered for future
applications.
5.3RecommendationsforFutureResearch
Inadditionto improvementsthatcanbemadetothe limitationsdiscussed in5.2, thereareother
areasforfutureresearchthatcanbeconsidered.
The methodology should be refined further as more data becomes available and we develop a
better understanding of internal capabilities and resource restraints. As start-ups begin to grow
theirportfolios,thiswarrantstheneedtoconsidermarketcannibalization.Thisreferstotheeffect
that new products being developed within an organization have on the performance of other
existing products. The performance is often measured through sales of these products [1]. One
aspectthatcouldbefurtherexaminedarethedecisionsbehindwhichproductstoreleasefirstand
the strategy behind how technology risks could be blended across several products40. Projects
should not always be assumed to be independent, as theymay be linked in severalways. These
linkages can have effects on other projects thatmay be kept at lower TRLs in order to support
higherTRLprojects.
40BasedonconversationswithDr.MichaelLipsettandDr.SahilRainaattheUniversityofAlberta
118
Futureresearchshouldtakeintoconsiderationthedifferencesbetweenpublicandprivatesectors
when implementing such a framework. Metrics for success need to be defined as some R&D
organizations may be driven by scientific competence that achieve a non-economic impact in
Canada41. Aspects such as types of financing whether government funded or private investors,
shouldbestudiedandtheireffectonstrategicdecisionmakingduringdevelopment.Potentialrisks
and critical factors of success should be studied in more depth and organized by industry and
magnitudeof impact inorder to further streamline themethodology.Thismay requireextensive
datafromvariousindustriesinordertoproduceasomewhatcompletelist.
Futureresearchcouldalsoincorporateaformalprocesswithintheframeworkwhendealingwith
residualriskfromlowerTRLsthatmaybecarriedforwardintothelaterstagesofdevelopmentand
how these can be accounted for quantitatively. Keeping in mind that the lowest TRL for a
component,meansthattheentiresystemisatthatlowestTRL,regardlessofwhatTRLstheother
componentsareat.
Futureimprovementsshouldincorporateportfoliomanagementandresourceallocationguidelines
fororganizationsthataremoreseasonedandhavebeenoperatingforseveralyearsandaremore
“set in their ways”. Ensuring resources are properly managed and utilized across projects is a
success factor in new product development [21]. The research should explore a process for
resource allocation andmanagement so that resources can be optimized across a portfoliowith
projects that have varying levels of risk. Research should also consider concepts related to
technology transfer42 between functional groupswithin an organization and processes to ensure
smoothtransitionsbetweenthetwogroups.
41Frome-mailcommunicationbetweenNRCandDr.Lipsett
42Thisreferstothetransferthatoccursfromtechnologytonewproductdevelopment.Sometimes
itmaybeanentirelynewteamthattakesoverthenewproductdevelopment.
119
References
[1] M.C.Dissel,R.Phaal,C.J.Farrukh,andD.R.Probert,“ValueRoadmapping,”Res.-Technology
Manag.,vol.52,no.6,pp.45–53,2009.
[2] G. Martin-Barrera, C. Zamora-Ramirez, and J. M. Gonzalez-Gonzalez, “Application of real
options valuation for analysing the impact of public R&D financing on renewable energy
projects:Acompany’sperspective,”Renew.Sustain.EnergyRev.,vol.63,pp.292–301,2016.
[3] F. Hunt, R.Mitchell, R. Phaal, and D. Probert, “Early valuation of technology: real options,
hybridmodelsandbeyond.,”J.Soc.Instrum.ControlEng.,vol.43,no.10,pp.730–735,2004.
[4] G.AjamianandP.Koen,“TechnologyStage-Gate:astructuredprocessformanaginghigh-risk
newtechnologyprojects,”PDMAToolb.newProd.Dev.,vol.1,pp.267–295,2002.
[5] J.Wang,W.Lin,andY.H.Huang,“Aperformance-orientedriskmanagementframeworkfor
innovativeR&Dprojects,”Technovation,vol.30,no.11–12,pp.601–611,2010.
[6] L.Trigeorgis, “Topics inRealOptionsandApplicationsRealOptionsand InteractionsWith
FinancialFlexibility,”Financ.Manag.,vol.22,no.3,pp.202–225,1993.
[7] J. Mun, Real Options Analysis Tools and Techniques for Valuing Strategic Investments and
Decisions,SecondEdi.WileyFinance,2006.
[8] L. Trigeorgis, “The Nature of Option Interactions and the Valuation of Investments with
MultipleRealOptions,”J.Financ.Quant.Anal.,vol.28,no.1,pp.1–20,1993.
[9] R. Ragozzino, J. J. Reuer, and L. Trigeorgis, “RealOptions in Strategy and Finance: Current
GapsandFutureLinkages,”Acad.Manag.Perspect.,vol.30,no.4,pp.428–440,2016.
[10] A.MenichiniandM.Celiktas,Case:RealOptionsinDefenseR&D.2016.
[11] “Real Option,” Investopedia. [Online]. Available:
http://www.investopedia.com/terms/r/realoption.asp.[Accessed:01-Jul-2017].
[12] A.M. Batkovskiy, A. V. Leonov, A. Y. Pronin, E. G. Semenova, andA. V. Fomina, “Models of
EconomicEvaluationofHigh-TechProducts,”IndianJ.Sci.Technol.,vol.9,no.28,2016.
[13] D. F. Rico, “ROI of Technology Readiness Assessments Using Real Options: An Analysis of
GAODatafrom62U.S.DoDPrograms,”Unpubl.WhitePap.,2007.
[14] H.S..HerathandC.S.Park,“EconomicAnalysisofR&DProjects:AnOptonsApproach,”Eng.
Econ.,vol.44,no.1,pp.1–35,1999.
[15] R.G.Cooper,“ManagingTechnologyDevelopmentProjects,”IEEEEng.Manag.Rev.,vol.35,
no.1,pp.67–76,2007.
[16] J.C.Mankins,“Technologyreadinessandriskassessments:Anewapproach,”ActaAstronaut.,
vol.65,no.9–10,pp.1208–1215,2009.
120
[17] G.L.Tritle,E.F.VScriven,andA.R.Fusfeld,“ResolvingUncertaintyinR&DPortfolios,”Res.-
TechnologyManag.,vol.43,no.6,pp.47–55,2000.
[18] L.M.Meadeanda.Presley,“R&Dprojectselectionusingtheanalyticnetworkprocess,”Eng.
Manag.IEEETrans.,vol.49,no.1,pp.59–66,2002.
[19] W.D.Bodensteiner,E.A.Gerloff,andJ.C.Quick,“Uncertaintyandstress inanR&Dproject
environment,”R&DManag.,vol.19,no.4,pp.309–322,1989.
[20] J.Wang,C.Y.Wang,andC.Y.Wu,“ArealoptionsframeworkforR&Dplanningintechnology-
basedfirms,”J.Eng.Technol.Manag.,vol.35,pp.93–114,2015.
[21] R. G. Cooper and E. J. Kleinschmidt, “Winning businesses in product development: The
criticalsuccessfactors,”Res.Manag.,vol.50,no.3,pp.52–66,2007.
[22] C. Carlsson, R. Fullér, M. Heikkilä, and P. Majlender, “A fuzzy approach to R&D project
portfolioselection,”Int.J.Approx.Reason.,vol.44,no.2,pp.93–105,2007.
[23] M.G.Lipsett,“PersonalCommunication.”2017.
[24] K. M. Kelm, V. K. Narayanan, and G. E. Pinches, “Shareholder Value Creation during R&D
InnovationandCommercializationStages,”Acad.Manag.,vol.38,no.3,pp.770–786,1995.
[25] Y. Lee and R. Gaertner, “Technology Transfer from University to Industry: A Larg–Scale
Experimentwith Technology Development and Commercialization,”Policy Stud. J., vol. 22,
no.2,pp.384–399,1994.
[26] D.Klar, J.Frishammar,V.Roman,andD.Hallberg, “ATechnologyReadinessLevelscale for
ironandsteel industriesATechnologyReadinessLevelscale for ironandsteel industries,”
Ironmak.Steelmak.,vol.43,no.7,pp.494–499,2016.
[27] E.W.EldredandM.E.Mcgrath, “CommercializingNewTechnology—II,”Res.Manag., vol.
40,no.2,pp.29–33,1997.
[28] J.BirkinshawandM.T.Hansen,“TheInnovationValueChain,”no.July,2007.
[29] L. Y. Cohen, P. W. Kamienski, and R. L. Espino, “Gate system focuses industrial basic
research,”Res.Manag.,vol.41,no.4,pp.34–37,1998.
[30] M.Hoegl,K.Weinkauf,andH.G.Gemuenden,“InterteamCoordination,ProjectCommitment,
andTeamworkinMultiteamR&DProjects:ALongitudinalStudy,”Organ.Sci.,vol.15,no.1,
pp.38–55,2004.
[31] U.S Government Accountability Office, “Technology Readiness Assessment Guide Best
Practices for Evaluating theReadiness of Technology forUse inAcquisitionPrograms and
Projects,”2016.
[32] Y. Z. Mehrjerdi and M. Dehghanbaghi, “A Dynamic Risk Analysis on New Product
121
DevelopmentProcess,”Int.J.Ind.Eng.Prod.Res.,vol.24,no.1,pp.17–35,2013.
[33] J. M. Eckhause, D. R. Hughes, and S. A. Gabriel, “Evaluating real options for mitigating
technicalriskinpublicsectorR&Dacquisitions,”Int. J.Proj.Manag.,vol.27,no.4,pp.365–
377,2009.
[34] N.Azizian, S. Sarkani, andT.Mazzuchi, “A comprehensive reviewand analysis ofmaturity
assessment approaches for improved decision support to achieve efficient defense
acquisition,”inProceedingsoftheWorldCongresson…,2009,vol.2.
[35] C.Dion-schwarz,“HowtheDepartmentofDefenseUsesTechnologyReadinessLevels,”2008.
[36] A.Olechowski,S.D.Eppinger,andN.Joglekar,“Technologyreadinesslevelsat40:Astudyof
state-of-the-artuse, challenges, andopportunities,” inPortland InternationalConferenceon
ManagementofEngineeringandTechnology(PICMET),2015,pp.2084–2094.
[37] I. Ameka and W. Dhewanto, “Technology Push vs. Market Pull in Technology University
InnovationCommercialization,”Inf.Manag.Bus.Rev.,vol.5,no.7,pp.337–341,2013.
[38] H. Munro and H. Noori, “Measuring Commitment to New Manufacturing Technology:
IntegratingTechnologicalPushandMarketingPullConcepts,”IEEETrans.Eng.Manag.,vol.
35,no.2,pp.63–70,1988.
[39] L. S. Wheatcraft, “Developing Requirements for Technology-Driven Products,” INCOSE Int.
Symp.,vol.15,no.1,pp.681–693,2005.
[40] G. Di Stefano, A. Gambardella, and G. Verona, “Technology push and demand pull
perspectives in innovation studies: Current findings and future research directions,” Res.
Policy,vol.41,no.8,pp.1283–1295,2012.
[41] G. F. Nemet, “Demand-pull, technology-push, and government-led incentives for non-
incrementaltechnicalchange,”Res.Policy,vol.38,no.5,pp.700–709,2009.
[42] M.Faizal,A.Zaidi,andS.N.Othman,“UnderstandingtheConceptofDynamicCapabilitiesby
DismantlingTeece,Pisano,andShuen(1997)’sDefinition,”Int.J.Acad.Res.Bus.Soc.Sci.,vol.
2,no.8,pp.367–378,2012.
[43] D.J.Teece,G.Pisano,andA.M.Y.Shuen,“DynamicCapabilitiesandStrategicManagement,”
Strateg.Manag.J.,vol.18,no.7,pp.509–533,1997.
[44] J.C.Mankins,“TechnologyReadinessLevels.AWhitePaper,”1995.
[45] K.Tomaschek,A.L.Olechowski,S.D.Eppinger,andN.R.Joglekar,“ASurveyofTechnology
ReadinessLevelUsers.,” inINCOSEInternationalSymposium,2016,vol.26,no.1,pp.2101–
2117.
[46] C.Piaszczyk, “ModelBasedSystemsEngineeringwithDepartmentofDefenseArchitectural
122
Framework,”Syst.Eng.,vol.14,no.3,pp.305–326,2011.
[47] B. Sauser, J. E. Ramirez-marquez, and W. Tan, “A Systems Approach to Expanding the
TechnologyReadinessLevelwithinDefenseAcquisition,”2009.
[48] DepartmentofDefense,“TechnologyReadinessAssessmentDeskbook,”2005.
[49] Dan Newman, “Technology Readiness Level and they Valley of Death,” 2017. [Online].
Available: http://www.boeing.com/features/innovation-quarterly/may2017/feature-
thought-leadership-newman.page.[Accessed:04-Jul-2017].
[50] NASA,“NASAEngineeringHandbook,”2007.
[51] NASA, “NASA TRL Definitions.” [Online]. Available:
https://www.nasa.gov/sites/default/files/trl.png.[Accessed:01-Jan-2017].
[52] R. Valerdi and R. J. Kohl, “An Approach to Technology Risk Management,” in Engineering
SystemsDivisionSymposium,2004,vol.3,pp.1–8.
[53] J.C.Mankins,“Technologyreadinessassessments:Aretrospective,”ActaAstronaut.,vol.65,
no.9–10,pp.1216–1223,2009.
[54] NationalResearchCouncilofCanada,“PersonalCommunication.”2017.
[55] J.C.Mankins, “Approaches toStrategicResearchandTechnology(R&T)AnalysisandRoad
Mapping,”ActaAstronaut.,vol.51,no.1–9,pp.3–21,2002.
[56] R. A. Bauer, P. S. Millar, and C. D. Norton, “Bridging the Technology Readiness ‘Valley of
Death’UtilizingNanosats,”2015.
[57] J. C. Mankins, “RESEARCH & DEVELOPMENT DEGREE OF DIFFICULTY. A White Paper.,”
1998.
[58] W.L.Nolte,B.M.Kennedy,andJ.DziegielRogerJ.,“TechnologyReadinessLevelCalculator,”
WhitePap.AirForceRes.Lab.2004.,pp.1–16,2003.
[59] J. E. Kasser, “Applying Holistic Thinking to the Problem of Determining the Future
AvailabilityofTechnology,” IEEETrans.Syst.Man,Cybern.Syst.,vol.46,no.3,pp.440–444,
2016.
[60] J. W. Bilbro, “Using the Advancement Degree of Difficulty (AD2) as an input to Risk
Management,”Multi-dimensionalAssess.Technol.Matur.Technol.Matur.Conf.,2008.
[61] S.Gavankar,S.Suh,andA.A.Keller,“TheRoleofScaleandTechnologyMaturityinLifeCycle
AssessmentofEmergingTechnologiesACaseStudyonCarbonNanotubes,”J.Ind.Ecol.,vol.
19,no.1,pp.51–60,2014.
[62] B.BasuandS.Ghosh,“Chapter11AssessmentofTechnologyandManufacturingReadiness
Levels,” inBiomaterials forMusculoskeletal Regeneration: Applications, Springer, 2016, pp.
123
235–246.
[63] B. Sauser, D. Verma, J. Ramirez-Marquez, and R. Gove, “From TRL to SRL: The concept of
systems readiness levels,” inConference on Systems Engineering Research, Los Angeles, CA,
2006.
[64] J.Fernandez,“ContextualRoleofTRLsandMRLsinTechnologyManagement,”SandiaNatl.
Lab.SAND2010-7595,no.November,2010.
[65] J. A. Keizer, J. I. M. Halman, andM. Song, “From experience: Applying the risk diagnosing
methodology,”J.Prod.Innov.Manag.,vol.19,no.3,pp.213–232,2002.
[66] V.Thorn,F.Hunt,R.Mitchell,D.Probert,andR.Phaal, “Internal technologyvaluation :real
worldissues,”Int.J.Technol.Manag.,vol.53,no.2–4,pp.149–160,2011.
[67] J.Wang andC. Y. Yang, “Flexibility planning formanagingR&Dprojects under risk,” Int. J.
Prod.Econ.,vol.135,no.2,pp.823–831,2012.
[68] H.Mikkelsen,“Riskmanagementinproductdevelopmentprojects,”Int.J.Proj.Manag.,vol.8,
no.4,pp.217–221,1990.
[69] M.Benaroch,“Option-BasedManagementofTechnologyInvestmentRisk,”vol.48,no.4,pp.
428–444,2001.
[70] K. Rudnik and A. M. Deptuła, “System with probabilistic fuzzy knowledge base and
parametricinferenceoperatorsinriskassessmentofinnovativeprojects,”ExpertSyst.Appl.,
vol.42,no.17–18,pp.6365–6379,2015.
[71] R. Balachandra and J. H. Friar, “Factors for Success in R&D Projects and New Product
Innovation :AContextualFramework,”IEEETrans.Eng.Manag.,vol.44,no.3,pp.276–287,
1997.
[72] S.K.SharmaandU.Chanda,“DevelopingaBayesianbeliefnetworkmodelforpredictionof
R&Dprojectsuccess,”J.Manag.Anal.,pp.1–24,2017.
[73] J. a Keizer, J. Vos, and J. I. M. Halman, “Risks in New Product Development Risks in New
ProductDevelopment,”no.February2003,pp.1–26,2005.
[74] T.Daim,ManagingTechnologicalInnovation:ToolsandMethods,Volume1.WorldScientific
Publishing,2017.
[75] Y.H.Park,“AStudyofR&DInvestmentFrameworkandSuccessFactors,”AsianJ.Qual.,vol.9,
no.1,pp.103–112,2008.
[76] J. Wu and Z. Wu, “Integrated risk management and product innovation in China: The
moderatingroleofboardofdirectors,”Technovation,vol.34,no.8,pp.466–476,2014.
[77] R. G. McGrath and I. C. MacMillan, “Assessing technology projects using real options
124
reasoning,”Res.…,vol.43,no.4,pp.35–49,2000.
[78] L.M. Brandscomb andP. E. Auerswald,TakingTechnical Risks:How Innovators,Managers,
andInvestorsManageRisk.MITPress,2003.
[79] R. G. McGrath, “A Real Options Logic for Initiating Technology Positioning Investments,”
Acad.Manag.Rev.,vol.22,no.4,pp.974–996,1997.
[80] L. Vincent, “Marketing Strategies for Commercialization of New Technologies,” Technol.
Innov.Gener.Econ.Results,pp.257–287,2016.
[81] B.Kayisetal.,“IRMAS-developmentofariskmanagementtoolforcollaborativemulti-site,
multi-partnernewproductdevelopmentprojects,” J.Manuf.Technol.Manag.,vol.18,no.4,
pp.387–414,2007.
[82] Jay J. Janney and Gregory G. Dess, “Can Real-Options Analysis Improve Decision-Making?
PromisesandPitfalls,”Acad.Manag.,vol.18,no.4,pp.60–75,2004.
[83] D.Hillson,“Extendingtheriskprocesstomanageopportunities,”Int.J.Proj.Manag.,vol.20,
no.3,pp.235–240,2002.
[84] S.L.Murray,K.Grantham,andS.B.Damle,“DevelopmentofaGenericRiskMatrixtoManage
ProjectRisks,”J.Ind.Syst.Eng.,vol.Vol.5,no.1,pp.35–51,2011.
[85] N. Fenton andM.Neil,Risk Assessment andDecision Analysiswith BayesianNetworks. CRC
Press,2012.
[86] V.Dumbrava,“UsingProbability–ImpactMatrixinAnalysisandRiskAssessmentProjects,”
J.Knowl.Manag.Econ.Inf.Technol.,no.SpecialIssue,pp.76–96,2013.
[87] L.AnthonyCox, “What’swrongwithriskmatrices?,”RiskAnal.,vol.28,no.2,pp.497–512,
2008.
[88] R.S.KaplanandD.P.Norton, “Thebalancedscorecard.Measures thatdriveperformance,”
Harvardbusinessreview,pp.71–79,2005.
[89] S.A.Mastroianni,“RiskManagementamongResearchandDevelopmentProjects,”2011.
[90] J.R.Hauser,“HowPuritan-Bennettusedthehouseofquality,”SloanManage.Rev.,vol.34,no.
3,pp.61–70,1993.
[91] E.Schwartz,“Therealoptionsapproachtovaluation:Challengesandopportunities,”Lat.Am.
J.Econ.,vol.50,no.2,pp.63–177,2013.
[92] U.Dzyuma,“Realoptionscomparedtotraditionalcompanyvaluationmethods:Possibilities
andconstraintsintheiruse,”e-Finanse,vol.8,no.2,p.51,2012.
[93] J.E.N. IiiandR.DeNeufville, “Hybridrealoptionsvaluationofriskyproductdevelopment
projects,”Int.J.Technol.PolicyManag.,vol.1,no.1,p.29,2001.
125
[94] S.-C.Lee,“Usingrealoptionanalysisforhighlyuncertaintechnologyinvestments:Thecaseof
windenergytechnology,”Renew.Sustain.EnergyRev.,vol.15,no.9,pp.4443–4450,2011.
[95] S.C.Myers,“Financetheoryandfinancialstrategy,”Midl.Corp.Financ.J.,vol.5,no.1,pp.6–
13,1987.
[96] B.DeReyck, Z.Degraeve, andR.Vandenborre, “Projectoptionsvaluationwithnetpresent
valueanddecisiontreeanalysis,”Eur.J.Oper.Res.,vol.184,no.1,pp.341–355,2008.
[97] E. S. Schwartz and L. Trigeorgis, Real Options and Investment under uncertainty: Classical
ReadingsandRecentContributions.MITPress,2004.
[98] N.T.Nang,N.Takezawa,andN.Takezawa,“Realoptionsandtheevaluationofresearchand
developementprojectsinthepharmaceuticalindustry:Acasestudy,”J.Oper.Res.Soc.Japan,
vol.45,no.4,pp.385–403,2002.
[99] J. Yliopisto, “Real Options Analysis as a tool for Start-Up Company Investment Valuation,”
UniversityofJyväskylä,2015.
[100] K.MilisandR.Mercken,“TheuseofthebalancedscorecardfortheevaluationofInformation
andCommunicationTechnologyprojects,”Int.J.Proj.Manag.,vol.22,no.2,pp.87–97,2004.
[101] R.G.Cooper,S.J.Edgett,andE.J.Kleinschmidt,“BestpracticesformanagingR&Dportfolios,”
Res.Manag.,vol.41,no.4,pp.20–33,1998.
[102] S.Block,“Are‘RealOptions’ActuallyUsedintheRealWorld?,”Eng.Econ.,vol.52,no.3,pp.
255–267,2007.
[103] P.KodukulaandC.Papudesu,ProjectValuationUsingRealOptions:APractitioner’sGuide. J.
RossPublishing,2006.
[104] C.W.-N..Chan,C.-H. .Cheng,A. .Gunasekaran,andK.-F. .Wong,“Aframeworkforapplying
realoptionsanalysistoinformationtechnologyinvestments,”Int.J.Ind.Syst.Eng.,vol.10,no.
2,pp.217–237,2012.
[105] F.BlackandM.Scholes,“ThePricingofOptionsandCorporateLiabilities,”J.Polit.Econ.,vol.
81,no.3,pp.637–654,2016.
[106] T. A. Luehrman, “Investment Opportunities as Real Options: Getting Started on the
Numbers,”Harv.Bus.Rev.,vol.76,no.4,pp.97–105,1998.
[107] C. M. Sipp and E. G. Carayannis, “Real Options and Strategic Technology Venturing,” Real
OptionsStrateg.Technol.Ventur.ANewParadig.Decis.Mak.,vol.31,pp.15–39,2013.
[108] J. C. Cox, S. A. Ross, andM. Rubinstein, “Option Pricing: A Simplified Approach,” J. financ.
econ.,vol.7,pp.229–263,1979.
[109] G. Sick, “Chapter 21 Real options,” inHandbooks in Operations Research andManagement
126
Science,vol.9,no.C,1995,pp.631–691.
[110] L.E.Brandão,J.S.Dyer,andW.J.Hahn,“UsingBinomialDecisionTreestoSolveReal-Option
ValuationProblems,”Decis.Anal.,vol.2,no.2,pp.69–88,2005.
[111] P.KodukulaandC.Papudesu,Projectvaluationusingrealoptions:apractioner’sguide.J.Ross
Publishing,2006.
[112] B.Tan,E.Anderson,J.Dyer,andG.Parker,“UsingBinomialDecisionTreesandRealOptions
Theory to Evaluate System Dynamics Models of Risky Projects,” Syst. Dyn. Rev., pp. 1–15,
2009.
[113] S.BenningaandE.Tolkowsky, “RealOptions -An IntroductionandanApplication toR&D
Valuation,”Eng.Econ.,vol.47,no.2,pp.151–168,2002.
[114] W.Bailey,B.Couët,andA.Bhandari,“Unlockingthevalueofrealoptions,”Oilf.Rev.,pp.4–19,
2003.
[115] C.Wernz,I.Gehrke,andD.R.Ball,“Managerialdecision-makinginhospitalswithrealoptions
analysis,”Inf.Syst.E-bus.Manag.,vol.13,no.4,pp.673–691,2015.
[116] O.Yu, “Applicationof realoptionsanalysis to technologyportfolioplanning: a case study,”
Int.J.Qual.Reliab.Manag.,vol.25,pp.52–59,2008.
[117] L. T. Miller and C. S. Park, “Decision Making Under Uncertainty—Real Options to the
Rescue?,”Eng.Econ.,vol.47,no.2,pp.105–150,2002.
[118] A.K.DixitandR.S.Pindyck,Investmentunderuncertainty.PrincetonUniversityPress,1994.
[119] M.Boyer,P.Christoffersen,P.Lasserre,andA.Pavlov,“Valuecreation,RiskManagementand
RealOptions,”2003.
[120] R. Adner andD. A. Levinthal, “What Is Not a Real Option: Considering Boundaries for the
ApplicationofRealOptionstoBusinessStrategy,”Acad.Manag.Rev.,vol.29,no.1,pp.74–85,
2004.
[121] B.Fernandes, J.Cunha,andP.Ferreira, “Theuseof realoptionsapproach inenergysector
investments,”Renew.Sustain.EnergyRev.,vol.15,no.9,pp.4491–4497,2011.
[122] S.M.Ross,“AnElementaryIntroductiontoMathematicalFinance:OptionsandOtherTopics,”
J.Am.Stat.Assoc.,vol.99,no.466,pp.563–563,2004.
[123] T. Driouchi and D. Bennett, “Real options in multinational decision-making: Managerial
awarenessandriskimplications,”J.WorldBus.,vol.46,no.2,pp.205–219,2011.
[124] E.A.Martínez-Ceseñaand J.Mutale, “Applicationofanadvancedrealoptionsapproach for
renewableenergygenerationprojectsplanning,”Renew.Sustain.EnergyRev.,vol.15,no.4,
pp.2087–2094,2011.

127
[125] L.TrigeorgisandJ.J.Reuer,“RealOptionsTheoryinStrategicManagement,”Strateg.Manag.
J.,vol.38,no.1,pp.42–63,2017.
[126] D.M.LanderandG.E.Pinches,“Challengestothepracticalimplementationofmodelingand
valuingrealoptions,”Q.Rev.Econ.Financ.,vol.38,no.3,pp.537–567,1998.
[127] T. Eschenbach, N. Lewis, M. Henrie, E. Baker, and J. C. Hartman, “Real Options and Real
EngineeringProjects,”Eng.Manag.J.,vol.19,no.4,pp.11–19,2007.
[128] A. Kumaraswamy, “A real options perspective of firms’ R&D investments,” New York
University,1996.
[129] T.E.CopelandandV.Antikarov,RealOptions:APractitioner’sGuide.NewYork,2001.
[130] M. Amram and N. Kulatilaka, Real options: Managing strategic investment in an uncertain
world.OxfordUniversityPress,1998.
[131] B.Tan,E.G.Anderson, J. S.Dyer,andG.G.Parker, “Evaluatingsystemdynamicsmodelsof
risky projects using decision trees: alternative energy projects as an illustrative example,”
Syst.Dyn.Rev.,vol.26,no.1,pp.1–17,2010.
[132] A.M.Law,SimulationModeling&Analysis,4thEditio.2007.
[133] J.MunandT.Housel,“APrimeronApplyingMonteCarloSimulation,RealOptionsAnalysis,
KnowledgeValueAdded,Forecasting,andPortfolioOptimization,”2010.
[134] M. Benaroch, “Real Options Models for Proactive Uncertainty-Reducing Mitigations and
ApplicationsinCybersecurityInvestmentDecision-Making,”2017.
[135] R. Shishko, D. H. Ebbeler, and G. Fox, “NASA technology assessment using real options
valuation,”Syst.Eng.,vol.7,no.1,pp.1–12,2004.
[136] R. Shishko and D. H. Ebbeler, “A Real-Options Approach for NASA Strategic Technology
Selection,”1999.
[137] H.ELKUS, “Why InvestorsLike toSeeaPatentBeforeBackinganEntrepreneur,”TheWall
Street Journal, 2013. [Online]. Available: https://blogs.wsj.com/experts/2013/12/03/why-
investors-like-to-see-a-patent-before-backing-an-entrepreneur/.[Accessed:01-Jun-2017].
[138] NASA,“NASAESMPTRLAssessmentWorkbook.”2015.
[139] D. A. Marca, “Augmenting SADTTM To Develop Computer Support for Cooperative Work
DavidA.Marca1,”Architecture,1991.
[140] SDTC, “Risk Profile vs. Stages of TechnologyDevelopment& Commercialization.” [Online].
Available: https://roelfwoldring.files.wordpress.com/2009/07/enterpriserisk.jpg.
[Accessed:01-May-2017].
[141] O.FuerstandU.Geiger,FromConcepttoWallStreet:ACompleteGuidetoEntrepreneurship
128
andVentureCapital,1stEditio.FinancialTimesPrenticeHall,2003.
[142] A.Triantis,“ApplyingaRealOptionsAnalysis,”AccentureAcademy,2013.[Online].Available:
https://www.accentureacademy.com/d/blog/257/?GoBackTo=74F5C9A9#/u/blog/257.
[143] M.Lipsett,“ENGM620:RealOptionsValuations.”2017.
[144] P. Balogh, P. Golea, and V. Inceu, “Profit Forecast Model UsingMonte Carlo Simulation in
Excel,”Rom.Stat.Rev.,vol.61,no.12,pp.33–40,2013.
[145] J. Flatto, “The application of real options to IT valuation process a benchmark study,”
UniversityofNewHaven,1996.
[146] CopperstoneTechnologies, “CopperstoneTechnologiesEngineeringConsultingandRobotic
SystemsforRemoteEnvironmentalMonitoring,”2017.
[147] CopperstoneTechnologies, “CopperstoneTechnologiesRobotic Systems forEnvironmental
Monitoring,”2017.
[148] S. Dwyer, “Agile Design Project Methodology for Small Teams Developing Mechatronic
Systems,”UniversityofAlberta,2017.
[149] W.Baird,“BoronNitrideNanotubes,”2014.
[150] NationalResearchCouncilofCanada,“NRCMakesWorld-FirstDemonstrationofPilot-Scale
Boron Nitride Nanotube Production,” 2014. [Online]. Available:
http://www.marketwired.com/press-release/nrc-makes-world-first-demonstration-of-
pilot-scale-boron-nitride-nanotube-production-1941973.htm.
[151] National Research Council of Canada, “Pure Strength Super Tubes: the strong-and-petite
type.” [Online]. Available: http://www.nrc-
cnrc.gc.ca/eng/about/centennial/100_years/2010_beyond.html/#s86. [Accessed: 11-Aug-
2017].
[152] National Research Council of Canada, “A big opportunity for microscopic fibres,” 2016.
[Online]. Available: http://www.nrc-
cnrc.gc.ca/eng/achievements/highlights/2016/microscopic_fibers.html. [Accessed: 11-Aug-
2017].
[153] J.BusbyandC.Pitts, “Realoptionsandcapital investmentdecisions,”Manag.Account., vol.
75,no.10,pp.38–39,1997.
[154] N.SmallwoodandD.Ulrich,“CapitalizingCapabilities,”HarvardBusinessReview,2004.
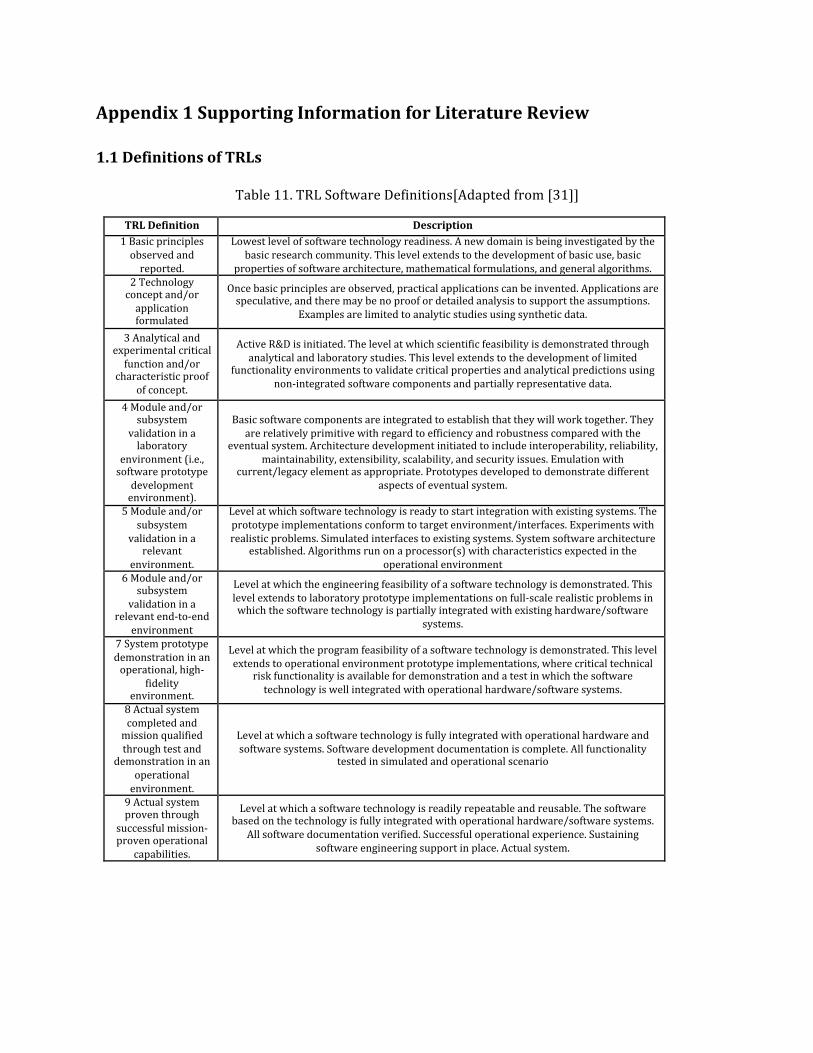
Appendix1SupportingInformationforLiteratureReview
1.1DefinitionsofTRLs
Table11.TRLSoftwareDefinitions[Adaptedfrom[31]]
TRLDefinition Description1Basicprinciplesobservedandreported.
Lowestlevelofsoftwaretechnologyreadiness.Anewdomainisbeinginvestigatedbythebasicresearchcommunity.Thislevelextendstothedevelopmentofbasicuse,basic
propertiesofsoftwarearchitecture,mathematicalformulations,andgeneralalgorithms.2Technologyconceptand/orapplicationformulated
Oncebasicprinciplesareobserved,practicalapplicationscanbeinvented.Applicationsarespeculative,andtheremaybenoproofordetailedanalysistosupporttheassumptions.
Examplesarelimitedtoanalyticstudiesusingsyntheticdata.
3Analyticalandexperimentalcriticalfunctionand/or
characteristicproofofconcept.
ActiveR&Disinitiated.Thelevelatwhichscientificfeasibilityisdemonstratedthroughanalyticalandlaboratorystudies.Thislevelextendstothedevelopmentoflimited
functionalityenvironmentstovalidatecriticalpropertiesandanalyticalpredictionsusingnon-integratedsoftwarecomponentsandpartiallyrepresentativedata.
4Moduleand/orsubsystem
validationinalaboratory
environment(i.e.,softwareprototype
developmentenvironment).
Basicsoftwarecomponentsareintegratedtoestablishthattheywillworktogether.Theyarerelativelyprimitivewithregardtoefficiencyandrobustnesscomparedwiththe
eventualsystem.Architecturedevelopmentinitiatedtoincludeinteroperability,reliability,maintainability,extensibility,scalability,andsecurityissues.Emulationwith
current/legacyelementasappropriate.Prototypesdevelopedtodemonstratedifferentaspectsofeventualsystem.
5Moduleand/orsubsystem
validationinarelevant
environment.
Levelatwhichsoftwaretechnologyisreadytostartintegrationwithexistingsystems.Theprototypeimplementationsconformtotargetenvironment/interfaces.Experimentswithrealisticproblems.Simulatedinterfacestoexistingsystems.Systemsoftwarearchitecture
established.Algorithmsrunonaprocessor(s)withcharacteristicsexpectedintheoperationalenvironment
6Moduleand/orsubsystem
validationinarelevantend-to-end
environment
Levelatwhichtheengineeringfeasibilityofasoftwaretechnologyisdemonstrated.Thislevelextendstolaboratoryprototypeimplementationsonfull-scalerealisticproblemsinwhichthesoftwaretechnologyispartiallyintegratedwithexistinghardware/software
systems.
7Systemprototypedemonstrationinanoperational,high-
fidelityenvironment.
Levelatwhichtheprogramfeasibilityofasoftwaretechnologyisdemonstrated.Thislevelextendstooperationalenvironmentprototypeimplementations,wherecriticaltechnical
riskfunctionalityisavailablefordemonstrationandatestinwhichthesoftwaretechnologyiswellintegratedwithoperationalhardware/softwaresystems.
8Actualsystemcompletedandmissionqualifiedthroughtestand
demonstrationinanoperationalenvironment.
Levelatwhichasoftwaretechnologyisfullyintegratedwithoperationalhardwareandsoftwaresystems.Softwaredevelopmentdocumentationiscomplete.Allfunctionality
testedinsimulatedandoperationalscenario
9Actualsystemproventhrough
successfulmission-provenoperational
capabilities.
Levelatwhichasoftwaretechnologyisreadilyrepeatableandreusable.Thesoftwarebasedonthetechnologyisfullyintegratedwithoperationalhardware/softwaresystems.
Allsoftwaredocumentationverified.Successfuloperationalexperience.Sustainingsoftwareengineeringsupportinplace.Actualsystem.
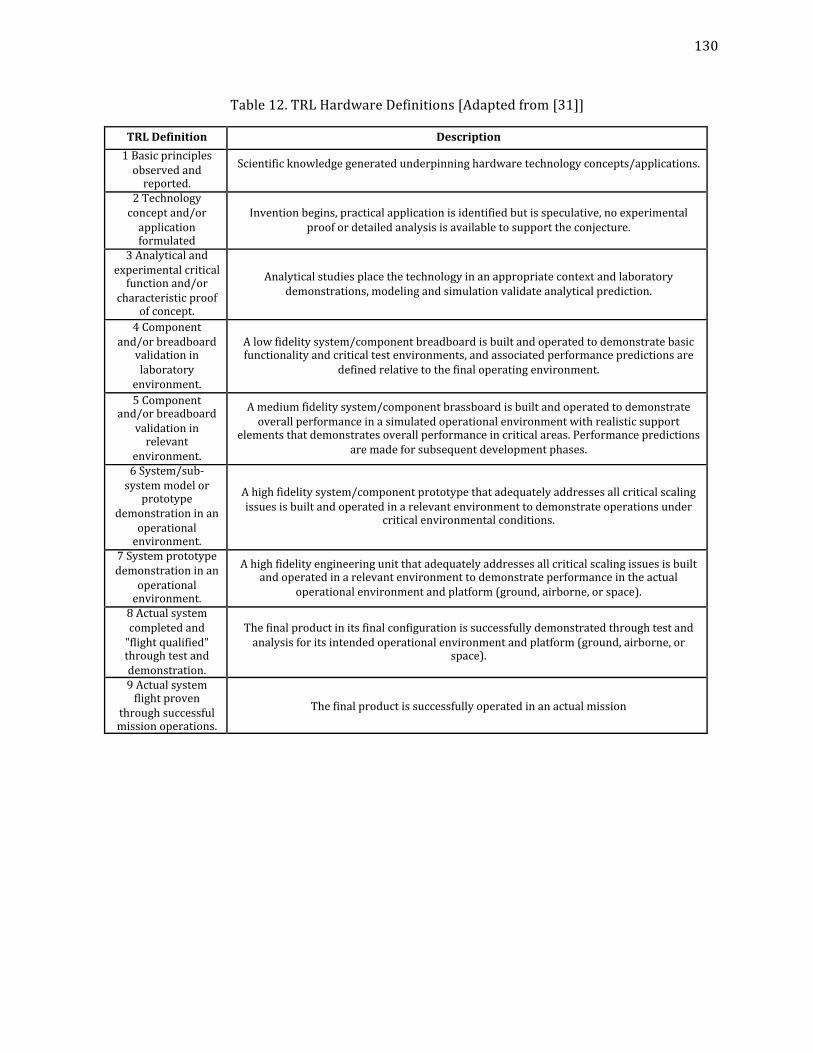
130
Table12.TRLHardwareDefinitions[Adaptedfrom[31]]
TRLDefinition Description1Basicprinciplesobservedandreported.
Scientificknowledgegeneratedunderpinninghardwaretechnologyconcepts/applications.
2Technologyconceptand/orapplicationformulated
Inventionbegins,practicalapplicationisidentifiedbutisspeculative,noexperimentalproofordetailedanalysisisavailabletosupporttheconjecture.
3Analyticalandexperimentalcriticalfunctionand/or
characteristicproofofconcept.
Analyticalstudiesplacethetechnologyinanappropriatecontextandlaboratorydemonstrations,modelingandsimulationvalidateanalyticalprediction.
4Componentand/orbreadboard
validationinlaboratoryenvironment.
Alowfidelitysystem/componentbreadboardisbuiltandoperatedtodemonstratebasicfunctionalityandcriticaltestenvironments,andassociatedperformancepredictionsare
definedrelativetothefinaloperatingenvironment.
5Componentand/orbreadboard
validationinrelevant
environment.
Amediumfidelitysystem/componentbrassboardisbuiltandoperatedtodemonstrateoverallperformanceinasimulatedoperationalenvironmentwithrealisticsupport
elementsthatdemonstratesoverallperformanceincriticalareas.Performancepredictionsaremadeforsubsequentdevelopmentphases.
6System/sub-systemmodelor
prototypedemonstrationinan
operationalenvironment.
Ahighfidelitysystem/componentprototypethatadequatelyaddressesallcriticalscalingissuesisbuiltandoperatedinarelevantenvironmenttodemonstrateoperationsunder
criticalenvironmentalconditions.
7Systemprototypedemonstrationinan
operationalenvironment.
Ahighfidelityengineeringunitthatadequatelyaddressesallcriticalscalingissuesisbuiltandoperatedinarelevantenvironmenttodemonstrateperformanceintheactual
operationalenvironmentandplatform(ground,airborne,orspace).
8Actualsystemcompletedand"flightqualified"throughtestanddemonstration.
Thefinalproductinitsfinalconfigurationissuccessfullydemonstratedthroughtestandanalysisforitsintendedoperationalenvironmentandplatform(ground,airborne,or
space).
9Actualsystemflightproven
throughsuccessfulmissionoperations.
Thefinalproductissuccessfullyoperatedinanactualmission
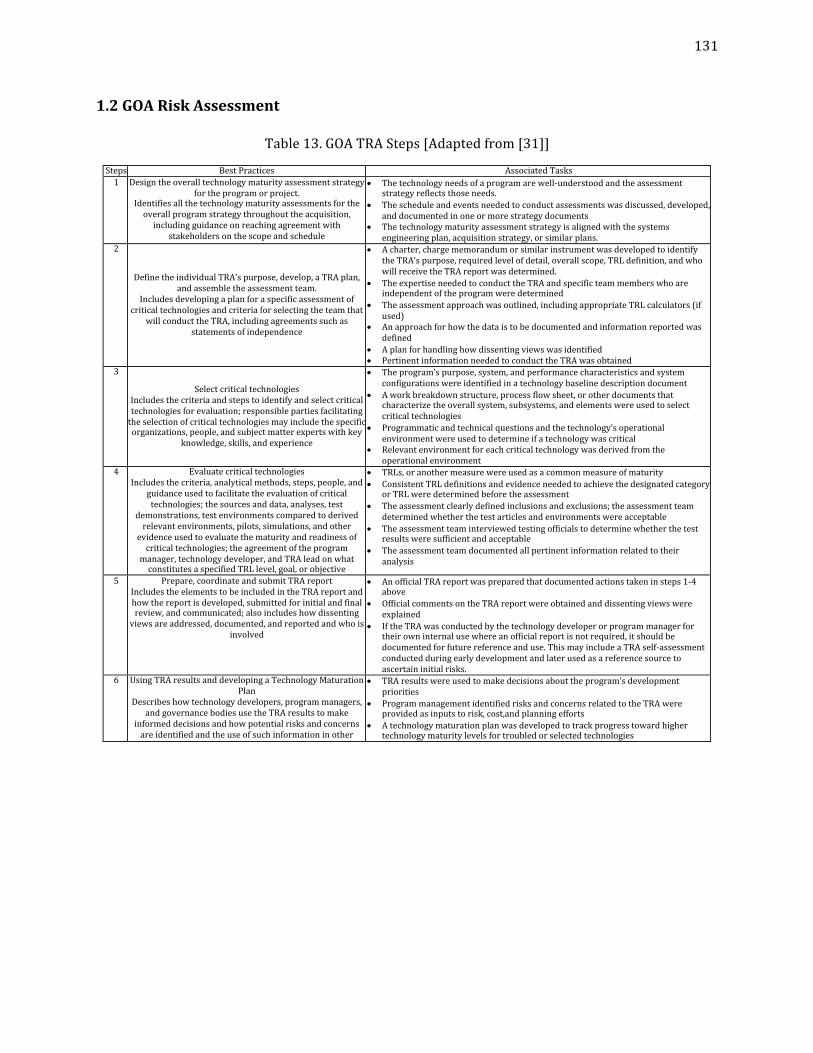
131
1.2GOARiskAssessment
Table13.GOATRASteps[Adaptedfrom[31]]
Steps BestPractices AssociatedTasks1 Designtheoveralltechnologymaturityassessmentstrategy
fortheprogramorproject.Identifiesallthetechnologymaturityassessmentsfortheoverallprogramstrategythroughouttheacquisition,includingguidanceonreachingagreementwith
stakeholdersonthescopeandschedule
• Thetechnologyneedsofaprogramarewell-understoodandtheassessmentstrategyreflectsthoseneeds.
• Thescheduleandeventsneededtoconductassessmentswasdiscussed,developed,anddocumentedinoneormorestrategydocuments
• Thetechnologymaturityassessmentstrategyisalignedwiththesystemsengineeringplan,acquisitionstrategy,orsimilarplans.
2
DefinetheindividualTRA’spurpose,develop,aTRAplan,andassembletheassessmentteam.
Includesdevelopingaplanforaspecificassessmentofcriticaltechnologiesandcriteriaforselectingtheteamthat
willconducttheTRA,includingagreementssuchasstatementsofindependence
• Acharter,chargememorandumorsimilarinstrumentwasdevelopedtoidentifytheTRA’spurpose,requiredlevelofdetail,overallscope,TRLdefinition,andwhowillreceivetheTRAreportwasdetermined.
• TheexpertiseneededtoconducttheTRAandspecificteammemberswhoareindependentoftheprogramweredetermined
• Theassessmentapproachwasoutlined,includingappropriateTRLcalculators(ifused)
• Anapproachforhowthedataistobedocumentedandinformationreportedwasdefined
• Aplanforhandlinghowdissentingviewswasidentified• PertinentinformationneededtoconducttheTRAwasobtained
3
SelectcriticaltechnologiesIncludesthecriteriaandstepstoidentifyandselectcriticaltechnologiesforevaluation;responsiblepartiesfacilitatingtheselectionofcriticaltechnologiesmayincludethespecificorganizations,people,andsubjectmatterexpertswithkey
knowledge,skills,andexperience
• Theprogram’spurpose,system,andperformancecharacteristicsandsystemconfigurationswereidentifiedinatechnologybaselinedescriptiondocument
• Aworkbreakdownstructure,processflowsheet,orotherdocumentsthatcharacterizetheoverallsystem,subsystems,andelementswereusedtoselectcriticaltechnologies
• Programmaticandtechnicalquestionsandthetechnology’soperationalenvironmentwereusedtodetermineifatechnologywascritical
• Relevantenvironmentforeachcriticaltechnologywasderivedfromtheoperationalenvironment
4 EvaluatecriticaltechnologiesIncludesthecriteria,analyticalmethods,steps,people,and
guidanceusedtofacilitatetheevaluationofcriticaltechnologies;thesourcesanddata,analyses,test
demonstrations,testenvironmentscomparedtoderivedrelevantenvironments,pilots,simulations,andotherevidenceusedtoevaluatethematurityandreadinessofcriticaltechnologies;theagreementoftheprogram
manager,technologydeveloper,andTRAleadonwhatconstitutesaspecifiedTRLlevel,goal,orobjective
• TRLs,oranothermeasurewereusedasacommonmeasureofmaturity• ConsistentTRLdefinitionsandevidenceneededtoachievethedesignatedcategory
orTRLweredeterminedbeforetheassessment• Theassessmentclearlydefinedinclusionsandexclusions;theassessmentteam
determinedwhetherthetestarticlesandenvironmentswereacceptable• Theassessmentteaminterviewedtestingofficialstodeterminewhetherthetest
resultsweresufficientandacceptable• Theassessmentteamdocumentedallpertinentinformationrelatedtotheir
analysis
5 Prepare,coordinateandsubmitTRAreportIncludestheelementstobeincludedintheTRAreportandhowthereportisdeveloped,submittedforinitialandfinalreview,andcommunicated;alsoincludeshowdissentingviewsareaddressed,documented,andreportedandwhois
involved
• AnofficialTRAreportwaspreparedthatdocumentedactionstakeninsteps1-4above
• OfficialcommentsontheTRAreportwereobtainedanddissentingviewswereexplained
• IftheTRAwasconductedbythetechnologydeveloperorprogrammanagerfortheirowninternalusewhereanofficialreportisnotrequired,itshouldbedocumentedforfuturereferenceanduse.ThismayincludeaTRAself-assessmentconductedduringearlydevelopmentandlaterusedasareferencesourcetoascertaininitialrisks.
6 UsingTRAresultsanddevelopingaTechnologyMaturationPlan
Describeshowtechnologydevelopers,programmanagers,andgovernancebodiesusetheTRAresultstomake
informeddecisionsandhowpotentialrisksandconcernsareidentifiedandtheuseofsuchinformationinother
• TRAresultswereusedtomakedecisionsabouttheprogram’sdevelopmentpriorities
• ProgrammanagementidentifiedrisksandconcernsrelatedtotheTRAwereprovidedasinputstorisk,cost,andplanningefforts
• Atechnologymaturationplanwasdevelopedtotrackprogresstowardhighertechnologymaturitylevelsfortroubledorselectedtechnologies

132
1.3PotentialRisksinR&D
Figure31.PotentialRisks[Adaptedfrom[65]]
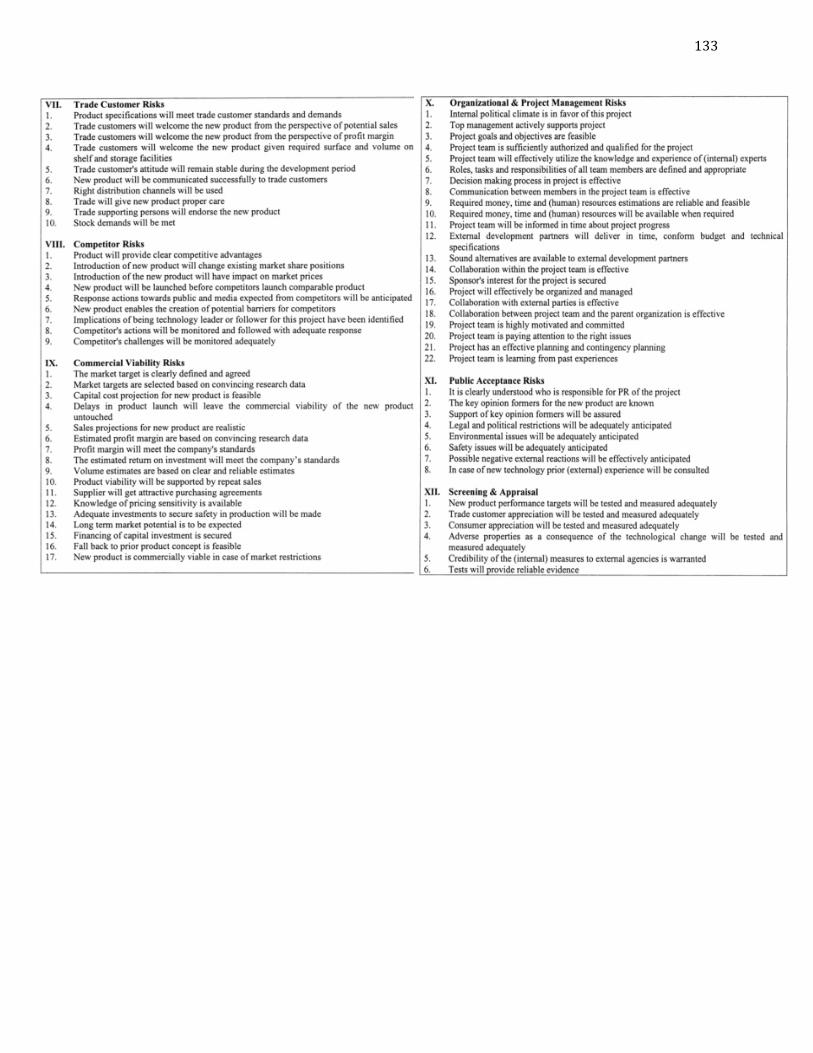
133
134
Appendix2CaseStudySupportingInformation
TheinformationinA2.1toA2.5iscourtesyofCopperstoneTechnologies[146][147].
2.1CopperstoneTeamBios
Co-founderandPresident
JamieYuen,M.Sc.,EIT,MechanicalEngineering
Jamie’s focus is onmechanical, electronics hardware, software design and testing. His role is to
managetheday-to-dayproductionoperations,contractsandprocurement.
Co-founderandDirector
NicolasOlmedo,B.Sc.,EIT,MechanicalEngineering
Nicolasworks on the design anddevelopment of robotic system includingmechanical, electrical,
andsoftwarecomponents.Heisalsoinvolvedinbusinessdevelopmentactivities.
Co-founderandDirector
StephenDwyer,B.Sc.,EIT,MechanicalEngineering
Stephen is the primary firmware developer, implements hardware and firmware embedded
systemsdesignanddevelopment,aswellasmechanicalandroboticdesignanddevelopment.
CTOandAdvisor
MichaelLipsett,Ph.D.,P.Eng,MechanicalEngineering
Michael is a Professor in theEngineeringManagementGroup at theUniversity ofAlbertawith a
Ph.D. from Queen’s University on Robot Looseness Fault Detection. He has been a Research
Engineer forAtomicEnergyofCanadaLimited,developedremoteandrobotic tooling,performed
labandfieldprototypeevaluation,andhasexperienceinprojectmanagement.Michaelhasbeena
Research Associate at Syncrude and supervised the development of BMI remote monitoring
technologyandallCopperstoneinitiatives.
135
BusinessDevelopment,Marketing,Sales&Strategy
SarahPrendergast,MBA(Finance)
Sarah is the most recent addition to CST. She joined in April 2017 after completing an MBA in
FinancefromtheUniversityofAlberta.ShehasaBScinBiologicalSciencesfromtheUniversityof
Alberta and brings a wide-range of expertise to the team. She is currently working on business
strategy and positioning for CST, aswell as operating organization and themarketing, sales and
businessstrategy.
Pre-VMSProgram
Currently have twobusinessmentorswith a combinationof industrybackground and successful
entrepreneurialexperience.Theirnameshavenotbeenshared.
Positionsthathavenotbeenfilled:
________–AdvisoryBoard
PhDinFinance–Corporatefinance,venturecapitalandinnovation
_______–AdvisoryBoard
MBAFinance,JD
LegalCouncil(______,_______&________)
________–AdvisoryBoard
ComputerEngineeringTechnologyandProfessionalManagement
SoftwareDeveloper(_____,_____&_______)
SuccessfulEntrepreneur(_________)
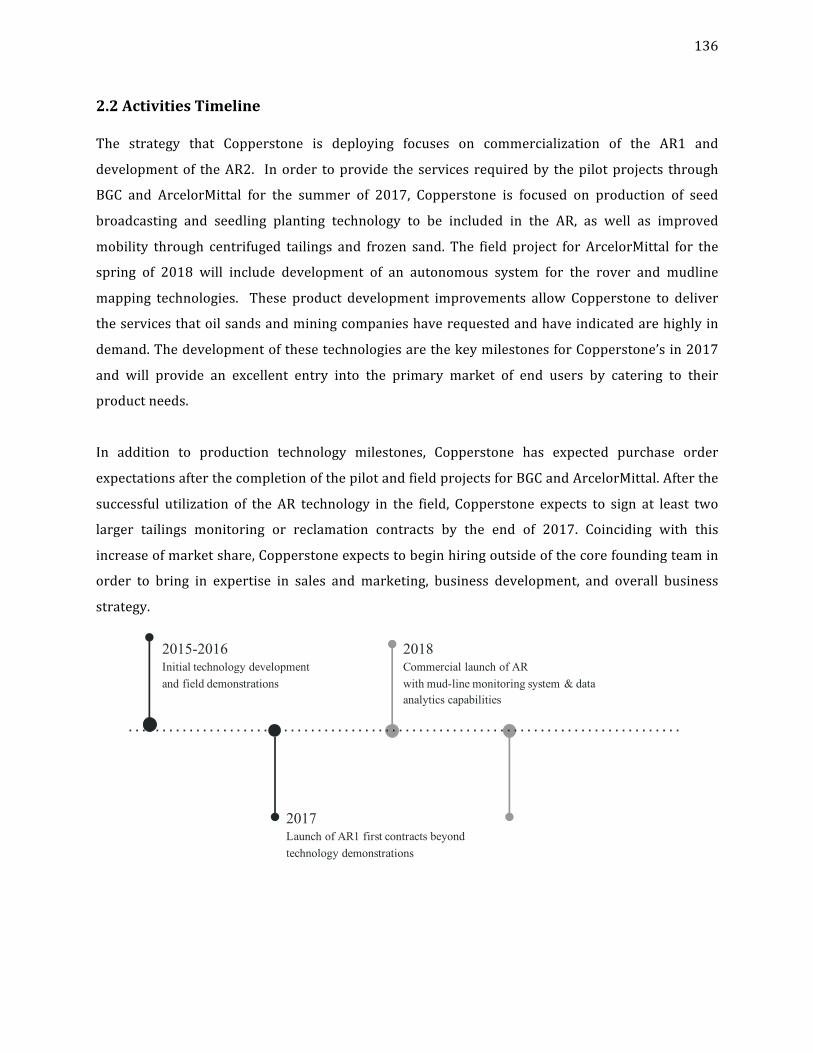
136
2.2ActivitiesTimeline
The strategy that Copperstone is deploying focuses on commercialization of the AR1 and
developmentof theAR2. Inorder toprovide the services requiredby thepilotprojects through
BGC and ArcelorMittal for the summer of 2017, Copperstone is focused on production of seed
broadcasting and seedling planting technology to be included in the AR, as well as improved
mobility through centrifuged tailings and frozen sand. The field project for ArcelorMittal for the
spring of 2018 will include development of an autonomous system for the rover and mudline
mapping technologies. These product development improvements allow Copperstone to deliver
theservicesthatoilsandsandminingcompanieshaverequestedandhaveindicatedarehighlyin
demand.ThedevelopmentofthesetechnologiesarethekeymilestonesforCopperstone’sin2017
and will provide an excellent entry into the primary market of end users by catering to their
productneeds.
In addition to production technology milestones, Copperstone has expected purchase order
expectationsafterthecompletionofthepilotandfieldprojectsforBGCandArcelorMittal.Afterthe
successful utilization of the AR technology in the field, Copperstone expects to sign at least two
larger tailings monitoring or reclamation contracts by the end of 2017. Coinciding with this
increaseofmarketshare,Copperstoneexpectstobeginhiringoutsideofthecorefoundingteamin
order to bring in expertise in sales and marketing, business development, and overall business
strategy.
2015-2016Initial technology development and field demonstrations
2017Launch of AR1 first contracts beyond technology demonstrations
2018Commercial launch of ARwith mud-line monitoring system & data analytics capabilities
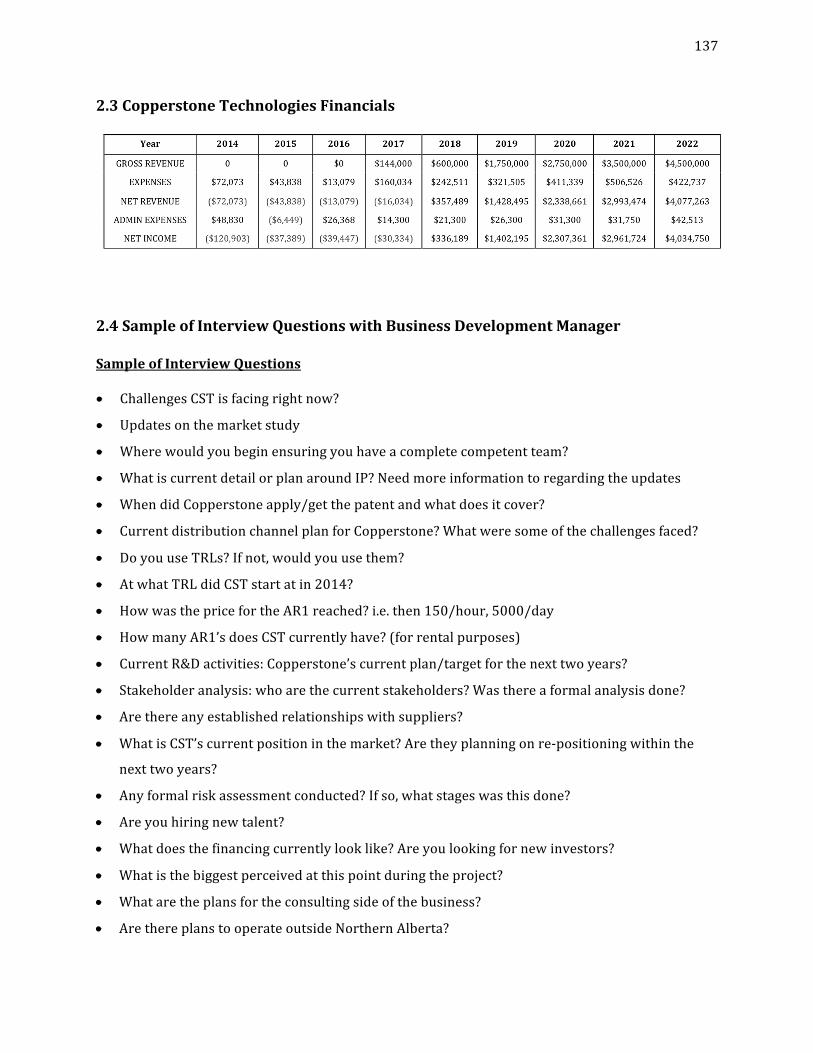
137
2.3CopperstoneTechnologiesFinancials
2.4SampleofInterviewQuestionswithBusinessDevelopmentManager
SampleofInterviewQuestions
• ChallengesCSTisfacingrightnow?
• Updatesonthemarketstudy
• Wherewouldyoubeginensuringyouhaveacompletecompetentteam?
• WhatiscurrentdetailorplanaroundIP?Needmoreinformationtoregardingtheupdates
• WhendidCopperstoneapply/getthepatentandwhatdoesitcover?
• CurrentdistributionchannelplanforCopperstone?Whatweresomeofthechallengesfaced?
• DoyouuseTRLs?Ifnot,wouldyouusethem?
• AtwhatTRLdidCSTstartatin2014?
• HowwasthepricefortheAR1reached?i.e.then150/hour,5000/day
• HowmanyAR1’sdoesCSTcurrentlyhave?(forrentalpurposes)
• CurrentR&Dactivities:Copperstone’scurrentplan/targetforthenexttwoyears?
• Stakeholderanalysis:whoarethecurrentstakeholders?Wasthereaformalanalysisdone?
• Arethereanyestablishedrelationshipswithsuppliers?
• WhatisCST’scurrentpositioninthemarket?Aretheyplanningonre-positioningwithinthe
nexttwoyears?
• Anyformalriskassessmentconducted?Ifso,whatstageswasthisdone?
• Areyouhiringnewtalent?
• Whatdoesthefinancingcurrentlylooklike?Areyoulookingfornewinvestors?
• Whatisthebiggestperceivedatthispointduringtheproject?
• Whataretheplansfortheconsultingsideofthebusiness?
• ArethereplanstooperateoutsideNorthernAlberta?
138
• Whatcommercializationoptionswillyoubeconsideringandwhichoneareyoulearning
towards?
• WhatisyourrelationshipwithyourcompetitorConeTec?
• WherearetheARscurrentlybeingbuilt?Howlongdoesittaketobuildone?Howmuchdoesit
cost?
• Whatwerethebiggestdifficultiesduringtechnologydevelopment(besidesneedforcapital)?
• Doyouhaveanycontractssignedwithcustomers?
• Howdidyouconductamarketstudyanalysis?
2.5SummaryfromRelevantThesisDocument
Thefollowingisasummaryfrom[148].
Ingeneral:
• CSTdidnot communicatewith the clientas frequentlyas they shouldhave,whichmeant the
feedback was limited- this resulted in wasted efforts developing and configuring design.
parametersontheuserend,thatwerelaterdeemedunnecessarybytheclient.
• Therewasalackofscheduledprogressreportsandupdates.
• Work-breakdown was a challenge for the team. This affected team collaboration and
understandingofrequirementswhichleadtoimproperprioritization.
• Lackoftechnicalandmanagerialplanningleadtooverrunsonbudgetandschedules.
• Lackofstructuredscopeorvision.
• Lack of proper documentation throughout the project. Initial scope documents were not
updatedtoreflectchanges.Thiswassimilartodesigndocumentationaswell,whichleadtoan
increaseindifficultyinreviewingchangeswhichledtoamoretimedemandingprocesses.
• Technicalsuccessfeedbackwaslimited.
• Disciplineofprogresstrackingwasanissue.
• Duetolimitedtimeandimpropertimemanagementprototypeswerenotproperlytested.
• Issueswithinsufficientinfrastructureandcapabilitiestotestandaddresstechnicalproblems.
139
SpecifictotheARTechnologyProject:
• High uncertainty in requirements and technical risks because team did not properly collect
informationregardingoperatingenvironmentandconditions,whichaffectedtheteam’soverall
understanding and affect field testing. There was a lack in taking appropriate action when
dealingwithareasofhighuncertainty(thisoverallreducedthetechnicalsuccessoffieldtrials
conducted)–resultinginfieldtestingbeingpushedtoa latertimei.e.scheduleoverrunsand
additionalcosts.
• Limited to non-existent effort into conducting a formal market analysis. There was no
verificationofmarketconditionsthatwereprojectedatthestartof theproject.entiremarket
analysisconsistedofqualitativedatathatrepresentaverysmalldatasetfromlimitedsources.
• Theteamwassuccessfulincompletingtheprototypewithinashorttimeframe.CST’steamdid
betterthanpreviousworktheyhaddoneinthepast,soprototypingthisroundwasimprovedin
design,assemblyandmaintenanceareas.
• CSTwasabletoactquicklytomakechangessuggestedbasedonclientfeedback.Thiswasalso
duetothefactthatthedesignwasmorerobustandplannedbetterforchanges.
• ThisprototypewasdevelopedwithMOREstakeholderfeedbackandwastestedintheoperating
environment.
• Logicsandtransportationofrovertooperationalenvironmentwaschallenging.
• Highambiguityabouttheoperatingconditions,andtheteamshouldhaveidentifiedtheneedto
addresstheseareasofhighuncertaintyandshouldhavetakenappropriateaction.Failuretodo
soresultedinreductionintechnicalsuccessduringfieldtesting.
• Therewasnoformalriskmanagementcompletedduringdesign.However,safeworkpractices
andriskmitigationwereusedduringfabricationandtesting.
• High uncertainties due to limited understanding of the market and required technical
specifications (most of the specifications were obtained through discussion with a potential
customer).
• Theprojectfundingcameinternallyfromwithintheorganization.Fundswerelimited.
• Thebusinessmodelof thetechnologywasnotdecidedonat thestartof theprojecthowever,
the models considered for commercialization included sales of AR units, rental, leasing to
operators,orprovidingmeasurementdataservices.
• ThepotentialprimarymarketforARsisinenvironmentalmonitoring,withonlyasmallnumber
ofpotentialclients,butlargeamountofpotentialapplication(land).
• CSTcollaboratedwithapotentialclientduringtestinganddemonstrationactivities.
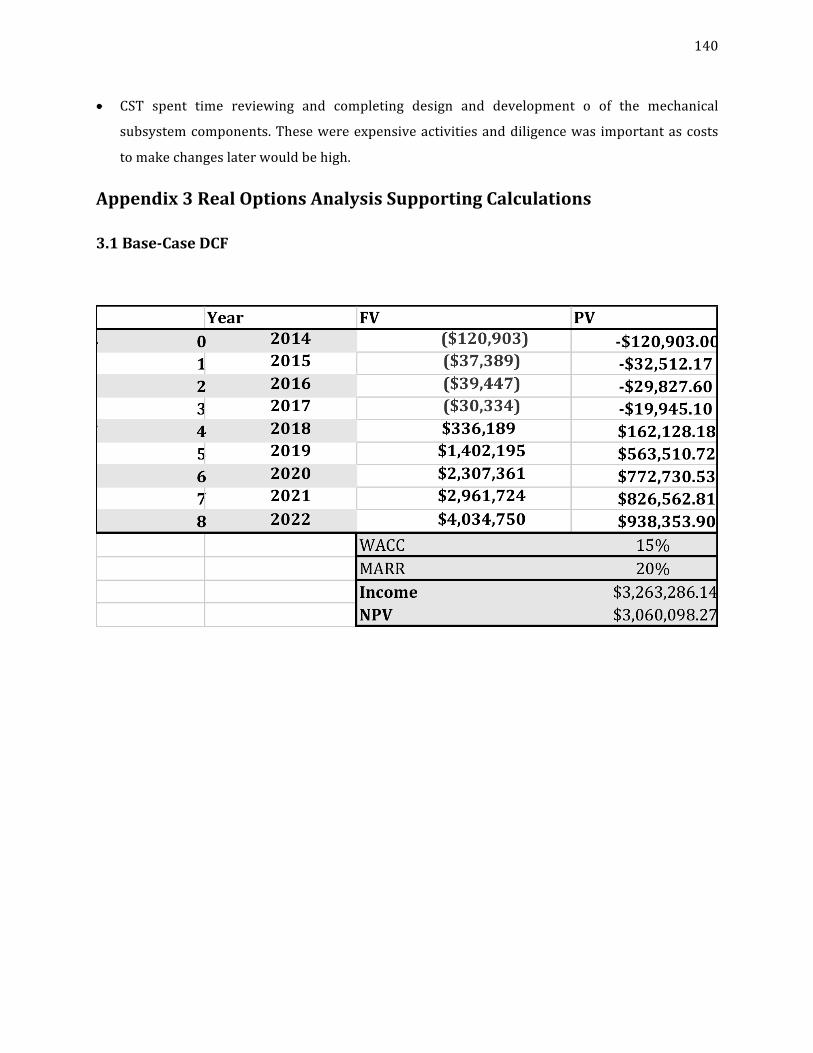
140
• CST spent time reviewing and completing design and development o of the mechanical
subsystemcomponents.Thesewereexpensiveactivitiesanddiligencewas importantascosts
tomakechangeslaterwouldbehigh.
Appendix3RealOptionsAnalysisSupportingCalculations
3.1Base-CaseDCF
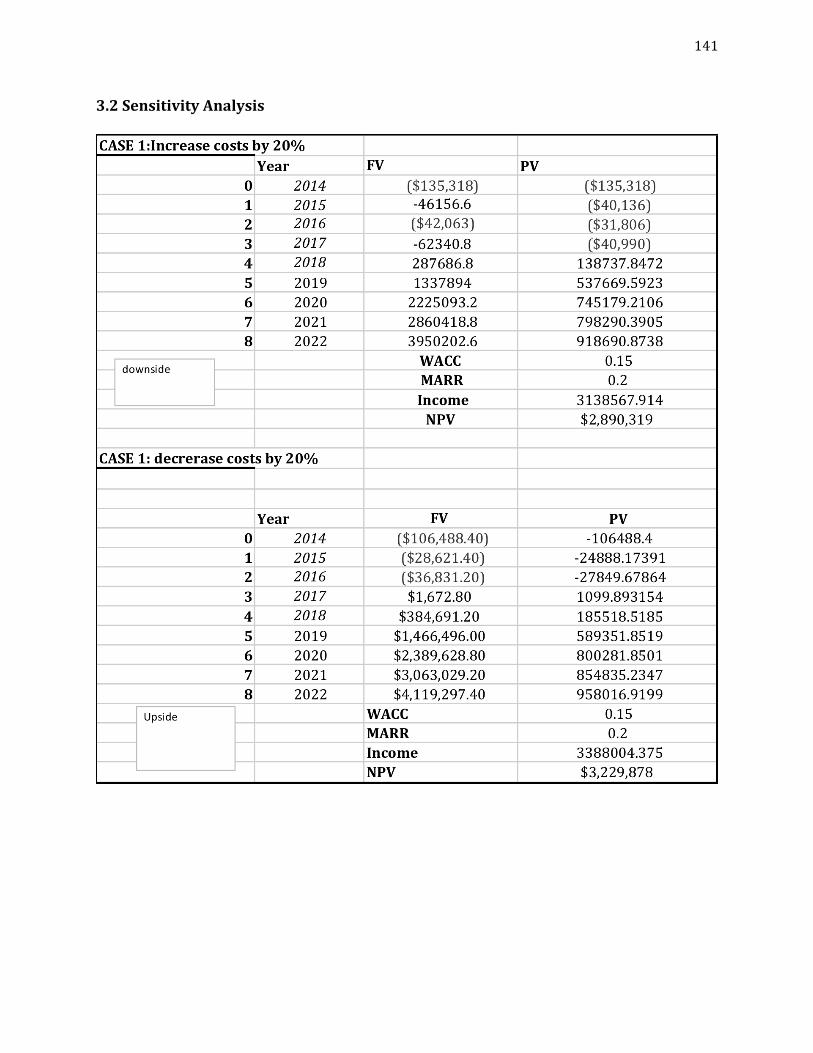
141
3.2SensitivityAnalysis
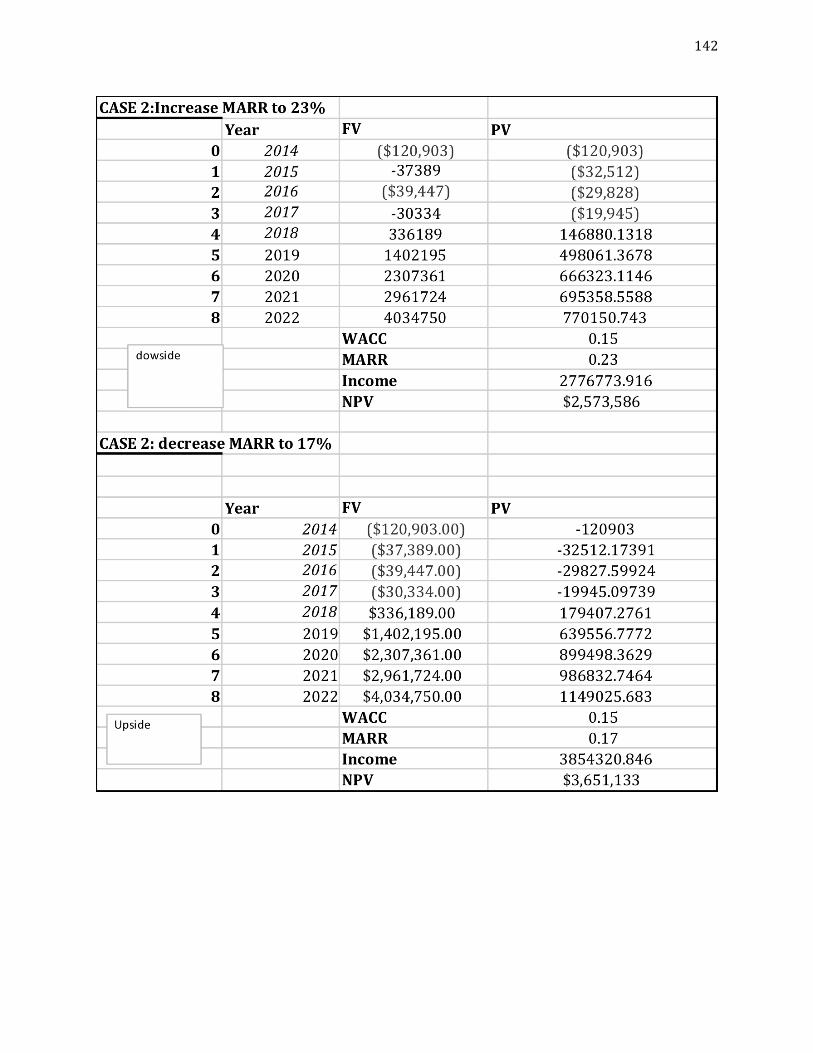
142
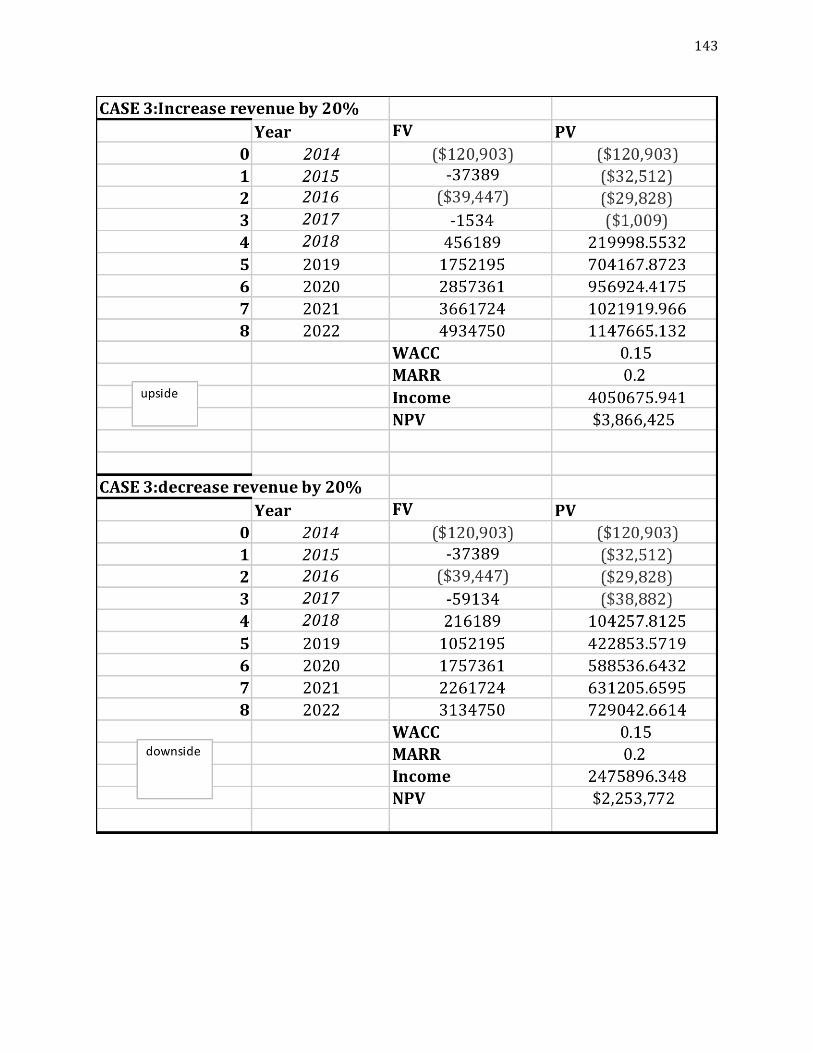
143

144
3.3BuildingCapabilitiesOptionValuation
SummaryofAnalysis
Variable Downside Upside Range Downside Upside BaseCaseAR1Expenses $2,890,319 $3,229,878 $339,559 $2,632,370 $1,754,914 $2,193,642
MARR $2,573,586 $3,651,133 $1,077,547 23% 17% 20%GrossRevenue $2,253,772 $3,866,425 $1,612,653 $10,595,200 $15,892,800 $13,244,000
CFYear0 ($135,318) ($106,488) $28,829 ($135,318) ($106,488) ($120,903)CFYear1 ($40,136) ($24,888) $15,248 ($46,157) ($28,621) ($37,389)CFYear2 ($31,806) ($27,850) $3,956 ($42,063) ($36,831) ($39,447)CFYear3 ($40,990) $1,100 $42,090 ($62,341) $1,673 ($30,334)CFYear4 $104,258 $219,999 $115,741 $216,189 $456,189 $336,189CFYear5 $422,854 $704,168 $281,314 $1,052,195 $1,752,195 $1,402,195CFYear6 $588,537 $956,924 $368,388 $1,757,361 $2,857,361 $2,307,361CFYear7 $631,206 $1,021,920 $390,714 $2,261,724 $3,661,724 $2,961,724CFYear8 $729,043 $1,147,665 $418,622 $3,134,750 $4,934,750 $4,034,750
ExpectedNPV Input
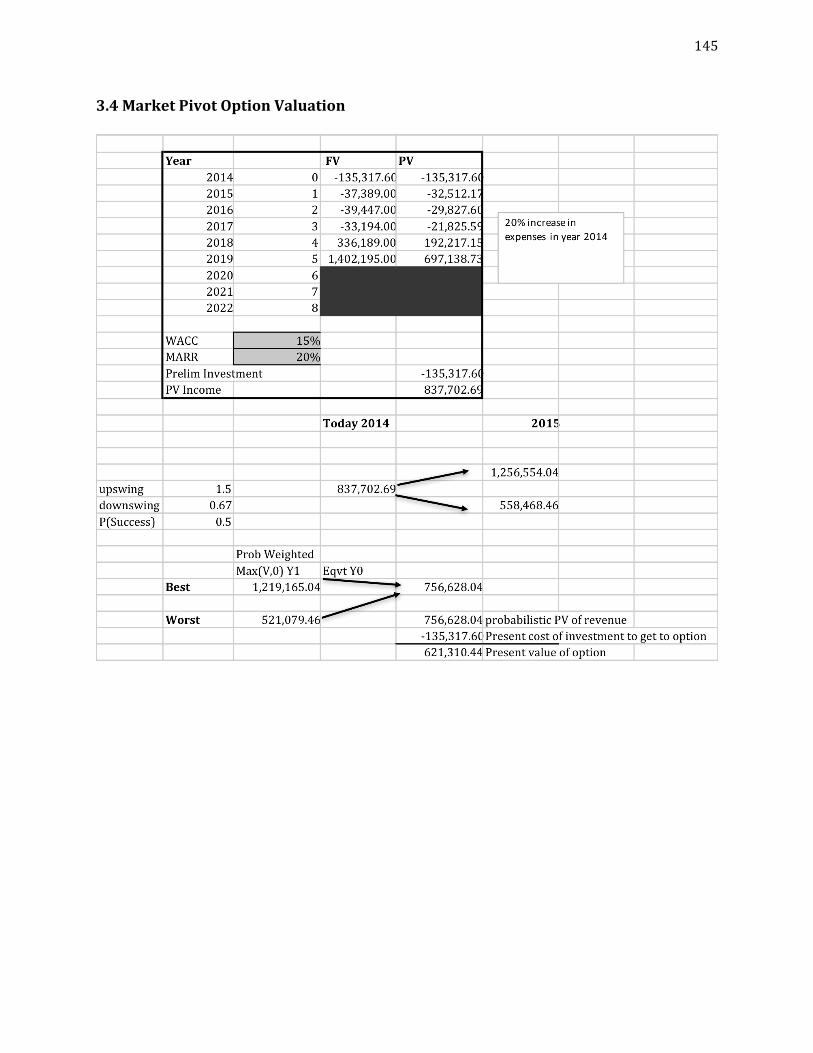
145
3.4MarketPivotOptionValuation
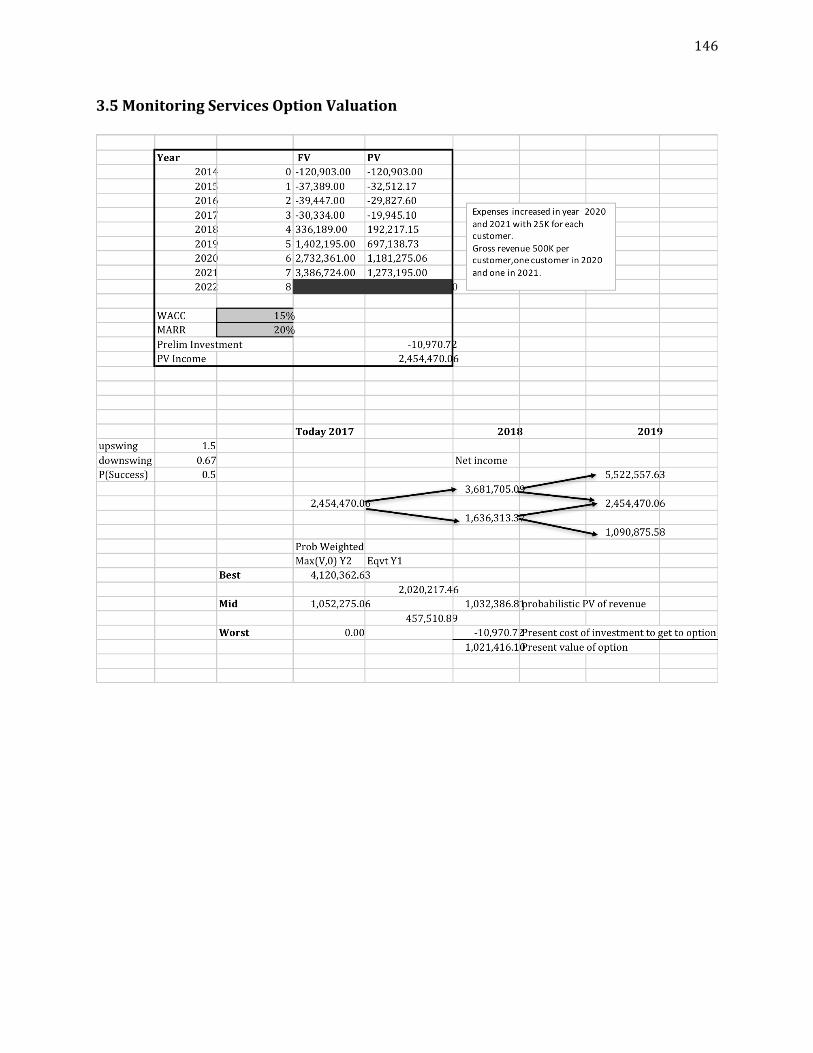
146
3.5MonitoringServicesOptionValuation
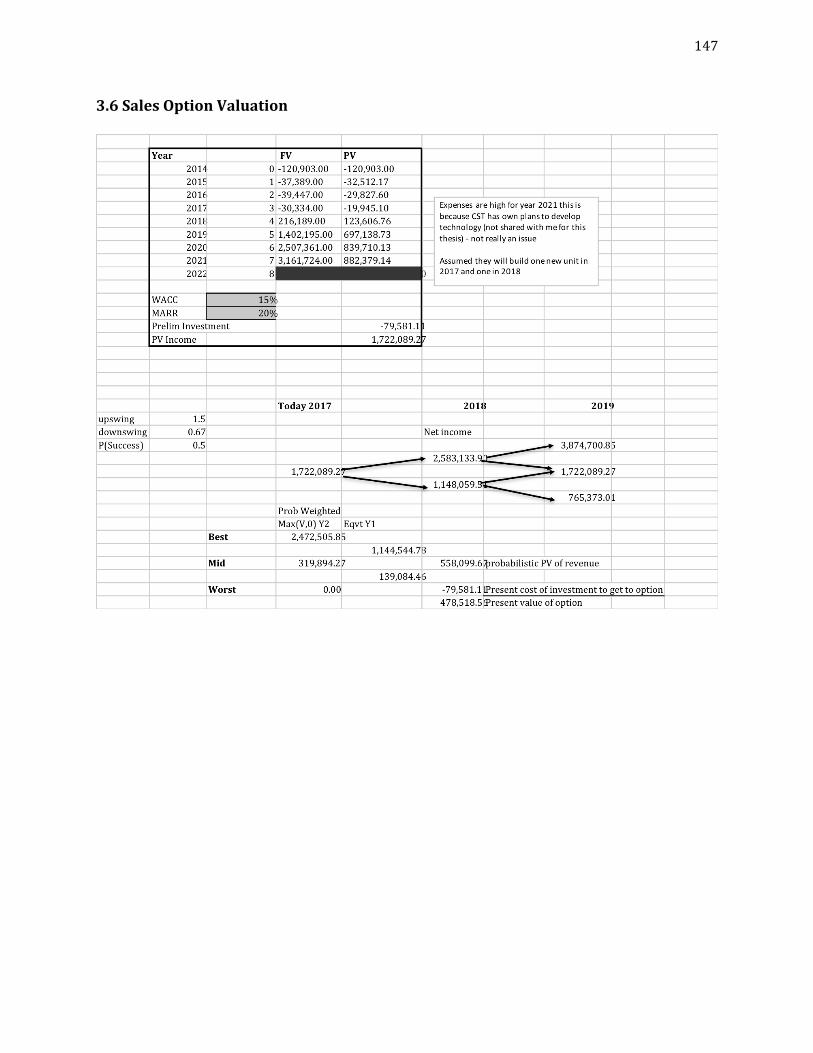
147
3.6SalesOptionValuation
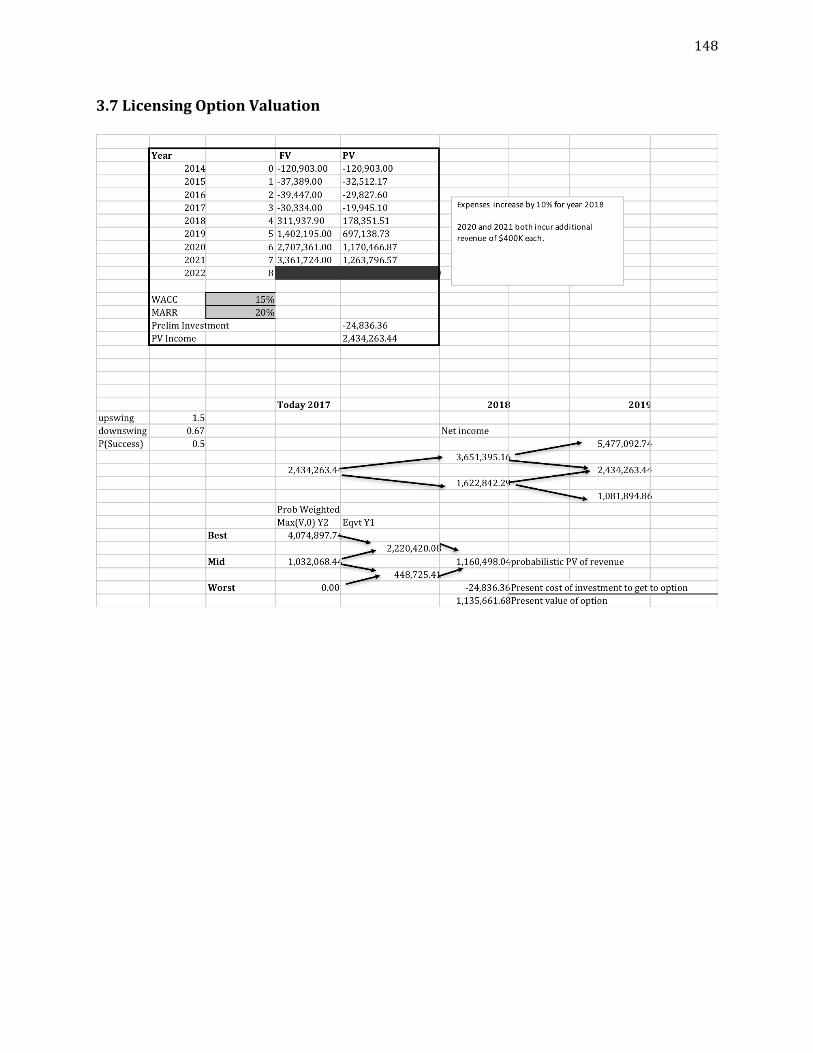
148
3.7LicensingOptionValuation
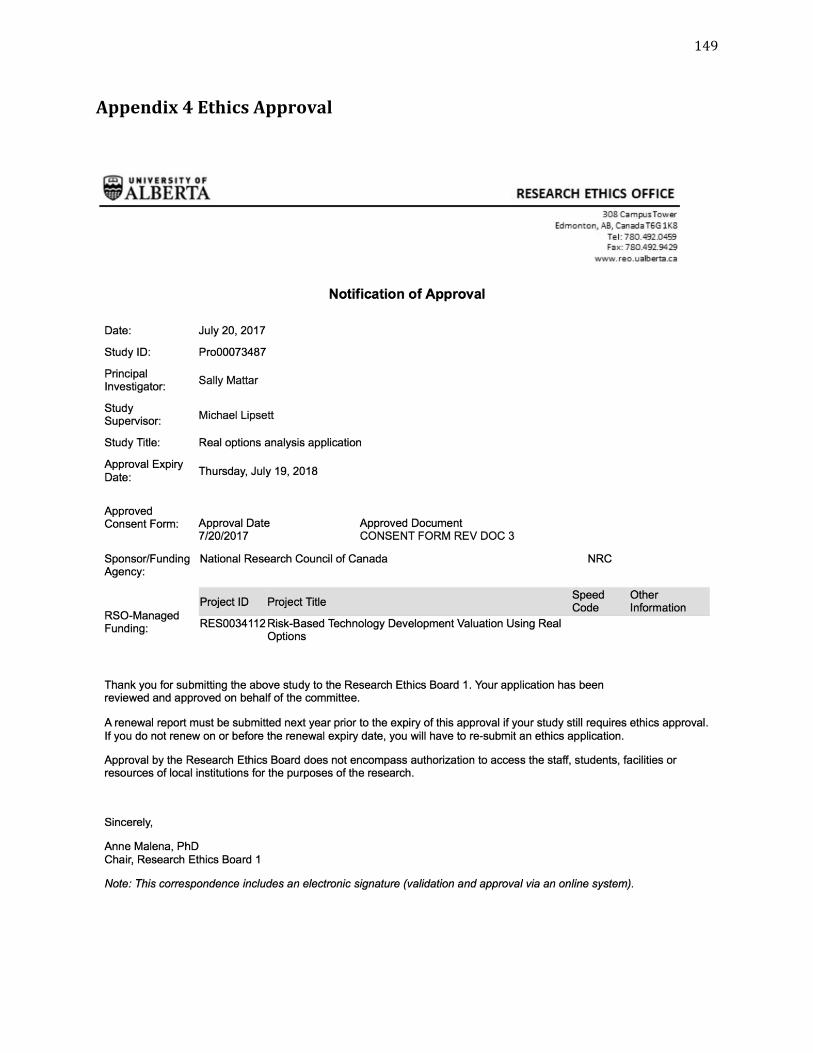
149
Appendix4EthicsApproval