Embed Size (px)
Citation preview
Munich Personal RePEc Archive
Real Options Analysis of Renewable
Energy Investment Scenarios in the
Philippines
Agaton, Casper
Institute of Development Research and Development Policy, Ruhr
Universität-Bochum
30 December 2017
Online at https://mpra.ub.uni-muenchen.de/83478/
MPRA Paper No. 83478, posted 06 Jan 2018 12:21 UTC
1
REAL OPTIONS ANALYSIS OF RENEWABLE ENERGY INVESTMENT
SCENARIOS IN THE PHILIPPINES
Casper Boongaling Agaton
Institute of Development Research and Development Policy,
Ruhr University of Bochum, Germany
Please cite this article as:
Agaton, C.B., 2017. Real options analysis of renewable energy investment scenarios in the
Philippines. Renewable Energy and Sustainable Development, 3(3), pp. 284-292.
Abstract
With the continuously rising energy demand and much dependence on imported fossil fuels,
the Philippines is developing more sustainable sources of energy. Renewable energy seems to
be a better alternative solution to meet the country’s energy supply and security concerns. Despite its huge potential, investment in renewable energy sources is challenged with
competitive prices of fossil fuels, high start-up cost and lower feed-in tariff rates for renewables.
To address these problems, this study aims to analyze energy investment scenarios in the
Philippines using real options approach. This compares the attractiveness of investing in
renewable energy over continuing to use coal for electricity generation under uncertainties in
coal prices, investments cost, electricity prices, growth of investment in renewables, and
imposing carbon tax for using fossil fuels.
Keywords: real options approach, investment under uncertainty, dynamic optimization,
renewable energy
JEL Classification: C61, G17, Q42, Q47
NOMENCLATURE
ADF Augmented Dickey-Fuller
BAU business as usual
DCF discounted cash flow
FiT feed-in tariff
GBM geometric Brownian motion
IRENA International Renewable Energy Agency
NPV net present value
O&M operations and maintenance
PV photovoltaic
RES renewable energy resources
ROA real options approach
2
I. INTRODUCTION
Increasing environmental concerns and depleting fossil fuels have caused many countries to
find cleaner and more sustainable sources of energy. Currently, renewable energy sources
(RES) supply 12.65% of the total world energy demand in 2016 which includes wind, solar,
hydropower, biomass, geothermal, and ocean energies [1]. In the recent years, new investments
in renewable energy have grown from US$1043.8B (2007-2011) to US$1321.9 (2012-2016)
with a geographic shift from the Asia-Pacific region [2], [3]. In the Philippines, renewable
energy accounts to 25% of the energy generation mix, mostly from geothermal (13%) and
hydropower (10%) [4]. The country is aiming to increase this percent share to 60% in 2030 by
investing and developing localized renewable sources at 4% annual growth rate [5]. According
to International Renewable Energy Agency (IRENA), the country’s topography and geographic location makes a good potential for renewable energy with 170GW from ocean, 76.6GW from
wind, 4GW from geothermal, 500MW from biomass, and 5kWh/m2/day from solar energy [6].
Despite its potential, the country’s 60% renewable energy goal seems unachievable as the growth in electricity demand increases faster than investment and generation from RES.
Meanwhile, the country is burdened by heavy dependence on imported fossil fuels, particularly
coal and oil. As more power plants are needed due to closing old coal plants and rising
electricity demand, renewable energy seems to be the long-term solution to address the
country’s problem on energy security and sustainability. However, investment in renewable energy sources is challenged by competitive prices of fossil fuels, high investment cost and
lower feed-in tariff (FiT) rates for renewables. These serve as an impetus to evaluate the
comparative attractiveness of renewable energy over coal for electricity generation in the
Philippines.
This study presents a general framework of investment decision-making for shifting
technologies from coal to renewable sources that can be applied to developing countries. By
taking the case of the Philippines, this study applies the real options approach (ROA) to analyze
various investment scenarios. Traditionally, the discounted cash flow (DCF) or net present
value (NPV) techniques are mostly used in evaluating investment projects. These methods,
however, do not cover highly volatile and uncertain investments because they assume a definite
cash flow. This assumption makes DCF and NPV underestimate the investment opportunities
leading to poor policy and decision-making process, particularly to energy generation projects.
Further, these approaches do not allow an investor to define the optimal time to invest or to
estimate the true value of project uncertainties [7]. ROA overcomes this limitation as it
combines risk and uncertainty with flexibility of investment as a potential positive factor, which
gives additional value to the project [8]. This approach evaluates investment projects by
considering the investor’s flexibility to delay or postpone his/her decision to a more favorable
situation [9]. These ROA characteristics are highlighted in this paper as the decision-making
process to invest in RES is evaluated in every investment period (annually) using dynamic
optimization under various uncertainties.
Recent studies employ ROA to analyze investment decisions, specifically renewable energy,
including: Zhang et al. [10] on investment in solar photovoltaic (PV) power generation in China
by considering uncertainties in unit generating capacity, market price of electricity, CO2 price,
and subsidy; Kim et al. [11] on analyzing renewable energy investment in Indonesia with
uncertainties in tariff, energy production, Certified Emission Reduction price, and operations
and maintenance (O&M) cost; Kitzing et al. [12] on analyzing offshore wind energy
investments in the Baltic under different support schemes as FiT, feed-in premiums, and
3
tradable green certificates; Tian et al. [13] on evaluating PV power generation under carbon
market linkage in carbon price, electricity price, and subsidy uncertainty; and Ritzenhofen and
Spinler [14] on assessing the impact of FiT on renewable energy investments under regulatory
uncertainty. This research contributes to existing literatures by presenting a multi-period
investment coupled with uncertainties in coal prices, cost of renewable technologies, growth of
renewable energy investment, FiT price of renewables, and externality for using coal.
The main goal of this paper is to analyze investment scenarios that make renewable energy a
better option than continuing to use coal for electricity generation. Specifically, this study
employs ROA to evaluate the (1) maximized option value of either continuing to use coal or
investing in renewables, (2) value of waiting or delaying to invest in renewables, and (3)
optimal timing of investment characterized by the trigger price of coal for shifting technologies
from coal to renewables. Sensitivity analyses are done to investigate how the above-mentioned
uncertainties affect the optimal investment strategies.
II. METHODOLOGY
The proposed real options methodology is divided into two subsections. The first subsection
describes dynamic optimization to calculate the maximized value of investment and identify
the optimal timing of investment. The second stage includes the sensitivity analyses with
respect to growth rate of renewable energy investment, prices of renewable energy, investment
costs, and CO2 prices.
• Real options model
Consider a renewable energy project with lifetime 𝑇𝑅, which can be irreversibly initiated in
three installment periods 𝜏, 𝜏 + 5, and 𝜏 + 10 with investment costs 𝐼𝑅_0, 𝐼𝑅_5, and 𝐼𝑅_10.
Assume that the project construction can be finished instantaneously and operated in full load
after project completion. If renewable energy project starts in period t, the total net present value
of the project 𝑁𝑃𝑉𝑅 can be represented by Equation 1.
𝑁𝑃𝑉𝑅 = 𝑁𝑃𝑉𝑅_0 + 𝑁𝑃𝑉𝑅_5 + 𝑁𝑃𝑉𝑅_10 = ∑ [ ∑ 𝜌𝑡𝑃𝑉𝑅,𝑡 − (1 + 𝜑𝑟)𝐼𝑅,𝑟 𝑇𝑅+𝑟𝑡=𝜏+𝑟 ]𝑟=0,5,10 (1)
where 𝑟 is the installment periods of renewable energy investment, 𝜑𝑟 is the growth of
renewable energy investment cost, and 𝜏 is the period where investor decides to invest in
renewable.
The yearly cash flow 𝑃𝑉𝑅,𝑡 of renewable energy project comprises of returns from selling
electricity from RE, O&M cost 𝐶𝑅. 𝑃𝑉𝑅 = 𝜋𝑅 = 𝑃𝐸𝑅𝑄𝑅 − 𝐶𝑅,𝑟 (2)
On the other hand, there exists a power plant generated with coal. The net present value of
yearly cash flow from coal depends on the returns from selling electricity from coal, O&M cost 𝐶𝐶, stochastic cost of fuel 𝑃𝐶,𝑡, and 𝐶𝑂2 price 𝐶𝐶_𝐶𝑂2 as given in Equation 3
4
𝑁𝑃𝑉𝐶,𝑡 = ∑ 𝑃𝑉𝐶,𝑡 𝜏𝑡=0 = ∑ 𝜌𝑡𝜋𝐶,𝑡 𝜏
𝑡=0 = ∑ 𝜌𝑡𝜏
𝑡=0 {𝑃𝐸𝐶𝑄𝑅 − 𝑃𝐶,𝑡𝑄𝐶 − 𝐶𝐶 − 𝐶𝐶_𝐶𝑂2} (3)
where 𝜌 is the social discount factor, 𝑃𝐸𝐶 and 𝑃𝐸𝑅 are the prices of electricity from coal and
renewable, 𝑄𝑅 is the quantity of electricity generated from coal/renewable, and 𝑄𝐶 is the
quantity of coal needed to generate 𝑄𝑅.
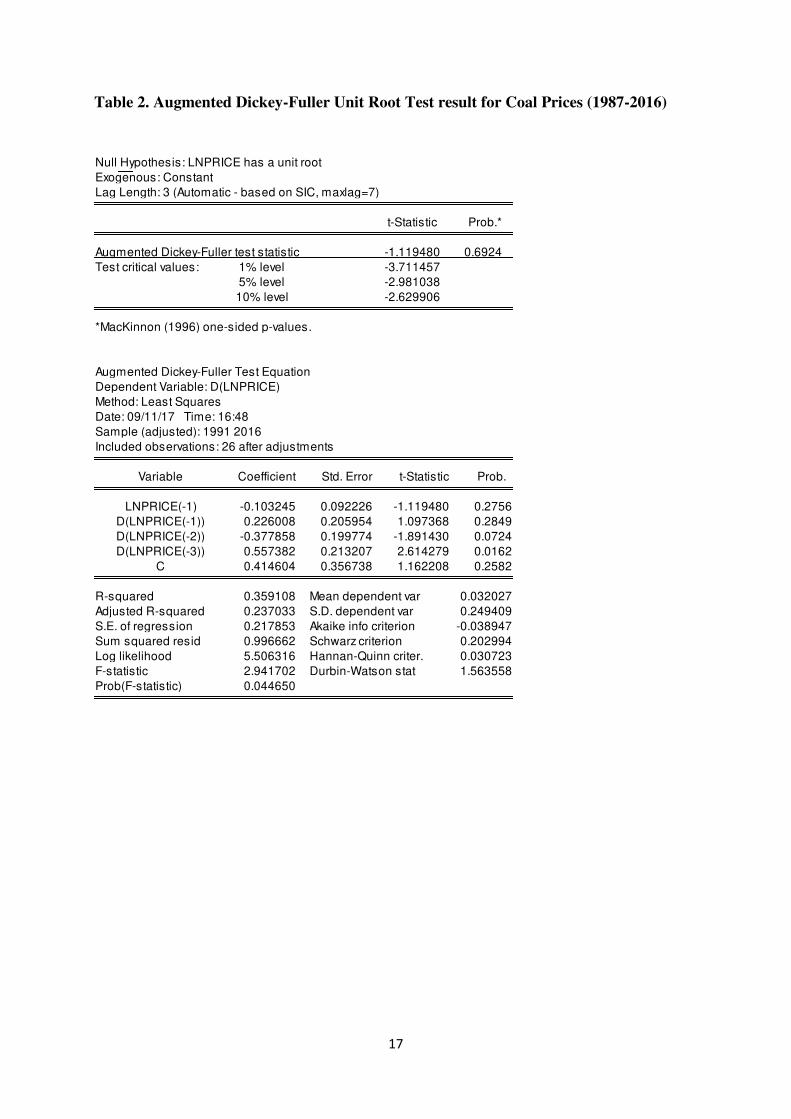
Following previous literatures [15]- [19], this research assumes that the price of coal is
stochastic and follows Geometric Brownian motion (GBM). The current price of 𝑃𝐶 depends
on its previous price, and the drift and variance rates of time series of coal prices as shown in
Equation 4 𝑃𝐶,𝑡 = 𝑃𝐶,𝑡−1 + 𝛼𝑃𝐶,𝑡−1 + 𝜎𝑃𝐶,𝑡−1𝜀𝑡−1 (4)
with 𝛼 and 𝜎 are the GBM rate of drift and variance of coal prices, and 𝜀 a random number.
The parameters 𝛼 and 𝜎 are approximated using augmented Dickey-Fuller (ADF) test from
time series of coal prices [20]. The estimates obtained in ADF test are used to generate a matrix
of random numbers that represent possible prices of coal from initial values of zero to US$200
at every investment period from zero to 𝑇. These values are then used to calculate the present
values of electricity generation from coal for each period.
Using Monte Carlo simulation, the expected NPV for generating electricity from coal is
estimated by calculating the 𝑁𝑃𝑉𝐶,𝑡 in Equation 3 and repeating the process for a sufficiently
large number 𝐽 =10000 times. Expected net present value is calculated by taking the average
of 𝑁𝑃𝑉𝐶 for every initial price of coal 𝑃𝐶,0 as shown in Equation 5.
𝔼{𝑁𝑃𝑉𝐶,𝐽|𝑃𝐶,0} ≈ 1𝐽 ∑ 𝑁𝑃𝑉𝐶,𝐽 ≈𝐽𝑗=1 𝔼{𝑁𝑃𝑉𝑐|𝑃𝐶,0} (5)
The next exercise in identifying the optimal timing and associated trigger price of coal for
shifting technologies is done with dynamic optimization as shown in Equation 6
max0≤𝜏<𝑇+1 𝔼 {∑ 𝜌𝑡𝜋𝐶,𝑡 𝜏𝑡=0 + ∑ 𝜌𝑡𝜋𝐶,𝑡(1 − 𝕀{𝜏≤𝑇}) +𝑇
𝑡=𝜏 [𝑁𝑃𝑉𝑅 + 𝑁𝑃𝑉𝐶](𝕀{𝜏≤𝑇})} (6)
where 𝕚𝜏≤𝑇 is an indicator equal to 1 if switching to renewable energy, otherwise, equal to 0.
This model describes an investor who is given a specific period 𝑇 to decide whether to continue
generating electricity from coal or invest in renewable energy. In this model, ∑ 𝜌𝑡𝜋𝐶,𝑡 𝜏𝑡=0 accounts to the net present value of using coal from initial period T=0 until 𝜏 when
the investor makes the decision. If the investor chooses not to invest (𝕚𝜏≤𝑇=0), he incurs a net
present value of ∑ 𝜌𝑡𝜋𝐶,𝑡𝑇𝑡=𝜏 from period 𝜏 until the end of the coal plant’s lifetime. If the
investor chooses to invest (𝕚𝜏≤𝑇=1), he incurs a net present value of 𝑁𝑃𝑉𝑅 from successive
5
(three-period) investment in renewables plus 𝑁𝑃𝑉𝐶 , as generation from coal will continue at a
lower quantity because other electricity will be generated from renewables.
From Equation 6, the investor’s problem is to choose the optimal timing of investment 𝜏, to
maximize the expected net present value of investment. The problem is solved backwards using
dynamic programming from the terminal period for each price of coal 𝑃𝑐,𝑡 as shown in Equation
7 𝑉𝑡(𝑃𝑐,𝑡) = 𝑚𝑎𝑥{𝜋𝐶,𝑡−1 + 𝑉𝑡(𝑃𝑐,𝑡−1), 𝑁𝑃𝑉𝑅 + 𝑁𝑃𝑉𝐶} (7)
with 𝑉𝑡 as the option value of investment at coal price 𝑃𝑐,𝑡.
The optimal timing of investment 𝑃�̃� is characterized by the minimum price of coal so that
switching to renewable energy is optimal as shown in Equation 8 [19] – [21]. 𝑃�̃� = 𝑚𝑖𝑛{𝑃𝑐,𝑡|𝑉0(𝑃𝑐,𝑡) = 𝑉T(𝑃𝑐,t)} (8)
Finally, investment strategy is described by a decision to invest when 𝑃�̃� ≤ 𝑃𝑐, otherwise,
investment can be delayed in later periods until 𝑃�̃� = 𝑃𝑐.
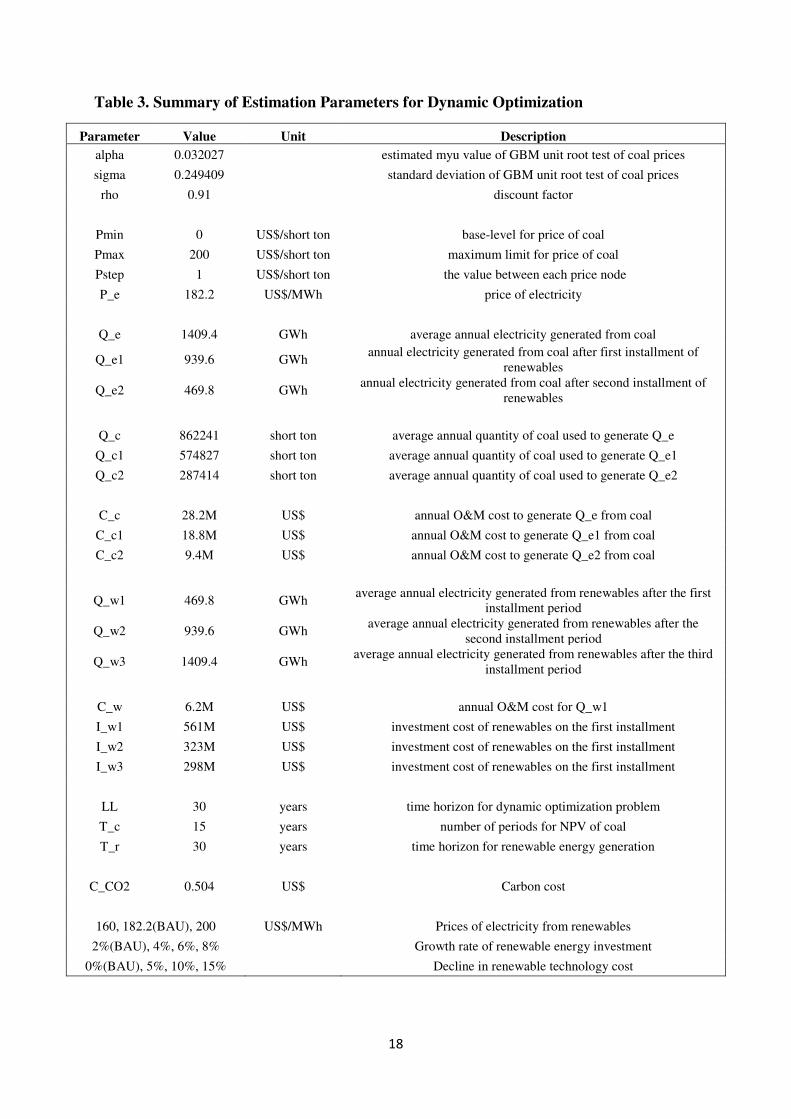
• Parameter Estimation and Investment Scenarios
The following scenarios describe various environments that affect investment decisions in
renewable energy in the Philippines. Sensitivity of investment values and optimal timing are
analyzed with respect to growth rate of renewable energy investment, price of electricity from
renewable energy, investment cost, and carbon prices.
The first scenario is the BAU case which describes the current renewable energy investment
scenario in the country. To estimate a suitable set of parameters in this scenario, secondary data
from the Philippine’s Department of Energy and Energy Information Administration are used [12], [ 22]. A 30-year period of average annual coal prices from 1987-2016 is used to run the
ADF test described in Equation 4. The ADF test result (see Supplementary Information - Table
2) implies that the null hypothesis that 𝑝𝑡 has a unit root cannot be rejected at all significant
levels, hence, coal prices conform with GBM. From this test, the estimated GBM parameters
are α=0.032027 and σ=0.249409, and are used to approximate stochastic prices of coal for each
investment period. The social discount rate is set to 7.5%. From Equation 3, 𝐶𝐶_𝐶𝑂2 is set to
zero as there are no existing carbon prices in the Philippines at present. The growth rate of
renewable energy investment is set to 2% per annum. This is equivalent to 470GWh of
electricity generation from renewables. From this value, the investment cost and operations and
maintenance cost for renewables are estimated, as well as the costs and quantity of coal needed
to generate this amount. The prices of electricity, 𝑃𝐸𝑅 = 𝑃𝐸𝐶 =US$182.2/MWh are set equal to
the current domestic electricity price, constant during the entire investment period, and
independent of the domestic demand. Assumptions indicate that renewable energy sources can
generate electricity at an annual average of 𝑄𝑅 all throughout its lifetime; there are no
technological innovations that affect energy efficiency and overnight costs of renewables; and
stochastic prices of coal are independent of the demand for renewable energy.
6
The second scenario describes a situation of an accelerated growth rate of renewable energy
investment from the current 2% to 4%, 6%, and 8%. Meanwhile, the third scenario analyzes the
effect of prices of electricity from renewable energy by increasing the current FiT rates to
proposed rates. Three prices are set: US$182.2/MWh at the BAU case, US$160/MWh which is
10% lower than the BAU case, and US$200/MWh which is 10% higher. The third scenario
describes a situation of a decline in investment costs for renewable energies by 5%, 10%, and
15%, respectively. The last scenario proposes a government policy of introducing carbon tax
for electricity generation from coal. The carbon tax is set to US$ 0.504/MWh.
III. RESULTS AND DISCUSSION
• Business as usual scenario
The dynamic optimization process described in the previous section results in three significant
values. First is the option value which is equal to the maximized value of either investing in
renewables or continuing to use coal. Second is the value of waiting as described by the vertical
distance between option value curves: initial period (dotted) and terminal period (bold) of
investment. This value approximates the gains of an investor if investment is delayed or
postponed to some period. The last estimated value is the optimal timing of investment denoted
by the trigger prices of coal for shifting electricity source from coal to renewables. This trigger
price is illustrated as the intersection of the two option value curves, and indicates the threshold
where the value of waiting is zero and that an investor has no benefit to delay the investment to
renewables.
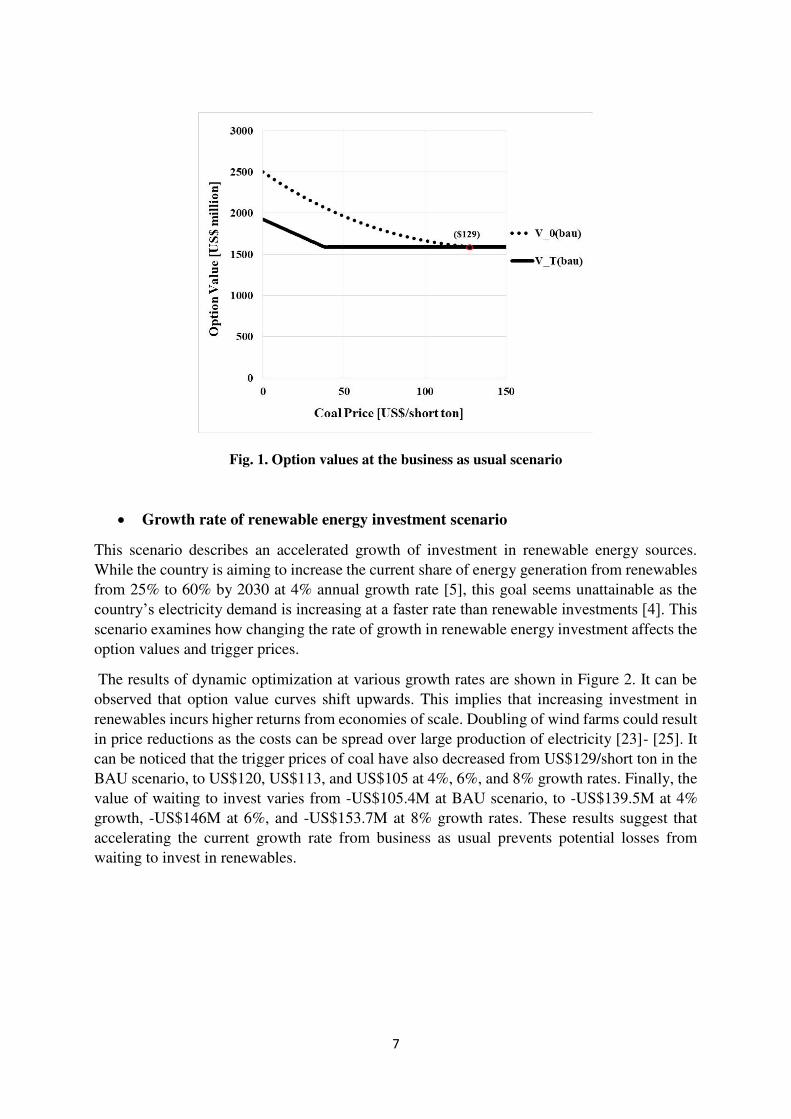
Figure 1 shows the dynamics of option values at different prices of coal in the business as usual
scenario. The first point of interest is the positive option values. It indicates that investment in
renewable energy incurs positive returns at the current energy situation in the Philippines. This
contradicts with the result of Detert and Kotani [19] where the optimization yields negative
option values describing a government controlled, operated, and subsidized energy regime. The
next point of interest is option value curves sloping downward. This indicates that option values
decrease with increasing cost for input fuel. At certain point on the curves, the option values
become constant. These are the prices of coal where investment in renewable is a better option
than continuing to use coal for electricity generation. The positive values further indicate
positive 𝑁𝑃𝑉𝑅 for investing in renewables. In this scenario, the result shows that the trigger
price of coal for shifting technologies is US$ 129/short ton. This trigger price is higher than the
current price of coal US$93.13/short ton (year 2016), and implies that delaying investment in
renewables is a better option. However, at the current coal price, the value of waiting to invest
is -US$105.4 million. This negative value indicates possible losses incurred from delaying
investment in renewables.
7
Fig. 1. Option values at the business as usual scenario
• Growth rate of renewable energy investment scenario
This scenario describes an accelerated growth of investment in renewable energy sources.
While the country is aiming to increase the current share of energy generation from renewables
from 25% to 60% by 2030 at 4% annual growth rate [5], this goal seems unattainable as the
country’s electricity demand is increasing at a faster rate than renewable investments [4]. This scenario examines how changing the rate of growth in renewable energy investment affects the
option values and trigger prices.
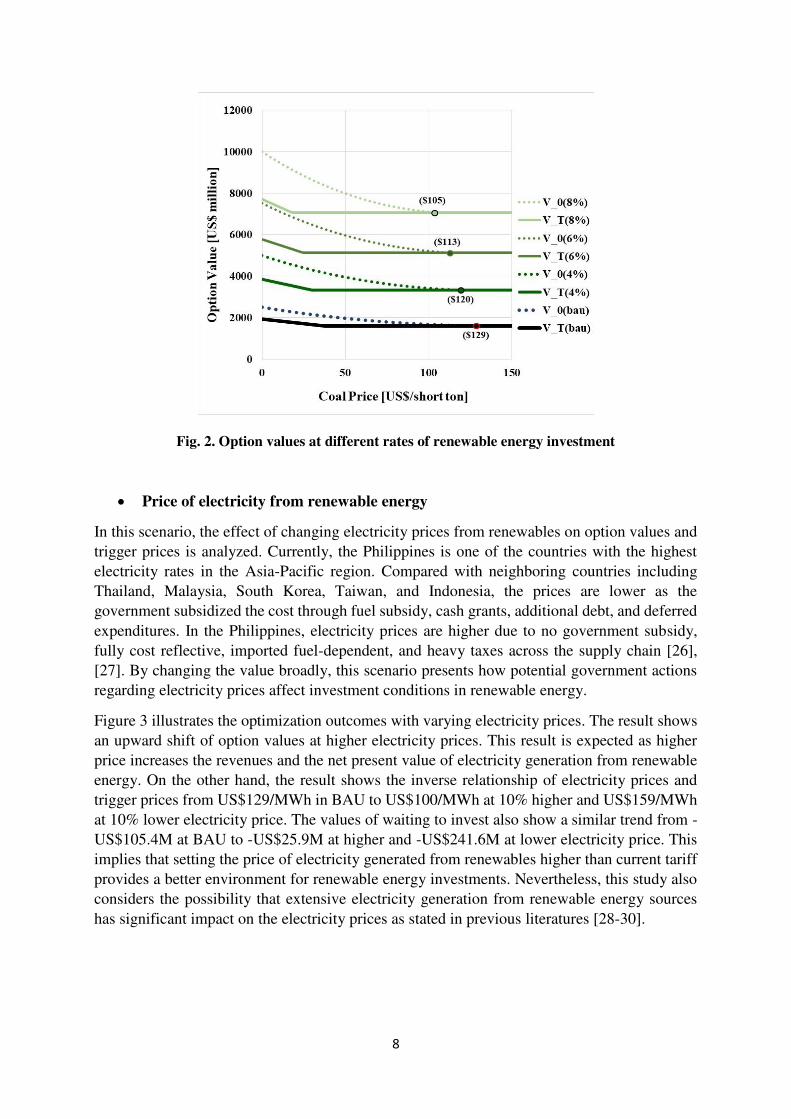
The results of dynamic optimization at various growth rates are shown in Figure 2. It can be
observed that option value curves shift upwards. This implies that increasing investment in
renewables incurs higher returns from economies of scale. Doubling of wind farms could result
in price reductions as the costs can be spread over large production of electricity [23]- [25]. It
can be noticed that the trigger prices of coal have also decreased from US$129/short ton in the
BAU scenario, to US$120, US$113, and US$105 at 4%, 6%, and 8% growth rates. Finally, the
value of waiting to invest varies from -US$105.4M at BAU scenario, to -US$139.5M at 4%
growth, -US$146M at 6%, and -US$153.7M at 8% growth rates. These results suggest that
accelerating the current growth rate from business as usual prevents potential losses from
waiting to invest in renewables.
8
Fig. 2. Option values at different rates of renewable energy investment
• Price of electricity from renewable energy
In this scenario, the effect of changing electricity prices from renewables on option values and
trigger prices is analyzed. Currently, the Philippines is one of the countries with the highest
electricity rates in the Asia-Pacific region. Compared with neighboring countries including
Thailand, Malaysia, South Korea, Taiwan, and Indonesia, the prices are lower as the
government subsidized the cost through fuel subsidy, cash grants, additional debt, and deferred
expenditures. In the Philippines, electricity prices are higher due to no government subsidy,
fully cost reflective, imported fuel-dependent, and heavy taxes across the supply chain [26],
[27]. By changing the value broadly, this scenario presents how potential government actions
regarding electricity prices affect investment conditions in renewable energy.
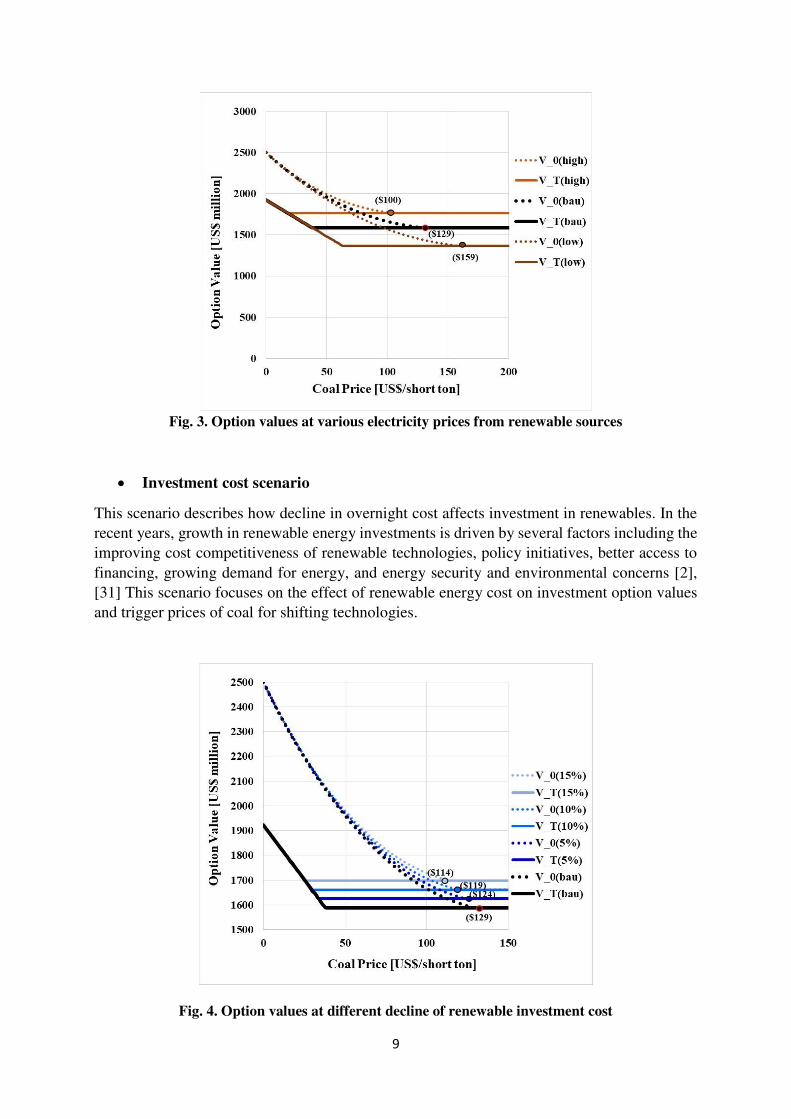
Figure 3 illustrates the optimization outcomes with varying electricity prices. The result shows
an upward shift of option values at higher electricity prices. This result is expected as higher
price increases the revenues and the net present value of electricity generation from renewable
energy. On the other hand, the result shows the inverse relationship of electricity prices and
trigger prices from US$129/MWh in BAU to US$100/MWh at 10% higher and US$159/MWh
at 10% lower electricity price. The values of waiting to invest also show a similar trend from -
US$105.4M at BAU to -US$25.9M at higher and -US$241.6M at lower electricity price. This
implies that setting the price of electricity generated from renewables higher than current tariff
provides a better environment for renewable energy investments. Nevertheless, this study also
considers the possibility that extensive electricity generation from renewable energy sources
has significant impact on the electricity prices as stated in previous literatures [28-30].
9
Fig. 3. Option values at various electricity prices from renewable sources
• Investment cost scenario
This scenario describes how decline in overnight cost affects investment in renewables. In the
recent years, growth in renewable energy investments is driven by several factors including the
improving cost competitiveness of renewable technologies, policy initiatives, better access to
financing, growing demand for energy, and energy security and environmental concerns [2],
[31] This scenario focuses on the effect of renewable energy cost on investment option values
and trigger prices of coal for shifting technologies.
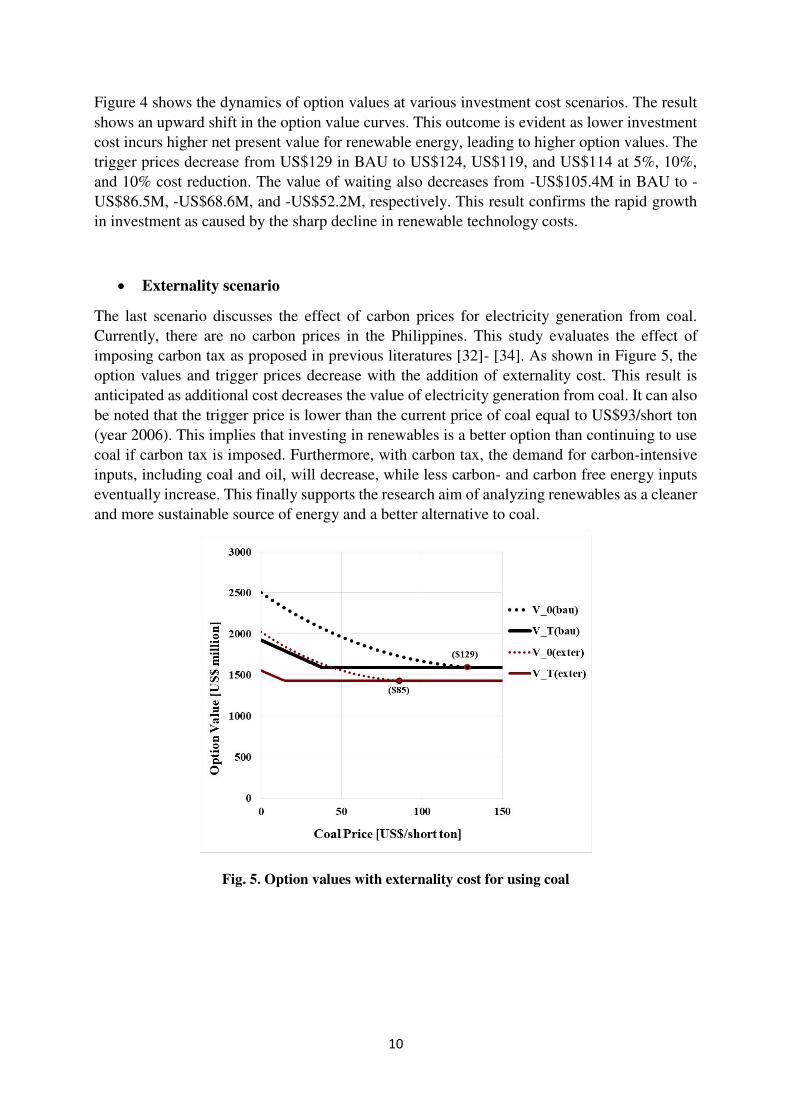
Fig. 4. Option values at different decline of renewable investment cost
10
Figure 4 shows the dynamics of option values at various investment cost scenarios. The result
shows an upward shift in the option value curves. This outcome is evident as lower investment
cost incurs higher net present value for renewable energy, leading to higher option values. The
trigger prices decrease from US$129 in BAU to US$124, US$119, and US$114 at 5%, 10%,
and 10% cost reduction. The value of waiting also decreases from -US$105.4M in BAU to -
US$86.5M, -US$68.6M, and -US$52.2M, respectively. This result confirms the rapid growth
in investment as caused by the sharp decline in renewable technology costs.
• Externality scenario
The last scenario discusses the effect of carbon prices for electricity generation from coal.
Currently, there are no carbon prices in the Philippines. This study evaluates the effect of
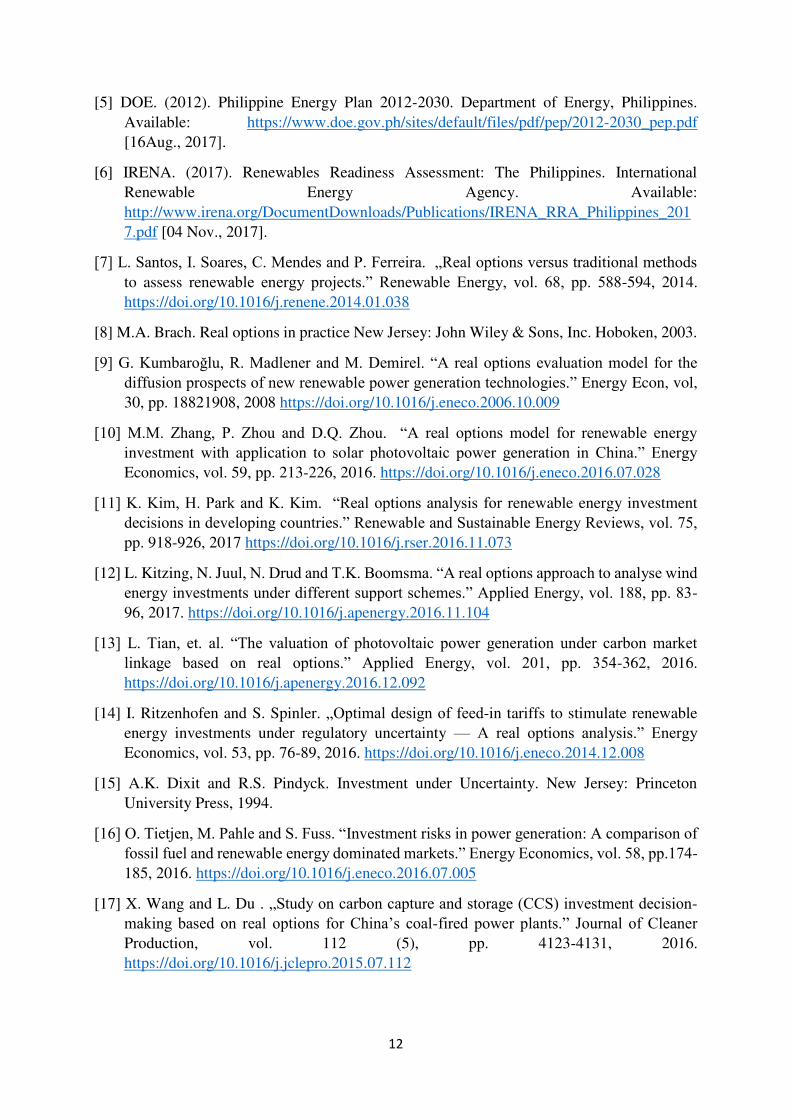
imposing carbon tax as proposed in previous literatures [32]- [34]. As shown in Figure 5, the
option values and trigger prices decrease with the addition of externality cost. This result is
anticipated as additional cost decreases the value of electricity generation from coal. It can also
be noted that the trigger price is lower than the current price of coal equal to US$93/short ton
(year 2006). This implies that investing in renewables is a better option than continuing to use
coal if carbon tax is imposed. Furthermore, with carbon tax, the demand for carbon-intensive
inputs, including coal and oil, will decrease, while less carbon- and carbon free energy inputs
eventually increase. This finally supports the research aim of analyzing renewables as a cleaner
and more sustainable source of energy and a better alternative to coal.
Fig. 5. Option values with externality cost for using coal

11
IV. CONCLUSION
This study presented various investment scenarios that represent energy switching decisions
that apply to developing countries. By taking the case of the Philippines, this study employed
real options approach to evaluate the maximized option values of investing in renewables, value
of delaying investment, and trigger prices of coal for shifting technologies from coal to
renewable sources. While numerous studies applied this approach to analyze renewable energy
investments, this study expanded the existing body of research by considering a multi-period
investment and taking account of uncertainties in input fuel prices, renewable technology cost,
growth of investment in renewables, and externality cost for using coal.
The analyses conclude that renewable energy is a better option than continuing to use coal for
electricity generation in the Philippines. Delaying the investment in renewables may lead to
possible welfare losses. Shifting from fossil-based to renewable sources is very timely as the
costs of renewable technologies have decreased immensely throughout the years and expected
to continuously fall. To support investments in renewable energy, the government must set
higher FIT rates than business as usual and impose carbon tax for using carbon-intensive fuels.
Further, the growth in investment in renewables should be increased to meet the country’s goal of 60% energy generation from renewable sources and decrease its dependence on imported
fossil fuels.
While this study compared coal and renewables, particularly wind energy, for electricity
generation, future studies may also analyze other sustainable energy sources including
hydropower, solar, geothermal, biomass, tidal/ocean, and other technologies designed to
improve energy efficiency. Further, environmental uncertainty, such as climate variability and
weather disturbances, that affects energy generation may also be included to further capture
investment scenarios relevant to climate change policy.
REFERENCES
[1] EIA. (2017b). International energy outlook 2017 table: World total energy consumption by
region and fuel. Energy Information Administration. Available:
https://www.eia.gov/outlooks/aeo/data/browser/#/?id=2-IEO2017 [20 Aug., 2017].
[2] FS-UNEP. (2017). “Global trends in renewable energy investment 2017.” Frankfurt School – United Nations Environment Program (FS-UNEP) for Climate Change and Sustainable
Energy Finance. Available: http://fs-unep-
centre.org/sites/default/files/publications/globaltrendsinrenewableenergyinvestment2017.
pdf [20 Aug., 2017].
[3] BNEF. “New energy outlook 2016: Powering a Changing World.” Bloomberg New Energy Finance. Available: https://about.bnef.com/new-energy-outlook/ [20 Aug., 2017].
[4] DOE, 2016. 2015 Philippine Power Statistics. Department of Energy, Philippines.
Available:
https://www.doe.gov.ph/sites/default/files/pdf/energy_statistics/power_statistics_2015_su
mmary.pdf [16 Aug., 2017].
12
[5] DOE. (2012). Philippine Energy Plan 2012-2030. Department of Energy, Philippines.
Available: https://www.doe.gov.ph/sites/default/files/pdf/pep/2012-2030_pep.pdf
[16Aug., 2017].
[6] IRENA. (2017). Renewables Readiness Assessment: The Philippines. International
Renewable Energy Agency. Available:
http://www.irena.org/DocumentDownloads/Publications/IRENA_RRA_Philippines_201
7.pdf [04 Nov., 2017].
[7] L. Santos, I. Soares, C. Mendes and P. Ferreira. „Real options versus traditional methods to assess renewable energy projects.” Renewable Energy, vol. 68, pp. 588-594, 2014.
https://doi.org/10.1016/j.renene.2014.01.038
[8] M.A. Brach. Real options in practice New Jersey: John Wiley & Sons, Inc. Hoboken, 2003.
[9] G. Kumbaroğlu, R. Madlener and M. Demirel. “A real options evaluation model for the diffusion prospects of new renewable power generation technologies.” Energy Econ, vol,
30, pp. 18821908, 2008 https://doi.org/10.1016/j.eneco.2006.10.009
[10] M.M. Zhang, P. Zhou and D.Q. Zhou. “A real options model for renewable energy investment with application to solar photovoltaic power generation in China.” Energy Economics, vol. 59, pp. 213-226, 2016. https://doi.org/10.1016/j.eneco.2016.07.028
[11] K. Kim, H. Park and K. Kim. “Real options analysis for renewable energy investment
decisions in developing countries.” Renewable and Sustainable Energy Reviews, vol. 75, pp. 918-926, 2017 https://doi.org/10.1016/j.rser.2016.11.073
[12] L. Kitzing, N. Juul, N. Drud and T.K. Boomsma. “A real options approach to analyse wind energy investments under different support schemes.” Applied Energy, vol. 188, pp. 83-
96, 2017. https://doi.org/10.1016/j.apenergy.2016.11.104
[13] L. Tian, et. al. “The valuation of photovoltaic power generation under carbon market linkage based on real options.” Applied Energy, vol. 201, pp. 354-362, 2016.
https://doi.org/10.1016/j.apenergy.2016.12.092
[14] I. Ritzenhofen and S. Spinler. „Optimal design of feed-in tariffs to stimulate renewable
energy investments under regulatory uncertainty — A real options analysis.” Energy Economics, vol. 53, pp. 76-89, 2016. https://doi.org/10.1016/j.eneco.2014.12.008
[15] A.K. Dixit and R.S. Pindyck. Investment under Uncertainty. New Jersey: Princeton
University Press, 1994.
[16] O. Tietjen, M. Pahle and S. Fuss. “Investment risks in power generation: A comparison of fossil fuel and renewable energy dominated markets.” Energy Economics, vol. 58, pp.174-
185, 2016. https://doi.org/10.1016/j.eneco.2016.07.005
[17] X. Wang and L. Du . „Study on carbon capture and storage (CCS) investment decision-
making based on real options for China’s coal-fired power plants.” Journal of Cleaner Production, vol. 112 (5), pp. 4123-4131, 2016.
https://doi.org/10.1016/j.jclepro.2015.07.112
13
[18] H. Xian, G. Colson, B. Mei and M.E. Wetzstein. “Co-firing coal with wood pellets for US
electricity generation: A real options analysis.” Energy Policy, vol. 81, pp.106-116, 2015.
https://doi.org/10.1016/j.enpol.2015.02.026
[19] N. Detert and K. Kotani. “A real options approach to energy investments in Mongolia.” Energy Policy, vol. 56, pp. 136-150, 2013. https://doi.org/10.1016/j.enpol.2012.12.003
[20] M. Insley. “A real options approach to the valuation of a forestry investment.” Journal of Environmental Economics and Management, vol. 44 (3), pp. 471-492, 2002.
https://doi.org/10.1006/jeem.2001.1209
[21] G.A. Davis and R.D. Cairns. “Good timing: The economics of optimal stopping.” Journal of Economic Dynamics and Control, vol. 36(2), pp.255-265, 2012.
https://doi.org/10.1016/j.jedc.2011.09.008
[22] EIA. Levelized Cost and Levelized Avoided Cost of New Generation Resources in the
Annual Energy Outlook 2017. Energy Information Administration. Available:
https://www.eia.gov/outlooks/aeo/pdf/electricity_generation.pdf [16 Aug., 2017].
[23] H. Dai, X. Xie, Y. Xie, J. Liu and T. Masui. “Green growth: The economic impacts of large-scale renewable energy development in China.” Applied Energy, vol. 162, pp. 435-
449, 2016. https://doi.org/10.1016/j.apenergy.2015.10.049
[24] Y. Qui and L.D. Anadon. “The price of wind power in China during its expansion: Technology adoption, learning-by-doing, economies of scale, and manufacturing
localization.” Energy Economics, vol. 34(3), pp.772-785, 2012.
https://doi.org/10.1016/j.eneco.2011.06.008
[25] M. Jungunger, A. Faaij and W.C.Turkenburg. „Global experience curves for wind farms.” Energy Policy, vol. 33(2), pp. 113-150, 2005. https://doi.org/10.1016/S0301-
4215(03)00205-2
[26] L. Fernandez. (2015). “Power prices: Where we are and how do we reduce the bill.” Philippines’ Department of Trade and Industry (DTI). Available: http://industry.gov.ph/wp-content/uploads/2015/08/Power-Prices-Where-We-Are-and-
How-Can-We-Reduce-Our-Bill-by-Lawrence-Fernandez-MERALCO1.pdf [20 Aug.,
2017].
[27] IEC. (2016). Regional/Global Comparison of Retail Electricity Tariffs. International
Energy Consultants. Available: http://corporate-downloadables-
tips.s3.amazonaws.com/1478573661.68b4d11ba9cb3ccb30e91c6edd66b6c9.pdf [20
Aug., 2017].
[28] J.C. Ketterer. “The impact of wind power generation on the electricity price in Germany.” Energy Economics, vol. 44, pp. 270-280, 2014.
https://doi.org/10.1016/j.eneco.2014.04.003
[29] T. Jonsson, P. Pinson and H. Madsen. “On the market impact of wind energy forecasts.” Energy Economics, vol. 32(2), pp. 313-320, 2010.
https://doi.org/10.1016/j.eneco.2009.10.018
14
[30] L. Gelabert, X. Labandeira and P. Linares. “An ex-post analysis of the effect of renewables
and cogeneration on Spanish electricity prices.” Energy Economics, vol. 33(1), pp. S59-
S65, 2011. https://doi.org/10.1016/j.eneco.2011.07.027
[31] REN21. (2016). “Renewables 2016 global status report.” Renewable Energy Network Policy for the 21st Century. Available: http://www.ren21.net/wp-
content/uploads/2016/05/GSR_2016_Full_Report_lowres.pdf [16 Aug., 2017].
[32] H. Meller and J. Marquardt. (2013). “Renewable energy in the Philippines: Costly or competitive? Facts and explanations on the price of renewable energies for electricity
production.” Deutsche Gesellschaft für Internationale Zusammenarbeit (GIZ) GmbH.
Available: https://www.giz.de/en/downloads/giz2013-en-desk-study-costs-renewable-
energy-philippines.pdf [20 Aug., 2017].
[33] D. Burtraw and A. Krupnick. (2012). “The true cost of electric power: an inventory of methodologies to support future decision-making in comparing the cost and
competitiveness of electricity generation technologies.” Renewable Energy Network Policy for the 21st Century (REN21). Available:
http://www.ren21.net/Portals/0/documents/Resources/RFF-Rpt-
BurtrawKrupnick.TrueCosts_Summary_web.pdf [18 Aug., 2017].
[34] H. Cabalu, P. Koshy, E. Corong, U. E. Rodriguez and B. A. Endrigad. (2015). “Modelling the impact of energy policies on the Philippine economy: Carbon tax, energy efficiency,
and changes in the energy mix.” Economic Analysis and Policy vol, 48, pp. 222-237.
https://doi.org/10.1016/j.eap.2015.11.014
15
Supplementary Information
REAL OPTIONS ANALYSIS OF RENEWABLE ENERGY INVESTMENT
SCENARIOS IN THE PHILIPPINES
Table 1: List of Variables and Estimation Parameters……………………..…………………16
Table 2: ADF unit root test for coal prices (1987-2016)……………….…..………………...17
Table 3: Summary of Estimation Parameters…….....………………………………………..18
16
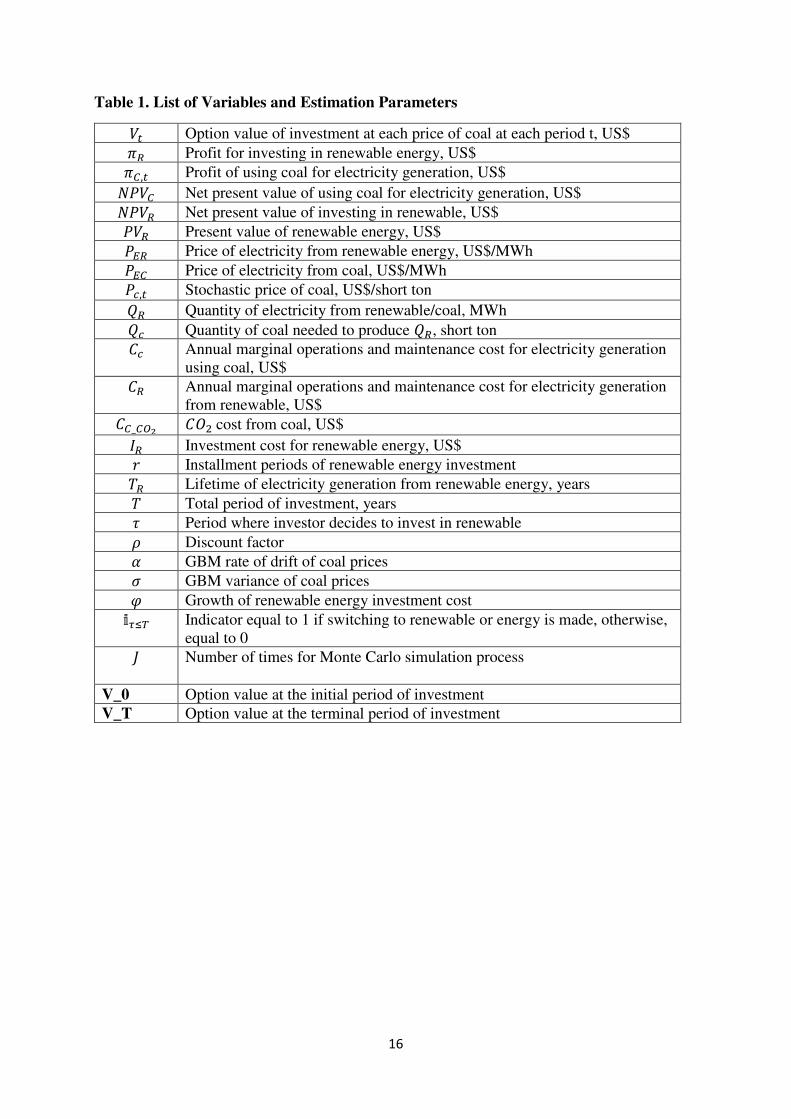
Table 1. List of Variables and Estimation Parameters 𝑉𝑡 Option value of investment at each price of coal at each period t, US$ 𝜋𝑅 Profit for investing in renewable energy, US$ 𝜋𝐶,𝑡 Profit of using coal for electricity generation, US$ 𝑁𝑃𝑉𝐶 Net present value of using coal for electricity generation, US$ 𝑁𝑃𝑉𝑅 Net present value of investing in renewable, US$ 𝑃𝑉𝑅 Present value of renewable energy, US$ 𝑃𝐸𝑅 Price of electricity from renewable energy, US$/MWh 𝑃𝐸𝐶 Price of electricity from coal, US$/MWh 𝑃𝑐,𝑡 Stochastic price of coal, US$/short ton 𝑄𝑅 Quantity of electricity from renewable/coal, MWh 𝑄𝑐 Quantity of coal needed to produce 𝑄𝑅, short ton 𝐶𝑐 Annual marginal operations and maintenance cost for electricity generation using coal, US$ 𝐶𝑅 Annual marginal operations and maintenance cost for electricity generation from renewable, US$ 𝐶𝐶_𝐶𝑂2 𝐶𝑂2 cost from coal, US$ 𝐼𝑅 Investment cost for renewable energy, US$ 𝑟 Installment periods of renewable energy investment 𝑇𝑅 Lifetime of electricity generation from renewable energy, years 𝑇 Total period of investment, years 𝜏 Period where investor decides to invest in renewable 𝜌 Discount factor 𝛼 GBM rate of drift of coal prices 𝜎 GBM variance of coal prices 𝜑 Growth of renewable energy investment cost 𝕚𝜏≤𝑇 Indicator equal to 1 if switching to renewable or energy is made, otherwise, equal to 0 𝐽 Number of times for Monte Carlo simulation process
V_0 Option value at the initial period of investment
V_T Option value at the terminal period of investment
17
Table 2. Augmented Dickey-Fuller Unit Root Test result for Coal Prices (1987-2016)
Null Hypothesis: LNPRICE has a unit root
Exogenous: Constant
Lag Length: 3 (Automatic - based on SIC, maxlag=7)
t-Statistic Prob.*
Augmented Dickey-Fuller test statistic -1.119480 0.6924
Test critical values: 1% level -3.711457
5% level -2.981038
10% level -2.629906
*MacKinnon (1996) one-sided p-values.
Augmented Dickey-Fuller Test Equation
Dependent Variable: D(LNPRICE)
Method: Least Squares
Date: 09/11/17 Time: 16:48
Sample (adjusted): 1991 2016
Included observations: 26 after adjustments
Variable Coefficient Std. Error t-Statistic Prob.
LNPRICE(-1) -0.103245 0.092226 -1.119480 0.2756
D(LNPRICE(-1)) 0.226008 0.205954 1.097368 0.2849
D(LNPRICE(-2)) -0.377858 0.199774 -1.891430 0.0724
D(LNPRICE(-3)) 0.557382 0.213207 2.614279 0.0162
C 0.414604 0.356738 1.162208 0.2582
R-squared 0.359108 Mean dependent var 0.032027
Adjusted R-squared 0.237033 S.D. dependent var 0.249409
S.E. of regression 0.217853 Akaike info criterion -0.038947
Sum squared resid 0.996662 Schwarz criterion 0.202994
Log likelihood 5.506316 Hannan-Quinn criter. 0.030723
F-statistic 2.941702 Durbin-Watson stat 1.563558
Prob(F-statistic) 0.044650
18
Table 3. Summary of Estimation Parameters for Dynamic Optimization
Parameter Value Unit Description
alpha 0.032027 estimated myu value of GBM unit root test of coal prices
sigma 0.249409 standard deviation of GBM unit root test of coal prices
rho 0.91 discount factor
Pmin 0 US$/short ton base-level for price of coal
Pmax 200 US$/short ton maximum limit for price of coal
Pstep 1 US$/short ton the value between each price node
P_e 182.2 US$/MWh price of electricity
Q_e 1409.4 GWh average annual electricity generated from coal
Q_e1 939.6 GWh annual electricity generated from coal after first installment of
renewables
Q_e2 469.8 GWh annual electricity generated from coal after second installment of
renewables
Q_c 862241 short ton average annual quantity of coal used to generate Q_e
Q_c1 574827 short ton average annual quantity of coal used to generate Q_e1
Q_c2 287414 short ton average annual quantity of coal used to generate Q_e2
C_c 28.2M US$ annual O&M cost to generate Q_e from coal
C_c1 18.8M US$ annual O&M cost to generate Q_e1 from coal
C_c2 9.4M US$ annual O&M cost to generate Q_e2 from coal
Q_w1 469.8 GWh average annual electricity generated from renewables after the first
installment period
Q_w2 939.6 GWh average annual electricity generated from renewables after the
second installment period
Q_w3 1409.4 GWh average annual electricity generated from renewables after the third
installment period
C_w 6.2M US$ annual O&M cost for Q_w1
I_w1 561M US$ investment cost of renewables on the first installment
I_w2 323M US$ investment cost of renewables on the first installment
I_w3 298M US$ investment cost of renewables on the first installment
LL 30 years time horizon for dynamic optimization problem
T_c 15 years number of periods for NPV of coal
T_r 30 years time horizon for renewable energy generation
C_CO2 0.504 US$ Carbon cost
160, 182.2(BAU), 200 US$/MWh Prices of electricity from renewables
2%(BAU), 4%, 6%, 8% Growth rate of renewable energy investment
0%(BAU), 5%, 10%, 15% Decline in renewable technology cost