Embed Size (px)
Citation preview

24831-02 - RGF AR 2016 2 August 2016 5:57 PM Proof 12
Annual Report and AccountsFor the year ended 31 March 2016
Annual Report and Accounts For the year ended 31 March 2016 Stock code: RGD Stock code: RGD
Real Good Food plc

24831-02 - RGF AR 2016 2 August 2016 5:57 PM Proof 12
R&W Scott, Garrett Ingredients,
GI Nutrition
Haydens, Chantilly Patisserie
Investor Proposition ✪ Experienced senior management team with strong heritage in food manufacturing
✪ Diversified business markets: cake decoration, food ingredients, and premium bakery
✪ Diversified market sectors including: retail, manufacturing, wholesale, foodservice and export
✪ Market-led growth strategies identified for each division
✪ Strong financial platform and balance sheet enabling investment for growth
✪ Emphasis on product development, innovation and sales growth
✪ Track record of successful bolt-on, earnings enhancing, acquisitions
www.realgoodfoodplc.com
Welcome
Real Good Food plc Real Good Food operates in three pillar markets: Cake Decoration, Food Ingredients and Premium Bakery.
Navigating the ReportFor further information within this document and relevant page numbers
Additional information online
Contents
Welcome IFC
StRAteGic RepoRtHighlights 1
Group at a Glance 2
Chairman’s Statement 4
Group Strategy 6
Divisional Business Reviews
Cake Decoration 8
Food Ingredients 10
Premium Bakery 12
Corporate Social Responsibility 14
Key Performance Indicators and Risks 16
Finance Review 17
ouR GoveRnAnceBoard of Directors 20
Executive Team 21
Report of the Directors 22
Audit Committee Report and Remuneration Committee Report 25
ouR FinAnciAlSIndependent Auditor’s Report 26
Consolidated Statement of Comprehensive Income 27
Consolidated Statement of Changes in Equity 28
Company Statement of Changes in Equity 29
Consolidated Statement of Financial Position 30
Company Statement of Financial Position 31
Consolidated Cash Flow Statement 32
Company Cash Flow Statement 33
Notes to the Financial Statements 34
Advisers IBC
Renshaw, Renshaw Europe,
Rainbow Dust Colours
Annual Report and Accounts for the year ended 31 March 2016

24831-02 - RGF AR 2016 2 August 2016 5:57 PM Proof 12
Highlights
operating Highlights { Following the successful disposal of Napier Brown, which generated a profit of £9.1 million the Group made a statutory profit before tax of £12.9 million in the year
{ Disposal transformed the Group balance sheet reducing net debt from £30.1 million down to £5.1 million
{ Group restructured into three pillar markets with stand-alone business strategies for each
{ Continuing investment strategy in core markets and across business assets to drive operating efficiency and future EBITDA growth
{ Acquisition strategy progressing to plan: Rainbow Dust Colours (January 2015); ISO2 Nutrition (December 2015); Chantilly Patisserie (February 2016) successfully completed
{ New Development Centre in Liverpool opened providing a base for our Group plc support functions (Technical, IT, HR, Operations) and a state-of-the art Innovation Centre for new product development
{ Launch of ‘Renshaw Academy’ to further monetise the Renshaw brand and to cement our position as industry leader in the global cake decorating market
{ Strong financial and operational platform in place for future growth in all three pillar markets: Cake Decoration, Food Ingredients and Premium Bakery
£113.7m
GROUP REVENUE
2015£232.9m
£100.4m
CONTINUING OPERATIONS
REVENUE
2015£104.6m
£5.0m
GROUP EBITDA*
2015£2.0m
£5.0m
CONTINUING OPERATIONS
EBITDA
2015£5.3m
£28.0m
GROSS PROFIT
2015£35.9m
£26.7m
CONTINUING OPERATIONS
GROSS PROFIT
2015£25.6m
Read more in the Finance Review on pages 17 to 19
* Throughout this report an underlying EBITDA is calculated as operating profit before depreciation, amortisation and significant items: see note 5.
www.realgoodfoodplc.com Stock Code: RGD 1Strategic report

24831-02 - RGF AR 2016 2 August 2016 5:57 PM Proof 12
Group at a Glance
Real Good Food operates in three distinct market sectors:Cake Decoration, Food Ingredients and Premium Bakery.
three pillar marketsWhile each Division comprises individual business units, Group employees work to set overall Divisional strategies based on market understanding and ensure cooperation between the businesses so that synergy opportunities are realised.
Read more on page 8 Read more on page 10 Read more on page 12
£48.3mTURNOVER
EMPLOYEES356
EBITDA£•.•m
EBITDA£7.3m
£22.7mTURNOVER
EMPLOYEES121
EBITDA£•.•m
EBITDA£(0.1)m
£29.4mTURNOVER
EMPLOYEES480
EBITDA£•.•m
EBITDA£0.7m
Annual Report and Accounts for the year ended 31 March 20162
Strategic report

24831-02 - RGF AR 2016 2 August 2016 5:57 PM Proof 12
Renshaw manufactures sugarpaste, marzipan, soft icings, mallows and caramels
and sells across a broad range of sales channels: mainstream and specialist retail,
wholesale, foodservice and food manufacturing as well as export. Rainbow Dust Colours produces a range of edible glitters, dusts,
powders and food paints, brushes and pens for the specialist sugarcraft sector. Renshaw Europe sells, markets and
distributes both Renshaw and Rainbow Dust products across continental Europe.
Renshaw: Liverpool 318 employees
Rainbow Dust Colours: Preston 28 employees
Renshaw Europe: Brussels 10 employees
Haydens bakes premium tarts, pies and crumbles, Danish, sweet buns, yum yums and doughnuts and sells to major retail customers and through foodservice channels. It operates
both an ambient and frozen supply chain. It also operates a same day consolidation service for
all Waitrose stores for both Haydens and third party products. Chantilly manufactures
premium quality frozen desserts (e.g. gateaux, cheesecakes, tarts and flans) and sells them to
pubs and restaurants.
Haydens: Devizes, Wiltshire 450 employees
Chantilly: Paignton, Devon 30 employees
Garrett Ingredients sources dairy, sugar and other specialist food ingredients from
across the UK, Eire and continental Europe and sells them to large, medium and small food
manufacturers across the UK. Through GI Nutrition, it also manufactures and
sells whey protein supplements and sports nutrition products through retail and specialist
sales channels. R&W Scott manufactures chocolate coatings, sauces, jams and dry powder
blends for industrial, retail, wholesale and foodservice markets.
Garrett Ingredients: Thornbury, near Bristol 20 employees
GI Nutrition: Swindon 6 employees
R&W Scott: Carluke, near Glasgow 95 employees
www.realgoodfoodplc.com Stock Code: RGD 3Strategic report

24831-02 - RGF AR 2016 2 August 2016 5:57 PM Proof 12
chairman’s Statement
a US company (Renshaw US Inc.) to drive this initiative. We see similar potential in Australasia and elsewhere. The transition from being just a manufacturer of products for other people to becoming a market and brand-led player (both with Renshaw and Rainbow Dust Colours) will be profound.
Food Ingredients is a very different market where inevitably margins are lower but we also see increasing opportunities for providing added value. The acquisition of ISO2 Nutrition is an example of finding a niche in an area of our competences (whey protein is the main ingredient) and thereby providing diversification for Garrett Ingredients from its commodity base in dairy powders and sugar. Both these commodity sectors have been extremely difficult over the past two years with prices hitting record lows. There are already signs, particularly in sugar, that prices will rise, but our strategy is to reduce our reliance on this and seek more lucrative and sustainable sectors. We also believe that customer service and an efficient supply chain are important factors in this market and we continue to investigate how we can build competitive advantage in this way.
The year to 31st March 2016 saw the Group make a pre-tax profit of £12.9 million following the hugely successful disposal of Napier Brown which generated an exceptional profit of £9.1 million. While underlying EBITDA for the continuing businesses was largely flat, the Napier Brown sale has transformed our balance sheet (net debt at the year-end improved from £30.1 million to just £5.1 million) and thereby enabled us to begin a strategy of investing in building strategic positions in our core markets. In this respect the Napier Brown case history (building and investing strategically for the long term) is a model for what we intend to do in our remaining markets.
We have spent the time since the Napier Brown disposal reviewing our strategy, clarifying our focus and restructuring the business accordingly. We now operate in three pillar markets (Cake Decoration, Food Ingredients and Premium Bakery) and our objective will be to build scale and strategic positions in each of these through organic growth, targeted investment and bolt-on acquisitions as appropriate.
Each market has different characteristics and will generate different returns and our plans will reflect this. We will also evolve our management structures and approach to make sure that the potential for each of these divisions is maximised.
We have made progress on a number of fronts. In Cake Decoration, the acquisition of Rainbow Dust Colours in January 2015 has now been fully integrated and it is a core part of this division. It will now be selling Renshaw products directly to some of its specialist customers who would prefer to have a one-stop shop. We have also recognised increased potential for tackling the cake decoration market globally and intend during the course of the next 12 months to create a global range under the Renshaw brand. While there may be the need to tailor locally either for reasons of different legislation or local tastes, the essential market positioning of the Renshaw brand and products will be the same. To provide additional focus for this initiative we have renamed our European business ‘Renshaw Europe’ and also set up
We now operate in three pillar markets: Cake Decoration, Food Ingredients and Premium Bakery
Pieter Totté Executive Chairman”
Above: This Avatar cake was displayed at the opening of Wavertree Development Centre
Read more about Renshaw in Our Strategy on page 6
Annual Report and Accounts for the year ended 31 March 20164
Strategic report

24831-02 - RGF AR 2016 2 August 2016 5:57 PM Proof 12
In Premium Bakery, the acquisition of Chantilly Patisserie is a perfect example of the type of business we are keen to acquire and build on. It operates in a small but fast growing market niche – high quality out-of-home desserts. The business brings to us great skills in product and specific customer knowledge while we can help it grow and extend its technical capabilities and customer reach. Meanwhile, we have determined on a very clear vision for our core business in this sector, Haydens, by increasingly focusing on fewer product lines and product sectors – producing many more of fewer products and thereby doing it better and generating better returns. Part of this initiative is to produce a branded range from Haydens in the coming year. We also see significant opportunity to use our stronger cash resources to automate non-added value processes which will both reduce costs and improve quality and consistency.
We have also been evolving our management model. While we believe in local accountability for stand-alone businesses we increasingly see divisional opportunities and the value which expert Group functions can deliver. To this end the opening of our new Development Centre in Liverpool is central to our strategy. The centre provides three things: first, a base for our Group support functions (Technical, IT, HR, Operations) which previously had been squeezed into the Renshaw Crown Street site; secondly, a state-of-the-art Innovation Centre for our
Group new product development and applications teams who previously had to use only site- based equipment. The food industry is fast moving with consumers becoming ever more demanding in terms of health, quality, shelf life, convenience and personalisation. The challenge is to find technical and process solutions to deliver these benefits to consumers and our Innovation Centre team are fully focused on this with a number of exciting projects in the pipeline.
Finally the Development Centre houses our new ‘Renshaw Academy’. This initiative is part and parcel of the Renshaw global range launch and will be the main marketing support vehicle for it. Consumer aspiration to improve cake decorating skills is a global phenomenon and the Renshaw brand has the reputation as the expert and thus is well placed to lead the market both in terms of product range and customer and consumer inspiration. More detail on our plans is given later in this report.
outlookThe food industry faces challenging times with diversifying sales channels, increasing legislative burdens, the growth in the minimum wage and ever-demanding consumers. The response to these trends requires being alert to all these factors and having the resources to invest and adapt. In this respect I am confident that with our clear strategy and strong balance sheet we are in a good position to build three increasingly strong businesses in our three pillar markets.
Trading in the first three months of the new financial year has been satisfactory; with recent order intake positive, and with the investments we are making, I am confident that we will deliver growth across all three divisions.
Pieter Totté Executive Chairman
Read more about Chantilly on pages 6 and 12
www.realgoodfoodplc.com Stock Code: RGD 5Strategic report

24831-02 - RGF AR 2016 2 August 2016 5:57 PM Proof 12
Group Strategy
The Group will deliver shareholder value by building long term sustainable businesses in its three pillar markets of Cake Decoration, Food Ingredients and Premium Bakery.MARKetplAce
Each of these markets has different characteristics and our strategies will be tailored to the specific market needs but with the common theme of building long term sustainable growth.
Cake Decoration is a growing and global market with a spectrum of consumers from experts to beginners and a wide range of trade channels. The market displays many similar characteristics to hobby, leisure and fashion markets and as such has the potential for above-average returns compared to the food industry average. At the same time the need to invest in innovation and manufacturing and supply chain flexibility is paramount.
Food Ingredients is a broad market sector and with major product sectors driven by commodity pricing. However, within this, there are a number of sources of competitive advantage and added value. Customer service and logistics can be a significant differentiator while technical support and (in traded products) full traceability is an important element in the customer proposition.
Premium Bakery is a growing sector with volume in commodity bakery in decline alongside growth in value as consumers migrate to higher value premium offerings both in home and increasingly out-of-home. Health concerns are relevant but high quality, indulgent and occasional treats still represent a growing opportunity. New product development is an important facet of the market with opportunities to deliver healthier yet still indulgent eating products a particular focus.
StRAteGY
Real Good Food will utilise Renshaw as its global brand to access this market, leveraging its strong ‘The Professionals Choice’ reputation. The launch of ‘The Renshaw Academy’ will be used to underpin and build its global reputation as well as being a showcase for all Real Good Food cake decoration products both from Renshaw and Rainbow Dust Colours. As well as holding courses at the Academy facility in Liverpool, the Academy will build a network of global ambassadors for the Renshaw Academy. Courses will also be webcast to international audiences.
Real Good Food will focus on its core competences of dairy and sugar trading as well as chocolate coating, jam, fruit preparations and sauces manufacture and seek to develop added value opportunities on this strong base. The acquisition of the sports nutrition brand ISO2 Nutrition (using whey protein), the development of high quality sauces for manufacturing and retail and of soft fillings for the confectionery manufacturing industry are examples. Supply partnerships and distributorships will be a part of developing the portfolio.
Real Good Food will focus on a number of products and processes where it has product quality leadership – e.g. Danish, yum yums, frozen desserts. Haydens will launch a branded range to showcase its product excellence and extend its retail presence while the acquisition of Chantilly Patisserie not only represents an extension of the range portfolio but facilitates greater access to out-of-home eating occasions. Investment will be made in automating non-added value processes provided they maintain or even enhance product consistency and quality.
Annual Report and Accounts for the year ended 31 March 20166
Strategic report

24831-02 - RGF AR 2016 2 August 2016 5:57 PM Proof 12
The building houses central Group support functions of technical, IT and Digital, HR and Operations.
It also contains the Group Innovation Centre, a world class facility looking to develop new products for the businesses using emerging technologies in product, process and packaging. The Innovation Centre will also be a source of inspiration for customers on applications for Real Good Food product ingredients, be they for cake decoration or other ingredients.
Finally the building contains the new ‘Renshaw Academy’. The vision for this is to be ‘the most inspirational cake decorating academy in the world’ providing a showcase for all of Real Good Food's cake decorating products. The school will encompass both cake decorating experts as well as the less highly skilled hobbyists and teach both traditional and contemporary methods and techniques. It will be a revenue generating facility though its primary objective will be to underpin the excellence of the Renshaw brand reputation.
the Real Good FoodDEvElOPMEnT CEnTREThis new facility opened in May 2016 and is central to Group strategy providing direct support to the growth of each division.
www.realgoodfoodplc.com Stock Code: RGD 7Strategic report
Real Good Food has considerable expertise in producing highly functional sugarpaste (icing); the Renshaw brand has a long-established reputation as the benchmark product for professional cake decorators who require stringent standards of strength and elasticity to produce the perfect looking cake. The Innovation team was briefed to look at the potential of a product which maintained these essential functional characteristics but also incorporated improved taste and texture for consumers wanting a more
everyday product. This has involved combining traditional icing with in-house manufactured caramel and chocolate through careful control of water activity, fat levels, emulsification and natural gum systems. This blending of a number of Real Good Food’s manufacturing capabilities to produce a product which meets the increasing market for indulgently eating products is a good example of how the central Innovation team will operate. The new product will launch in 2017.
CASE hISTORy Product Innovation

24831-02 - RGF AR 2016 2 August 2016 5:57 PM Proof 12
Divisional Business Review
2015/16 performanceSales revenue was slightly down on the previous year as Renshaw removed a manufacturing contract and Renshaw Europe lost a private label contract. Sales of Renshaw brand, however, grew as the company focused on developing its branded proposition. Export sales outside Europe showed strong growth. At Rainbow Dust Colours, sales of Progel© food colouring and metallic food paints in particular showed good growth, both areas where we have clear product superiority. As the market matures opportunities are appearing in more mainstream retailers such as Hobbycraft and John Lewis.
Forward plansThe new focus on developing a global branded range will take shape during the course of 2016. A relaunch of the core sugarpaste range in upgraded packaging is already having a strong impact in the market as is the introduction of ‘Renshaw Extra’, a firmer and more elastic product designed for European tastes and also more effective in hotter climates. Further significant product initiatives will be launched in early 2017. At Rainbow Dust Colours a number of major product initiatives are also in place; a relaunch of the ‘food art’ pens, an upgraded recipe on matt food paints and new multi-lingual packs on Progel©.
£48.3mREVENUE
OPERATING PROFIT
£6.5m
EBITDA£7.3m
pictured: Cupcakes – stencil design using Rainbow Dust 'Plain & Simple'
12 MONThS TO MARCh2015/2016
£m2014/2015
£m
Revenue 48.3 49.2EBITDA 7.3 6.5Operating profit 6.5 5.5
Operating profit % 13.5 11.2
Annual Report and Accounts for the year ended 31 March 20168
Strategic report

24831-02 - RGF AR 2016 2 August 2016 5:57 PM Proof 12
www.realgoodfoodplc.com Stock Code: RGD 9Strategic report

24831-02 - RGF AR 2016 2 August 2016 5:57 PM Proof 12
Divisional Business Review
2015/16 performanceRevenues were significantly down year on year due to unprecedented commodity price deflation particularly in sugar and dairy. Both these markets experienced record low levels of prices; sugar was impacted not only by weak world prices but also in Europe ahead of the ending of quotas in 2017, while dairy, where quotas have already ended, was affected by the Russian export ban. In this context Garrett Ingredients did well to increase its traded dairy volumes though sugar sales fell slightly. The acquisition of ISO2 Nutrition generated a modest amount of sales but set-up costs led to a small overall loss in the year. Sales volume was slightly ahead of the previous year at R&W Scott though again price deflation led to a marginal revenue decline. Investment in management teams at both businesses led to higher costs and a decline in EBITDA. Both businesses are now fully equipped to run on a stand-alone basis and develop their growth plans.
Forward plansGarrett Ingredients is well placed to benefit from any upturn in sugar and dairy pricing and will build sales in sports nutrition. At R&W Scott a number of product initiatives (soft fillings, fruit fillings, sauces, curds, mallows and premium jams) have been developed and are being sold across all channels. The investment in jam capacity at R&W Scott, which caused some disruption last year, should begin to yield benefits. R&W Scott will also significantly increase its supply into other Real Good Food companies (especially Haydens) facilitated by the central Innovations team.
£22.7mREVENUE
OPERATING LOSS
(£0.4m)
EBITDA(£0.1m)12 MONThS TO MARCh
2015/2016 £m
2014/2015 £m
Revenue 22.7 27.0EBITDA (0.1) 0.5Operating (loss)/profit (0.4) 0.3
Operating (loss)/profit % (2.0) 1.1
pictured: R&W Scott chocolate sauce
Annual Report and Accounts for the year ended 31 March 201610
Strategic report

24831-02 - RGF AR 2016 2 August 2016 5:57 PM Proof 12
www.realgoodfoodplc.com Stock Code: RGD 11Strategic report
24831-02 - RGF AR 2016 2 August 2016 5:57 PM Proof 12
Divisional Business Review
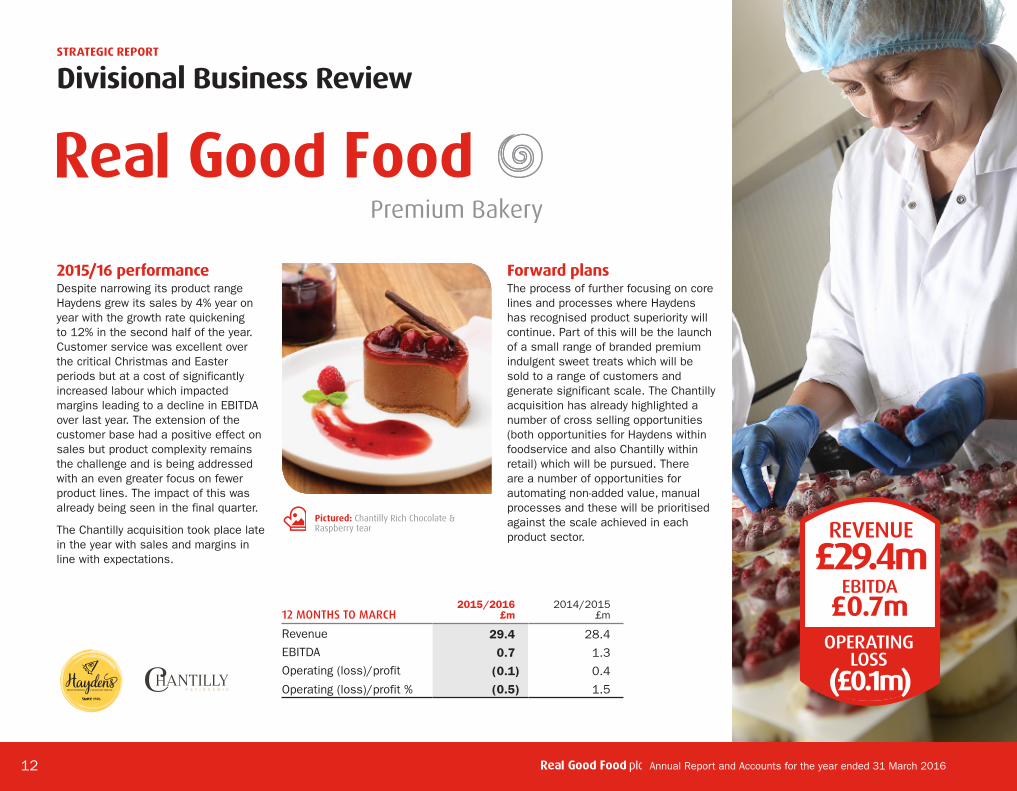
2015/16 performanceDespite narrowing its product range Haydens grew its sales by 4% year on year with the growth rate quickening to 12% in the second half of the year. Customer service was excellent over the critical Christmas and Easter periods but at a cost of significantly increased labour which impacted margins leading to a decline in EBITDA over last year. The extension of the customer base had a positive effect on sales but product complexity remains the challenge and is being addressed with an even greater focus on fewer product lines. The impact of this was already being seen in the final quarter.
The Chantilly acquisition took place late in the year with sales and margins in line with expectations.
Forward plansThe process of further focusing on core lines and processes where Haydens has recognised product superiority will continue. Part of this will be the launch of a small range of branded premium indulgent sweet treats which will be sold to a range of customers and generate significant scale. The Chantilly acquisition has already highlighted a number of cross selling opportunities (both opportunities for Haydens within foodservice and also Chantilly within retail) which will be pursued. There are a number of opportunities for automating non-added value, manual processes and these will be prioritised against the scale achieved in each product sector.
£29.4mREVENUE
OPERATING LOSS
(£0.1m)
EBITDA£0.7m12 MONThS TO MARCh
2015/2016 £m
2014/2015 £m
Revenue 29.4 28.4EBITDA 0.7 1.3Operating (loss)/profit (0.1) 0.4
Operating (loss)/profit % (0.5) 1.5
pictured: Chantilly Rich Chocolate & Raspberry tear
Annual Report and Accounts for the year ended 31 March 201612
Strategic report

24831-02 - RGF AR 2016 2 August 2016 5:57 PM Proof 12
www.realgoodfoodplc.com Stock Code: RGD 13Strategic report

24831-02 - RGF AR 2016 2 August 2016 5:57 PM Proof 12
corporate Social Responsibility
We continue to develop our activities in a socially responsible manner. The last year has seen a number of key activities across the Group:
Business in the communityWe continue to work with Business in the Community to develop our approach to Corporate Social Responsibility.
During the year with their help and support we developed a Responsible Business Framework for the Group, involving key stakeholders from each business. This provided a framework around our three core principles of People, Communities and Operational Responsibility. Key areas for action were identified as follows:
people communities operational Responsibility
✪ Health & Safety ✪ Training & Development
✪ Recognition ✪ Communication ✪ Health & Wellbeing ✪ Diversity & Inclusion
✪ Charitable Giving ✪ Proactive involvement in local community
✪ Links with schools and colleges
✪ Environmental Management
✪ Ethical Trading ✪ Customer Engagement
✪ Responsible Marketing
Each business was tasked with developing its own action plans to determine exactly what it wanted to achieve and what could be done to support this. The Group Directorate is working closely with each business to develop those activities further and progress has been made throughout the year.
peoplehealth and SafetyAll companies within Real Good Food have made improvements in health and safety performance over the last year. See table below. Rainbow Dust Colours, acquired in January 2015, has been introduced to the Real Good Food Safety Management System and has been included within the Real Good Food audit programme.
Common areas for further continuous improvement have been identified as:1 Risk Assessments & Safe Operating
Procedures: These include Site Transport, Manual Handling and DSEAR (Dangerous Substances and Explosive Atmospheres Regulations)
2 Safety Training3 Machinery (Provision & Use of
Work Equipment Regulations) Assessments
4 Effective planned preventative maintenance
5 Business continuity plans are progressing well across all sites
6 DSEAR – actions have been identified as part of individual site risk assessments
7 Occupational Health – a new programme for routine screening is required to include new starters, audiometry, spirometry
Talent Development2015–16 has seen the Group further develop and strengthen its management teams across all businesses ensuring we are fit to meet the challenges of the future, both internationally and in the UK.
We seek to recruit the people of the highest calibre and commit to their ongoing development upon joining our Group. To this end we have continued to develop our people through our leadership development programme across the Group and are now seeing the benefits of our investment during the last three years in our leadership teams. Clear roles and accountability, coupled with behaviours consistent with our 'RECIPE' values are being demonstrated through improved operational performance and employee retention rates.
Our leadership framework is being further developed with the clear objective of the creation and development of high performing teams across the Group and 2016–17 will see its conclusion and launch to our leadership and management teams.
COMPANY AUDIT SCORE 2015 AUDIT SCORE 2014
Haydens Bakery 94% 90%
Renshaw Liverpool 90% 88%
R&W Scott – Carluke 86% 82%
Rainbow Dust – Preston 35% Recent Acquisition
Annual Report and Accounts for the year ended 31 March 201614
Strategic report

24831-02 - RGF AR 2016 2 August 2016 5:57 PM Proof 12
Schools and collegesWork experience initiatives and school visits continue across the Group in all businesses and our collaboration with local colleges and universities continues to bear fruit, with apprenticeships in place for engineers, food technologists and applications technicians.
As we seek to develop our Group digital strategy, we have created university placements for students at our new Development Centre. They will work closely with the existing team at Group level and across all of the businesses to implement and develop leading
edge techniques to ensure our on-line presence is at the forefront, whilst also gaining valuable work experience.
2016 will see us sponsor a scholarship programme relevant to baking and confectionery skills – we have worked closely with further educational establishments to develop this programme which is to be launched imminently. We will provide support, guidance and materials to this exciting new development and look forward to reporting a successful launch of the programme next year.
operational Responsibility Modern SlaveryWe have developed our statement on Modern Slavery and Human Trafficking which can be found on our website in full. As a responsible organisation we recognise our responsibilities and our commitment to ensuring an ethical approach to our activities remains at the forefront of all we do and throughout our supply chains.
Our commitment and support of the Ethical Trading Initiative continues with successful unplanned audits at Devizes and Liverpool during the year.
communitiesCharitable GivingRenshaw2015–16 saw the Renshaw team raise in excess of £5,000 for Cancer Research in memory of a colleague who had passed away during the year. This was raised by raffles, charity race nights and the annual Santa Dash in Liverpool.
The business supported such activities by way of donating prizes, paying for race entry fees and making donations to worthy causes local to site such as care homes and schools.
R&W ScottAs usual the R&W Scott team showed their commitment to local causes and fundraising during the year. Support and promotion of the local Carluke Jam & Ham Festival, hosting local primary school visits and fundraising activities were all highlights of the year.
haydensOver the past 12 months Haydens donated cakes to at least one local event every month varying from school fundraising events and fire station fun days to the Wiltshire Air Ambulance Volunteers Christmas party. The Wiltshire Air Ambulance continued to be the Haydens 'Chosen Charity of Choice' and during the year a group from the bakery visited its head office to understand more fully the vital role it plays in the local community
Rainbow DustA team from Rainbow Dust undertook the gruelling Yorkshire three peaks challenge raising over £3,000 for a local hospice.
InvolvementWe seek to involve and empower our people in key business development activities and one such example in March of this year was when a team of key operatives and engineers from Renshaw spent a week in Switzerland providing input to and receiving training on a significant new process whilst it was being built and before it was commissioned and installed in our factory at Renshaw. The involvement of the team at the outset was crucial to its success when installed and the performance of this process in the factory at Liverpool has been outstanding with full ownership by the team.
Reward and RecognitionOur MAD (Made a Difference) award scheme saw many awards made across the Group throughout the year, with colleagues being nominated by their peers and recognised and rewarded for exceptional performance, above and beyond the call of duty.
This year, we held the first Group Super MAD Award, with the best of the best from around the Group being nominated by their businesses and rewarded and recognised at a ceremony with our Chairman at the new Development Centre in Wavertree.
Below: The Charity run at Carluke The Charity walk by Rainbow Dust
Above: The presentation of the new Super MAD Award
www.realgoodfoodplc.com Stock Code: RGD 15Strategic report

24831-02 - RGF AR 2016 2 August 2016 5:57 PM Proof 12
principal RisksThe Group operates in a continually changing environment and consequently our risks change over time. The assessment of risks and the development of strategies for dealing with them are dealt with on an ongoing basis through Group management and control processes. A formal review is carried out on an annual basis. This review includes the identification of risks and the likelihood of them impacting the business and the
potential severity of that impact and the determination of what needs to be done to manage them effectively.
The Directors have identified the following as principal risks:
{ Key Customers { Customer Requirements { Product Quality { Labour Costs, Prices and Supply { Health and Safety
{ Raw Materials
Key performance indicators and Risks
Risks Mitigation
Key CustomersThe Group has a number of key customers from which it derives its revenue. Its key customers tend to work without long term contracts
The Group works with its key customers to ensure product development and customer service matches expectations and is flexible to meet demandsSales and Marketing strategies are set to attract new customers and limit any reliance on one particular customer
Customer RequirementsChanges in overall economy and consumer fashions may affect the marketability of the Group's offering
The Group Innovation Centre recently opened and the new product development teams at the individual operating businesses work together to ensure the Group is always looking at new product areas to be ahead of any changes in the markets
Product QualityMaintenance of product quality standards is vital to sustained sales performance
As a reputable food manufacturer our operating divisions rigorously enforce our technical policies and procedures in relation to production and storage of our products. Our larger divisions are all BRC accredited and our smaller divisions are SALSA accredited
Labour costs, prices and supplyThe Group employs an average of 1058 employees of which 743 are direct labour employees and its success depend on attracting and retaining quality staff at the correct skill level
The Group has established a strong HR team across all of its operating sectors, with strict recruitment criteria and processesPersonal development reviews are carried out every six months to map out training and development needs
Health and SafetyAny breach of Health and Safety legislation may lead to reputation damage and penalties
The Group has a compliance programme in place and this is audited by an external party to ensure that all legal and internal standards are met and adhered to
Raw MaterialsRaw materials used by the Group are subject to price fluctuations and market conditions
The Group purchasing managers liaise regularly to ensure best buying practices are maintained and volume advantages are earnedOn commodities, forward purchase contracts are entered into to ensure best prices are obtained and continuation of supply is maintained
Key performance indicatorsThe Board of Directors monitors a range of financial and non-financial key performance indicators, reported on a periodic basis, to measure the Group’s performance over time. The key performance indicators, all based on continuing operations, are set out below:
REVENUE GROwThRevenue is calculated for continuing business and excludes sugar for 2014 and is from external sources only.
EBITDAEBITDA is defined as earnings before significant items, interest, tax depreciation and amortisation.
NET DEBTNet Debt is the total Group borrowings less cash at bank.
DEBT COVERDebt cover is calculated by dividing total Net Debt by continuing EBITDA.
hEALTh & SAFETY SCOREHealth & Safety score represents a weighted average score across all sites and is measured by an external consultant. Figures are quoted for calendar years.
Revenue has fallen due to falling commodity prices and removal of manufacturing contracts.
2016 2015 2014
£100.4m £104.6m £110.2m
(3.9)% GROWTH
(5.1)%GROWTH
2.6%GROWTH
2016 2015 2014
£5.0m£5.3m
£4.9m
5.0% OF SALES
5.1% OF SALES
4.4% OF SALES
2016 2015 2014
£5.1m
£30.1m £31.1m
2016 2015 2014
1.0
5.6
9.5
2016 2015 2014
90%82%
92%
EBITDA has held steady in what have been difficult food market conditions.
With the sale of Napier Brown Net Debt has reduced significantly.
With the level of reduced debt and the maintenance of the EBITDA level then debt cover is at a comfortable level.
In 2014, measures were reset effectively toughening the measure by approximately ten percentage points.
coMMent
Annual Report and Accounts for the year ended 31 March 201616
Strategic report

24831-02 - RGF AR 2016 2 August 2016 5:57 PM Proof 12
Finance Review
The business is now fully focused on its three pillar markets which are Cake Decoration, Food Ingredients and Premium Bakery
David Newman Group Finance Director”
overviewDuring this financial year the Group completed its segregation programme to achieve its model of each business unit being a stand-alone legal entity. It has also now fully focused the business on its three pillar markets and in this annual report will be reporting on the Group results based on those markets which are Cake Decoration, Premium Bakery and Food Ingredients. Comparative figures have been restated to reflect these markets.
RevenueGroup revenue for the 12 months ended March 2016 for continuing businesses was £100.4 million which is drop of 4% on the revenue to March 2015. This is the result of a move away from low margin contract business in Cake Decoration and also the low prices in the Food Ingredients markets.
Below: The new Renshaw Academy
Financial Summary
31 March 2016 31 March 2015
Continuing£’000s
Total£’000s
Continuing£’000s
Total£’000s
Revenue 100,439 113,676 104,580 232,868Gross profit 26,670 28,023 25,561 35,925Delivered Margin(Gross profit after distribution costs) 21,303 21,507 19.989 20,415EBITDA* 5,043 5,027 5,319 1,960
Operating profit*
(EBITDA less depreciation) 3,082 2,998 3,202 (741)Operating profit % 3.1% 2.6% 3.1% (0.3%)Profit/(loss) before taxation* 2,413 1,423 2,101 (2,677)
* before significant items
profit Measure on continuing operations Delivered Margin on the continuing businesses for the overall Group has encouragingly increased to £21.1 million from £19.9 million. Cake Decoration has increased margins by 4% as it has concentrated on higher margin business and the benefit of the Rainbow Dust acquisition is felt for the full year.
Premium Bakery has maintained a 13% margin on increased turnover whilst the Food Ingredients pillar has maintained a 10% margin even though turnover has declined in what has been a difficult trading year.
EBITDA for the 12 months to March 2016 was £4.9 million, down by £0.5 million from March 2015 as the Group continued to invest in overheads to continue its drive towards a fully market led operation.
Statutory profit before tax has been boosted by the profit on sale of Napier Brown Sugar of £9.1 million and an exceptional write-back of a Rainbow Dust liability no longer required of £3.2 million, as the contingent conditions were not met. This has resulted in a statutory profit before tax of £12.9 million (March 2015 loss £3.5 million) giving a basic EPS of 18.36p per share (2015 loss per share 4.9p).
www.realgoodfoodplc.com Stock Code: RGD 17Strategic report

24831-02 - RGF AR 2016 2 August 2016 5:57 PM Proof 12
Finance Review (continued)
cash Flow and net DebtFollowing the sale of Napier Brown Sugar Ltd to Tereos in May 2015 and the receipt of the £44.4 million disposal proceeds the Group was able to repay all of its borrowings and to close its position with PNC Business Capital.
The Group was also at this time able to repay the Loan Note that had been outstanding with NB Ingredients since the acquisition of Napier Brown by Real Good Food.
net Debt Summary
31 March 2016
£’000’s
31 March 2015
£’000’s
Working Capital 16,054 7,557(Inventories, trade and other receivables, trade and other payables)Net Borrowings (incl. Cash) 5,067 30,140
Net Debt/EBITDA 1.0 15.4
The Group already had a relationship with Lloyds Bank plc for its daily banking arrangements and in September 2015 in order to cover working capital requirements and to fund the Group's acquisition policy this relationship was extended with the addition of a £10 million invoice finance facility.
As noted above with the sale of Napier Brown Sugar Ltd the Group was able to clear its borrowings with PNC and accordingly net debt has reduced significantly during the year finishing on 31 March 2016 at £5.1 million compared to £30.1 million at March 2015.
Cash generated from operations for the year was (£1.9 million) compared to £4.8 million in 2015 reflecting a higher working capital investment in the business due to higher commodity prices and more competitive trading leading to longer credit terms to customers.
The Group invested £6.4 million in tangible fixed assets, an increase of £4.2 million of 2015, reflecting the modernisation of the Group’s factories and its facilities. This sum included £2.4 million on the new Group Innovation Centre.
Annual Report and Accounts for the year ended 31 March 201618
Strategic report

24831-02 - RGF AR 2016 2 August 2016 5:57 PM Proof 12
AcquisitionsThe Group has been successful in acquiring two business during the year in accordance with its stated policy of looking for bolt-on acquisitions.
In December 2015 it acquired the ISO2 Nutrition sports supplement brand from the administrators of Cre8tive Health Ltd. This business has been integrated into Garrett Ingredients, part of the Food Ingredients sector, and is seen as an enabler to the entry into a new and interesting product and portfolio diversification. The total consideration was £15,995.
In February 2016 it acquired Chantilly Patisserie, based in Paignton, Devon, employing some 30 staff, and producing high quality, hand-made frozen desserts, supplying the foodservice sector, with customers such as Marston’s Brewery, Warner Leisure, Brakes, and Country Range. The business complements the offering of Haydens extremely well and it is envisaged that significant commercial opportunities for both businesses will be identified as a result. The total consideration was £1.75 million.
Further details of these acquisitions are given in Note 33 to the accounts.
capital RestructuringDuring the year the Group held an extraordinary general meeting in order to get approval from shareholders to cancel its share premium reserve and transfer the amount into distributable reserves. This proposal was approved and an application was then made to the courts to complete this process. This was approved by the courts on 4 May 2016. This will be reflected in the financial statements for the year ended 31 March 2017.
pensionThe Group operates defined contribution pension schemes with contributions made to schemes administered by major insurance companies. Contributions to these schemes are set as a percentage of an employee’s earnings.
The Group also operates a defined benefit pension scheme which has been closed to further benefit accrual since 2000. In preparation for the disposal of the sugar business it was decided to transfer the liability for this scheme out of J F Renshaw Ltd into Real Good Food plc.
The scheme deficit at 31 March 2016 was £6.1 million (2015 £5.7 million). Cash contributions to the scheme in the year ended 31 March 2016 amounted to £282,000 in line with the agreed recovery plan.
For further information see note 31 to the financial statements.
This report was approved by the Board on 31 July 2016.
P W Totté Chairman
D P Newman Finance Director
www.realgoodfoodplc.com Stock Code: RGD 19Strategic report
24831-02 - RGF AR 2016 2 August 2016 5:57 PM Proof 12
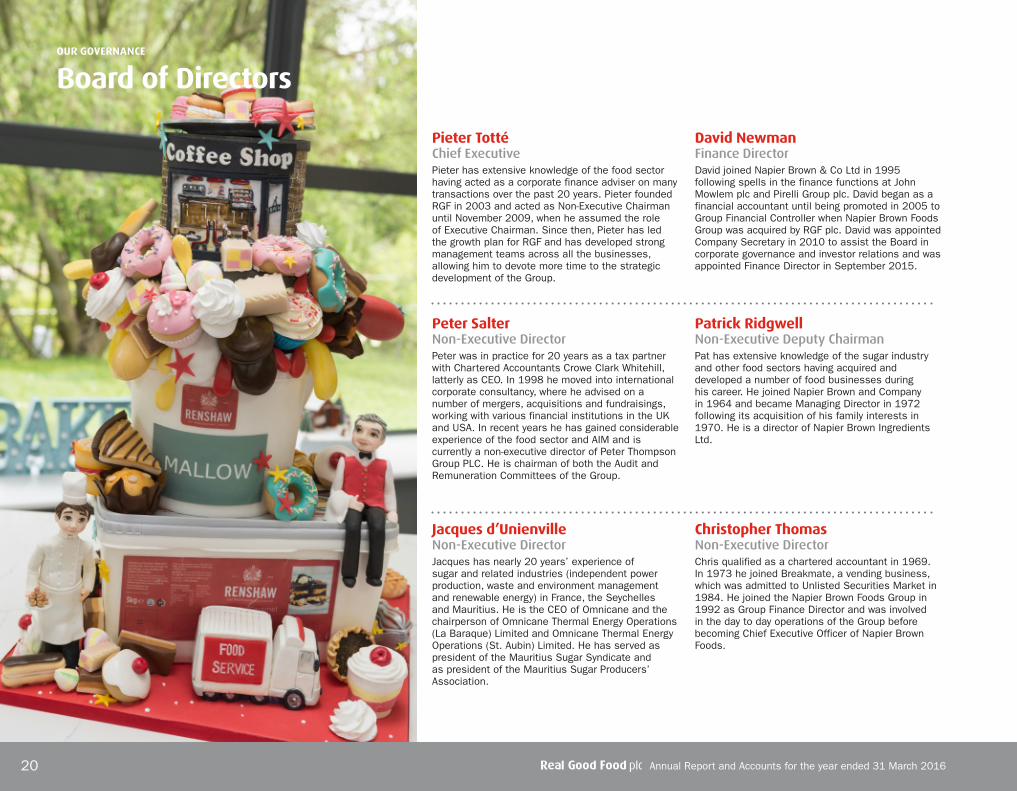
pieter tottéChief ExecutivePieter has extensive knowledge of the food sector having acted as a corporate finance adviser on many transactions over the past 20 years. Pieter founded RGF in 2003 and acted as Non-Executive Chairman until November 2009, when he assumed the role of Executive Chairman. Since then, Pieter has led the growth plan for RGF and has developed strong management teams across all the businesses, allowing him to devote more time to the strategic development of the Group.
David newmanFinance DirectorDavid joined Napier Brown & Co Ltd in 1995 following spells in the finance functions at John Mowlem plc and Pirelli Group plc. David began as a financial accountant until being promoted in 2005 to Group Financial Controller when Napier Brown Foods Group was acquired by RGF plc. David was appointed Company Secretary in 2010 to assist the Board in corporate governance and investor relations and was appointed Finance Director in September 2015.
peter SalterNon-Executive DirectorPeter was in practice for 20 years as a tax partner with Chartered Accountants Crowe Clark Whitehill, latterly as CEO. In 1998 he moved into international corporate consultancy, where he advised on a number of mergers, acquisitions and fundraisings, working with various financial institutions in the UK and USA. In recent years he has gained considerable experience of the food sector and AIM and is currently a non-executive director of Peter Thompson Group PLC. He is chairman of both the Audit and Remuneration Committees of the Group.
patrick RidgwellNon-Executive Deputy ChairmanPat has extensive knowledge of the sugar industry and other food sectors having acquired and developed a number of food businesses during his career. He joined Napier Brown and Company in 1964 and became Managing Director in 1972 following its acquisition of his family interests in 1970. He is a director of Napier Brown Ingredients Ltd.
Jacques d’unienvilleNon-Executive DirectorJacques has nearly 20 years’ experience of sugar and related industries (independent power production, waste and environment management and renewable energy) in France, the Seychelles and Mauritius. He is the CEO of Omnicane and the chairperson of Omnicane Thermal Energy Operations (La Baraque) Limited and Omnicane Thermal Energy Operations (St. Aubin) Limited. He has served as president of the Mauritius Sugar Syndicate and as president of the Mauritius Sugar Producers’ Association.
christopher thomasNon-Executive DirectorChris qualified as a chartered accountant in 1969. In 1973 he joined Breakmate, a vending business, which was admitted to Unlisted Securities Market in 1984. He joined the Napier Brown Foods Group in 1992 as Group Finance Director and was involved in the day to day operations of the Group before becoming Chief Executive Officer of Napier Brown Foods.
Board of Directors
Annual Report and Accounts for the year ended 31 March 201620
ouR GoveRnAnce
24831-02 - RGF AR 2016 2 August 2016 5:57 PM Proof 12
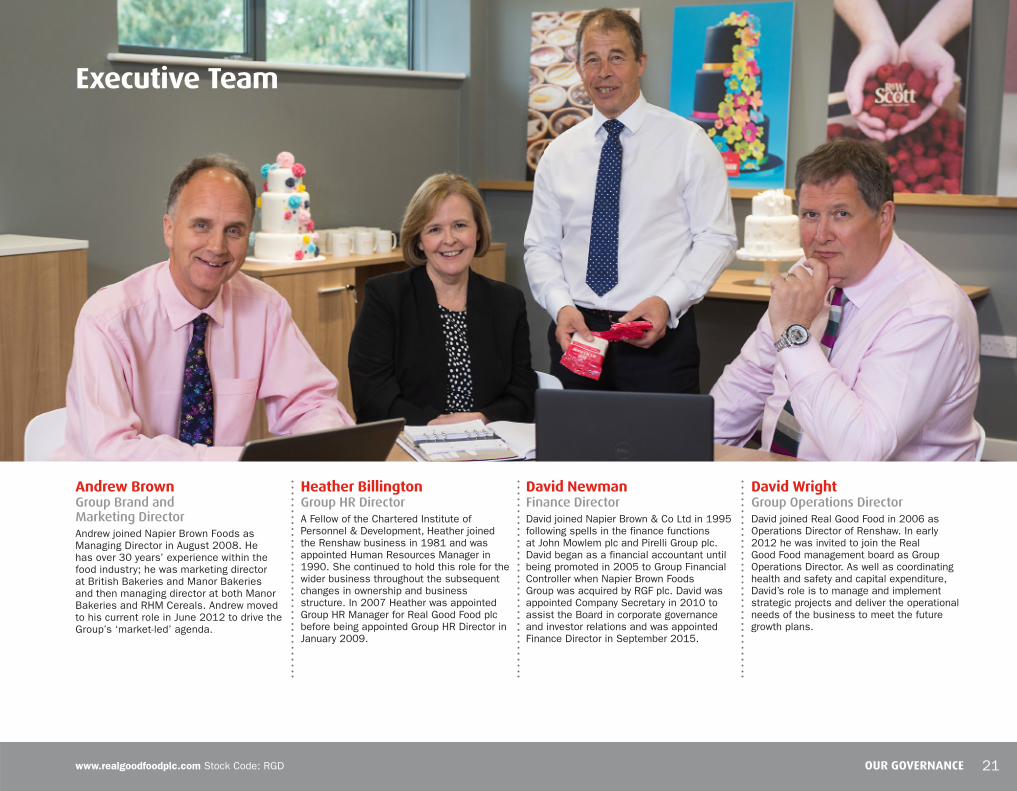
Andrew BrownGroup Brand and Marketing DirectorAndrew joined Napier Brown Foods as Managing Director in August 2008. He has over 30 years’ experience within the food industry; he was marketing director at British Bakeries and Manor Bakeries and then managing director at both Manor Bakeries and RHM Cereals. Andrew moved to his current role in June 2012 to drive the Group’s ‘market-led’ agenda.
Heather BillingtonGroup hR DirectorA Fellow of the Chartered Institute of Personnel & Development, Heather joined the Renshaw business in 1981 and was appointed Human Resources Manager in 1990. She continued to hold this role for the wider business throughout the subsequent changes in ownership and business structure. In 2007 Heather was appointed Group HR Manager for Real Good Food plc before being appointed Group HR Director in January 2009.
David newmanFinance DirectorDavid joined Napier Brown & Co Ltd in 1995 following spells in the finance functions at John Mowlem plc and Pirelli Group plc. David began as a financial accountant until being promoted in 2005 to Group Financial Controller when Napier Brown Foods Group was acquired by RGF plc. David was appointed Company Secretary in 2010 to assist the Board in corporate governance and investor relations and was appointed Finance Director in September 2015.
David WrightGroup Operations DirectorDavid joined Real Good Food in 2006 as Operations Director of Renshaw. In early 2012 he was invited to join the Real Good Food management board as Group Operations Director. As well as coordinating health and safety and capital expenditure, David’s role is to manage and implement strategic projects and deliver the operational needs of the business to meet the future growth plans.
executive team
www.realgoodfoodplc.com Stock Code: RGD 21ouR GoveRnAnce
24831-02 - RGF AR 2016 2 August 2016 5:57 PM Proof 12
Report of the DirectorsOUR GOVERNANCE
Annual Report and Accounts for the year ended 31 March 201622
Statement of Directors’ responsibilitiesThe statutory Directors are responsible for preparing the Strategic Report, the Report of the Directors, other information included in the Annual Report and the financial statements in accordance with applicable law and regulations.
Company law requires the Directors to prepare financial statements for each financial year. Under that law the statutory Directors have elected to prepare the financial statements in accordance with International Financial Reporting Standards (IFRSs) as adopted by the EU and applicable law.
Under company law the statutory Directors must not approve the financial statements unless they are satisfied that they give a true and fair view of the state of affairs of the Company and the Group and of the profit or loss of the Group for that period. In preparing these financial statements, the Directors are required to:
{ select suitable accounting policies and then apply them consistently;
{ make judgements and accounting estimates that are reasonable and prudent;
{ state whether applicable accounting standards have been followed, subject to any material departures disclosed and explained in the financial statements;
{ prepare the financial statements on the going concern basis unless it is inappropriate to presume that the Group will continue in business.
The Directors are responsible for keeping adequate accounting records that are sufficient to show and explain the Company and Group’s transactions and disclose with reasonable accuracy at any time the financial position of the Company and Group and enable them to ensure that the financial statements comply with the Companies Act 2006. They are also responsible for safeguarding the assets of the Company and Group and hence for taking reasonable steps for the prevention and detection of fraud and other irregularities.
They are further responsible for ensuring that the Strategic Report, the Report of the Directors and other information included in the Annual Report and financial statements is prepared in accordance with applicable law in the United Kingdom.
The maintenance and integrity of the Real Good Food plc website is the responsibility of the Directors; the work carried out by the auditor does not involve the consideration of these matters and, accordingly, the auditor accepts no responsibility for any changes that may have occurred in the accounts since they were initially presented on the website.
Legislation in the United Kingdom governing the preparation and dissemination of the accounts and the other information included in annual reports may differ from legislation in other jurisdictions.
Going concernThe Group’s business activities, together with the factors likely to affect its future development, performance and position, are set out in the Divisional Reviews on pages 8 to 13. The financial position of the Group, its cash flows and liquidity position are described in the Finance Review on pages 17 to 19. In addition, notes 23 and 25 to the financial statements include the Group’s objectives, policies and processes for managing its capital; its financial risk management objectives; details of its financial instruments and hedging activities;
and its exposure to credit risk and liquidity risk. As detailed in note 23 to the financial statements, the Group has a successful banking arrangement with Lloyds Bank plc and this, together with customer contracts and supplier agreements, enabled the Directors to believe that the Group is well placed to manage its business risks. Note that following the disposal of Napier Brown the Group’s outstanding loans were repaid in full, with Lloyds Bank plc remaining as the sole provider of clearing facilities and funding.
The Directors have a reasonable expectation that the Group has adequate resources to continue in operational existence for the foreseeable future. Thus they continue to adopt the going concern basis of accounting in preparing the financial statements.
provision of information to auditorEach person who is a Director at the time when this Report of the Directors is approved has confirmed that:
{ as far as that Director is aware, there is no relevant audit information of which the Group’s auditor is unaware
{ that Director has taken all the steps that ought to have been taken as Director in order to be aware of any information needed by the Group’s auditor in connection with preparing its report and to establish that the Group’s auditor is aware of that information.
The Directors present their report and audited financial statements for the 12 month period ended 31 March 2016.

24831-02 - RGF AR 2016 2 August 2016 5:57 PM Proof 12
Below: Chantilly white chocolate and raspberry bar gateau
www.realgoodfoodplc.com Stock Code: RGD 23OUR GOVERNANCE
Business review and future developmentsThese topics are covered in detail within the Chairman’s Statement, Divisional Reviews and Finance Reviews on pages 4 to 5 and 17 to 19 respectively.
Results and dividendsThe Group’s revenue from continuing operations for the 12 month period was £100,439k (2015 – £104,580k), yielding a gross profit of £26,670k (2015 – £25,561k) and an operating profit of £3,082k (2015 – £3,202k) from continuing operations before significant items.
The Group’s profit for the period after taxation was £12,820k (2015 – Loss £3,409k) with continuing operations before significant items, delivering a profit of £2,375k as compared with £1,046k last year.
The Directors do not recommend payment of a dividend in respect of the 12 months ended 31 March 2016 (2015 – £nil).
non-current assetsDetails of changes in non-current assets are given in notes 16, 17 and 18 to the financial statements.
principal continuing activitiesThe principal activity of the Group is that of a food manufacturing and distribution business. The Group trades through three operating divisions as follows:
Manufactures, sells and supplies cake decoration products and ingredients for the baking sector in the UK and abroad.
Sources, manufactures and supplies a range of food ingredients from bagged sugars and dairy powders to chocolate coatings and jams to food manufacturers, wholesalers and retailers.
Manufactures, sells and distributes added value bakery and dessert products to UK retailers and foodservice customers.

24831-02 - RGF AR 2016 2 August 2016 5:57 PM Proof 12
Report of the Directors (continued)OUR GOVERNANCE
Annual Report and Accounts for the year ended 31 March 201624
DirectorsOn 31 August 2015 M McDonough resigned from his position as Finance Director. On 15 September 2015 D P Newman was elected to the Board in the position of Finance Director.
The beneficial interests of the Directors in the ordinary share capital of the Company at the financial period end are set out below:
2016
31 March2016
31 March2015
P W Totté* 2,716,124 2,624,124P G Ridgwell† 22,502,354 22,502,354P C Salter 181,000 131,000C O Thomas 290,363 240,363D P Newman 24,225 24,225J d’Unienville — —
* 1,925,000 shares are held directly by Menton Investments Limited which is wholly owned by the Tulip Trust, a discretionary trust, of which P W Totté and certain members of his family are discretionary beneficiaries. In addition, shares are held by J M Finn Nominees Limited on behalf of Menton Investments Limited. P W Totté holds a further 791,124 shares directly.
† Napier Brown Ingredients Limited holds 22,139,998 shares which are controlled by a trust, of which P G Ridgwell is a trustee. P G Ridgwell holds a further 362,356 shares directly.
Details of the Directors’ share options are shown in note 12 to the financial statements.
Substantial interestsAt 31 March 2016 there were the following substantial interests (3% or more) in the Company’s ordinary share capital:
% Holdingin Ordinary
Share Capital
Napier Brown Ingredients Limited 31.8%Omnicane International Investors Limited 29.7%
Directors’ indemnitiesThe Company has paid £9,987 (2015 – £9,927) in respect of Directors’ and Officers’ Indemnity Insurance.
corporate governanceAs the Group is listed on AIM its is not required to apply a particular corporate governance code. However, the Board recognises the importance of good governance and has implemented corporate governance processes that are appropriate for a group of its size and resource constraints.
During the year the Group held an extraordinary general meeting in order to get approval from shareholders to cancel its share premium reserve and transfer the amount into distributable reserves. This proposal was approved and an application was then made to the courts to complete this process. This was approved by the courts on 4 May 2016. This will be reflected in the financial statements for the year ended 31 March 2017.
Financial instrumentsThe Group’s financial instruments comprise bank term loans and two revolving credit facilities, hire purchase and finance leases, cash and liquid resources and various items arising directly from its operations, such as trade receivables and trade payables. The main purpose of these financial instruments is to finance the Group’s operations.
The main risks arising from the Group’s financial instruments are interest rate risk and liquidity risk. The Group also has some currency exposure regarding its sugar trade but the majority of this risk is offset by purchasing and selling sugar in matching currencies. The Board reviews and agrees policies, which have remained substantially unchanged for the period under review, for managing these risks. Full details of the Group’s financial assets and liabilities are set out in note 23 to the financial statements.
liquidity riskShort term flexibility is available through existing bank facilities and the netting off of surplus funds.
employee involvementThe Group aims to improve the performance of the organisation through the development of its employees. Their involvement is encouraged by means of team working, team briefings, consultative committees and working parties.
Bonus schemes linked to profitability and personal objectives are in place for all senior managers and Directors.
Disabled employeesThe Group is committed to equality of employment and its policies reflect a disregard of factors such as disability in the selection and development of employees. The Group is involved in various initiatives which promote a positive understanding of disability and the integration of the disabled into the workforce.
charitable and political donationsDuring the current financial period the Group made charitable donations of £5,568 (2015 – £1,918). No political donations were made during the current or previous financial period.
Research and developmentDuring the period the Group incurred costs of £1,220k (2015 – £750k) in relation to research and development of new products. These costs included costs associated with development chefs, development technologists and materials consumed in product development.
This report was approved by the Board on 31 July 2016.
P W Totté Chairman
D P Newman Finance Director

24831-02 - RGF AR 2016 2 August 2016 5:57 PM Proof 12
Audit committee ReportThe Audit Committee comprises P C Salter (Chairman) and C O Thomas and meets formally twice per year with the auditor in relation to the annual and interim accounts. Its brief is to monitor the integrity of the financial statements of the Group as audited, to consider and agree any significant financial judgements contained in them and to review all formal reporting announcements relating to the Group’s financial performance.
In addition, the Committee regularly reviews the Group’s finance function with particular reference to internal financial controls and risk management and reporting systems. It also ensures appropriate procedures are in place such as for bribery and whistleblowing. As the external auditor provides other services in addition to the Group’s audit (as detailed in note 7), the Committee also annually reviews the independence and objectivity of the auditor and the effectiveness of the audit. The Committee Chairman maintains a close dialogue with the auditor throughout the year to keep him apprised of relevant events.
Remuneration committee ReportThe Remuneration Committee comprises P C Salter (Chairman) and P G Ridgwell, with C O Thomas being co-opted from time to time. It is responsible for setting and reviewing annually the remuneration packages of Executive Directors and senior managers within the Group. Packages are structured to attract, motivate and retain key personnel who have the capabilities, experience and ambition to drive forward and achieve the Group’s strategic aims.
The Remuneration Committee is responsible for ensuring that the mix of incentives reflects the Company’s needs, establishes an appropriate balance between fixed and variable remuneration, and is based on targets that are appropriately stretching, verifiable and relevant, and which take account of risk. This is achieved through a market related base salary, plus a range of benefits and an annual bonus scheme set to reward achievement of Group or divisional EBITDA targets, cash controls and personal objectives.
In addition, the Committee oversees the Group's share option schemes both of which closed for issue of new options during 2015/16. The Committee is currently reviewing possible future incentive schemes.
The Committee meets twice per year unless there are compelling reasons to meet more regularly. The Chairman works closely with the Group Human Resources Director in relation to all relevant matters, including the terms of compromise agreements which in turn are approved by the Committee. External intelligence is sourced as necessary regarding market salary levels and professional advice sought as required.
The remuneration of Non-Executive Directors is set by the Executive Directors.
AuditorThe auditor, Crowe Clark Whitehill LLP, will be proposed for reappointment in accordance with Section 489 of the Companies Act 2006.
This report was approved by the Board on 31 July 2016.
D P Newman Finance Director
Audit committee Report and Remuneration committee Report
Cake decorating class at Renshaw Academy
www.realgoodfoodplc.com Stock Code: RGD 25OUR GOVERNANCE
24831-02 - RGF AR 2016 2 August 2016 5:57 PM Proof 12
independent Auditor’s Reportto the shareholders of Real Good Food plc
OUR FINANCIALS
Annual Report and Accounts for the year ended 31 March 201626
We have audited the financial statements of Real Good Food Plc for the year ended 31 March 2016 which comprise the Consolidated Statement of Comprehensive Income, the Consolidated Statement of Financial Position, the Company Statement of Financial Position, the Consolidated Statement of Changes in Equity, the Company Statement of Changes in Equity, the Consolidated Statement of Cash Flows, the Company Statement of Cash Flows Statements, the Group and Parent Company Statement of Changes in Equity and the related notes numbered 1 to 34.
The financial reporting framework that has been applied in their preparation is applicable law and International Financial Reporting Standards (IFRSs) as adopted by the European Union and, as regards the parent company financial statements, as applied in accordance with the provisions of the Companies Act 2006.
This report is made solely to the company’s shareholders, as a body, in accordance with Chapter 3 of Part 16 of the Companies Act 2006. Our audit work has been undertaken so that we might state to the company’s shareholders those matters we are required to state to them in an auditor’s report and for no other purpose. To the fullest extent permitted by law, we do not accept or assume responsibility to anyone other than the company and the company’s shareholders as a body, for our audit work, for this report, or for the opinions we have formed.
Respective responsibilities of directors and auditorsAs explained more fully in the Statement of Directors’ Responsibilities, the directors are responsible for the preparation of the financial statements and for being satisfied that they give a true and fair view. Our responsibility is to audit and express an opinion on the financial statements in accordance with applicable law and International Standards on Auditing (UK and Ireland). Those standards require us to comply with the Auditing Practices Board’s Ethical Standards for Auditors.
Scope of the audit of the financial statementsAn audit involves obtaining evidence about the amounts and disclosures in the financial statements sufficient to give reasonable assurance that the financial statements are free from material misstatement, whether caused by fraud or error. This includes an assessment of: whether the accounting policies are appropriate to the company’s circumstances and have been consistently applied and adequately disclosed; the reasonableness of significant accounting estimates made by the directors; and the overall presentation of the financial statements.
In addition, we read all the financial and non-financial information in the Strategic Report, the Report of the Directors’ and any other surround information to identify material
inconsistencies with the audited financial statements and to identify any information that is apparently materially incorrect based on, or materially inconsistent with, the knowledge acquired by us in the course of performing the audit. If we become aware of any apparent material misstatements or inconsistencies we consider the implications for our report.
opinion on financial statementsIn our opinion:
{ the financial statements give a true and fair view of the state of the group’s and of the parent company’s affairs as at 31 March 2016 and of the group‘s profit for the year then ended;
{ the group financial statements have been properly prepared in accordance with IFRSs as adopted by the European Union;
{ the parent company financial statements have been properly prepared in accordance with IFRSs as adopted by the European Union as applied in accordance with the provisions of the Companies Act 2006; and
{ the financial statements have been prepared in accordance with the requirements of the Companies Act 2006.
opinion on other matter prescribed by the companies Act 2006In our opinion the information given in the Strategic Report and the Report of the Directors for the financial year for which the financial statements are prepared is consistent with the financial statements.
Matters on which we are required to report by exceptionWe have nothing to report in respect of the following matters where the Companies Act 2006 requires us to report to you if, in our opinion:
{ adequate accounting records have not been kept by the parent company, or returns adequate for our audit have not been received from branches not visited by us; or
{ the parent company financial statements are not in agreement with the accounting records and returns; or
{ certain disclosures of directors’ remuneration specified by law are not made; or
{ we have not received all the information and explanations we require for our audit.
Keith Newman Senior Statutory AuditorFor and on behalf ofCrowe Clark Whitehill LLPStatutory AuditorMaidstone31 July 2016

24831-02 - RGF AR 2016 2 August 2016 5:57 PM Proof 12
consolidated Statement of comprehensive incomeyear ended 31 March 2016
The notes on pages 34 to 82 form part of these financial statements.
Notes
Year ended 31 March 2016 Year ended 31 March 2015
Continuing Operations
£’000s
Discontinued Operations
£’000sTotal
£’000s
Continuing Operations
£’000s
Discontinued Operations
£’000sTotal
£’000s
REVENUE 4 100,439 13,237 113,676 104,580 128,288 232,868
Cost of sales (73,769) (11,884) (85,653) (79,019) (117,924) (196,943)
GROSS PROFIT 26,670 1,353 28,023 25,561 10,364 35,925
Distribution costs (5,367) (1,149) (6,516) (5,572) (9,938) (15,510)
Administration expenses (18,221) (288) (18,509) (16,787) (4,369) (21,156)
Significant items 6 (945) — (945) (522) (328) (850)
OPERATING PROFIT/(LOSS) 8 2,137 (84) 2,053 2,680 (4,271) (1,591)
Fair value gain on contingent consideration 3,267 — 3,267 — — —
Finance income 9 — — — — — —
Finance costs 10 (478) (906) (1,384) (866) (845) (1,711)
Other finance costs 11 (191) — (191) (235) — (235)
Profit on disposal of discontinued operations — 9,145 9,145 — — —
PROFIT/(LOSS) BEFORE TAXATION 4,735 8,155 12,890 1,579 (5,116) (3,537)
Income tax (expense)/credit 14 (439) — (439) (1,055) 1,005 (50)
Tax on discontinued business — 256 256 — — —
Income tax on significant items 14 113 — 113 110 68 178PROFIT/(LOSS) ATTRIBUTABLE TO THE EQUITY HOLDERS OF THE PARENT 4,409 8,411 12,820 634 (4,043) (3,409)
OTHER COMPREHENSIVE LOSS
Items that will not be reclassified to profit or loss
Actuarial (losses)/gains on defined benefit plan (484) — (484) (2,237) — (2,237)
Income tax relating to components of other comprehensive loss 35 — 35 447 — 447
OTHER COMPREHENSIVE LOSS (449) — (449) (1,790) — (1,790)TOTAL COMPREHENSIVE INCOME/(LOSS)FOR THE YEAR ATTRIBUTABLE TO THE EQUITY HOLDERS OF THE PARENT 3,960 8,411 12,371 (1,156) (4,043) (5,199)
Earnings per share
– basic 15 6.31p 12.05p 18.36p 0.91p (5.81)p (4.90)p
– diluted 5.83p 11.13p 16.96p 0.85p (5.81)p (4.90)p
www.realgoodfoodplc.com Stock Code: RGD 27OUR FINANCIALS

24831-02 - RGF AR 2016 2 August 2016 5:57 PM Proof 12
consolidated Statement of changes in equityyear ended 31 March 2016
IssuedShare
Capital£’000s
SharePremiumAccount£’000s
ShareOption
Reserve£’000s
RetainedEarnings£’000s
Total£’000s
Balance as at 31 March 2014 1,389 71,244 504 13,877 87,014Total comprehensive income for the yearLoss for the year — — — (3,409) (3,409)Other comprehensive income for the year — — — (1,790) (1,790)Total comprehensive income for the year — — — (5,199) (5,199)
Transactions with owners of the Group, recognised directly in equityContributions by and distribution to owners of the GroupShares issued in the year 3 28 — — 31Share based payment expense — — 47 — 47Deferred tax on share options — — 26 — 26Total contributions by and distributions to owners of the Group 3 28 73 — 104Balance as at 31 March 2015 1,392 71,272 577 8,678 81,919Total comprehensive income for the yearProfit for the year — — — 12,820 12,820Other comprehensive income for the year — — — (449) (449)Total comprehensive income for the year — — — 12,371 12,371
Transactions with owners of the Group, recognised directly in equityContributions by and distribution to owners of the GroupShares issued in the year 10 103 — — 113Share based payment expense — — 15 — 15Deferred tax on share options — — — — —Total contributions by and distributions to owners of the Group 10 103 15 — 128Balance as at 31 March 2016 1,402 71,375 592 21,049 94,418
OUR FINANCIALS
Annual Report and Accounts for the year ended 31 March 201628

24831-02 - RGF AR 2016 2 August 2016 5:57 PM Proof 12
company Statement of changes in equityyear ended 31 March 2016
The notes on pages 34 to 82 form part of these financial statements.
IssuedShare
Capital£’000s
SharePremiumAccount£’000s
ShareOption
Reserve£’000s
RetainedEarnings£’000s
Total£’000s
Balance at 31 March 2014 1,389 71,244 504 (13,689) 59,448 Total comprehensive income for the yearLoss for the year (as restated) — — — (1,974) (1,974)Other comprehensive income for the year — — — — —Total comprehensive income for the year — — — (1,974) (1,974)
Transactions with owners of the Company, recognised directly in equityContributions by and distributions to owners of the GroupShares issued in the year 3 28 — — 31 Share based payment expenses — — 47 — 47 Deferred tax on share options — — 26 — 26
Total contributions by and distributions to owners of the Company 3 28 73 — 104Balance at 31 March 2015 (as restated) 1,392 71,272 577 15,663 57,578
Balance at 31 March 2015 (as previously stated) 1,392 71,272 577 (17,163) 56,078Prior year adjustment (note 27) — — — 1,500 1,500Balance at 31 March 2015 (as restated) 1,392 71,272 577 (15,663) 57,578
Total comprehensive income for the yearProfit for the year — — — 6,004 6,004Other comprehensive income for the year — — — (449) (449)Total comprehensive income for the year — — — 5,555 5,555
Transactions with owners of the Company, recognised directly in equityContributions by and distributions to owners of the GroupShares issued in the year 10 103 — — 113Share based payment expenses — — 15 — 15Deferred tax on share options — — — — —Total contributions by and distributions to owners of the Company 10 103 15 — 128Balance at 31 March 2016 1,402 71,375 592 (10,108) 63,261
www.realgoodfoodplc.com Stock Code: RGD 29OUR FINANCIALS

24831-02 - RGF AR 2016 2 August 2016 5:57 PM Proof 12
consolidated Statement of Financial positionyear ended 31 March 2016
These financial statements were approved by the Board of Directors and authorised for issue on 31 July 2016.They were signed on its behalf by:P W Totté Executive Chairman
D P Newman Director
The notes on pages 34 to 82 form part of these financial statements.
Notes
31 March2016
£’000s
31 March2015
£’000s
NON-CURRENT ASSETSGoodwill 16 71,005 70,019Other intangible assets 17 834 841Property, plant and equipment 18 18,066 13,599Deferred tax asset 20 1,556 1,866
91,461 86,325CURRENT ASSETSInventories 21 12,360 10,328Trade and other receivables 22 17,039 15,229Assets relating to discontinued business 32 — 41,406Current tax assets — —Cash and cash equivalents 2,946 6,687
32,345 73,650TOTAL ASSETS 123,806 159,975CURRENT LIABILITIESBank overdrafts 949 51Trade and other payables 24 13,243 18,000Borrowings 23 7,008 17,190Liabilities relating to discontinued business 32 — 27,300Current tax liabilities 127 613
21,327 63,154NON-CURRENT LIABILITIES Borrowings 23 55 6,677Deferred tax liabilities 20 1,925 2,537Retirement benefit obligation 31 6,081 5,688
8,061 14,902TOTAL LIABILITIES 29,388 78,056NET ASSETS 94,418 81,919EQUITYShare capital 26 1,402 1,392Share premium account 27 71,375 71,272Share option reserve 27 592 577Retained earnings 27 21,049 8,678TOTAL EQUITY 94,418 81,919
OUR FINANCIALS
Annual Report and Accounts for the year ended 31 March 201630

24831-02 - RGF AR 2016 2 August 2016 5:57 PM Proof 12
company Statement of Financial positionyear ended 31 March 2016
These financial statements were approved by the Board of Directors and authorised for issue on 31 July 2016.
They were signed on its behalf by:
P W Totté Chairman
D P Newman Director
The notes on pages 34 to 82 form part of these financial statements.
Notes
31 March2016
£’000s
31 March2015
£’000s restated
NON-CURRENT ASSETSInvestments 19 65,499 57,892Property, plant and equipment 18 3,204 77Deferred tax asset 20 1,478 327Trade and other receivables 22 — 44,776
70,181 103,072CURRENT ASSETSTrade and other receivables 22 55,798 2,100Current tax asset 705Cash and cash equivalents — 3,167
56,503 5,267TOTAL ASSETS 126,684 108,339CURRENT LIABILITIESBank overdraft 949 —Trade and other payables 24 56,377 675Borrowings 23 — 1,541
57,326 2,216
NON-CURRENT LIABILITIES Trade and other payables 24 — 44,866Retirement benefit obligation 6,081 —Deferred tax liability 20 16 —Borrowings 23 — 3,679
6,097 48,545
TOTAL LIABILITIES 63,423 50,761
NET ASSETS 63,261 57,578
EQUITYShare capital 26 1,402 1,392Share premium account 27 71,375 71,272Share option reserve 27 592 577Retained earnings 27 (10,108) (15,663)TOTAL EQUITY 63,261 57,578
www.realgoodfoodplc.com Stock Code: RGD 31OUR FINANCIALS
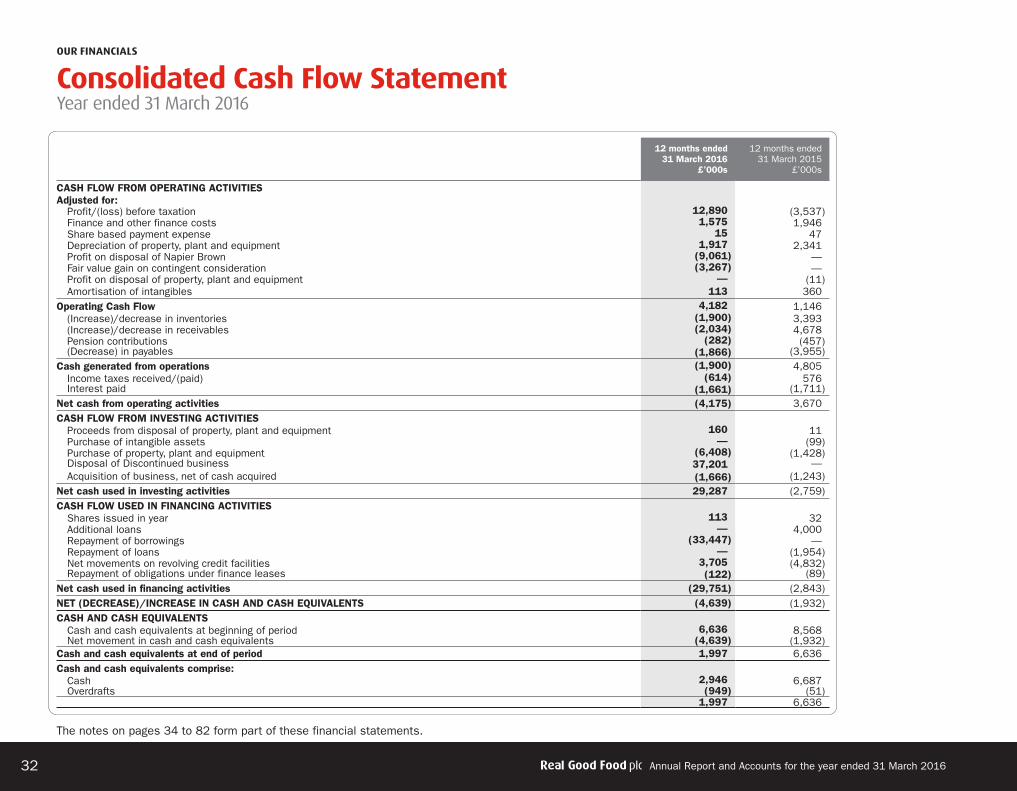
24831-02 - RGF AR 2016 2 August 2016 5:57 PM Proof 12
consolidated cash Flow Statementyear ended 31 March 2016
The notes on pages 34 to 82 form part of these financial statements.
12 months ended31 March 2016
£’000s
12 months ended31 March 2015
£’000s
CASH FLOW FROM OPERATING ACTIVITIESAdjusted for: Profit/(loss) before taxation 12,890 (3,537) Finance and other finance costs 1,575 1,946 Share based payment expense 15 47 Depreciation of property, plant and equipment 1,917 2,341 Profit on disposal of Napier Brown (9,061) — Fair value gain on contingent consideration (3,267) — Profit on disposal of property, plant and equipment — (11) Amortisation of intangibles 113 360Operating Cash Flow 4,182 1,146 (Increase)/decrease in inventories (1,900) 3,393 (Increase)/decrease in receivables (2,034) 4,678 Pension contributions (282) (457) (Decrease) in payables (1,866) (3,955)Cash generated from operations (1,900) 4,805 Income taxes received/(paid) (614) 576 Interest paid (1,661) (1,711)Net cash from operating activities (4,175) 3,670CASH FLOW FROM INVESTING ACTIVITIES Proceeds from disposal of property, plant and equipment 160 11 Purchase of intangible assets — (99) Purchase of property, plant and equipment (6,408) (1,428) Disposal of Discontinued business 37,201 — Acquisition of business, net of cash acquired (1,666) (1,243)Net cash used in investing activities 29,287 (2,759)CASH FLOW USED IN FINANCING ACTIVITIES Shares issued in year 113 32 Additional loans — 4,000 Repayment of borrowings (33,447) — Repayment of loans — (1,954) Net movements on revolving credit facilities 3,705 (4,832) Repayment of obligations under finance leases (122) (89)Net cash used in financing activities (29,751) (2,843)NET (DECREASE)/INCREASE IN CASH AND CASH EQUIVALENTS (4,639) (1,932)CASH AND CASH EQUIVALENTS Cash and cash equivalents at beginning of period 6,636 8,568 Net movement in cash and cash equivalents (4,639) (1,932)Cash and cash equivalents at end of period 1,997 6,636Cash and cash equivalents comprise: Cash 2,946 6,687 Overdrafts (949) (51)
1,997 6,636
OUR FINANCIALS
Annual Report and Accounts for the year ended 31 March 201632

24831-02 - RGF AR 2016 2 August 2016 5:57 PM Proof 12
company cash Flow Statementyear ended 31 March 2016
The notes on pages 34 to 82 form part of these financial statements.
12 months ended
31 March2016
£’000s
12 monthsended
31 March2015
£’000s
CASH FLOW FROM OPERATING ACTIVITIESAdjusted for:
Loss before taxation (3,726) (3,480)Finance costs 118 235Share based payment expense 15 47Pension finance costs 191
Depreciation of property, plant and equipment 26 49Operating Cash Flow (3,376) (3,149)
(Increase)/decrease in receivables 490 694Pension contributions (282)Increase in payables 7,430 7,597
Cash generated from operations 4,262 5,142Interest paid (118) (235)Income taxes received/(paid) — —
Net Cash from operating activities 4,144 4,907CASH FLOW FROM INVESTING ACTIVITIES
Investment — —Purchase of property, plant and equipment (3,153) (3)
Net cash used in investing activities (3,153) (3)CASH FLOW USED IN FINANCING ACTIVITIES
Shares issued in period 113 32Additional borrowings — —Repayment of borrowings (5,220) (1,954)
Net cash used in financing activities (5,107) (1,922)Net increase in cash and cash equivalents (4,116) 2,982CASH AND CASH EQUIVALENTS
Cash and cash equivalents at beginning of period 3,167 185Net movement in cash and cash equivalents (4,116) 2,982
Cash and cash equivalents at end of period (949) 3,167Cash and cash equivalents comprise:
Cash — 3,167Overdrafts (949) —
(949) 3,167
www.realgoodfoodplc.com Stock Code: RGD 33OUR FINANCIALS

24831-02 - RGF AR 2016 2 August 2016 5:57 PM Proof 12
notes to the Financial Statementsyear ended 31 March 2016
1. presentation of financial statementsGeneral informationReal Good Food plc is a public limited company incorporated in England and Wales under the Companies Act (registered number 4666282). The Company is domiciled in England and Wales and its registered address is International House, 1 St Katharine’s Way, London, E1W 1XB. The Company’s shares are traded on the Alternative Investment Market (AIM).
The principal activities of the Group are the sourcing, manufacture and distribution of food to the retail and industrial sectors.
Basis of preparationThese consolidated financial statements are presented on the basis of International Financial Reporting Standards (IFRS) as adopted by the European Union and have been prepared in accordance with AIM rules and the Companies Act 2006, as applicable to companies reporting under IFRS.
These consolidated financial statements have been prepared in accordance with the accounting policies set out in note 2 and under the historical cost convention, except where modified by the revaluation of certain financial instruments and commodities.
Discontinued operationsA discontinued operation is a component of the Group’s business that represents a separate major line of business or geographical area of operations that has been disposed of or is held for sale, or is a subsidiary acquired exclusively with a view to resale. Classification of a discontinued operation occurs upon disposal or when the operation meets the criteria to be classified as held for sale, if earlier. When an operation is classified as a discontinued operation, the comparative income statement is presented as if the operation had discontinued from the start of the comparative period. The disposal of the Napier Division, as described in note 32, gives rise to a discontinued operation.
New IFRS standards and interpretations adoptedA number of new standards and amendments to standards and interpretations have been issued but are not yet effective and in some cases have not yet been adopted by the EU.
The Directors are still assessing whether the application of IFRS 9, IFRS 15 and IFRS 16, once effective, will have a material impact on the results of the group. Application of these standards may result in changes in presentation of information within the Group’s financial statements.
2. Significant accounting policiesThe following accounting policies have been applied consistently in dealing with items which are considered material in relation to the Group’s financial statements.
a) Basis of accountingThe financial statements have been prepared in accordance with applicable accounting standards.
The Group’s business activities, together with the factors likely to affect its future development, performance and position, are set out in the Divisional Reviews on pages 8 to 13. The financial position of the Group, its cash flows and liquidity position are described in the Finance Review on pages 17 to 19. In addition, note 23 to the financial statements includes the Group’s objectives, policies and processes for managing its capital; its financial risk management objectives; details of its financial instruments and hedging activities; and its exposure to credit risk and liquidity risk.
Also as detailed in note 23 to the financial statements, the Group repaid its borrowings with PNC Business Credit facility in full from the proceeds arising from, the disposal of Napier Brown Sugar Limited. The Group has a long term banking arrangement with Lloyds Bank Plc and this, together with customer contracts and supplier agreements, enables the Directors to believe that the Group is well placed to manage its business risks.
OUR FINANCIALS
Annual Report and Accounts for the year ended 31 March 201634

24831-02 - RGF AR 2016 2 August 2016 5:57 PM Proof 12
2. Significant accounting policies (continued)The Directors have a reasonable expectation that the Group has adequate resources to continue in operational existence for the foreseeable future. Thus they continue to adopt the going concern basis of accounting in preparing the annual financial statements.
b) Basis of consolidationThe Group financial statements consolidate the financial statements of the Company and its subsidiary undertakings. The purchase method of accounting has been adopted. Under this method the results of all the subsidiary undertakings are included in the Consolidated Statement of Comprehensive Income from the date of acquisition or up to the date of disposal. Intra-group revenues and profits are eliminated on consolidation and all revenue and profit figures relate to external transactions only.
Under Section 408 of the Companies Act 2006 the Company is exempt from the requirement to present its own income statement. The profit for the financial period, of the holding company, as approved by the Board, was £6,004k (2015 – loss £1,974k).
c) GoodwillGoodwill is calculated as the difference between the fair value of the consideration exchanged, and the net fair value of the identifiable assets and liabilities acquired and is capitalised. Goodwill is tested for impairment annually and whenever there is an indication of impairment. Goodwill is carried at cost less accumulated impairment losses.
When the acquired interest in the net fair value of the identifiable assets and liabilities exceeds the cost of the business combination, the excess is recognised immediately in the income statement.
Gains and losses on the disposal of a business combination include the carrying amount of goodwill relating to the entity sold.
d) Revenue recognitionRevenue comprises the invoiced value of goods and services supplied by the Group, exclusive of Value Added Tax and trade discounts. Revenue is recognised at the point or points at which the Group has performed its obligations in connection with the contractual terms of the revenue agreement, and in exchange obtains the right to consideration.
(a) Sales of Goods: Sales of Goods are recognised when goods are delivered and title passed net of discounts, Value Added Tax (VAT) and other sales related taxes.
(b) Finance Income: Interest income is accrued on a time basis, by reference to the principal outstanding and at the effective interest rate applicable. Other finance costs includes net interest costs on the net defined benefit pension scheme liabilities.
(c) Rebates and discounts: all discounts, rebates etc are accounted for in line with contractual commitments and netted off gross sales to reflect the net income earned any costs incurred in promotional activity are expensed within commercial overheads. In all cases these accounts will reflect the net position after any contractual discounts and rebates along with any promotional costs. Full accruals are made for any unpaid elements.
e) Income taxThe charge for taxation is based on the results for the year and takes into account taxation deferred because of timing differences between the treatment of certain items for taxation and accounting purposes.
Deferred tax is recognised on temporary differences arising between the tax basis of assets and liabilities and their carrying amounts.
The carrying amount of deferred tax assets is reviewed at each balance sheet date and is reduced to the extent that it is no longer probable that sufficient taxable profits will be available to allow all or part of the assets to be recovered.
Deferred tax is calculated at the tax rates that have been enacted or substantially enacted by the balance sheet date. Deferred tax is charged or credited to the Statement of Comprehensive Income, except where it relates to items charged or credited directly to equity, in which case the deferred tax is also dealt with in equity.
Deferred tax assets and liabilities are offset when there is a legally enforceable right to set off current tax assets against current tax liabilities, and when they relate to income taxes levied by the same taxation authority, and the Group intends to settle its current tax assets and liabilities on a net basis.
www.realgoodfoodplc.com Stock Code: RGD 35OUR FINANCIALS

24831-02 - RGF AR 2016 2 August 2016 5:57 PM Proof 12
notes to the Financial Statements (continued)year ended 31 March 2016
2. Significant accounting policies (continued) f) Significant itemsIt is the Group’s policy to show items that it considers are of a significant nature separately on the face of the Statement of Comprehensive Income in order to assist the reader to understand the accounts. The Group defines the term ‘significant’ as items that are material in respect of their size and/or nature, at a segment reporting level, for example, a major restructuring of the management of that segment. The Group believes that by identifying these items separately as significant it enhances the understanding of the true performance of the segment trading position. Summary details of significant items are shown in note 6 to these accounts.
g) Pension costsThe Group operates a defined contribution and a defined benefit pension scheme. Payments to the defined contribution scheme are charged as an expense as they fall due. For the defined benefit scheme the cost of providing benefits is determined using the Projected Unit Credit Method, with actuarial valuations being carried out at each balance sheet date.
Actuarial gains and losses are recognised in full in the period in which they occur. Further details are given in note 31 to the financial statements.
h) Property, plant and equipmentProperty, plant and equipment is stated at historical cost or fair value at the date of acquisition, less accumulated depreciation and impairment provisions.
Depreciation is provided to write off the cost, less the estimated residual value, of property, plant and equipment by equal instalments over their estimated useful economic lives as follows:
Freehold buildings 2% – 2.5%Short term leasehold buildings Length of leasePlant and equipment 7.5% – 50%Motor vehicles 25%Fixtures and fittings 7.5% – 25%Computer equipment 25%
Impairment reviews of property, plant and equipment are undertaken if there are indications that the carrying values may not be recoverable or that the recoverable amounts may be less than the asset’s carrying value.
Assets in the course of construction relate to plant and equipment in the process of construction, which were not complete, and hence were not in use at the year end. Assets in the course of construction are not depreciated until they are completed and available for use.
i) Intangible assetsIntangible assets consist of computer software that is considered to have an economic life of five years and business relationships which are considered to have an estimated useful economic life of two years and the assets are amortised on a straight-line basis over these periods. The average remaining life of intangible assets is three years (2015 – three years). The charge for the year is included in administration expenses within the Statement of Comprehensive Income.
j) LeasesWhere a lease is entered into which entails taking substantially all the risks and rewards of ownership of an asset, the lease is treated as a finance lease. The asset is recorded in the Statement of Financial Position as an item of property, plant and equipment and is depreciated over the shorter of its estimated useful life or the term of the lease. Future instalments under such leases, net of finance charges, are included within borrowings. Rentals payable are apportioned between the finance element, which is charged to the profit or loss, and the capital element, which reduces the outstanding obligation for future instalments.
All other leases are treated as operating leases and the rentals payable are charged on a straight-line basis to the profit or loss over the lease term.
k) InvestmentsInvestments in the company accounts relate to investments in subsidiaries and are stated at cost less provision for any impairment in value.
l) InventoriesInventories are stated at the lower of cost and net realisable value after making due allowance for obsolete and slow-moving inventory. Cost includes all direct costs and an appropriate proportion of fixed and variable overheads. Cost is calculated using the standard cost or weighted average cost methods, appropriate to the materials and production processes involved. Net realisable value is based upon estimated selling price allowing for all further costs of completion and disposal.
OUR FINANCIALS
Annual Report and Accounts for the year ended 31 March 201636

24831-02 - RGF AR 2016 2 August 2016 5:57 PM Proof 12
2. Significant accounting policies (continued)m) Derivative financial instrumentsThe Group uses derivative financial instruments to reduce exposure to commodity price and foreign exchange rate movements. The Group does not hold or issue derivative financial instruments for speculative purposes.
Derivative financial instruments are held by the Group as assets or liabilities on the Statement of Financial Position measured at the fair values at the year end date. Changes in the value of derivative financial instruments arising from fair value hedges are recognised in the income statement.
For a hedging relationship to qualify for hedge accounting it must be documented at inception and it must be highly effective in offsetting the changes in cash flows or fair value attributed to the hedged risk.
n) Cash and cash equivalentsCash and cash equivalents on the Statement of Financial Position consist of cash in hand and at the bank. Cash and cash equivalents recognised in the Cash Flow Statement include cash in hand and at the bank, and bank overdrafts which are payable on demand. Deposits are only included within cash and cash equivalents when they have a short maturity of three months or less at the date of acquisition.
o) Trade receivablesTrade receivables are recognised initially at fair value and subsequently measured at amortised cost using the effective interest method, less provision for impairment.
p) Trade payablesTrade payables are recognised initially at fair value and are subsequently measured at amortised cost using the effective interest method.
q) Bank borrowingsInterest bearing bank loans and overdrafts are recorded as the proceeds received net of direct issue costs and are valued at amortised cost.
r) Foreign currenciesThe consolidated financial statements are presented in sterling which is the Group’s functional and presentation currency.
Transactions in foreign currencies are recorded at the rate of exchange at the date of the transaction. Monetary assets and liabilities denominated in foreign currencies at the balance sheet date are reported at the rates of exchange prevailing at that date.
All foreign exchange gains and losses are presented in the Statement of Comprehensive Income within the administration expense heading.
s) Intangible assetsIFRS 3 (revised) “Business Combinations” requires that goodwill arising on the acquisition of subsidiaries is capitalised and included in intangible assets. IFRS 3 (revised) also requires the identification of other intangible assets at acquisition. The assumptions involved in valuing these intangible assets require the use of estimates and judgements which differ from the actual outcome. These estimates and judgements cover future growth rates, expected inflation rates and the discount rate used.
t) Contingent considerationDetermining the value of contingent consideration recognised as part of the acquisition of subsidiaries requires assumptions to determine the expected performance of the acquired business and the amount of contingent consideration that will therefore become payable. Initial estimates of expected performance are made by Directors responsible for completing the acquisition and form a key component of the financial due diligence that takes place prior to completion. Subsequent measurement of contingent consideration is based on the Directors’ fair value appraisal of the acquired business’s performance in the post-acquisition period with any required adjustments to the amount payable recognised in the Consolidated Income Statement as required under IFRS 3.
u) Business combinations and goodwillBusiness combinations are accounted for using the acquisition method as at the acquisition date, which is the date on which control is transferred to the Group. The Group measures goodwill at the acquisition date as:
{ the fair value of the consideration transferred; plus
{ the recognised amount of any non-controlling interests in the acquiree; plus
{ the fair value of the existing equity interest; less
{ the net recognised amount (generally fair value) of the identifiable assets acquired and liabilities assumed.
www.realgoodfoodplc.com Stock Code: RGD 37OUR FINANCIALS

24831-02 - RGF AR 2016 2 August 2016 5:57 PM Proof 12
notes to the Financial Statements (continued)year ended 31 March 2016
2. Significant accounting policies (continued)Costs related to the acquisition, other than those associated with the issue of debt or equity securities, are expensed as incurred. Any contingent purchase consideration payable is recognised at fair value at the acquisition date. If the contingent purchase consideration is classified as equity, it is not re-measured and settlement is accounted for within equity. Otherwise, subsequent changes to the fair value of the contingent purchase consideration are recognised in the Consolidated Income Statement.
3. critical accounting estimates and judgementsIn order to prepare these consolidated financial statements in accordance with the accounting policies set out in note 2 management have used estimates and judgements to establish the amounts at which certain items are recorded. Critical accounting estimates and judgements are those that have the greatest impact on the financial statements and require the most difficult, subjective and complex judgements about matters that are inherently uncertain. Estimates are based on factors including historical experience and expectations of future events that management believe to be reasonable. However, given the judgemental nature of such estimates, actual results could be different due to the assumptions used. The critical accounting estimates are set out below.
a) Impairment of goodwillAn impairment of goodwill has the potential to significantly impact upon the Group’s Statement of Comprehensive Income for the period. In order to determine whether impairments are required the Directors estimate the recoverable amount of the goodwill. This calculation is based on the Group’s cash flow forecasts for the following financial year extrapolated over a rolling 19 year period assuming a zero growth rate. A discount factor, based upon the Group’s weighted average cost of capital, is applied to obtain a current value (‘value in use’). The fair value less costs to sell of the cash generating unit is used if this results in an amount in excess of value in use.
Estimated future cash flows for impairment calculations are based on management’s expectations of future volumes and margins based on plans and best estimates of the productivity of the income generating units in their current condition. Future cash flows therefore exclude benefits from major expansion projects requiring future capital expenditure.
Future cash flows are discounted using a discount rate based on the Group’s weighted average cost of capital. The weighted average cost of capital is impacted by estimates of interest rates, equity returns and market related risks. The Group’s weighted average cost of capital is reviewed on an annual basis.
Further details are set out in note 16.
b) Retirement benefitsThe Company sponsors the Napier Brown Foods Retirement Benefits Plan which is a funded defined benefit arrangement. The amounts recorded in the financial statements for this type of scheme are based on a number of assumptions, changes to which could have a material impact on the reported amounts.
Any net deficit or surplus arising on the defined benefit plan is shown in the Statement of Financial Position. The amount recorded is the difference between plan assets and liabilities at the Statement of Financial Position date. Plan assets are based on market value at that date. Plan liabilities are based on actuarial estimates of the present value of future pension or other benefits that will be payable to members.
The most sensitive assumptions involved in calculating the expected liabilities are mortality rates and the discount rate used to calculate the present value. If the mortality rate assumption changed, a one year increase to longevity would increase the liability by 4%. Changes to the discount rate of 0.5% would result in a change in the scheme liabilities of 7.0% and a 0.5% movement in the rate of inflation would change the liabilities of the scheme by 2.0%.
OUR FINANCIALS
Annual Report and Accounts for the year ended 31 March 201638

24831-02 - RGF AR 2016 2 August 2016 5:57 PM Proof 12
3. critical accounting estimates and judgements (continued)The Statement of Comprehensive Income generally comprises a regular charge to operating profit for the current and past service cost. Past service costs represent the change in the present value of the benefits obligation that arises from benefit charges that are applied retrospectively to prior year benefits that have accrued. Past service costs are charged in full in the year when the changes to benefits are made and a finance charge, which represents the net of expected income from plan assets and an interest charge on plan liabilities. These calculations are based on expected outcomes at the start of the financial year. The Statement of Comprehensive Income is most sensitive to changes in expected returns from plan assets and the discount rate used to calculate the interest charge on plan liabilities. A 10% change in the assumption of the real discount rate would change the finance expense by approximately £0.07 million.
Full details of these assumptions, which are based on advice from the Group’s actuaries, are set out in note 31.
c) Significant itemsIn determining whether an item should be classified as a significant item the Board reviews the expenditure in question and assesses whether the expenditure meets the definition of a significant item as defined in the Group’s accounting policy (note 2). Items are only included within significant items if, following this review, the Board is satisfied that the expenditure meets with the definition set out in the accounting policy.
d) Business claimsIn common with comparable food groups, the Group is involved in a number of disputes in the ordinary course of business which may give rise to claims. Provision representing the cost of defending and concluding claims is made in the financial statements for all claims where costs are likely to be incurred. The Group carries a wide range of insurance cover and no separate disclosure is made of the detail of claims or the costs covered by insurance, as to do so could seriously prejudice the position of the Group.
4. RevenueThe revenue for the Group for the current year arose from the sale of goods in the following areas:
Cake Decoration Manufactures, sells and supplies cake decorating products and ingredients for the baking sector.
Food Ingredients Manufactures and supplies a range of food ingredients from bagged sugar and dairy powders to chocolate coatings and jams.
Premium Bakery The manufacture and supply of high quality ambient cakes and desserts to the retail and foodservice sectors.
www.realgoodfoodplc.com Stock Code: RGD 39OUR FINANCIALS
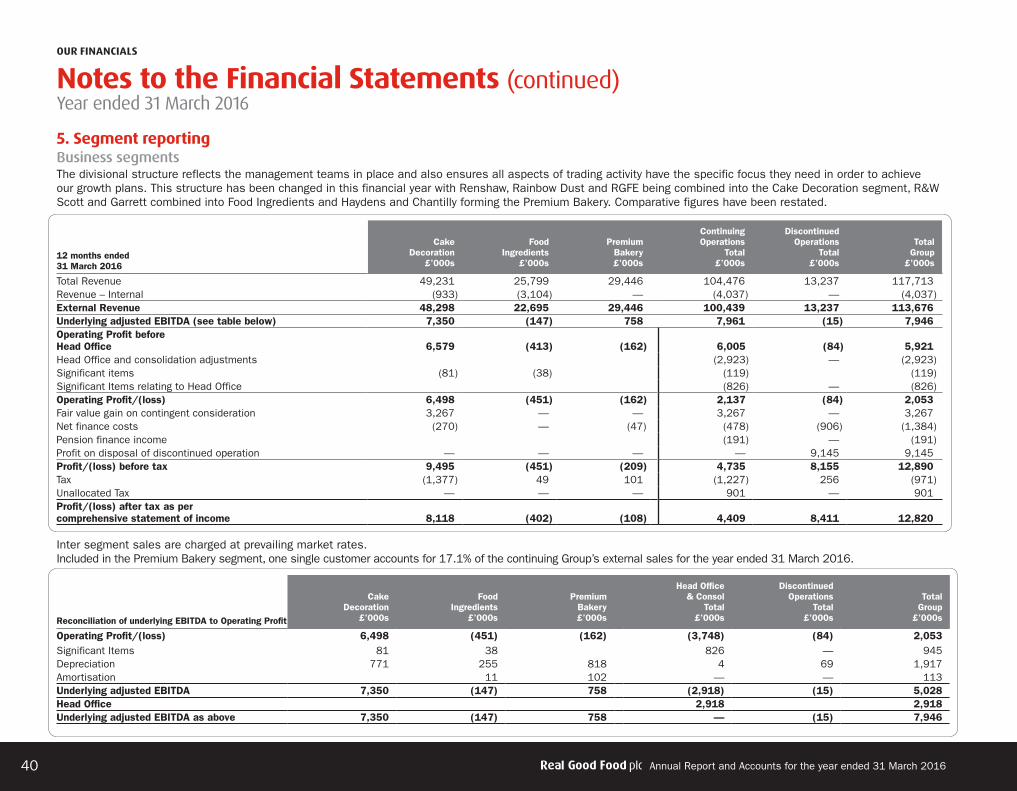
24831-02 - RGF AR 2016 2 August 2016 5:57 PM Proof 12
notes to the Financial Statements (continued)year ended 31 March 2016
5. Segment reportingBusiness segmentsThe divisional structure reflects the management teams in place and also ensures all aspects of trading activity have the specific focus they need in order to achieve our growth plans. This structure has been changed in this financial year with Renshaw, Rainbow Dust and RGFE being combined into the Cake Decoration segment, R&W Scott and Garrett combined into Food Ingredients and Haydens and Chantilly forming the Premium Bakery. Comparative figures have been restated.
Inter segment sales are charged at prevailing market rates. Included in the Premium Bakery segment, one single customer accounts for 17.1% of the continuing Group’s external sales for the year ended 31 March 2016.
12 months ended 31 March 2016
Cake Decoration
£’000s
FoodIngredients
£’000s
Premium Bakery£’000s
Continuing Operations
Total £’000s
Discontinued Operations
Total £’000s
Total Group
£’000s
Total Revenue 49,231 25,799 29,446 104,476 13,237 117,713Revenue – Internal (933) (3,104) — (4,037) — (4,037)External Revenue 48,298 22,695 29,446 100,439 13,237 113,676Underlying adjusted EBITDA (see table below) 7,350 (147) 758 7,961 (15) 7,946Operating Profit before Head Office 6,579 (413) (162) 6,005 (84) 5,921Head Office and consolidation adjustments (2,923) — (2,923)Significant items (81) (38) (119) (119)Significant Items relating to Head Office (826) — (826)Operating Profit/(loss) 6,498 (451) (162) 2,137 (84) 2,053Fair value gain on contingent consideration 3,267 — — 3,267 — 3,267Net finance costs (270) — (47) (478) (906) (1,384)Pension finance income (191) — (191)Profit on disposal of discontinued operation — — — — 9,145 9,145Profit/(loss) before tax 9,495 (451) (209) 4,735 8,155 12,890Tax (1,377) 49 101 (1,227) 256 (971)Unallocated Tax — — — 901 — 901Profit/(loss) after tax as per comprehensive statement of income 8,118 (402) (108) 4,409 8,411 12,820
Reconciliation of underlying EBITDA to Operating Profit
Cake Decoration
£’000s
FoodIngredients
£’000s
Premium Bakery£’000s
Head Office & Consol
Total£’000s
Discontinued Operations
Total £’000s
Total Group
£’000s
Operating Profit/(loss) 6,498 (451) (162) (3,748) (84) 2,053Significant Items 81 38 826 — 945Depreciation 771 255 818 4 69 1,917Amortisation 11 102 — — 113Underlying adjusted EBITDA 7,350 (147) 758 (2,918) (15) 5,028Head Office 2,918 2,918Underlying adjusted EBITDA as above 7,350 (147) 758 — (15) 7,946
OUR FINANCIALS
Annual Report and Accounts for the year ended 31 March 201640

24831-02 - RGF AR 2016 2 August 2016 5:57 PM Proof 12
5. Segment reporting (continued)
Unallocated Relates primarily to the Head Office and non-current asset additions, depreciation and amortisation which cannot be meaningfully allocated to individual operating divisions.
Geographical segmentsThe Group earns revenue from countries outside the United Kingdom, but as these only represent 11.3% of the total revenue of the Group, segmental reporting of a geographical nature is not considered relevant. The Cake Decoration segment accounts for the majority of this turnover
31 March 2016
Cake Decoration
£’000s
FoodIngredients
£’000s
PremiumBakery £’000s
Discontinued £’000s
Unallocated £’000s
Total Group
£’000s
Segment assets 85,133 19,763 13,818 — — 118,714Unallocated assets Property, plant and equipment 3,204 Deferred tax assets 1,479 Trade and other receivables 409 Current tax asset —Total assets 85,133 19,763 13,813 — — 123,806Segment liabilities 7,601 3,905 5,990 — — 17,496Unallocated liabilities Trade and other payables 765 Borrowings 4,146 Current tax liabilities (913) Deferred tax liabilities 1,813 Pension liability 6,081Total liabilities 7,601 3,905 5,990 — — 29,388Net operating assets 77,532 15,858 7,823 — — 94,418Non-current asset additions 1,626 991 1,077 — 2,783 6,477Depreciation 771 255 818 69 4 1917Amortisation — 11 102 — — 113
www.realgoodfoodplc.com Stock Code: RGD 41OUR FINANCIALS

24831-02 - RGF AR 2016 2 August 2016 5:57 PM Proof 12
notes to the Financial Statements (continued)year ended 31 March 2016
5. Segment reporting (continued)
12 months ended 31 March 2015
Cake Decoration
£’000s
FoodIngredients
£’000s
PremiumBakery £’000s
Continuing Operations
Total £’000s
Discontinued Operations
Total £’000s
Total Group
£’000s
Total Revenue 50,705 30,104 28,367 109,176 137,456 246,632Revenue – Internal (1,492) (3,104) — (4,596) (9,168) (13,764)External Revenue 49,213 27,000 28,367 104,580 128,288 232,868EBITDA 6,523 516 1,252 8,291 (3,359) 4,932Operating Profit before Head Office 5,519 260 444 6,223 (3,943) 2,280Head Office and consolidation adjustments — — — (3,021) — (3,021)Significant Items relating to Head Office — — — (522) (328) (850)Operating Profit/(loss) 5,519 260 444 2,680 (4,271) (1,591)Net finance costs (457) (206) (203) (866) (845) (1,711)Pension finance income — — — (235) — (235)Profit/(loss) before tax 5,062 54 241 1,579 (5,116) (3,537)Tax 532 — (48) 506 1,073 574Unallocated Tax — — — (1,451) — (446)Profit/(loss) after tax as per comprehensive statement of income 5,594 54 193 634 (4,043) (3,409)
OUR FINANCIALS
Annual Report and Accounts for the year ended 31 March 201642

24831-02 - RGF AR 2016 2 August 2016 5:57 PM Proof 12
5. Segment reporting (continued)Inter-segment sales are charged at prevailing market rates.
31 March 2015
Cake Decoration
£’000s
FoodIngredients
£’000s
PremiumBakery £’000s
Discontinued £’000s
Unallocated £’000s
Total Group
£’000s
Segment assets 89,199 15,521 11,333 41,406 — 157,459Unallocated assets Property, plant and equipment 77 Deferred tax assets — Trade and other receivables 573 Current tax asset 1,866Total assets 89,199 15,521 11,333 41,406 — 159,975Segment liabilities 22,053 5,020 6,936 27,005 — 61,014Unallocated liabilities Trade and other payables 924 Borrowings 7,994 Current tax liabilities — Deferred tax liabilities 2,436 Pension liability 5,688Total liabilities 22,053 5,020 6,936 27,005 — 78,056Net operating assets 67,146 10,501 4,397 14,401 — 81,919Non-current asset additions 641 218 643 1,750 3 3,255Depreciation 661 239 808 584 49 2,341Amortisation 343 17 — — — 360
www.realgoodfoodplc.com Stock Code: RGD 43OUR FINANCIALS

24831-02 - RGF AR 2016 2 August 2016 5:57 PM Proof 12
notes to the Financial Statements (continued)year ended 31 March 2016
5. Segment reporting (continued)Unallocated Relates primarily to the Head Office and non-current asset additions, depreciation and amortisation which cannot be meaningfully allocated to individual operating divisions.
Geographical segmentsThe Group earns revenue from countries outside the United Kingdom, but as these only represent 11.1% of the total revenue of the Group, segmental reporting of a geographical nature is not considered relevant. The Cake Decoration segment accounts for the majority of this turnover.
6. Significant items
During the year the Group incurred a number of significant items as detailed above. Following the disposal of the Sugar business it was decided to relocate the head office function to the London office. The profit on disposal of the sugar business was the result of the sale to Tereos in May 2015. The reversal of contingent consideration relates to a liability created on the acquisition of Rainbow Dust Colours Limited. The current year acquisition costs relates to the purchase of Chantilly Patisserie £306k, plus additional costs for the acquisition of Rainbow Dust Colours Limited of £74k.
2016£’000s
2015£’000s
Continuing operationsHead office relocation following Napier Disposal (446) —Management restructuring (119) (568)Acquisition costs (380) (282)
Sub total (945) (850)Taxation on significant items 113 178
Total significant items (832) (672)
OUR FINANCIALS
Annual Report and Accounts for the year ended 31 March 201644

24831-02 - RGF AR 2016 2 August 2016 5:57 PM Proof 12
7. Auditor’s remuneration
12 monthsended
31 March2016
£’000s
12 monthsended
31 March2015
£’000s
Fees payable to the Company’s auditor for the audit of the Company’s annual accounts 36 30Fees payable to the Company’s auditor for other services — continuing operationsThe audit of the Company’s subsidiaries pursuant to legislation 180 143Tax compliance services 28 31Tax advisory services 28 35Other assurance services 56 24Total fees paid to Auditor 292 233Discontinued operationsThe audit of the Company’s subsidiaries pursuant to legislation — 85Tax compliance services — —Tax advisory services — —Other assurance services — —Total fees paid to Auditor — 85
www.realgoodfoodplc.com Stock Code: RGD 45OUR FINANCIALS

24831-02 - RGF AR 2016 2 August 2016 5:57 PM Proof 12
notes to the Financial Statements (continued)year ended 31 March 2016
8. operating profit
* The costs incurred in research and development are not capitalised as they do not meet the definitions of an intangible asset in accordance with IAS 38.
9. Finance income There was no finance income in the period (2015 – £nil).
10. Finance costs
Notes
31 March 2016
£’000s
31 March 2015
£’000s
External sales 113,676 232,868Staff costs 13 28,457 32,787Inventories: — cost of inventories as an expense (included in cost of sales) 62,805 166,035Depreciation of property, plant and equipment 18 1,917 2,341Amortisation of intangible assets 17 113 360Significant items 6 945 850Operating lease payment: — land and buildings 29 560 559 — other assets 29 795 621Research and development expenditure* 1,220 750Impairment of trade receivables 22 165 81Foreign exchange (gains)/losses (385) (450)Other net operating expenses 15,031 30,525Total 111,623 234,459Operating profit 2,053 (1,591)
12 monthsended
31 March2016
£’000s
12 monthsended
31 March2015
£’000s
Interest on bank loans and overdrafts 467 1,700Loan note redemption fee 906 —Interest on obligations under finance leases 11 11
1,384 1,711Continuing business 478 866Discontinued business 906 845
OUR FINANCIALS
Annual Report and Accounts for the year ended 31 March 201646

24831-02 - RGF AR 2016 2 August 2016 5:57 PM Proof 12
11. other finance costs
12. Directors’ remuneration
The emoluments of the Directors for the period were as follows:
* Short term Employee Benefits include Salaries received as an officer of the Company. Separate to these payments, consultancy fees are paid to entities in which Directors hold a beneficial interest. These payments are disclosed as related party transactions in note 30.
** Totals for M J McDonough include compensation for loss of office amounting to £326k.
Key management personnel are considered to be the Company Directors.
31 March2016
£’000s
31 March2015
£’000s
Interest on pension scheme liabilities 738 857Interest on pension scheme assets (547) (695)Past service cost — 73
191 235
31 March2016
£’000s
31 March2015
£’000s
Fees 131 106Executive salaries and benefits 757 472Share based payments — 16
888 594
Short term Employee Benefits* £’000s
Share based payments
£’000s
Post Employment Benefits £’000s
31 March
2016 £’000s
31 March 2015
£’000s
M J McDonough (to Sept 15)** 392 — 40 432 257
P W Totté 223 — — 223 231
D P Newman (from Sept 15) 92 — 10 102 —
P G Ridgwell 30 — — 30 30
P C Salter 36 — — 36 36
J M d'Unienville 25 — — 25 —
C O Thomas 40 — — 40 40
838 — 50 888 594
www.realgoodfoodplc.com Stock Code: RGD 47OUR FINANCIALS

24831-02 - RGF AR 2016 2 August 2016 5:57 PM Proof 12
notes to the Financial Statements (continued)year ended 31 March 2016
12. Directors’ remuneration (continued)Directors’ interests in share options:
16,666 new options were granted to Directors during the year (2015 – none). Options have been granted to Directors whose performances and potential contribution were judged to be important to the operations of the Group, as incentives to maximise their performance and contribution.
The mid-market price of the ordinary shares on 31 March 2016 was 45.25p and the range during the year was 32.0p to 59.0p.
No Director exercised share options during the year.
During the period retirement benefits were accruing to two (2015 – one) Director in respect of money purchase pension schemes.
Option TypeDate of
Grant
Number of options at 31 March
2016
Number of options at31 March
2015Exercise
Price
Earliest Exercise
Date
Exercise Expiry Date
P W Totté Unapproved options 2009 July 2009 1,000,000 1,000,000 5.25p July 2012 July 2019
Unapproved options 2010 May 2010 142,857 142,857 24.50p May 2013 May 2020
Unapproved options 2011 March 2011 3,817,725 3,817,725 25.0p April 2011 Mar 2021
P G Ridgwell Unapproved options 2009 July 2009 476,190 476,190 5.25p July 2012 July 2019
Unapproved options 2010 May 2010 61,224 61,224 24.50p May 2013 May 2020
P C Salter Unapproved options 2009 July 2009 285,714 285,714 5.25p July 2012 July 2019
Unapproved options 2010 May 2010 102,040 102,040 24.50p May 2013 May 2020
C O Thomas Unapproved options 2009 July 2009 304,762 304,762 5.25p July 2012 July 2019
Unapproved options 2010 May 2010 40,816 40,816 24.50p May 2013 May 2020
D P Newman Approved options 2009 June 2009 333,333 333,333 5.25p July 2012 July 2019(appointed Sept 15) Approved options 2010 May 2010 20,408 20,408 24.50p May 2013 May 2020
Approved options 2015 May 2015 16,666 — 45.00p May 2018 July 2019
OUR FINANCIALS
Annual Report and Accounts for the year ended 31 March 201648

24831-02 - RGF AR 2016 2 August 2016 5:57 PM Proof 12
13. Staff numbers and costsThe average monthly number of people employed by the Group (including Executive Directors) during the year, analysed by category, were as follows:
The aggregate payroll costs were as follows:
31 March2016
31 March2015
Continuing operationsProduction 743 673Selling and distribution 159 110Directors and administrative 156 81
1,058 864
31 March2016
£’000s
31 March2015
£’000s
Continuing operationsWages, salaries and fees 24,640 21,813Social Security Costs 2,503 2,179Other pension costs 1,299 1,558Share based payment expense 15 30
28,457 25,580
www.realgoodfoodplc.com Stock Code: RGD 49OUR FINANCIALS

24831-02 - RGF AR 2016 2 August 2016 5:57 PM Proof 12
notes to the Financial Statements (continued)year ended 31 March 2016
14. taxation
31 March2016
£’000s
31 March2015
£’000s
Current taxUK Current tax on profit of the period 247 201UK Current tax on significant items (113) (178)Adjustments in respect of prior years (7) 85Total current tax 127 108Deferred tax relating to sale of Napier (256) —Deferred tax charge re pension scheme 17 44Origination and reversal of timing differences 198 (260)Adjustments in respect of prior years 73 (20)Adjustment in respect of change in deferred tax rate (89) —Total deferred tax (57) (236)Tax – continuing operations 326 945Tax – discontinued operations (256) (1,073)Total tax 70 (128)Tax on profit 70 (128)
OUR FINANCIALS
Annual Report and Accounts for the year ended 31 March 201650
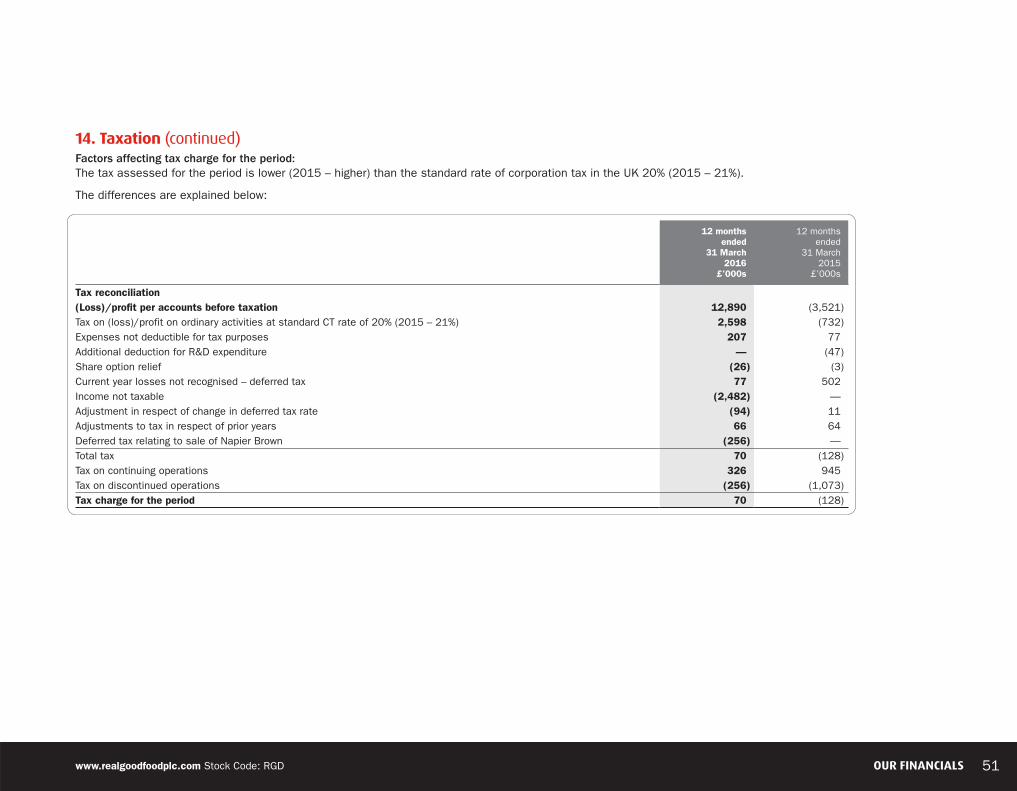
24831-02 - RGF AR 2016 2 August 2016 5:57 PM Proof 12
14. taxation (continued)Factors affecting tax charge for the period: The tax assessed for the period is lower (2015 – higher) than the standard rate of corporation tax in the UK 20% (2015 – 21%).
The differences are explained below:
12 monthsended
31 March2016
£’000s
12 monthsended
31 March2015
£’000s
Tax reconciliation(Loss)/profit per accounts before taxation 12,890 (3,521)Tax on (loss)/profit on ordinary activities at standard CT rate of 20% (2015 – 21%) 2,598 (732)Expenses not deductible for tax purposes 207 77Additional deduction for R&D expenditure — (47)Share option relief (26) (3)Current year losses not recognised – deferred tax 77 502Income not taxable (2,482) —Adjustment in respect of change in deferred tax rate (94) 11Adjustments to tax in respect of prior years 66 64Deferred tax relating to sale of Napier Brown (256) —Total tax 70 (128)Tax on continuing operations 326 945Tax on discontinued operations (256) (1,073)Tax charge for the period 70 (128)
www.realgoodfoodplc.com Stock Code: RGD 51OUR FINANCIALS

24831-02 - RGF AR 2016 2 August 2016 5:57 PM Proof 12
notes to the Financial Statements (continued)year ended 31 March 2016
15. earnings per shareBasic earnings per shareBasic earnings per share is calculated on the basis of dividing the profit/(loss) attributable to ordinary shareholders of the Company by the weighted average number of ordinary shares in issue during the year.
Diluted earnings per shareThe number of shares calculated as above is compared with the number of shares that would have been issued assuming the exercise of all the outstanding the share options. The difference represents the dilutive potential ordinary shares.
12 monthsended
31 March2016
£’000s Continuing operations
12 monthsended
31 March2015
£’000s Continuing operations
Earnings after tax attributable to ordinary shareholders (£’000s) 12,820 (3,409)– Continuing operations 4,409 634– Discontinued operations 8,411 (4,043)Weighted average number of shares in issue (’000s) 69,818 69,568– Continuing operations 6.31p 0.91p– Discontinued operations 12.05p (5.81)pBasic earnings per share 18.36p (4.90)p
OUR FINANCIALS
Annual Report and Accounts for the year ended 31 March 201652

24831-02 - RGF AR 2016 2 August 2016 5:57 PM Proof 12
15. earnings per share (continued)The weighted average number of shares in issue for the year was 69,818k, the number of options outstanding was 9,969. If these were all exercised the cash raised would be equivalent to that which would be raised by issuing 5,746 shares at the average share price during the year. The difference between these figures is the dilutive potential ordinary shares of 75,564.
Adjusted earnings per shareAn adjusted earnings per share and a diluted adjusted earnings per share, which exclude significant items, have also been calculated as in the opinion of the Board this allows shareholders to gain a clearer understanding of the trading performance of the Group.
31 March2016
£’000s
31 March2015
£’000s
Earnings after tax attributable to ordinary shareholders (£’000s) 12,820 (3,409)– Continuing operations 4,409 634– Discontinued operations 8,411 (4,043)Weighted average number of shares in issue (’000s) 75,564 74,203– Continuing operations 5.83p 0.85p– Discontinued operations 11.13p (5.8)pDiluted earnings per share 16.96p (4.9)p
31 March2016
£’000s
31 March2015
£’000s
Earnings after tax attributable to ordinary shareholders (£’000s) 12,820 (3,409)– Continuing operations 4,409 634– Discontinued operations 8,411 (4,043)Add back significant items (note 6) 945 850Add Back Fair value gain (3,267) —
Add Back Profit on Napier disposal (9,145) —Add back tax on significant items (113) (178)Adjusted earnings after tax attributable to ordinary shareholders (£’000s) 1,240 (2,737)Weighted average number of shares in issue (’000s) 69,818 69,568Basic earnings per share 1.78p (3.93)pTotal potential weighted average number of shares in issue (’000s) 75,564 74,203Basic diluted earnings per share 1.64p (3.93)p
www.realgoodfoodplc.com Stock Code: RGD 53OUR FINANCIALS

24831-02 - RGF AR 2016 2 August 2016 5:57 PM Proof 12
notes to the Financial Statements (continued)year ended 31 March 2016
16. Goodwill
Goodwill acquired on business combinations is allocated at acquisition to the Cash Generating Units that are expected to benefit from that business combination. Before any recognition of impairment losses, the carrying amount of goodwill has been allocated as follows:
The Goodwill on Renshaw; R&W Scott and Garrett Ingredients originally arose on the acquisition of Napier Brown Foods Limited. As previously reported the strategy in recent years has been to establish each of these as separate trading businesses, ‘divisions’, with their own management teams leading to them all being re-established as separate Limited companies. This process was fully completed in October 2015.
The goodwill on Rainbow Dust Colours Limited arises out of the acquisition in January 2015. The goodwill on Hayden Bakery Limited arises out of the acquisition of the Chantilly Patisserie business in February 2016.
Group £’000s
CostCarried forward 31 March 2015 82,019Disposal during year (12,000)Addition in year (note 33) 986Carried forward 31 March 2016 71,005
31 March2016
£’000s
31 March2015
£’000s
Napier Brown (disposed in May 2015) — 12,000Garrett Ingredients 5,000 5,000Renshaw 57,796 57,796R&W Scott 1,000 1,000Rainbow Dust Colours 6,223 6,223Haydens Bakery – Chantilly Patisserie 986 —
Carried forward 31 March 2016 71,005 82,019
Continuing business 71,005 70,019
Discontinued business — 12,000
OUR FINANCIALS
Annual Report and Accounts for the year ended 31 March 201654

24831-02 - RGF AR 2016 2 August 2016 5:57 PM Proof 12
16. Goodwill (continued) An assessment of the underlying cash generation, based on current EBITDA performance less ongoing maintenance capital expenditure, has been used to determine the future cash generation profile for each of the divisions. In line with the established impairment tests logic this profile has been used in establishing the Net Present Value of the individual future income streams.
The Board is keen to point out the outcome reflects the specific dynamics and nature of each division and that the respective values should not be viewed as a ‘judgement’ on each. All the divisions have exciting growth plans that are being implemented and all will contribute to the future success of the Group.
The Group tests goodwill annually for impairment or more frequently if there are indications that goodwill may be impaired.
The recoverable amounts of the Cash Generating Units are determined from value in use calculations. The key assumptions for the value in use calculations are those regarding discount rates and expected changes to selling prices and direct costs.
The rate used to discount the forecast cash flows is the Group’s pre-tax weighted average cost of capital of 3.0% (2015 – 7.07%). A period of 19 years has been applied to the projected cash flows, based on the logic above assuming no annual growth, as the Directors used this period to assess the viability of the acquisition when the business was acquired in 2005. Changes in selling prices and direct costs are based on past practices and expectations of future changes in the market. Using these parameters and allowing for disposal income at the end of this timescale the recoverable amounts exceed the carrying value by £97.3 million for continuing operations. This is based on our base expectations for the trading period to 31 March 2017.
An increase in the Group’s weighted average cost of capital to above 12% (2015 – 10.5%) would cause the Board to impair the carrying value of goodwill across all continuing divisions.
www.realgoodfoodplc.com Stock Code: RGD 55OUR FINANCIALS

24831-02 - RGF AR 2016 2 August 2016 5:57 PM Proof 12
notes to the Financial Statements (continued)year ended 31 March 2016
17. other intangible assets
Intangible assets all relate to intangible assets acquired from third parties and there are no internally generated intangible assets.
There is no indication of any impairment of these intangible assets.
Customer Relationship
£’000s
Computer Software
£’000sGroup
£’000sCompany
£’000s
Cost At 1 April 2015 — 2,964 2,964 4Acquired on acquisition of Chantilly Patisserie 405 — 405 —Acquired on acquisition of ISO2 Nutrition 68 — 68 —Disposals — (2,178) (2,178) (4)At 31 March 2016 473 786 1,259 —Amortisation At 1 April 2015 — 2,123 2,123 4Charge 55 58 113 —Disposals — (1,811) (1,811) (4)At 31 March 2016 55 370 425 —Net book value at 31 March 2016 418 416 834 —Cost At 1 April 2014 — 2,925 2,925 4Additions — 99 99 —Disposals — (60) (60) —At 31 March 2015 — 2,964 2,964 4Amortisation At 1 April 2014 — 1,823 1,823 4Charge — 360 360 —Disposals — (60) (60) —At 31 March 2015 — 2,123 2,123 4Net book value at 31 March 2015 — 841 841 —
OUR FINANCIALS
Annual Report and Accounts for the year ended 31 March 201656

24831-02 - RGF AR 2016 2 August 2016 5:57 PM Proof 12
18. property, plant and equipmentGroup
The net book value of assets held under finance leases or hire purchase contracts, included above, is as follows:
£ NIL (2015 – £21.0 million) of property, plant and equipment have been pledged as security for borrowings; see note 23.
Land and Buildings
£’000s
Plant and Equipment
£’000s
Assets in the course of
construction £’000s
Total £’000s
CostAt 1 April 2015 13,539 32,615 537 46,691Acquired on acquisition of business (note 33) — 108 — 108Additions 542 5,122 636 6,300Disposals (4,604) (11,588) — (16,192)Reclassifications — 831 (831) —At 31 March 2016 9,477 27,088 342 36,907DepreciationAt 1 April 2015 3,891 21,221 — 25,112Disposals (1,242) (6,946) — (8,188)Charge 286 1,631 — 1,917At 31 March 2016 2,935 15,906 — 18,841
Net book value at 31 March 2016 6,542 11,182 342 18,066CostAt 1 April 2014 13,094 31,599 911 45,604Acquired on acquisition of subsidiary — 201 — 201Additions 1,571 1,132 252 2,955Disposals (1,455) (614) — (2,069)Reclassifications 329 297 (626) —At 31 March 2015 13,539 32,615 537 46,691DepreciationAt 1 April 2014 3,576 19,737 — 23,313Disposals — (542) — (542)Charge 315 2,026 — 2,341At 31 March 2015 3,891 21,221 — 25,112Net book value at 31 March 2015 9,648 11,394 537 21,579Continuing business 6,278 6,784 537 13,599Discontinued business 3,370 4,610 — 7,980
31 March2016
£’000s
31 March2015
£’000s
Plant and equipment 353 586
www.realgoodfoodplc.com Stock Code: RGD 57OUR FINANCIALS

24831-02 - RGF AR 2016 2 August 2016 5:57 PM Proof 12
notes to the Financial Statements (continued)year ended 31 March 2016
18. property, plant and equipment (continued)Company
The net book value of assets held under finance leases or hire purchase contracts, included above, are as follows:
Land and Buildings
£’000s
Plant and Equipment
£’000sTotal
£’000s
CostAt 1 April 2015 — 162 162Additions 498 2,285 2,783Group Transfers — 1,664 1,664Disposals — (660) (660)At 31 March 2016 498 3,451 3,949DepreciationAt 1 April 2015 — 85 85Disposals — (660) (660)Group Transfers — 1,294 1,294Charge — 26 26At 31 March 2016 — 745 745Net book value at 31 March 2016 498 2,706 3,204CostAt 1 April 2014 1,455 309 1,764Additions — 3 3Disposals (1,455) (150) (1,605)At 31 March 2015 — 162 162DepreciationAt 1 April 2014 — 114 114Disposals — (78) (78)Charge — 49 49At 31 March 2015 — 85 85Net book value at 31 March 2015 — 77 77
31 March2016
£’000s
31 March2015
£’000s
Plant and equipment — —
OUR FINANCIALS
Annual Report and Accounts for the year ended 31 March 201658

24831-02 - RGF AR 2016 2 August 2016 5:57 PM Proof 12
19. investmentsCompanyInvestments in shares of subsidiary undertakings:
The additions in the year relate to the creation of trading limited companies and the increase in share capital as a result of the capitalisation of a Group loan balance.
The aggregate of the share capital and reserves at 31 March 2016 and of the profit or loss for the year ended on that date are as follows:
Napier Brown Foods Limited
£’000s
FSF Dormant Limited/
TD Dormant Limited £’000s
R&W Scott LimitedGarrett Ingredients
Limited
Haydens Bakery Limited £’000s
Eurofoods plc/Coolfresh
Limited £’000s
Real Good Food Europe
SA£’000s Total
At 31 March 2015 53,900 610 — 3,248 79 55 57,892Impairment (610) (610)Capitalisation of intercompany loans — — 7,500 — — 717 8,217At 31 March 2016 53,900 — 7,500 3,248 79 772 65,499
Aggregate of Share Capital and reserves
£’000sProfit/(loss)
£’000s
N Brown Foods Limited 37,277 (759)JF Renshaw Limited 59,569 3,555Haydens Bakery Limited 1,160 (108)Rainbow Dust Colours Limited 6,240 1,085RGFC Dust Limited (101) (68)Garrett Ingredients Limited 2,640 140R&W Scott Limited 4,593 (407)Real Good Food Europe SA (3) (320)
www.realgoodfoodplc.com Stock Code: RGD 59OUR FINANCIALS
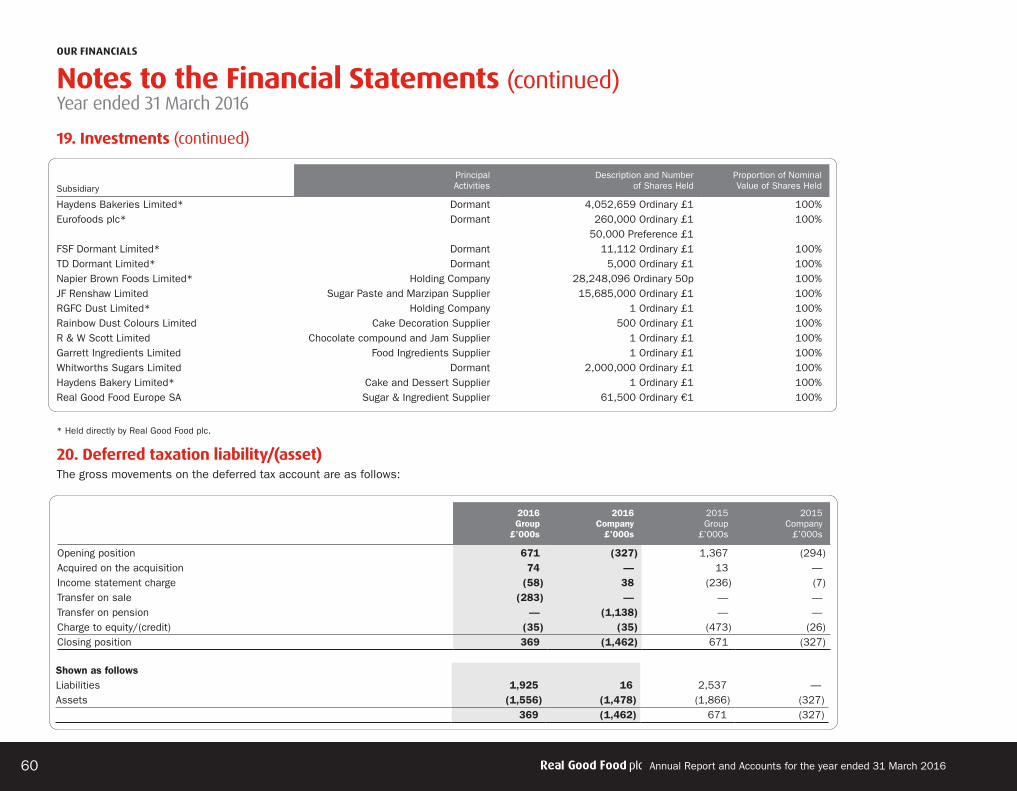
24831-02 - RGF AR 2016 2 August 2016 5:57 PM Proof 12
notes to the Financial Statements (continued)year ended 31 March 2016
19. investments (continued)
* Held directly by Real Good Food plc.
20. Deferred taxation liability/(asset)The gross movements on the deferred tax account are as follows:
Subsidiary
Principal Activities
Description and Number of Shares Held
Proportion of Nominal Value of Shares Held
Haydens Bakeries Limited* Dormant 4,052,659 Ordinary £1 100%Eurofoods plc* Dormant 260,000 Ordinary £1 100%
50,000 Preference £1FSF Dormant Limited* Dormant 11,112 Ordinary £1 100%TD Dormant Limited* Dormant 5,000 Ordinary £1 100%Napier Brown Foods Limited* Holding Company 28,248,096 Ordinary 50p 100%JF Renshaw Limited Sugar Paste and Marzipan Supplier 15,685,000 Ordinary £1 100%RGFC Dust Limited* Holding Company 1 Ordinary £1 100%Rainbow Dust Colours Limited Cake Decoration Supplier 500 Ordinary £1 100%R & W Scott Limited Chocolate compound and Jam Supplier 1 Ordinary £1 100%Garrett Ingredients Limited Food Ingredients Supplier 1 Ordinary £1 100%Whitworths Sugars Limited Dormant 2,000,000 Ordinary £1 100%Haydens Bakery Limited* Cake and Dessert Supplier 1 Ordinary £1 100%Real Good Food Europe SA Sugar & Ingredient Supplier 61,500 Ordinary €1 100%
2016 Group
£’000s
2016 Company
£’000s
2015Group
£’000s
2015 Company
£’000s
Opening position 671 (327) 1,367 (294)Acquired on the acquisition 74 — 13 —Income statement charge (58) 38 (236) (7)Transfer on sale (283) — — —Transfer on pension — (1,138) — —Charge to equity/(credit) (35) (35) (473) (26)Closing position 369 (1,462) 671 (327)
Shown as followsLiabilities 1,925 16 2,537 —Assets (1,556) (1,478) (1,866) (327)
369 (1,462) 671 (327)
OUR FINANCIALS
Annual Report and Accounts for the year ended 31 March 201660

24831-02 - RGF AR 2016 2 August 2016 5:57 PM Proof 12
20. Deferred taxation liability/(asset) (continued)GroupDeferred tax assetsThe deferred tax balances arise from temporary differences in respect of the following:
Deferred tax provisions
There were £2.52 million of unused tax losses not recognised due to uncertainty over when they could be utilised.
Losses £’000s
Options £’000s
Provisions £’000s
Pension £’000s
Total £’000s
At 31 March 2015 (359) (324) (45) (1,138) (1,866)Charge/(credit) to income:— current period — — (36) 17 (19)— prior years 359 — 5 — 364(Credit) to equity — — — (34) (34)At 31 March 2016 — (324) (76) (1,155) (1,555)
Within 12 months — — (76) — (76)
Greater than 12 months — (324) — (1,155) (1,479)
Intangible Assets £’000s
Tangible Assets £’000s
Total £’000s
At 31 March 2015 1,022 1,515 2,537Acquired on acquisition 74 — 74Charged to income:— current period 40 (153) (113)— prior period — (290) (290)Transfer on sale of Napier — (283) (283)At 31 March 2016 1,136 789 1925
www.realgoodfoodplc.com Stock Code: RGD 61OUR FINANCIALS

24831-02 - RGF AR 2016 2 August 2016 5:57 PM Proof 12
notes to the Financial Statements (continued)year ended 31 March 2016
20. Deferred taxation liability/(asset) (continued)CompanyDeferred tax assetsThe deferred tax balances arise from temporary differences in respect of the following:
21. inventories
Inventories totalling £12,360k (2015 – £16,527k) are valued at the lower of cost and net realisable value. The Directors consider that this value represents the best estimate of the fair value of those inventories net of costs to sell. The write-off of inventories during the period is not material.
Pension Scheme
Tangible Assets £’000s
Share Options £’000s
Total £’000s
At 31 March 2015 (4) (323) (327)Charge/(credit) to income:— current period 17 20 — 37— transfers from Group companies (1,138) — — (1,138)Charge/(credit) to equity (34) — — (34)At 31 March 2016 (1,155) 16 (323) (1,462)Within 12 months — — — —Greater than 12 months (1,155) 16 (323) (1,462)
31 March 2016 Group
£’000s
31 March 2016
Company £’000s
31 March 2015 Group
£’000s
31 March 2015
Company £’000s
Materials 5,495 — 5,491 —Work in progress 641 — 743 —Finished goods 6,224 — 10,293 —
12,360 — 16,527 —Continuing business 12,360 — 10,328 —Discontinued business — — 6,199 —
OUR FINANCIALS
Annual Report and Accounts for the year ended 31 March 201662

24831-02 - RGF AR 2016 2 August 2016 5:57 PM Proof 12
22. trade and other receivables
31 March 2016 Group
£’000s
31 March 2016
Company £’000s
31 March 2015Group
£’000s
31 March 2015
Company £’000s
Non-current trade and other receivablesAmounts owed by Group undertakings — — — 43,626Current trade and other receivablesTrade receivables 15,006 — 26,012 —Less: provision for impairment of receivables (204) — (111) —Net trade receivables 14,802 — 25,901 —Other receivables 1,068 12 1,566 —Amounts owed by Group undertakings — 55,390 — 1,527Prepayments 1,169 396 2,591 573Total 17,039 55,798 30,058 2,100Continuing business 17,039 15,229Discontinued business — 14,829
www.realgoodfoodplc.com Stock Code: RGD 63OUR FINANCIALS

24831-02 - RGF AR 2016 2 August 2016 5:57 PM Proof 12
notes to the Financial Statements (continued)year ended 31 March 2016
22. trade and other receivables (continued)Provision for impairment of receivables
The creation and release of the provision for impaired receivables has been included in the income statement within administration costs (note 8).
Trade receivables primarily represent Blue Chip customers with good credit ratings. In assessing and granting credit the Group relies on professional credit rating agencies and has credit insurance policies in place for added protection. This credit insurance covers £10 million of the Group’s trade receivables, the remaining amount of £5 million relates to sales from the Group’s Premium bakery division to high street retailers, which the Group has not taken credit insurance on as we deem this to be of limited credit risk. There is no concentration of credit risk within trade receivables as the Group trades with a broad base of customers primarily within the UK, over various different sectors.
The Group recognised a charge of £165k (2015 – charge of £81k) for impairment of its trade receivables during the period, to reflect debts significantly past their due dates. This loss has been included in operating profit in the Statement of Comprehensive Income.
The Directors consider that the carrying amount of trade and other receivables approximates to their fair value. The Directors consider the maximum credit risk at the balance sheet date is equivalent to the carrying value of trade and other receivables, less any amounts claimable under the Group’s credit insurance policies.
Trade receivables of £2.1 million were past due but not impaired, a slight decline on last year driven by a tighter credit control programme. The ageing analysis of these receivables is as follows:
31 March 2016 Group
£’000s
31 March 2016
Company £’000s
31 March 2015Group
£’000s
31 March 2015
Company £’000s
At 31 March 2015 (111) — (50) —Charge for period (165) — (81) —Uncollectable amounts written off 72 — 20 —At 31 March 2016 (204) — (111) —
31 March 2016 Group
£’000s
31 March 2015Group
£’000s
Up to 30 days past due 740 3,0691–3 months past due 1,040 498Over 3 months past due 378 311
2,158 3,878
OUR FINANCIALS
Annual Report and Accounts for the year ended 31 March 201664

24831-02 - RGF AR 2016 2 August 2016 5:57 PM Proof 12
23. Borrowings and capital management
Features of the Group’s borrowings are as follows:The Group’s financial instruments comprise cash, a term loan, hire purchase and finance leases, revolving credit facility, overdraft and various items arising directly from its operations such as trade payables and receivables. The main purpose of these financial instruments is to finance the Group’s operations. Following the sale of Napier Brown Sugar in May 2015 the facilities with PNC Business Credit have been fully repaid along with the loan note that was due to Napier Brown Ingredients Limited. During the year a new revolving credit invoice discount facility has been entered into with Lloyds Bank Plc.
The main risks from the Group’s financial instruments are interest rate risk and liquidity risk. The Group also has some currency exposure in relation to its sugar trade and also some currency exposure in relation to the purchase of almonds from the United States. However, this is mitigated by matching against foreign currency sales. The Board reviews and agrees policies, which have remained substantially unchanged for the year under review, for managing these risks.
The Group’s policies on the management of interest rate, liquidity and currency exposure risks are set out in the Report of the Directors.
At the end of March 2016 the Group has one term loan and a revolving credit facility with Lloyds Bank Plc. The term loan was taken out in January 2015 to assist with the acquisition of Rainbow Dust Colours Limited, the original term was for 365 days and due for repayment in January 2016, this has been extended and is repayable in July 2016. The balance outstanding was £3.2 million (2015 £3.95 million).
During the year the Group negotiated a £10 million revolving credit facility comprising Sterling Euro and US Dollar invoice discounting facilities which bears interest at 1.5% above base rate and at the year-end £3.7 million was outstanding under this facility. This facility is secured primarily on the debtors of JF Renshaw Limited and Haydens Bakery Limited.
31 March 2016 Group
£’000s
31 March 2016
Company £’000s
31 March 2015Group
£’000s
31 March 2015
Company £’000s
Unsecured borrowings at amortised cost Loan notes — — 2,774 —Secured borrowings at amortised cost Bank term loans 3,200 — 9,170 5,220 Revolving credit facilities 3,705 — 24,430 — Hire purchase 158 — 376 —
7,063 — 36,750 5,220Amounts due for settlement within 12 months 7,008 — 30,073 1,541Amounts due for settlement after 12 months 55 — 6,677 3,679
7,063 — 36,750 5,220Continuing business 7,063 23,867Discontinued business — 12,883
www.realgoodfoodplc.com Stock Code: RGD 65OUR FINANCIALS
24831-02 - RGF AR 2016 2 August 2016 5:57 PM Proof 12
notes to the Financial Statements (continued)year ended 31 March 2016
23. Borrowings and capital management (continued)Since the year end the Group has successfully negotiated extended borrowing facilities with Lloyds Bank plc to enable it to continue its acquisition and investment strategy. The Group has entered into an invoice finance facility of £20 million on a revolving basis with a minimum term of 12 months and a 3 months’ notice period. This facility is secured against the debtors across the whole of the Groups UK businesses, and comprise a Sterling, Euro and US Dollar facility with an interest rate of 1.5% above base rate.
In addition a new term loan of £3 million has been agreed with Lloyds Bank plc to replace the loan taken out to finance the acquisition of Rainbow Dust Colours Limited. The new loan has a term of 3 years expiring in July 2019 and is repayable in quarterly instalments of £250k. Interest on this loan is charged at 2.75% above base rate.
To aid the capital expenditure growth planned for the Group it has also entered into a £4 million facility secured against specific items of plant and machinery with Lloyds Bank plc. This loan is for a term of 5 years ending July 2021 and is repayable in monthly instalments of £73k plus VAT. Interest on this loan is charged at 3.5% above base rate.
The fixed interest rate liabilities relate to amounts payable on hire purchase agreements £0.2 million. The weighted average interest rate of these liabilities was 2% (2015 – 2%) and the weighted average period for which the interest rates are fixed was 28 months (2015 – 40 months).
The financial assets of the Group are surplus funds, which are offset against borrowings under the facility, and there is no separate interest rate exposure.
Lloyds Bank Plc has a debenture incorporating a floating charge over the undertaking and all property and assets present and future including goodwill, book debts, uncalled capital, buildings, fixtures, intangible assets, fixed plant and machinery. In addition, our banking arrangements with Lloyds Bank plc contain certain cross guarantees.
Hire purchase and finance lease liabilities are secured upon the underlying assets.
Capital managementThe Group is subject to the risk that its capital structure will not be sufficient to support the growth of the business. The Group’s objectives when managing capital are to safeguard the Group’s ability to continue as a going concern in order to provide returns for shareholders and benefits for other stakeholders and to maintain an optimal capital structure to reduce the cost of capital.
The sale of Napier Brown Sugar enabled the Group to repay all of its borrowings at the time, however there has been no change to the Group’s approach to capital management, which is to fund its working capital requirements by trading generated cash flows supplemented by asset based lending, which is the most favourable source of finance available to the business at this time, to assist in managing its seasonal requirements.
Liquidity risk managementThe Board reviews the Group’s liquidity position on a monthly basis and monitors its forecast and actual cash flows against maturing profiles of its financial assets and liabilities.
OUR FINANCIALS
Annual Report and Accounts for the year ended 31 March 201666

24831-02 - RGF AR 2016 2 August 2016 5:57 PM Proof 12
23. Borrowings and capital management (continued)The following table details the Group’s maturity profile of its financial liabilities:
The profile of the trade payables has been taken as being consistent with the Group’s payment terms to suppliers.
2016
Less than 1 month £’000s
1–3 months £’000s
3 months to 1 year
£’000s
1–5 years
£’000s
5+ years
£’000sTotal
£’000s
Trade and other payables 3,640 4,167 517 — — 8,324Bank term loans — — 3,200 — — 3,200Revolving credit facilities — 3,705 — — — 3,705Finance leases 10 20 73 55 — 158
3,650 7,892 3,790 55 — 15,387
Interest 19 57 153 15 — 244
Total 3,669 7,949 3,943 70 — 15,631
2015
Less than 1 month £’000s
1–3 months £’000s
3 months to 1 year
£’000s
1–5 years
£’000s
5+ years
£’000sTotal
£’000s
Trade and other payables 24,657 3,675 3,687 — — 32,019Loan notes — — — 2,774 — 2,774Bank term loans 403 556 4,532 3,679 — 9,170Revolving credit facilities — 24,430 — — — 24,430Finance leases 10 20 122 224 — 376
25,070 28,681 8,341 6,677 — 68,769Interest 148 338 451 1,845 — 2,782Total 25,218 29,019 8,792 8,522 — 71,551
www.realgoodfoodplc.com Stock Code: RGD 67OUR FINANCIALS

24831-02 - RGF AR 2016 2 August 2016 5:57 PM Proof 12
notes to the Financial Statements (continued)year ended 31 March 2016
23. Borrowings and capital management (continued)Analysis of market risk sensitivityCurrency risks: The Group is exposed to currency risk on purchases made of almonds from the United States. The risk associated with these purchases is mitigated by matching with sales in foreign currencies. The effect of a 10¢ strengthening of the US dollar against sterling exchange rate at the balance sheet date on the trade payables carried at that date would, with all other variables being held constant, have resulted in a decrease in pre-tax profits of £32k. The impact of a 10¢ strengthening of the US dollar against sterling at the balance sheet date on our trade receivables carried at that date would, all other variables being held constant, have resulted in an increase in pre-tax profits of £41k.
The Group is also exposed to currency risk on purchases of sugar from Europe. The risk associated with these purchases is mitigated by matching with sales in foreign currencies. These sales form part of our Invoice Discounting facilities with Lloyds Bank Plc, which generate a euro loan obligation. The effect of a €0.05 strengthening of the euro versus sterling exchange rate at the balance sheet date on our overall euro net position carried at that date would, all other variables being held constant, have resulted in a decrease in pre-tax profits of £22k.
Interest rate risks: The Group has an exposure to interest rate risk arising from fluctuations in sterling and euro base rates. The impact of a 1% increase in the applicable interest rates at the balance sheet date on the variable rate debt carried at that date would, all other factors remaining unchanged, have resulted in a decrease in pre-tax profits of £70k.
Obligation under finance leases
It is the Group’s policy to lease certain property, plant and equipment under finance leases. For the period ended 31 March 2016 the average effective borrowing rate was 4.0% (2015 – 4.01%). Interest rates are fixed at the contract dates. All leases are on a fixed repayment basis and no arrangements have been entered into for contingent rental payments. All lease obligations are denominated in sterling.
The fair value of the Group’s lease obligations approximates to their carrying amount.
31 March 2016
£’000s
31 March 2015
£’000s
Finance lease liabilities – minimum lease paymentsDue within one year 103 152Due within one to five years 55 224
158 376
Future finance charges on finance leases (11) (27)
Present value of finance lease liabilities 147 349The present value of finance lease liabilities is as follows:Due within one year 98 143Due within one to five years 49 206
147 349
OUR FINANCIALS
Annual Report and Accounts for the year ended 31 March 201668

24831-02 - RGF AR 2016 2 August 2016 5:57 PM Proof 12
24. trade and other payables
Trade payables and accruals principally comprise amounts outstanding for trade purchases and ongoing costs.
The Directors consider that the carrying amount of trade payables approximates to their fair value.
Included within accruals is £nil (2015 – £3.5 million) being the fair value of the contingent consideration in respect of a business combination that occurred during the year.
31 March 2016 Group
£’000s
31 March 2016
Company £’000s
31 March 2015Group
£’000s
31 March 2015
Company £’000s
Amounts due in more than one yearAmounts owed to Group undertakings — — — 45,216
Accruals — — 295 —
— — 295 45,216Amounts due within one yearTrade payables 8,324 236 17,831 258Social security 654 89 636 65Amounts owed to Group undertakings — 55,593 — —Accruals 3,600 459 6,877 352
Other payables 665 — 6,380 —
13,243 56,377 31,724 675
Continuing business 13,243 18,000
Discontinued business — 14,019
www.realgoodfoodplc.com Stock Code: RGD 69OUR FINANCIALS
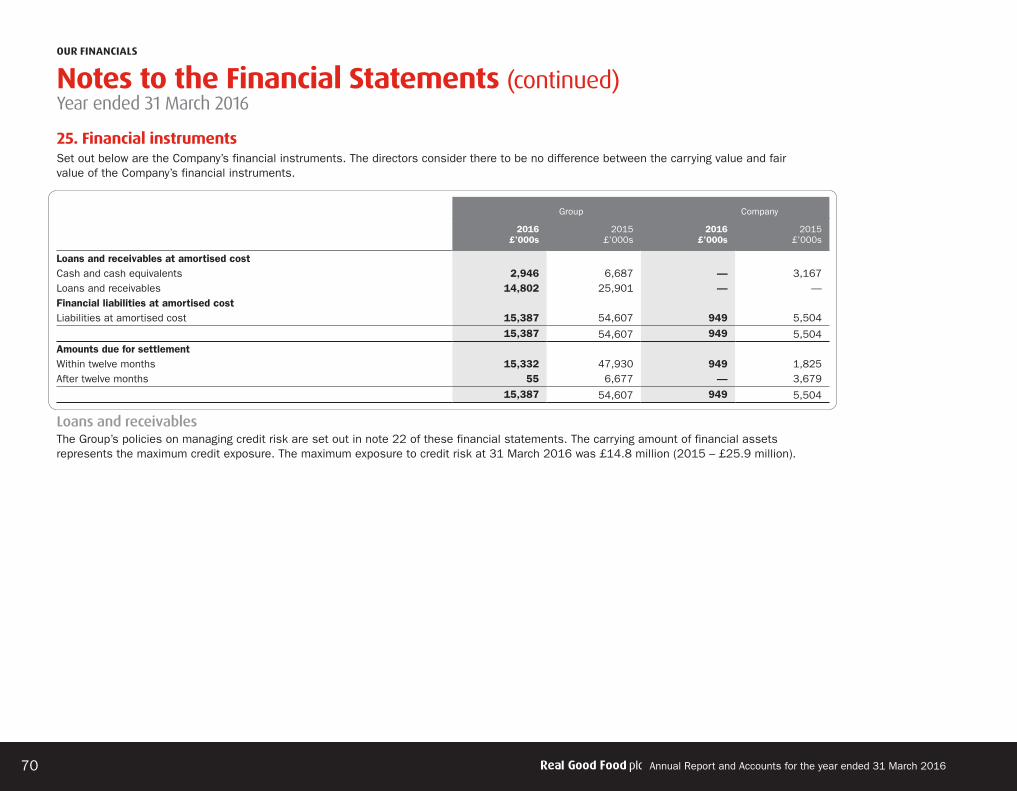
24831-02 - RGF AR 2016 2 August 2016 5:57 PM Proof 12
notes to the Financial Statements (continued)year ended 31 March 2016
25. Financial instrumentsSet out below are the Company’s financial instruments. The directors consider there to be no difference between the carrying value and fair value of the Company’s financial instruments.
Loans and receivablesThe Group’s policies on managing credit risk are set out in note 22 of these financial statements. The carrying amount of financial assets represents the maximum credit exposure. The maximum exposure to credit risk at 31 March 2016 was £14.8 million (2015 – £25.9 million).
Group Company
2016£’000s
2015£’000s
2016£’000s
2015£’000s
Loans and receivables at amortised costCash and cash equivalents 2,946 6,687 — 3,167Loans and receivables 14,802 25,901 — —Financial liabilities at amortised costLiabilities at amortised cost 15,387 54,607 949 5,504
15,387 54,607 949 5,504Amounts due for settlement Within twelve months 15,332 47,930 949 1,825After twelve months 55 6,677 — 3,679
15,387 54,607 949 5,504
OUR FINANCIALS
Annual Report and Accounts for the year ended 31 March 201670

24831-02 - RGF AR 2016 2 August 2016 5:57 PM Proof 12
25. Financial instruments (continued)Financial Liabilities at Amortised costFeatures of the Group’s borrowing costs are detailed in note 23 of these financial statements. The following table analyses the Company’s financial liabilities into relevant maturity groupings based on the remaining period at the balance sheet dated to the contractual maturity date. The amounts disclosed in the table are the contracted undiscounted cash flows. Discounting is not required as this has no material effect on the financial statements.
Contingent consideration obligationsAt 31 March 2016 a financial liability of £nil has been recognised in respect of the fair value of the contingent consideration due in respect of acquisitions (2015 – £3,500,000).
Financial assets/financial liabilities
Fair value as atFair value hierarchy
Valuation technique(s)and key input(s)
Significant unobservableinput(s)
Relationship of unobservableinputs to fair value31/3/2015 31/3/2016
Contingentconsiderationin a businesscombination
£3,500,000 — Level 3 The gross margin achieved within the
acquired business was less than expected and
as a result the contingent consideration payable
was significantly less than previously estimated. The contingent consideration
paid on 3 March 2016 was £233k, the difference between this amount and the liability recognised in the prior year represents
a fair value gain on a financial instrument and has been credited to the
income statement as finance income.
Gross margin based uponactual gross margins
achieved.
The higher the gross margin, the higher
the fair value.
www.realgoodfoodplc.com Stock Code: RGD 71OUR FINANCIALS
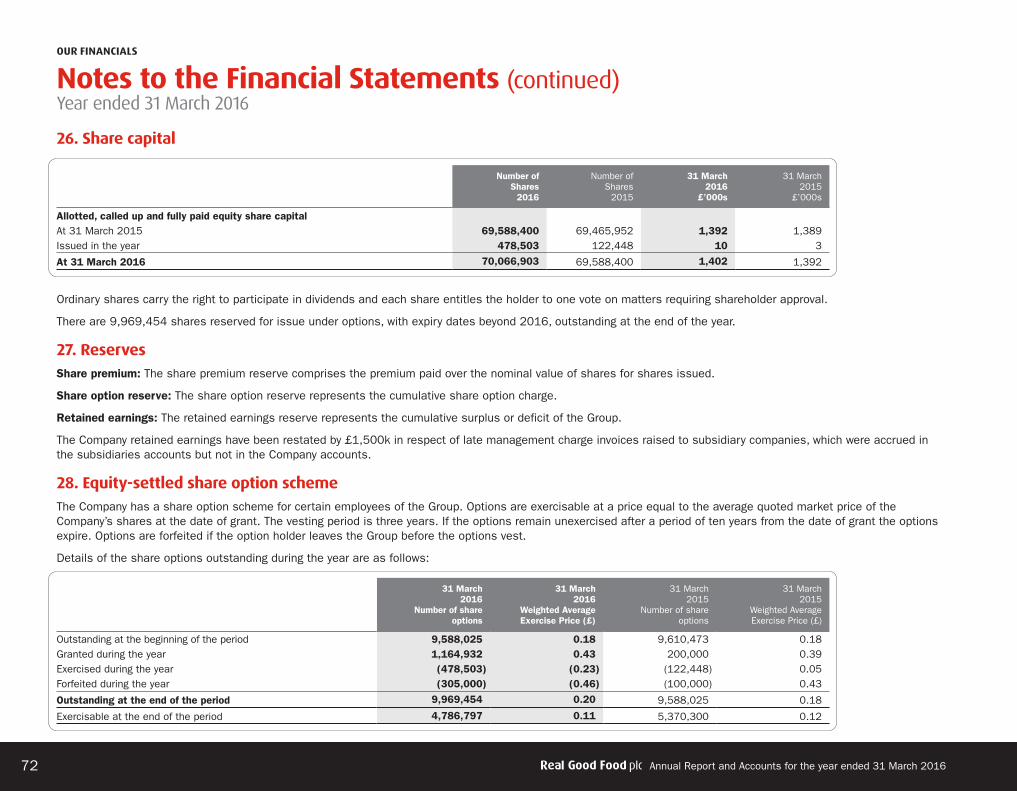
24831-02 - RGF AR 2016 2 August 2016 5:57 PM Proof 12
notes to the Financial Statements (continued)year ended 31 March 2016
26. Share capital
Ordinary shares carry the right to participate in dividends and each share entitles the holder to one vote on matters requiring shareholder approval.
There are 9,969,454 shares reserved for issue under options, with expiry dates beyond 2016, outstanding at the end of the year.
27. ReservesShare premium: The share premium reserve comprises the premium paid over the nominal value of shares for shares issued.
Share option reserve: The share option reserve represents the cumulative share option charge.
Retained earnings: The retained earnings reserve represents the cumulative surplus or deficit of the Group.
The Company retained earnings have been restated by £1,500k in respect of late management charge invoices raised to subsidiary companies, which were accrued in the subsidiaries accounts but not in the Company accounts.
28. equity-settled share option schemeThe Company has a share option scheme for certain employees of the Group. Options are exercisable at a price equal to the average quoted market price of the Company’s shares at the date of grant. The vesting period is three years. If the options remain unexercised after a period of ten years from the date of grant the options expire. Options are forfeited if the option holder leaves the Group before the options vest.
Details of the share options outstanding during the year are as follows:
Number of Shares
2016
Number of Shares
2015
31 March 2016
£’000s
31 March 2015
£’000s
Allotted, called up and fully paid equity share capitalAt 31 March 2015 69,588,400 69,465,952 1,392 1,389Issued in the year 478,503 122,448 10 3
At 31 March 2016 70,066,903 69,588,400 1,402 1,392
31 March 2016
Number of share options
31 March 2016
Weighted Average Exercise Price (£)
31 March 2015
Number of share options
31 March 2015
Weighted AverageExercise Price (£)
Outstanding at the beginning of the period 9,588,025 0.18 9,610,473 0.18Granted during the year 1,164,932 0.43 200,000 0.39Exercised during the year (478,503) (0.23) (122,448) 0.05Forfeited during the year (305,000) (0.46) (100,000) 0.43
Outstanding at the end of the period 9,969,454 0.20 9,588,025 0.18
Exercisable at the end of the period 4,786,797 0.11 5,370,300 0.12
OUR FINANCIALS
Annual Report and Accounts for the year ended 31 March 201672

24831-02 - RGF AR 2016 2 August 2016 5:57 PM Proof 12
28. equity-settled share option scheme (continued)A breakdown of the range of exercise prices for options outstanding as at 31 March 2016 is shown in the table below:
New options have been issued during this current period. At the time of the issue of options the inputs into the Black–Scholes option pricing model were as follows:
Expected volatility 35%Expected life 3 yearsRisk-free rate 2.88%Dividend yield Nil
Expected volatility was determined by calculating the historical volatility of the Company’s share price over the previous three years. The expected life used in the model has been adjusted, based on management’s best estimate, for the effects of non-transferability, exercise restriction, and behavioural considerations.
The share option expense is shown as an expense in administration expenses in the Company as the majority of the charge relates to employees of the Company.
2016 2015
Number outstanding
at end of period
Weighted average
remaining contractual
life (years)
Weighted average exercise
price (pence)
Number outstanding
at end of period
Weighted average
remaining contractual
life (years)
Weighted average
exercise price (pence)
£0.00 – £0.50 9,969,454 1 19.84 9,588,025 1 18.33
2016 £’000s
2015 £’000s
IFRS 2 Fair value charge 15 46Average share price 43.4p 33.9p
www.realgoodfoodplc.com Stock Code: RGD 73OUR FINANCIALS

24831-02 - RGF AR 2016 2 August 2016 5:57 PM Proof 12
notes to the Financial Statements (continued)year ended 31 March 2016
29. commitmentsOperating lease arrangementsAt the balance sheet date the Group had total future minimum lease payments under non-cancellable operating leases for each of the following periods:
Operating lease payments represent rentals payable by the Group in respect of its properties and machinery. For properties, the lease periods are negotiated for an average of fifteen years with five year reviews and for machinery the lease periods vary up to five years.
Operating lease payments payable by the Company are considered immaterial for these accounts.
Capital commitments
30. Related party transactionsConsultancy fees were paid to the following entities in which Directors hold a beneficial interest:
During the year the Group repaid the loan notes of £2,774k to Napier Brown Ingredients Limited, a company in which P G Ridgwell, who is a director of Real Good Food Plc, has significant influence. Together with the principal amount of £2,774k the Group also repaid accrued interest of 10% for 2014/15 of £277k, interest for the period of £43k and a redemption premium fee of £906k.
31 March 2016
£’000s
31 March 2015
£’000s
Due within one year 1,264 885Due between one and five years 374 1,322Due beyond five years — 1,127
2016 £’000s
2015£’000s
Commitments for the acquisition of property, plant and equipment 930 690
Payee Director
31 March 2016
£’000s
31 March 2015
£’000s
P G Ridgwell P G Ridgwell 55 55The Salter Consultancy LLP P Salter 109 69
164 124
OUR FINANCIALS
Annual Report and Accounts for the year ended 31 March 201674
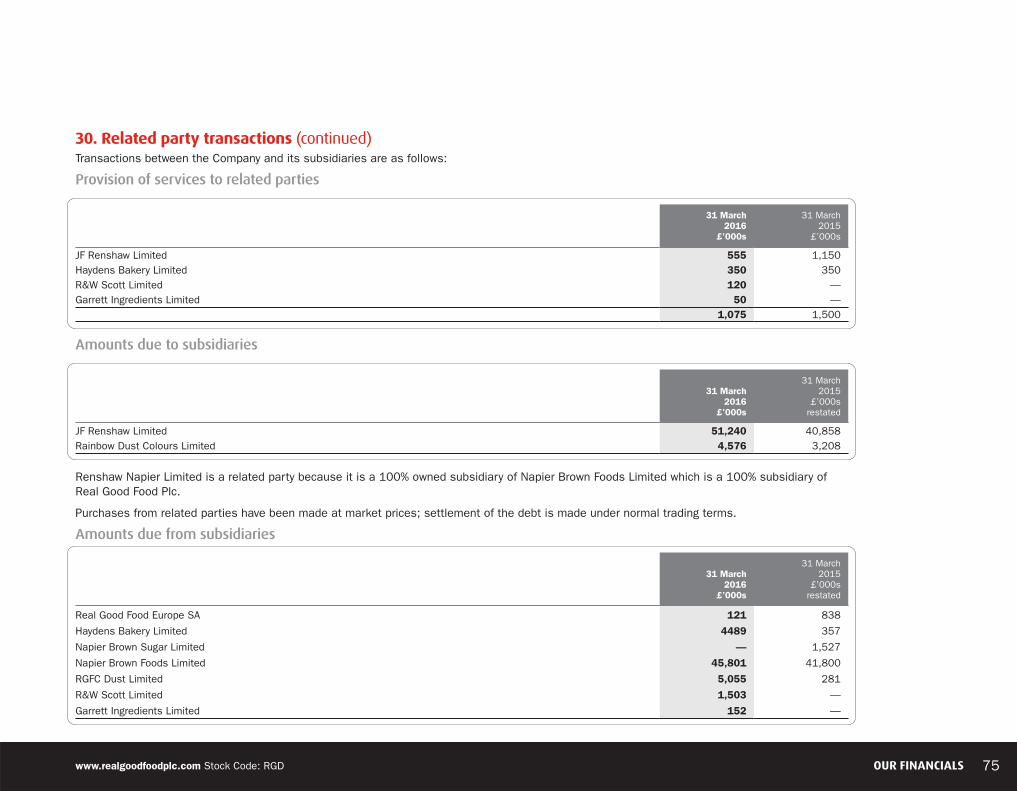
24831-02 - RGF AR 2016 2 August 2016 5:57 PM Proof 12
30. Related party transactions (continued) Transactions between the Company and its subsidiaries are as follows:
Provision of services to related parties
Amounts due to subsidiaries
Renshaw Napier Limited is a related party because it is a 100% owned subsidiary of Napier Brown Foods Limited which is a 100% subsidiary of Real Good Food Plc.
Purchases from related parties have been made at market prices; settlement of the debt is made under normal trading terms.
Amounts due from subsidiaries
31 March 2016
£’000s
31 March 2015
£’000s
JF Renshaw Limited 555 1,150Haydens Bakery Limited 350 350R&W Scott Limited 120 —Garrett Ingredients Limited 50 —
1,075 1,500
31 March 2016
£’000s
31 March 2015
£’000s restated
JF Renshaw Limited 51,240 40,858Rainbow Dust Colours Limited 4,576 3,208
31 March 2016
£’000s
31 March 2015
£’000s restated
Real Good Food Europe SA 121 838
Haydens Bakery Limited 4489 357
Napier Brown Sugar Limited — 1,527
Napier Brown Foods Limited 45,801 41,800
RGFC Dust Limited 5,055 281
R&W Scott Limited 1,503 —
Garrett Ingredients Limited 152 —
www.realgoodfoodplc.com Stock Code: RGD 75OUR FINANCIALS

24831-02 - RGF AR 2016 2 August 2016 5:57 PM Proof 12
notes to the Financial Statements (continued)year ended 31 March 2016
OUR FINANCIALS
Annual Report and Accounts for the year ended 31 March 201676
31. pensions arrangementsThe Group operates one defined benefits scheme which was closed to new members in 2000. From 1 April 2016 the Group annual contributions were agreed at £320k for 4 years 7 months. The Group is confident this will continue to meet the trustees’ needs and the pension regulator’s guidance.
In preparation for the disposal of the sugar business it was decided to transfer the liability for this scheme out of JF Renshaw Limited into Real Good Food plc.
For the purposes of IAS 19 the data provided for the 31 March 2012 actuarial valuation has been approximately updated to reflect liabilities on the accounting basis at 31 March 2016. This has resulted in a deficit in the scheme of £6,081,000.
It is the policy of the Company to recognise all actuarial gains and losses in the year in which they occur in the Statement of Comprehensive Income.
Present values of defined benefit obligations, fair value of assets and deficit
31 March 2016
£’000s
31 March 2015
£’000s
31 March 2014
£’000s
31 March 2013
£’000s
31 December 2012
£’000s
Present value of defined benefit obligation 21,094 21,799 19,033 19,153 17,085Fair value of plan assets (15,013) (16,111) (15,360) (15,613) (16,005)Deficit/(surplus) in plan 6,081 5,688 3,673 3,540 1,080Amount not recognised in accordance with IAS 19 — — — — —Gross amount recognised 6,081 5,688 3,673 3,540 1,080Deferred tax at 19% (2014 – 20%) (1,155) (1,138) (735) (814) (259)Net liability 4,926 4,550 2,938 2,726 821

24831-02 - RGF AR 2016 2 August 2016 5:57 PM Proof 12
www.realgoodfoodplc.com Stock Code: RGD 77OUR FINANCIALS
Reconciliation of opening and closing balances of the present value of the defined benefit obligations
Reconciliation of opening and closing balances of the fair value of plan assets
The actual return on the scheme assets over the period ended 31 March 2016 was £(575)k (2015 – £1,580k).
31 March 2016
£’000s
31 March 2015
£’000s
Defined benefit obligation at start of period 21,799 19,033Interest cost 738 857Actuarial losses (638) 3,122Benefits paid, death in service insurance premiums, expenses and past service costs (805) (1,213)Defined benefit obligation at end of period 21,094 21,799
12 months ended
31 March 2016
£’000s
12 months ended
31 March 2015
£’000s
Fair value of scheme assets at start of the period 16,111 15,360Interest income on scheme assets 547 695Actuarial (losses)/gains (1,122) 885Contributions paid by the Group 282 457Benefits paid, death in service insurance premiums and expenses (805) (1,286)Fair value of scheme assets at end of the period 15,013 16,111

24831-02 - RGF AR 2016 2 August 2016 5:57 PM Proof 12
notes to the Financial Statements (continued)year ended 31 March 2016
OUR FINANCIALS
Annual Report and Accounts for the year ended 31 March 201678
31. pensions arrangements (continued)Total expense recognised in the Statement of Comprehensive Income within other finance income
Statement of recognised income and expenses
Assets
None of the fair values of the assets shown above include any of the Group’s own financial instruments or any property occupied by, or other assets used by, the Group. All assets stated above have a quoted market price in an active market.
31 March 2016
£’000s
31 March 2015
£’000s
Interest on liabilities 738 857Interest on assets (547) (695)
Net Interest 191 162
Past service cost — 73
Total income 191 235
31 March 2016
£’000s
31 March 2015
£’000s
Actuarial (losses)/gain (1,122) 885Experience gains and losses arising on the scheme liabilities: loss — —Actuarial gains/(losses) arising from changes in demographic assumptions (42) (11)Actuarial gains/(losses) arising from changes in financial assumptions 680 (3,111)Total amount recognised in Statement of Other Comprehensive Income (484) (2,237)
31 March 2016
£’000s
31 March 2015
£’000s
31 March 2014
£’000s
UK equity 1,608 1,759 1,977Overseas equity 4,462 4,634 5,141Absolute return fund 3,826 4,126 3,929Bonds 1,020 933 1,798Gilts 2,104 1,382 645Property 72 354 301Cash 473 1,444 748Alternative assets 1,448 1,479 821
Total assets 15,013 16,111 15,360

24831-02 - RGF AR 2016 2 August 2016 5:57 PM Proof 12
www.realgoodfoodplc.com Stock Code: RGD 79OUR FINANCIALS
31. pensions arrangements (continued)
Assumptions
The mortality assumptions adopted at 31 March 2016 imply the following life expectancies:
Male retiring at age 65 in 2016 21.9 yearsFemale retiring at age 65 in 2016 23.9 yearsMale retiring at age 65 in 2036 23.2 yearsFemale retiring at age 65 in 2036 25.4 years
31 March 2016
% per annum
31 March 2015
% per annum
31 March 2014
% per annum
31 March 2013
% per annum
Inflation 2.80 2.90 3.30 3.20Salary increases — — — —Rate of discount 3.65 3.45 4.65 4.70Allowance for pension in payment increases 2.70 2.80 3.20 3.10Allowance for revaluation of deferred pensions 1.80 1.90 2.20 1.90Allowance for commutation of pension for cash at retirement 90% of max
allowance90% of max
allowance75% of max
allowance75% of max
allowance
Assumption Change in assumption Change in liability
Discount rate Increase/decrease of 0.5% p.a. Decrease/increase by 7.0%Rate of inflation Increase/decrease of 0.5% p.a. Increase/decrease by 2.0%Rate of mortality 1 year increase in life expectancy Increase by 4.0%

24831-02 - RGF AR 2016 2 August 2016 5:57 PM Proof 12
notes to the Financial Statements (continued)year ended 31 March 2016
OUR FINANCIALS
Annual Report and Accounts for the year ended 31 March 201680
31. pensions arrangements (continued)The long term expected rate of return on cash is determined by reference to UK long dated government bond yields at the balance sheet date. The long term expected return on bonds is determined by reference to UK long dated government and corporate bond yields at the balance sheet date. The long term expected rate of return on equities is based on the rate of return on bonds with an allowance for outperformance.
Expected long term rates of returnThe expected long term rates of return applicable at the start of each period are as follows:
32. Discontinued BusinessAs disclosed in the year end March 2015 accounts the Group disposed of its Napier Brown Sugar business on 19 May 2015. This disposal was consistent with the Group’s strategy for the sugar business and allows it to focus on its remaining businesses. The result of the disposed business is shown below.
31 March 2016
£’000s
31 March 2015
£’000s
31 March 2014
£’000s
31 March 2013
£’000s
31 March 2012
£’000s
Fair value of assets 15,013 16,111 15,360 15,613 16,005Defined benefit obligation (21,094) (21,799) (19,033) (19,153) (17,085)Surplus/(deficit) in scheme (6,081) (5,688) (3,673) (3,540) (1,080)Experience adjustment on scheme assets (1,122) 885 (382) 208 (984)Experience adjustment on scheme liabilities — — — (1,923) (46)
Year end 31 March
2016 £’000s
Year end 31 March
2015 £’000s
Revenue 13,237 128,288Cost of Sales (11,884) (117,924)Gross Margin 1,353 10,364Distribution (1,149) (9,938)Administration (288) (4,697)Operating Loss (84) (4,271)

24831-02 - RGF AR 2016 2 August 2016 5:57 PM Proof 12
www.realgoodfoodplc.com Stock Code: RGD 81OUR FINANCIALS
32. Discontinued operations (continued)
33. AcquisitionsThe Group acquired the trading and assets of a business called Chantilly Patisserie on 2 February 2016. This acquisition was transacted through Haydens Bakery Limited.
Chantilly Patisserie employs around 40 employees and produces high quality, hand made frozen desserts, supplying the food sector market.
The Real Good Food management believes that there are considerable synergies between Chantilly Patisserie and Haydens Bakery Limited and the acquisition is expected to bring mutual benefits to the two businesses, particularly in developing new products, producing production efficiencies and opening up new sales channels.
Calculation of profit on disposalTotal
£’000s
Disposal proceeds 44,408Assets disposed ofGoodwill (12,000)
Property plant and equipment (8,211)
Net Working Capital (10,706) (30,917)Disposal CostsLegal and consultancy fees (2,024)
Other costs arising directly from the sale of the business (2,322) (4,346)Profit on disposal 9,145
Assets held for saleMarch 2016
£000’sMarch 2015
£ 000’s
Goodwill — 12,000Property, plant and equipment — 7,980Inventories — 6,199Trade and other receivables — 14,829Other financial assets — 398Assets of Napier Brown business classified as held for sale — 41,406
Trade and other payables — 13,724Borrowings — 12,883Other financial liabilities — 398Liabilities of Napier Brown business classified as held for sale — 27,005Net assets of Napier Brown business held for sale — 14,401

24831-02 - RGF AR 2016 2 August 2016 5:57 PM Proof 12
notes to the Financial Statements (continued)year ended 31 March 2016
OUR FINANCIALS
Annual Report and Accounts for the year ended 31 March 201682
33. Acquisitions (continued)Table of the assets and liabilities acquired and the purchase consideration
Book Value
£’000
Fair Value Adjustment
£’000Total
£’000
Non-current assetsProperty, plant and equipment 108 — 108Business relationships — 405 405Current assetsInventories 132 — 132Trade and other receivables 411 — 411Cash and cash equivalents 2 — 2Total assets 653 405 1,058Current liabilitiesTrade and other payables 217 — 217Non current liabilitiesDeferred tax — 77 77Total liabilities 217 77 294Fair value net assets of businesses acquired 436 328 764Initial cash consideration paid 1,650Deferred consideration due 100Total consideration 1,750Goodwill arising on current year acquisition 986
Effect on 2016 ResultsThe business of Chantilly Patisserie generated revenue of £408k and a profit of £60k for the 2 months to 31 March 2016 which has been included in the consolidated figures within the Premium Bakery sector, see note 5 Segment analysis for further information.
Acquisition costs amounting to £306k have been shown as significant costs in the consolidated accounts of Real Good Food plc as disclosed in note 6 of the accounts.
A review of the assets and liabilities of the acquired business has been undertaken and it was determined that the trade debtors were all collectable and no provision was required.
It was determined that a value could be placed on intangible assets acquired as a result of the transaction, relating to business relationships that were in place. A value of £405k has been placed on these intangibles which are estimated to have a useful life of 2 years. Deferred tax of £77k has been recognised to impact on these accounts. Goodwill includes non identified, buyer specific synergies, know-how and workforce related industry specific knowledge. Increase in Group revenue of £2.5 million and additional profit of £0.5 million would have been reflected in these accounts if the acquisition had occurred at the start of this financial year.
34. Subsequent eventsAfter the balance sheet date the courts approved the Capital restructuring proposal which will have the effect of cancelling the share premium account and releasing the total value into distributable reserves. The effect of the capital restructuring will be reflected in the financial statements for the year ended 31 March 2017. The Board intend to review and implement a Group dividend policy as a result of this decision.

24831-02 - RGF AR 2016 2 August 2016 5:57 PM Proof 12
Advisers and company information
www.realgoodfoodplc.com Stock Code: RGD
DirectorsP W Totté D P Newman P G Ridgwell P C Salter C O Thomas J M d’Unienville
company SecretaryD P Newman
Registered officeInternational House 1 St Katharine’s Way London E1W 1XB
Registered number4666282
AuditorCrowe Clark Whitehill LLP 10 Palace Avenue Maidstone, Kent ME15 6NF
SolicitorsJoelson Wilson & Co. 30 Portland Place London W1B 1LZ
BankersLloyds Bank plc 5 St Paul’s Square Old Hall Street Liverpool L3 9SJ

24831-02 - RGF AR 2016 2 August 2016 5:57 PM Proof 12
Annual Report and Accounts For the year ended 31 March 2016 Stock code: RGD
Crea
te
Insp
ire
Enj
oyInternational House, 1 St Katharine’s Way, London E1W 1XBT 020 3056 1516 [email protected]
www.realgoodfoodplc.com
Real Good Food plc