Embed Size (px)
Citation preview

175
Abstract: Despite the well acknowledged importance of foreign direct investment (fdi) and efforts of sub-Sahara African (ssa) countries at attracting it, the region remains the least destination for fdi globally. Of course, several studies have en-en-deavored to examine the determinants of fdi in this region. This study contributes to the literature by examining a possible determinant of fdi that has received less attention in the literature: real exchange rate (rer) movements. This paper exam-ines this relationship with a view to determining the extent to which real ex-change rate movements stifle fdi inflows in selected ssa countries, employing the Granger causality and simultaneous estimation techniques. The use of simultane-ous equation is informed by the theoretical and empirical inconclusiveness on the relationship between movements in rer and fdi. The Granger Causality test fur-ther provides insight on the causal direction of the variables. Whereas the causal-ity tests suggest statistical dependence between rer movements and fdi for a few of the countries, the regression analyses show a statistically significant relation-ship between these variables. While the inclusion of pre-reform period in the study may have contributed to these results, the general picture emerging is that fdi flows are sensitive to reer movements in ssa.
Keywords: fdi, real exchange rate, Granger causality, system estimation, sub-Saharan Africa.
Tasa de cambio real e inversión extranjera directa en África subsahariana: Algunos resultados empíricos
Resumen: A pesar de la reconocida importancia de la inversión extranjera directa (fdi, por sus siglas en inglés) y de los esfuerzos de los países africanos al sur del Sahara (ssa, por sus siglas en inglés) para atraerla, la región sigue siendo el últi-mo destino de la fdi a nivel global. Desde luego, varios estudios se han ocupado de examinar los determinantes de la fdi en esta región. El presente estudio contribu-
Real Exchange Rate and Foreign Direct Investment in Sub-Saharan Africa Some Empirical Results
Oluremi Ogun, Festus O. Egwaikhide and Eric K. Ogunleye*Fecha de recepción: 4 de junio de 2009; fecha de aceptación: 16 de agosto de 2010.
*Oluremi Ogun, [email protected], senior lecturer, Festus O. Egwaikhide, [email protected], professor, Department of Economics, University of Ibadan, Ibadan, Nigeria; Eric Ke-hinde Ogunleye, [email protected], special assistant to the president/senior economist (International Trade and Finance), Office of the Chief Economic Adviser to the President, The Presidency, Federal Secretariat, Abuja, Nigeria.
economía mexicana nueva época, vol. XXI, núm. 1, primer semestre de 2012 . PP. 175-202

176 Ogun, Egwaikhide and Ogunleye: rer and Foreign Direct Investment in Sub-Saharan Africa
ye al examinar un posible determinante de la fdi que ha recibido menos atención en la literatura: los movimientos de la tasa de cambio real (rer, por sus siglas en inglés). Este documento examina esta relación con miras a determinar la medida en que los movimientos de la tasa de cambio real desalientan la entrada de flujos de fdi en determinados países del ssa, mediante el empleo de la causalidad de Granger y de técnicas de estimación simultánea. El uso de ecuaciones simultá-neas se caracteriza por la falta de una conclusión, tanto teórica como empírica, de la relación entre los movimientos de la rer y de la fdi. La prueba de causalidad de Granger provee un mayor entendimiento de la dirección causal de las variables. Mientras que las pruebas de causalidad sugieren dependencia estadística entre los movimientos de la rer y la fdi para unos cuantos países, los análisis de regre-sión muestran una relación estadísticamente significativa entre estas variables. Mientras la inclusión en el estudio del periodo anterior a la reforma puede haber contribuido a estos resultados, la visión general que emerge es que los flujos de la fdi son sensibles a los movimientos de la rer en el ssa.
Palabras clave: fdi, tasa de cambio real, causalidad de Granger, estimación del sistema, África al sur del Sahara.
jel Classification: F21, F31, O24.
Introduction
Volatile and dwindling inward foreign direct investment is a major fea-ture of most Sub-Sahara African (ssa) countries. Although the region
has benefited from the global rise in fdi inflows, there exists and remains a large and widening regional disparity in the pattern of flows between ssa and other developing regions, as the region continues to have the least global share. For instance, while Asia received about 22 per cent of the total fdi inflows in 2004, ssa received just about 2 per cent. On the average, ssa’s share of global annual inflows of fdi amounted to 1.2 per cent between 1990 and 2000. This figure contrasts sharply with an annual average of about 18 per cent for Asia. Also, while the average annual global share of fdi inflows between 1970 and 2005 was 14 per cent and 10 per cent in Asia and Latin America, respectively, ssa’s share was only about 2 per cent during the same period. Moreover, while Latin America’s share of world fdi in-flows rose by 11 per cent between 2005 and 2006, ssa experien ced a fall from a global share of 3 per cent to 2.7 per cent (unctad, 2007).
While several studies have sought to examine the sources of such lack of competitiveness for fdi, several factors have been identified (see, for in-stance, Ajayi, 2006). However, less attention has been devoted to the role of real exchange rate movements as a possible source of ssa’s lack of com-petitiveness for global fdi flows. Yet, the breakdown in the Bretton Woods system of fixed exchange rates in the 1970s has resulted in wider fluctua-

177economía mexicana nueva época, vol. XXI, núm. 1, primer semestre de 2012
tions in both nominal and real exchange rates in both developed and de-veloping countries (Maskus, 1986). These fluctuations became more pronounced in ssa from the early 1980s, when most of the countries ad-opted different types of flexible exchange rate system. On average, The International Monetary Fund’s (imf) International Financial Statistics (ifs) data revealed that exchange rate for the region has fluctuated be-tween 17 and 154 per cent since 1970. As we do know, the exchange rate movement is a major factor in the decision to engage in fdi.
There exists bourgeoning theoretical and empirical literature on the relationship between real exchange rate and fdi for developed countries, with risks being a major channel (Froot and Stein, 1991; Cushman, 1985). The argument is that the risk and uncertainty engendered by exchange rate movements induce a risk-averse foreign investor to change his for-eign investment decision. While so much has been done to investigate and establish this relationship for developed countries, little is known about the extent to which real exchange rate movements retard fdi in ssa. The aim of this paper is to examine this less investigated deterrence cause of fdi inflows into the ssa economies.
Following this introduction, section I provides background information on fdi and real exchange rate movements in the selected countries. Sec-tion II presents a review of the theoretical and empirical literature on the relationship between fdi and exchange rate movements. Section III gives insight on the empirical estimation procedures and data. Discourse on the empirical results is found in section IV, while section V concludes.
I. fdi and Real Exchange Rate in Sub-Saharan Africa
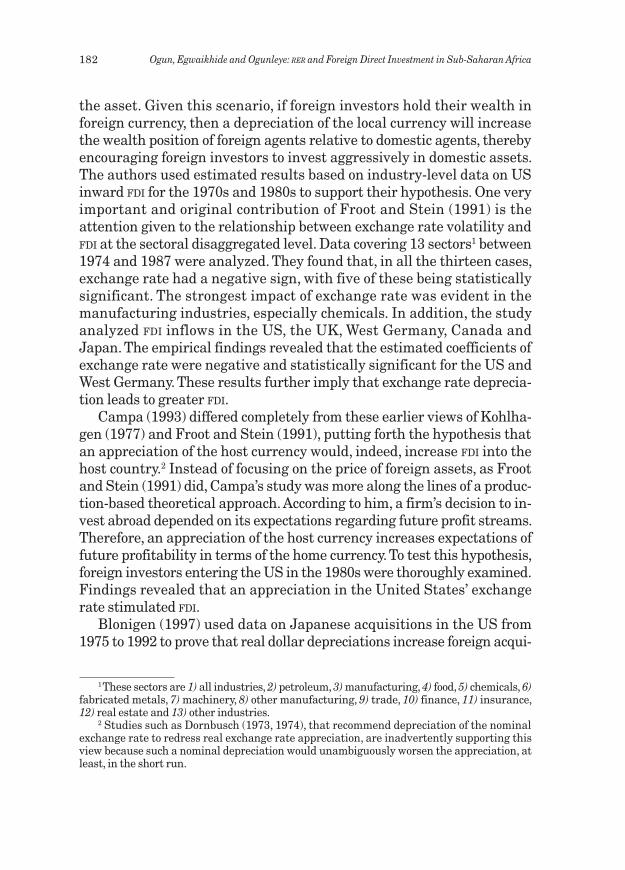
Generally, it has been acknowledged that ssa has been consistently unable to attract much fdi compared to other regions of the world. In addition to this, fdi inflows to these countries have also been volatile and dwindling (Egwaikhide et al., 2005). Figure 1 in the appendix reveals the movement in fdi inflows to the selected ssa countries. The data show that the flow of fdi to these countries was very low and stable in the 1970s. The average fdi inflow to these countries was 57.2 million US dollars between 1970 and 1979, with Nigeria having the highest average flow of 308.1 million US dollars, and Uganda the lowest, of about 0.5 million US dollars.
During the 1980s, a relatively low rise was observed in the average fdi inflow to these countries, with a figure of 87.1 million US dollars. All the countries experienced an increase in fdi inflows, except Ghana and South

178 Ogun, Egwaikhide and Ogunleye: rer and Foreign Direct Investment in Sub-Saharan Africa
Africa. However, the rise experienced by this group of countries differs across individual nations, with some of them experiencing a significant rise, while others a very modest one. Cameroon recorded the highest aver-age rise from about 17 to about 206 million US dollars. The rise in fdi inflows to these ssa countries appears to be a reflection of fdi enhancing tendency of financial globalization.
The following decade (1990s) witnessed a slight drop in the average fdi inflows to the ssa countries. From the previous average flow of 87.1 million US dollars in the 1970s, the average fdi inflows to these countries fell to 75.3 million US dollars in the 1980s. This fall may not be unconnected with the mild recession experienced in the industrial countries during this period, given the fact that a greater percentage of the flows comes from these countries. Another possible explanation for this fall in fdi inflows was the region’s unfavorable economic environment, which mostly resulted from incessant political and social upheavals and wars, insecuri-ty of investment, lack of infrastructure, weak regulatory and legal institu-tions and an unpredictable macroeconomic environment. A particular example of the unpredictable macroeconomic environment is the erratic movement in the exchange rates of these countries, noted in the preceding section. Unsurprisingly therefore, the fall in fdi inflows to these countries coincides with the period when most of them adopted a flexible exchan-ge rate policy that further increased the volatility of their real exchange rates.
Another notable feature of fdi inflows to ssa is the large inequality across countries (see table 1 in appendix). Specifically, South Africa and Nigeria attracted the greatest percentage of fdi inflows to the region during the period under review, with these countries attracting respec-tively a total of 6.6 and 5.0 billion US dollars of fdi in 2005. These values contrast sharply with the total inflows of 17.1 and 21.3 million US dollars for the Central African Republic (car) and Kenya, respectively. This seems to corroborate the view by some economists that resource-seeking is the major driver of fdi in ssa (see, e.g., unctad, 2008).
Until the 1980s, most ssa countries were operating the fixed exchange rate system. While some of them had a completely fixed exchange rate, others operated the pegged system. However, from the 1980s onwards most of these countries began to adopt the flexible exchange rate system. This change in policy was informed by the increased popularity of flexible exchange rate based on superiority claim vis-à-vis the fixed rate regime. Another major motivation for this policy change was the imf recommenda-

179economía mexicana nueva época, vol. XXI, núm. 1, primer semestre de 2012
tion of structural adjustment policies to correct structural imbalances in these economies.
In addition, large swings in economic variables resulting sometimes from sudden policy changes and reversals led to the observed incessant changes in foreign exchange rates in this region. Moreover, rising and unsteady inflation rates in these countries further aggravated the move-ments of the real exchange rates.
II. Theoretical Issues and Literature Review
The mechanisms through which the exchange rate level affect fdi flows have been examined in several theoretical and empirical studies. The general conclusion of these studies is that devaluation in the recipient country’s currency stimulates inflows of fdi, and conversely, an apprecia-tion leads to a reduction. Essentially, the literature identifies two main channels through which exchange rates impact fdi: wealth effect and relative production costs (Froot and Stein, 1991; Klein and Rosengren, 1994; Blonigen, 1997). Devaluation in the currency of a country receiving fdi leads to a reduction in local production costs in terms of foreign currency, raising the profits of export-oriented foreign investors accord-ingly. This suggests that higher returns naturally attract more fdi inflows. The wealth effect, which is the wealth of foreign investors relative to do-mestic investors, also rises following a devaluation because all production inputs become cheaper for the foreign investor whose capital is in a for-eign currency, and encourages the acquisition of more domestic assets.
Many empirical enquiries have confirmed that there is a strong rela-tionship between exchange rate level and fdi, and this prediction was first examined empirically by Makin (1974). The study concluded that the prevalent views in the 1960s that the United States was a permanent ex-porter of capital while countries like Germany and Japan were permanent importers of capital may be erroneous. He, however, noted that the ob-served direction of fdi flows could have been due to disequilibrium in ex-change rates, and that the flows would then be slowed or reversed by the yen and mark upward revaluations and the dollar devaluation. This find-ing is consistent with the earlier prediction of Houthakker (1962).
An interesting feature of the relationship between exchange rate and fdi can be gleaned from the work of Hinshaw (1975). The study proposes that, if there are two countries, one inflating and the other non-inflating but both operate fixed exchange rates, as the former country’s currency

180 Ogun, Egwaikhide and Ogunleye: rer and Foreign Direct Investment in Sub-Saharan Africa
becomes increasingly overvalued, exported goods would be removed one-by-one from its exporting schedule. Based on the same logic, goods previ-ously produced only domestically would also one-by-one be added to the importing schedule. The expectation here is that, as these previously exported goods are removed from the export schedule, they would one-by-one be added to the list of industries for which direct investment abroad becomes the only profitable means of maintaining foreign markets. Also, the attractiveness for foreign investors to invest in the domestic economy would be eliminated one-by-one as each industry is unable to compete favorably with foreign competitors. However, if the domestic country devalues, such pressures are removed, and the relative profitability of foreign versus domestic production is accordingly adjusted. One basic weakness of this and other previous studies, however, is that they did not provide a systematic theoretical basis for this relationship.
Alexander and Murphy (1975) were set to fill this vacuum by providing a formal theoretical and empirical basis for modeling the relationship be-tween exchange rates and fdi, using US data. This study developed and provided a relatively comprehensive analysis of the effects of exchange rate changes on capital flows overtime. The internal rate of return theory for the purpose of comparing alternative investment returns was explored in this study. It represents a theoretical reasoning which suggests that exchange rate devaluations in the host economy increase fdi in such econ-omy. The results were presented under different assumptions about the type of investment and effects of parity changes. These results generally support the contention that US dollar devaluations induced fdi inflows into the economy.
Prodded by the submissions of Alexander and Murphy (1975), Kohlha-gen (1977) developed a theoretical relationship and examined empirically the effect of exchange rate changes on fdi. A simple model of relative prof-itability in the alternative production locations was employed to show that when a devaluation has no effect on domestic and foreign prices, it will unambiguously increase the relative profitability of domestic produc-tion vis-à-vis production through a foreign subsidiary. The conditions un-der which this effect would still hold when domestic and foreign prices are affected by exchange rate changes were articulated. In analyzing the effect of devaluation on the relocation decision of foreign investors, Kohl-hagen (1977) concluded that these enterprises tend to increase their pro-duction capacity abroad to meet domestic market needs, if the currency of the host country is devalued against the investor’s home currency. How-

181economía mexicana nueva época, vol. XXI, núm. 1, primer semestre de 2012
ever, this study does not seem to provide sufficiently rigorous basis for its conclusion because the theoretical framework employed for the analysis was borrowed from the theory of capital control, developed by Herring and Willett (1972), making it ad hoc.
A couple of other studies on the relationship between exchange rates and fdi were carried out during this same period. One of these, by Logue and Willett (1977), attempted to provide both theoretical and empirical evidence on this relationship in the case of the US, by employing the port-folio balance approach to fdi flows. It was established that devaluation of the dollar improved fdi inflows to the US economy. Commenting on the findings of this study, Stevens (1977) presented another model of the prof-it-maximizing international firm, showing that if direct investment is a function only of the profit maximizing level of output of the foreign subsid-iary, a devaluation can have any effect on a country’s direct investment abroad, depending on the various effects on the costs and revenues of the firm. In a further comment, Stevens (1977) investigated the response to expectations concerning future exchange rates and concluded that a foreign firm expecting currency devaluation in a foreign country of inter-est would defer fdi until after the devaluation, when it would be more profitable relative to exporting.
The apparent weakness in these previous works led Froot and Stein (1991) to provide a more rigorous theoretical basis for the now apparent relationship between exchange rate and fdi. The authors claimed that changes in the level of exchange rate may influence fdi because a deprecia-tion of the exchange rate increases the relative wealth of foreign investors, thereby increasing the attractiveness of the host country for fdi as firms are able to acquire assets in the host country relatively cheaply.
Contrary to this position, it is often argued that what should matter for an investment decision is not the price of assets, but only their rate of return. This argument is based on the premise that when the host coun-try’s currency depreciates relative to that of the home country, both the price and nominal return of the assets in the host country currency falls. Given this scenario, it is believed that exchange rate movements should not affect fdi. Froot and Stein (1991) countered this argument with the submission that when capital markets are subject to information imper-fections, exchange rate movements would, in fact, influence fdi. Informa-tion asymmetry causes a divergence between internal and external financing, making the latter more expensive than the former, since the lenders incur monitoring costs and thus lend less than the full value of
182 Ogun, Egwaikhide and Ogunleye: rer and Foreign Direct Investment in Sub-Saharan Africa
the asset. Given this scenario, if foreign investors hold their wealth in foreign currency, then a depreciation of the local currency will increase the wealth position of foreign agents relative to domestic agents, thereby encouraging foreign investors to invest aggressively in domestic assets. The authors used estimated results based on industry-level data on US inward fdi for the 1970s and 1980s to support their hypothesis. One very important and original contribution of Froot and Stein (1991) is the attention given to the relationship between exchange rate volatility and fdi at the sectoral disaggregated level. Data covering 13 sectors1 between 1974 and 1987 were analyzed. They found that, in all the thirteen cases, exchange rate had a negative sign, with five of these being statistically significant. The strongest impact of exchange rate was evident in the manufacturing industries, especially chemicals. In addition, the study analyzed fdi inflows in the US, the UK, West Germany, Canada and Japan. The empirical findings revealed that the estimated coefficients of exchange rate were negative and statistically significant for the US and West Germany. These results further imply that exchange rate deprecia-tion leads to greater fdi.
Campa (1993) differed completely from these earlier views of Kohlha-gen (1977) and Froot and Stein (1991), putting forth the hypothesis that an appreciation of the host currency would, indeed, increase fdi into the host country.2 Instead of focusing on the price of foreign assets, as Froot and Stein (1991) did, Campa’s study was more along the lines of a produc-tion-based theoretical approach. According to him, a firm’s decision to in-vest abroad depended on its expectations regarding future profit streams. Therefore, an appreciation of the host currency increases expectations of future profitability in terms of the home currency. To test this hypothesis, foreign investors entering the US in the 1980s were thoroughly examined. Findings revealed that an appreciation in the United States’ exchange rate stimulated fdi.
Blonigen (1997) used data on Japanese acquisitions in the US from 1975 to 1992 to prove that real dollar depreciations increase foreign acqui-
1 These sectors are 1) all industries, 2) petroleum, 3) manufacturing, 4) food, 5) chemicals, 6) fabricated metals, 7) machinery, 8) other manufacturing, 9) trade, 10) finance, 11) insurance, 12) real estate and 13) other industries.
2 Studies such as Dornbusch (1973, 1974), that recommend depreciation of the nominal exchange rate to redress real exchange rate appreciation, are inadvertently supporting this view because such a nominal depreciation would unambiguously worsen the appreciation, at least, in the short run.

183economía mexicana nueva época, vol. XXI, núm. 1, primer semestre de 2012
sitions involving firm-specific assets by Japanese firms in the US. This argument differs from that of Froot and Stein (1991), although they both have the same outcome. While Froot and Stein (1991) showed that ex-change rate movements are important because capital markets are im-perfect, Blonigen (1997), on the other hand, found that exchange rate movements matter because, even though domestic and foreign firms may have the same opportunities to purchase firm-specific assets in the domes-tic market, foreign and domestic firms do not have the same opportunities to generate returns on these assets in foreign markets. Due to the unequal level of access to markets, exchange rate movements may affect the rela-tive magnitude of fdi. Blonigen made the point that assets related to fdi should not be considered similar to assets such as bonds. However, such is not the case with assets related to fdi because the assets of a target firm could be firm-specific and may thus generate returns simultaneously in several markets without involving any foreign currency transactions (see also Klein and Rosengren, 1994; Dewenter, 1995).
Sazanami, Yoshimura and Kiyota (2003) is another significant study that examined the impact of exchange rate level on fdi at the sectoral level, with specific focus on the Japanese fdi to four machinery industries between 1978 and 1999. The study showed that real exchange rates had strong effects on fdi in industries with stronger effects in electronics and general ma-chinery industries, than in precision or transportation industries.
One major weakness of these studies, however, is that none of them considered the destination of fdi. Therefore, Kiyota and Urata (2004) ex-tended the existing works in two areas, using the Japanese fdi data. First, the study analyzed aggregate fdi by considering its destinations. Second, the analytical framework adopted by Froot and Stein (1991) and Klein and Rosengren (1994) was extended by incorporating the impacts of the failures of the law of one price between different markets on exchange rate volatility. Employing the feasible generalized least squares (fgls) methodology with heteroscedastic error term and the assumption that the variance for each country differs, they found that, at the aggregate level, the movement in the exchange rate had a statistically significant impact on fdi. This finding corroborates Sazanami, Yoshimura and Kiyota (2003). However, industry level results indicated different findings in terms of the magnitude of the coefficients. In the case of fdi destination, the real ex-change rate was found to have the same effects on fdi for all the East Asian countries and for ten out of eleven cases in the Latin American re-gion. This emphasized that overvaluation of the host country’s currency

184 Ogun, Egwaikhide and Ogunleye: rer and Foreign Direct Investment in Sub-Saharan Africa
discourages Japanese fdi, thus stressing the need to maintain a stable exchange rate and avoid overvaluation in order to attract fdi.
It is noteworthy from this survey that studies exploring the relationship between exchange rate and fdi in ssa are very scarce. It was only in a recent study that Mwega and Ngugi (2005) considered the effects of the exchange rate level on fdi inflows in Kenya. The results showed that real exchan ge rate depreciation has a positive effect on fdi inflows in the country. This sup-ports the proposition that exchange rate depreciation attracts fdi inflows to host economies; quite the opposite of the view represented by Campa (1993).
Another recent study based on the experiences of African economies is Ogunleye (2008). This study examines the effects of both the movement in the levels and volatility of exchange rate on fdi inflows in nine selected African countries. Consistent with the submission in Mwega and Ngugi above, the study generally finds that exchange rate depreciation induces fdi inflows, while appreciation retards it. On the other hand, the impact of exchange rate movements on fdi is found to be significant only in coun-tries with large fdi inflows.
In summary, there appears to be a lack of clear-cut direction on the ef-fect of appreciation and depreciation in the host country’s exchange rate on fdi inflows. However, the nature of the effect of real exchange rate on fdi appears to depend on the nature and motive of the investment and the risk behavior of the investor.
III. Data Issues and Estimation Procedure
Given the focus of this paper, fdi and real exchange rate are the prominent data required for the analysis. The fdi data used in this study is real and scaled as a percentage of gdp. This data is sourced from the United Na-tions Conference on Trade and Development (unctad) database. The ex-change rate data is the real effective exchange rate. This variable is the nominal effective exchange rate3 divided by a price deflator or index of costs, and is based on a nominal rate adjusted for relative changes in con-sumer prices. This data is extracted from the International Monetary Fund’s International Financial Statistics, September 2007. Our data on domestic and foreign inflation rates is measured as consumer price index, which reflects changes in the cost to the average consumer of acquiring a
3 The nominal effective exchange rate is a measure of the value of a currency against a weighted average of several foreign currencies.

185economía mexicana nueva época, vol. XXI, núm. 1, primer semestre de 2012
basket of goods and services that may be fixed or changed annually. Inter-est rate is measured in real terms as the interest rate charged by banks on loans to prime customers, less the inflation rate. gdp is similarly measured in real terms, and is sourced from the World Bank’s World Development Indicators cd-rom, 2007.
The data required for this analysis are time-series annual observations, spanning 1970 to 2005 for both the selected ssa countries and their foreign investment partners. The ssa countries are Botswana, Cameroon, Central African Republic, Ghana, Kenya, Nigeria, South Africa and Uganda. Spe-cifically, the variables used include the consumer price index (π), foreign cpi (π*), interest rate differential (i-i*) [which measures the interest rate dif-ference between the oecd countries (high and non-high income) and the respective countries], real gdp (rgdp) and real interest rate (rintrt). The oecd countries are considered because they are the prominent trade part-ners of the selected ssa countries.
Next, we present the estimation procedure for examining the causal relationship on the likely interdependence between fdi and real exchange rate, employing the vector autoregressive (var), time-series Granger cau-sality and simultaneous estimation techniques. The most widely used analysis of causality is the Granger definition of causality. This analysis is based on Granger (1969) and Sims (1972). The Granger causality test as-sumes that the relevant information for the prediction of the variables is found only in the time-series data. The analysis examines the possibility of the current value of a variable Y being explained by the past values of an-other variable Z, over and above the explanations provided by past chang-es in Y. It also helps to establish whether adding lagged values of the variable can improve the explanation. Otherwise, the conclusion will be that Z does not Granger cause Y. The same analysis can be done the other way around. The test between fdi and exchange rate undertaken in this paper involves estimating the following bivariate linear regressions:
FDIt = λ 0 + Σ λi FDIt– i + Σ ∂ j RERt– j + Ut
m m
i =1 j =1
RERt = λ 0 + Σ λi RERt– i + Σ ∂ j FDIt– j + εt
m m
i =1 j =1
(1)
(2)
Equation (1) postulates that current fdi is related to its own past values as well as those of real exchange rate. On the other hand, equation (2) posits

186 Ogun, Egwaikhide and Ogunleye: rer and Foreign Direct Investment in Sub-Saharan Africa
that the current value of real exchange rate is related to its own past val-ues and those of fdi. In this analysis, four possible outcomes can be identi-fied. The first is unidirectional causality running from fdi to real exchange rate. The second another unidirectional causality, but running from real exchange rate to fdi. The third possibility is bidirectional or feedback or bi-lateral causality between fdi and real exchange rate. This is a case where the set of coefficients of fdi and real exchange rate are both statistically and significantly different from zero in the two equations. The fourth outcome is statistical independence, that is, neither causes the other. In this case, both fdi and real exchange rate coefficients are not statistically significant.
The theoretical and empirical inconclusiveness on the relationship be-tween real exchange rate and fdi calls for this kind of methodology that takes cognizance of possible interdependence between the variables. To do this, we employ the vector autoregressive (var) methodology. This meth-odology is commonly employed for forecasting systems of interrelated time series. It sidesteps the need for structural modeling by treating every endogenous variable in the system as a function of their lagged values. Assuming that the var contains two lagged values of the endogenous vari-ables, it may be mathematically written as:
(3)
Here, aij, bij and ci are the parameters to be estimated.The third method employed in investigating the fdi-real exchange rate
nexus is the simultaneous technique, whereby both variables are jointly determined. This specification follows Kosteletou and Liargovas (2000).
For our purpose, the following system of equations is estimated:
(4)
FDIt = a 11 FDIt–1 + a
12 RERt–1 + b11 FDIt–2 + b
12 RERt–2 + c1 + ε
1t
RERt = a 22 FDIt–1 + a
22 RERt–1 + b
21 FDIt–2 + b22 RERt–2 + c2
+ ε 2t
Δ log REERt= Δ log(FDI
t)
(?)
,πt
(+ )
,π *
t
(− )
, it
(+ )
, i − i*t
(+ )⎛
⎝
⎜⎜⎜
⎞
⎠
⎟⎟⎟
Δ log FDIt= Δ log(REER
t)
(?)
,Δ log(Y )(+ )
Δ log(Y *
t)
(+ )
,Δ log(Rt)
(− )⎛
⎝
⎜⎜⎜
⎞
⎠
⎟⎟⎟
Δ log REERt= Δ log(FDI
t)
(?)
,πt
(+ )
,π *
t
(− )
, it
(+ )
, i − i*t
(+ )⎛
⎝
⎜⎜⎜
⎞
⎠
⎟⎟⎟
Δ log FDIt= Δ log(REER
t)
(?)
,Δ log(Y )(+ )
Δ log(Y *
t)
(+ )
,Δ log(Rt)
(− )⎛
⎝
⎜⎜⎜
⎞
⎠
⎟⎟⎟

187economía mexicana nueva época, vol. XXI, núm. 1, primer semestre de 2012
reer is the real exchange rate represented by the real effective exchange rate in the respective countries, fdi is the foreign direct investment mea-sured in real terms as a percentage of gdp, π symbolizes inflation rate, i represents nominal interest rate, i − i* stands for interest rate differential between the domestic and the foreign country, Y represents income and R is the real interest rate. It should be noted that the variables with * at the superscript are for foreign countries, while t at the subscript denotes the current period.
IV. Empirical Results
To examine the relationship between fdi and real exchange rate, we apply three econometric techniques. The selection of variables and lag length were based on diagnostic tests for autocorrelation and the Schwarz and Akaike information criteria. As a prelude to the analysis, the time series properties of the variables are investigated.
IV.1. Unit Root Tests
All the time series data of our variables of interest are tested in order to determine their time series properties. To ensure robustness of the en-quiry, both the parametric approach [based on the Augmented Dickey-Fuller (adf) test, proposed by Dickey and Fuller (1979, 1981)] and the semi-parametric Philips-Perron test [based on Philips and Perron (1988)] were used. The test results presented in table 2 in the appendix indicate that the logarithm of both fdi and reer are nonstationary at levels. How-ever, the first differences of all of both series are stationary. Thus, the vari-ables are integrated of order one, that is, I(1).
IV.2. Vector Autoregressive Tests (var)
The first estimation technique is the var method, given the theoretical pos-tulations on the relationship between fdi and real exchange rate changes. The var results show that the relationship between fdi and real exchange rate is inconclusive in the countries examined (see table 3 in the appen-dix). The effect of real exchange rate movements on fdi is found to be un-ambiguously negative only in the cases of Botswana, the Central African Republic, Ghana and South Africa. This implies that an appreciation in the domestic currencies of these countries will unambiguously lead to a de-

188 Ogun, Egwaikhide and Ogunleye: rer and Foreign Direct Investment in Sub-Saharan Africa
cline in fdi inflows. Similarly, it is only in the cases of Kenya and Uganda that real exchange rate has unambiguous positive effects on fdi, suggest-ing that currency appreciation rather improves fdi inflows in these coun-tries. In all other cases, the effect of real exchange rate on fdi is either positive in the first lag and ne gative in the second, or vice versa. In all these results, statistically significant effects are observed in the second lag for Cameroon and Nigeria only.
Turning to the results on the effects of fdi on real exchange rate, we found results similar to the analysis above. In the cases of Botswana, the Central African Republic and Uganda, fdi seems to have unambiguous negative sign, while unambiguous positive sign is observed in Cameroon and Kenya. For the remaining countries, the effect of fdi on real exchange rate is either positive in the first lag and negative in the second, or vice versa. In all of the models, it is only in the cases of Cameroon and Ghana that significant effects are recorded at the second and first lag, respectively. These findings seem to confirm the theoretical postulation and earlier em-pirical findings that the relationship between real exchange rate and fdi varies across countries, regions and sectors.
IV.3. Direction of Causality
The causality between changes in fdi and reer has not drawn much atten-tion in the literature. There appears to be an implicit assumption that causality runs from exchange rate to fdi. In what follows, we provide a formal analysis of the direction of causality between fdi and reer in the selected ssa countries. The causality applied here is the Granger causality test based on Granger (1969), and is as earlier defined. However, the ca-veat as expressed in Harvey (1990) is that causality is too strong a word, and thus Granger causality should be limited to the narrow concept of se-quentiality and predictability.
The results of the pair-wise Granger causality tests for the changes in fdi and real exchange rate are presented in table 4 in the appendix. The Granger causality test results show that it is only in the cases of Cameroon and Ghana that causality is established, and while this relationship is bidirectio nal for Cameroon, causality rather runs one-way from fdi to real exchange rate in Ghana, and not the other way around. In all other cases, there is statistical independence between real exchange rate and fdi. These results seem to cor-roborate the var results that there exists some uncertainty about the relation-ship between real exchange rate and fdi flows in ssa.

189economía mexicana nueva época, vol. XXI, núm. 1, primer semestre de 2012
In Cameroon, changes in fdi lead to changes in real exchange rate, but changes in real exchange rate also induce changes in fdi. This sug-gests that in the case of real exchange rate depreciation due to move-ments in any of the exchange rate fundamentals, foreign investors will tend to increase their investment in the economy. The logic behind this action is that exchange rate depreciation leads to a reduction in the do-mestic economy vis-à-vis foreign countries. Thus, investors in their bid to take advantage of the reduced cost of production in the economy tend to intensify investment in the country experiencing currency depreciation. The large fdi inflows induced by currency depreciation, if unchecked and depending on where such capital goes, may lead to undesirable conse-quences such as the Dutch Disease. The Dutch Disease is the consequence of the appreciation in real exchange rate resulting from large capital in-flows that may ultimately lead to a shift in the production structure from tradables to non-tradables. In an effort to prevent such undesirable occurrence, policymakers should attempt to reduce the pressure on do-mestic currency depreciation by tightening the money supply through raising the domestic interest rate. Alternatively, such foreign capital can be used to shore up foreign reserves that may be ultimately used to in-tervene in the foreign exchange market with the aim of stabilizing the domestic currency. This demonstrates the possible channel for the ob-served bidirectional relationship between fdi and real exchange rate in Cameroon.
In Ghana, where the causality runs from changes in fdi to real ex-change rate changes, one possible cause of the large fdi inflows into the country is the relative macroeconomic stability the country has experi-enced over a long period of time, coupled with the monetary authority’s inability to manage the exchange rate effectively. However, in recent times, where the Central Bank is more independent in pursuing mone-tary policy, there appears to be a change, as the exchange rate has been better controlled. In addition, the currency revaluation that was carried out in 2007 has further strengthened the exchange rate and reduced cur-rency fluctuations.
IV.4. System Estimation
Our next line of investigation involves specifying and estimating a sys-tem of two models, where the relationship between real exchange rate and fdi are simultaneously examined for the selected countries using the

190 Ogun, Egwaikhide and Ogunleye: rer and Foreign Direct Investment in Sub-Saharan Africa
two-stage-least-squares methodology.4 The models are specified in a log-linear differenced form. The model is appropriately instrumented to en-sure validity of the results obtained. The results are presented in tables 5 and 6 in the appendix.
The perverse signs of the estimated coefficients for the price indexes, interest rates and real output in some of the countries are obvious. This is not unconnected with the peculiarities of each economy. For instance, in large economies like Nigeria and South Africa, where a reasonable per-centage of fdi is aimed at production for the domestic market, market size (represented by domestic gdp) has a statistically significant positive effect on fdi inflows. This contrasts sharply with a small economy like Botswa-na, where a greater percentage of fdi inflows are meant for exports. In this case, foreign gdp has a stronger impact on fdi inflows.
The estimated coefficients for the effects of fdi on real exchange rate are statistically significant at the 1 per cent level for Uganda, and at the 10 per cent level for Botswana, Nigeria and South Africa. The corresponding coef-ficients for all other countries are not significantly different from zero. One important finding emanating from this is that for fdi to significantly in-duce changes in exchange rate, such fdi inflows must be consistently high. This explains why it is countries like Botswana, Nigeria and South Africa, with very significant fdi inflows, that this could be established.
The effect of real exchange rate on fdi is statistically significant at the 10 percent level or better for Botswana at the first lag, Cameroon for both the level and the first lag, and Nigeria and South Africa at the first lag. While the magnitudes of the estimated coefficients differ across countries, one important finding discernible from this result is that real exchange rate influences fdi inflows with a lag. It also appears that the effects of real exchange rate on fdi are more pronounced for countries with a float-ing exchange rate system vis-à-vis countries with currency pegging. How-ever, major currency devaluation and volatile macroeconomic factors might explain the statistically significant positive effect of real exchange rate movements on fdi in Cameroon.
Generally, the estimated negative effect of fdi on real exchange rate appears to provide a modest support for the monetary approach to real
4 The recurring problem of singular matrix precludes us from conducting a cointegration analysis. In any case, our focus in the study is the short run.

191economía mexicana nueva época, vol. XXI, núm. 1, primer semestre de 2012
exchange rate determination. It also seems to corroborate the trade inte-grated model. An exogenous rise in capital inflows in most ssa countries induced expenditure in domestic consumption for both traded and non-traded goods, thus causing appreciation in their real exchange rates. The findings on the relationship between real exchange rates and fdi imply that exchange rate policies could be a potent tool for influencing fdi, while at the same time fdi policies would serve as effective tools for influencing real exchange rates in ssa.
V. Conclusion
This paper explored the relationship between real exchange rate and fdi for selected ssa countries. Both globalization of financial markets and capital account liberalization by most ssa countries present challenges for exchange rate movements and financial flows, especially fdi. The findings of this paper have shown that there exists a relationship between real exchange rate and fdi in ssa. While the study could not establish a clear-cut relationship in terms of direction of causality for most of the countries, the regression estimates do reveal a pattern of relationship. The effects of fdi on exchange rate changes are found to be significant in Nigeria, South Africa and Botswana. A resonating finding emanating from this is that for fdi to significantly induce changes in exchange rate, such fdi inflows must be consistently high, as demonstrated in these coun-tries for the most part of the period investigated. On the other hand, sta-tistically significant effects of real exchange rate on fdi are established for Botswana, Cameroon, Nigeria and South Africa, though with varying magnitudes. The resounding finding here is that, in many cases, real ex-change rate influences fdi inflows with a lag. There is also a tendency that the effects of real exchange rate on fdi are more pronounced for countries with a floating exchange rate system vis-à-vis those with currency pe-gging. Generally, the empirical models suggest a negative relationship be-tween real exchange rate and fdi, thus suggesting that real exchange rate management is crucial for attracting fdi in ssa. Thus, monetary authori-ties should fashion and implement effective exchange rate management policies in ssa countries. There is also need for policy coordination between monetary and fiscal authorities to ensure that fiscal policy does not un-dermine the efforts of monetary authorities at managing exchange rate effectively.

192 Ogun, Egwaikhide and Ogunleye: rer and Foreign Direct Investment in Sub-Saharan Africa
References
Ajayi, S. I. (2006), Foreign Direct Investment in Sub-Saharan Africa: Ori-gins, Targets, Impact and Potential, Nairobi, African Economic Re-search Consortium.
Alexander, S. and C. J. Murphy (1975), “Exchange Rates and Direct Inter-national Investment”, working paper 71, Southern Methodist Univer-sity, Department of Economics.
Blonigen, B. (1997), “Firm-Specific Assets and the Link between Exchange Rates and Foreign Direct Investment”, American Economic Review, 87 (3), pp. 447-465.
Campa, J. (1993), “Entry by Foreign Firms in the US under Exchange-Rate Uncertainty”, Review of Economics and Statistics, 75 (4), pp. 614-622.
Cushman, D. O. (1985). “Real Exchange Rate Risk, Expectations and the Level of Direct Investment”, The Review of Economics and Statistics, 67 (2), pp. 297-308.
Dewenter, K. (1995), “Do Exchange Rate Changes Drive Foreign Direct Investment?”, Journal of Business, 68 (3), pp. 405-433.
Dickey, D. A. and W. A. Fuller (1979), “Distribution of Estimators for Auto-regressive Time Series with a Unit Root”, Journal of the American Sta-tistical Association, 74 (366), pp. 427-431.
______ (1981), “Likelihood Ratio Statistics for Autoregressive Time Series with a Unit Root”, Econometrica, 49 (4), pp. 1057-1072.
Dornbusch, R. (1973), “Money, Devaluation and Non-Traded Goods”, Ame-rican Economic Review, 63 (5), pp. 871-880.
______ (1974), “Tariffs and Non-Traded Goods”, Journal of International Economics, 4 (2), pp. 117-185.
Egwaikhide, F. O., E. Udoh, K. I. Obiora and E. K. Ogunleye (2005), “Fo-reign Direct Investment in the West African Monetary Zone: An Asses-sment of Flows, Volatility and Growth”, West African Journal of Mone-tary and Economic Integration, 5 (2a), pp. 137-150.
Froot, K. and J. Stein (1991), “Exchange Rates and Foreign Direct Invest-ment: An Imperfect Capital Markets Approach”, Quarterly Journal of Economics, 106 (4), pp. 1191-1217.
Granger, C. W. J. (1969), “Investigating Causal Relationship by Econometric Models and Cross Spectral Methods”, Econometrica, 37 (3), pp. 424-458.
Harvey, A. C. (1990), The Econometric Analysis of Time Series, second edi-tion, Cambridge, MA, The mit Press.
Herring, R. and T. D. Willett (1972), “The Capital Control Program and the

193economía mexicana nueva época, vol. XXI, núm. 1, primer semestre de 2012
US Investment Activity Abroad”, Southern Economic Journal, 39 (1), pp. 58-71.
Hinshaw, R. (1975), “Non-Traded Goods and Balance of Payments: Fur-ther Reflections”, Journal of Economic Literature, 13 (2), pp. 475-479.
Houthakker, H. S. (1962), “Should We Devalue the Dollar?”, Challenge, 11 (1), October.
Kiyota, K. and S. Urata (2004), “Exchange Rate, Exchange Rate Volatility and Foreign Direct Investment”, The World Economy, 27 (10), pp. 1501-1536.
Klein, M. and E. Rosengren (1994), “The Real Exchange Rate and Foreign Direct Investment in the United States”, Journal of International Eco-nomics, 36 (3-4), pp. 374-389.
Kohlhagen, S. (1977), “Exchange Rate Changes, Profitability and Direct Foreign Investment”, Southern Economic Journal, 44 (1), pp. 43-52.
Kosteletou, N. and P. Liargovas (2000), “Foreign Direct Investment and Real Exchange Rate Interlinkages”, Open Economies Review, 11 (2), pp. 135-148.
Logue, D. and T. D. Willet (1977), “The Effects of Exchange Rate Adjust-ment on International Investment”, in P. B. Clark, D. Logue and R. Sweeney (eds.), The Effects of Exchange Rate Adjustments, Washington, D.C., US Government Printing Office.
Makin, J. H. (1974), Capital Flows and Exchange Rate Flexibility in the Post-Bretton Woods Era, Princeton Essays in International Finance 103, Princeton.
Maskus, K. E. (1986), “Exchange Rate Risk and U.S. Trade: A Sectoral Analysis”, Federal Reserve Bank of Kansas City Economic Review, March.
Mwega, F. M. and R. W. Ngugi (2005), “Foreign Direct Investment in Ken-ya”, a final report submitted to the African Research Economic Re-search Consortium, Nairobi.
Ogunleye, E. K. (2008), “Exchange Rate Volatility and Foreign Direct In-vestment Inflows in Selected Sub-Sahara African Countries, 1970-2005”, PhD diss., University of Ibadan, Ibadan.
Phillips, P. C. B. and P. Perron (1988), “Testing for a Unit Root in Time Se-ries Regression”, Biometrika, 75 (2), pp. 335-346.
Sazanami, Y., S. Yoshimura and K. Kiyota (2003), “Japanese Foreign Di-rect Investment to East Asia and Exchange Rate Policies: Some Longer Term Policy Implications after the Crisis”, Keio Economic Studies, 40 (1), pp. 1-26.

194 Ogun, Egwaikhide and Ogunleye: rer and Foreign Direct Investment in Sub-Saharan Africa
Sims, C. (1972), “Money, Income and Causality”, American Economic Re-view, 62 (4), pp. 540-552.
Stevens, G. V. G. (1977), “Comment”, en P. B. Clark, D. Logue and R. Sweeney (eds.), The Effects of Exchange Rate Adjustments, Washing-ton, D.C., US Government Printing Office.
unctad (United Nations Conference on Trade and Development) (2007), World Investment Report, New York and Geneva, United Nations.
_______ (2008), World Investment Directory, Volume X, Africa, New York and Geneva, United Nations.

195economía mexicana nueva época, vol. XXI, núm. 1, primer semestre de 2012
Appendix
Source: unctad fdi database, accessed on January 17th, 2009.
1970
1972
1974
1976
1978
1980
1982
1984
1986
1988
1990
1992
1994
1996
1998
2000
2002
2004-2000
8000
6000
4000
2000
0
Mill
ion
$
Kenya
Botswana
Uganda
South Africa
Cameroon
Ghana
Central African Republic
Nigeria
Figure 1. Pattern of fdi inflows to the selected ssa countries, 1970-2005

196 Ogun, Egwaikhide and Ogunleye: rer and Foreign Direct Investment in Sub-Saharan Africa
Tabl
e 1.
fd
i inf
low
s in
sel
ecte
d su
b-Sa
hara
Afr
ican
cou
ntri
es ($
Mill
ion)
Year
/cou
ntry
Bot
swan
aC
amer
oon
Cen
tral
Afr
ican
R
epub
lic
Gha
naK
enya
Nig
eria
Sou
th A
fric
aU
gand
a
1970
-197
925
.66
20.0
64.
4321
.73
30.6
731
9.62
92.2
20.
69
1980
-198
962
.67
95.6
25.
048.
7230
.42
433.
9914
.16
0.99
1990
-199
915
.89
28.4
60.
8811
3.47
20.9
61
494
.06
850.
3271
.97
1970
-200
710
3.19
99.8
85.
3795
.64
49.7
91
652
.39
846.
2687
.70
2000
57.3
215
8.80
0.84
165.
9011
0.91
1 3
09.6
688
7.92
180.
81
2001
30.8
473
.29
5.18
89.3
05.
301
277
.42
6 7
88.7
215
1.50
2002
404.
6260
1.75
4.30
58.9
027
.63
2 0
40.1
81
572
.77
184.
65
2003
419.
538
3.00
12.9
010
5.40
81.7
42
171
.39
733.
6720
2.19
2004
391.
5531
9.34
15.1
113
9.27
46.0
62
127
.09
799.
2329
5.42
2005
281.
3222
4.66
17.1
114
4.97
21.2
84
978
.26
6 6
43.7
837
9.81
2006
488.
8030
8.99
18.1
163
6.00
50.7
313
956
.49
-527
.10
400.
25
2007
494.
9028
4.33
27.2
185
5.40
728.
0112
453
.74
5 6
92.0
736
7.90
Sou
rce:
un
cta
d f
di d
atab
ase,
acc
esse
d on
Jan
uary
17th
, 200
9.

197economía mexicana nueva época, vol. XXI, núm. 1, primer semestre de 2012
Table 2. The unit root test results for selected variables
Country Variable adf Phillips-Perron Conclusion
Level First difference
Level First difference
Botswana fdi -1.762 -11.307 -4.757 -23.417 I(1)
reer -2.081 -6.822 -2.081 -7.151 I(1)
Cameroon fdi -1.028 -6.001 -1.019 -6.009 I(1)
reer -2.364 -7.066 -2.381 -7.066 I(1)
car fdi -1.578 -6.093 -1.398 -6.234 I(1)
reer 0.409 -10.410 0.489 -10.436 I(1)
Ghana fdi 1.652 -3.999 -2.482 -5.490 I(1)
reer -2.292 -10.735 -2.492 -8.471 I(1)
Kenya fdi -1.768 -10.060 -1.466 -12.374 I(1)
reer -1.101 -6.230 -1.217 -6.356 I(1)
Nigeria fdi -2.482 -5.490 -2.437 -5.490 I(1)
reer -0.016 9.289 -0.479 -9.431 I(1)
South Africa
fdi -2.749 -6.799 -2.459 -6.864 I(1)
reer 0.228 -11.979 -3.729 -13.448 I(1)
Uganda fdi -0.390 -6.507 -1.238 -6.591 I(1)
reer 1.051 -6.656 -0.065 -11.242 I(1)
Source: Authors’ own computation. Note: The critical values are -3.64, -2.95 and -2.61 at the 1%, 5% and 10% levels, respectively.

198 Ogun, Egwaikhide and Ogunleye: rer and Foreign Direct Investment in Sub-Saharan Africa
Tabl
e 3.
va
r E
stim
atio
n re
sult
s
Bot
swan
aC
amer
oon
Cen
tral
Afr
ican
Rep
ubli
cG
hana
fd
ir
ee
rf
di
re
er
fd
ir
ee
rf
di
re
er
FD
I(-1)
-0.0
018
[-0.
0092
]-0
.275
3[-
1.65
82]
0.0
239
[ 0.0
636]
0.1
517
[ 0.9
512]
-0.0
635
[-0.
2779
] -
0.05
808
[-0.
2546
] 0
.016
5[ 0
.070
7]
0.32
49*
[ 2.3
213]
FD
I(-2)
-0.
5129
*[-
2.42
24]
-0.0
259
[-0.
1467
] 0
.668
5[ 1
.855
7]
0.5
576*
*[ 3
.647
4]-0
.018
1[-
0.07
85]
-0.0
261
[-0.
1136
]-0
.195
8[-
0.80
34]
-0.0
235
[-0.
1605
]
RE
R(-
1)-0
.227
9[-
0.84
77]
-0.0
166
[-0
.073
67]
0.2
509
[ 0.3
765]
-0.2
585
[-0.
9142
]-0
.086
4[-
0.37
68]
-0.0
995
[-0.
4348
]-0
.145
0[-
0.40
53]
0.2
269
[ 1.0
551]
RE
R(-
2)-0
.160
2[-
0.63
61]
0.1
526
[ 0.7
248]
-1.
4556
*[-
2.14
78]
-0
.887
5**
[-3.
0858
]-0
.065
9[-
0.28
69]
-0.0
789
[-0.
3444
]-0
.116
3[-
0.35
81]
0.0
851
[ 0.4
361]
R-s
quar
ed 0
.256
7 0
.148
6 0
.232
2 0
.416
0 0
.014
7 0
.018
3 0
.086
9 0
.310
2
F-s
tati
stic
1.6
400
0.8
289
1.4
367
3.3
840
0.0
711
0.0
883
0.4
524
2.1
356
Sou
rce:
Aut
hors
’ ow
n co
mpu
tati
on. *
**, *
* an
d *
impl
y st
atis
tica
l sig
nific
ance
at t
he 1
%, 5
%, a
nd 1
0% le
vels
, res
pect
ivel
y.

199economía mexicana nueva época, vol. XXI, núm. 1, primer semestre de 2012
Tabl
e 3.
va
r E
stim
atio
n re
sult
s (c
onti
nuat
ion)
Ken
yaN
iger
iaS
outh
Afr
ica
Uga
nda
fd
ir
ee
rf
di
re
er
fd
ir
ee
rf
di
re
er
fd
i(-1)
-0
.665
9**
[-3.
3421
] 0
.013
4[ 0
.191
3]-0
.022
7[-
0.32
76]
0.2
203
[ 0.6
629]
-0.0
121
[-0.
1002
]-0
.000
8[-
0.00
24]
-0.4
326
[-0.
9372
]-0
.175
4[-
1.00
94]
fd
i(-2)
-0.
4265
*[-
2.13
91]
0.0
529
[ 0.7
535]
0.0
165
[ 0.2
381]
-0.0
211
[-0.
0634
] 0
.056
6[ 0
.468
8] 0
.417
1[ 1
.258
3]-0
.468
8[-
1.05
48]
-0.0
962
[-0.
5751
]
re
r(-
1) 0
.510
5[ 0
.835
7] -
0.45
35*
[-2.
1048
] 0
.055
3[ 1
.128
2]-0
.015
9[-
0.06
78]
-0.0
975
[-1.
2349
]-0
.127
4[-
0.58
78]
0.9
759
[ 0.7
908]
0.5
352
[ 1.1
525]
re
r(-
2) 0
.869
1[ 1
.415
6]-0
.285
9[-
1.32
03]
-0.
0949
*[-
1.90
94]
-0.1
457
[-0.
6109
]-0
.035
8[-
0.45
28]
-0.3
404
[-1.
5681
] 1
.274
5[ 1
.088
1] 0
.445
2[ 1
.010
0]
R-s
quar
ed 0
.399
2 0
.223
1 0
.239
9
0.0
3799
0.0
968
0.1
506
0.1
304
0.2
008
F-s
tati
stic
3.1
564
1.3
635
1.4
995
0.1
876
0.5
092
0.8
424
0.7
123
1.1
931
Sou
rce:
Aut
hors
’ ow
n co
mpu
tati
on. *
**, *
* an
d *
impl
y st
atis
tica
l sig
nific
ance
at
the
1%, 5
%, a
nd 1
0% le
vels
, res
pect
ivel
y.

200 Ogun, Egwaikhide and Ogunleye: rer and Foreign Direct Investment in Sub-Saharan Africa
Country Null hypothesis F-statistic Probability
Botswana fdi ≠ reer
reer ≠ fdi
1.39093 0.55189
0.27306 0.58482
Cameroon fdi ≠ reer
reer ≠ fdi
2.83701 6.67105
0.08354* 0.00639***
car fdi ≠ reer
reer ≠ fdi
0.10337 0.03740
0.90230 0.96336
Ghana fdi ≠ reer
reer ≠ fdi
0.24273 2.74392
0.78688 0.08977*
Kenya fdi ≠ reer
reer ≠ fdi
1.06072 0.29908
0.36583 0.74493
Nigeria fdi ≠ reer
reer ≠ fdi
2.55939 0.22094
0.10370 0.80379
South Africa fdi ≠ reer
reer ≠ fdi
0.83208 0.79227
0.45039 0.46722
Uganda fdi ≠ reer
reer ≠ fdi
1.40982 0.73521
0.26860 0.49256
Source: Authors’ own computation. Notes: ≠ implies does not Granger cause. *** and * denote existence of Granger causality at the 1%, and 10% level, respectively.
Table 4. Bivariate Granger causality results

201economía mexicana nueva época, vol. XXI, núm. 1, primer semestre de 2012
Tabl
e 5.
Rel
atio
nshi
p be
twee
n re
al e
xcha
nge
rate
cha
nges
and
fd
i in
ssa
Equ
atio
n (1
): D
epen
dent
var
iabl
e is
∆lo
g (r
ee
r)
Cou
ntry
∆log
(RE
ER
t-1 )
∆lo
g(F
DI t )
ππ*
ii-
i*R
2L
M(1
)L
M(2
)
Bot
swan
a
-0.
5236
***
(-
5.77
25)
-0
.180
6**
(-
2.59
93)
0
.767
2***
(
7.49
530)
0.06
41
(0.7
219)
0.20
54
(1.5
507)
0.01
50
(0.0
471)
0.82
860.
11(0
.75)
0.26
(0.7
7)
Cam
eroo
n
-0.
4115
***
(-
4.93
49)
-
0.13
32
(-1.
8595
)
0.2
215*
**
(6.
0640
)-0
.165
1**
(-
3.44
15)
-0
.046
7
(-1.
1174
)
-0.1
407*
(2
.095
2)0.
9192
0.01
(0.9
4)0.
02(0
.98)
ca
r-0
.289
7(-
1.34
76)
0.08
267
(
0.46
34)
-0
.024
56
(-0.
2369
)
0.
1107
(0
.638
9)
0.
0256
(0
.148
7)
0.
9754
**
(2.5
935)
0.49
160.
02(0
.89)
2.06
(0.1
6)
Gha
na
0.
0127
(
0.04
94)
0.13
74
(0.7
729)
-
0.14
79
(1.
0049
)
0.
2682
*
(1.9
809)
0.09
66
(0.9
880)
-0
.037
8
(-0.
1123
)0.
4659
0.90
(0.3
6)0.
50(0
.62)
Ken
ya
-0.
8217
***
(-
3.94
62)
0.07
63
(1.
3632
)
0.1
759
(
1.36
81)
-0
.225
8*
(-1.
9289
)
0.
1232
(1
.127
6)
-0.3
574
(-
1.57
71)
0.67
721.
17(0
.29)
5.05
(0.0
2)
Nig
eria
-
0.26
27
(-0.
9531
)
-1.6
956*
*
(-2.
1233
)
0.2
196
(0
.662
7)
-0.5
894*
*
(-2.
4465
)
-0.9
928
(-1
.226
9)
-0.2
581
(-
0.81
98)
0.53
290.
19(0
.67)
1.79
(0.2
1)
Sout
hA
fric
a
-0.
3277
**
(-2.
4578
)
-0.4
976*
*
(-2.
5586
)
-0.3
565
(-
1.37
54)
-0
.100
6
(-0.
5333
)
1.3
387*
**
(4.4
297)
-0
.979
7
(-1.
4522
)0.
6569
0.03
(0.8
6)0.
65(0
.54)
Uga
nda
-
0.29
91
(-1.
2349
)-0
.286
4***
(-
7.35
17)
-0
.001
9
(-0.
0278
)
0.0
261
(0
.477
4)
0.0
491
(0
.910
3)
0.0
187
(0
.303
2)0.
7820
1.57
(0.2
2)0.
75(0
.49)
Sou
rce:
Aut
hor’s
ow
n co
mpu
tati
on. N
otes
: The
val
ues
in b
rack
ets
are
the
t-st
atis
tic;
***
, **
and
* im
ply
stat
isti
cal s
igni
fican
ce a
t the
1%
, 5%
, and
10%
le
vels
, res
pect
ivel
y. lm
is th
e L
agra
nge
mul
tipl
ier f
or fi
rst o
r fou
rth
orde
r aut
ocor
rela
tion
.

202 Ogun, Egwaikhide and Ogunleye: rer and Foreign Direct Investment in Sub-Saharan Africa
Tabl
e 6.
Rel
atio
nshi
p be
twee
n re
al e
xcha
nge
rate
cha
nges
and
fd
i in
ssa
Equ
atio
n (2
): D
epen
dent
var
iabl
e is
∆lo
g(f
di)
Cou
ntry
∆lo
g(R
EE
Rt )
∆lo
g(R
EE
Rt-
1 )
∆lo
g(F
DI t-
1 )
∆lo
g(G
DP
t )∆
log
(GD
P* t )
∆lo
g(R
INT
RT
t )R
2L
M(1
)L
M(2
)
Bot
swan
a
0.3
203
(1
.254
9)
-0.5
236*
** (
-5.7
725)
-0.9
621*
**
(-4.
6408
)
-0.2
239
(-0
.270
9)
-0.3
445*
(-1
.925
3)
-2.1
016*
* (
-2.9
246)
0
.513
8
5
.85
(0.0
2)
3
.46
(
0.06
)
Cam
eroo
n 1
.422
8***
(4
.304
3)
1.6
871*
*
(3.0
915)
-1
.026
1**
(-
3.43
74)
0
.484
1
(0.8
588)
-0
.163
4 (
-0.5
931)
0
.563
4*
(1.9
322)
0
.644
6
0
.45
(0.5
1)
0
.31
(
0.74
)
ca
r
-0.3
141
(-0
.992
6)
-0.2
487*
* (
-2.8
410)
-0
.793
0**
(-
3.08
32)
-0
.148
8 (
-0.4
327)
0
.177
4
(0.4
832)
0
.073
9
(0.4
217)
0
.435
2
0
.11
(0.7
5)
0
.16
(
0.86
)
Gha
na
0.1
349
(0
.299
2)
-0.3
838
(-0
.980
8)
-0.1
279
(-
0.47
14)
1
.585
7
(1.1
312)
-0
.726
9* (
-2.1
443)
0
.085
7
(0.5
771)
0
.377
9
0
.78
(0.3
9)
5
.29
(
0.02
)
Ken
ya
-0.0
481
(0
.081
8)—
-0.9
696*
**
(-4.
1089
)
0.4
597
(0
.643
1)
0.5
348
(0
.783
7)
-0.1
474
(-0
.352
8)
0.5
488
8.8
2(0
.01)
7.5
3
(0.
01)
Nig
eria
0
.027
4
(0.3
041)
0
.096
1**
(2
.968
4)
-0.5
969*
*
(-2.
4822
)
1.1
043*
*
(2.6
299)
0
.538
1
(1.5
294)
-0
.041
9 (
-0.1
769)
0
.562
5
0
.02
(0.9
0)
0
.83
(
0.46
)
Sout
hA
fric
a
0.2
268
(1
.350
0)
0.0
027*
(2
.023
1)
-0.4
274
(-
1.72
66)
0
.483
8**
(2
.970
3)
-0.0
445
(-0
.133
2)
-0.2
189
(-0
.693
7)
0.5
287
0.9
5(0
.34)
2.4
5
(0.
12)
Uga
nda
1
.480
1**
(3
.549
3)
-0.1
327
(-0
.236
5)
0.1
303
(0
.629
9)
1.0
287*
*
(2.4
623)
0
.712
2**
(2
.385
9)
-0.0
376
(-0
.317
9)
0.8
885
0.0
4(0
.84)
0.0
9
(0.
92)
Sou
rce:
Aut
hor’s
ow
n co
mpu
tati
on. N
otes
: The
val
ues
in b
rack
ets
are
the
t-st
atis
tic;
***
, **
and
* im
ply
stat
isti
cal s
igni
fican
ce a
t the
1%
, 5%
, and
10%
le
vels
, res
pect
ivel
y. lm
is th
e L
agra
nge
mul
tipl
ier f
or fi
rst o
r fou
rth
orde
r aut
ocor
rela
tion
.