Embed Size (px)
Citation preview
HAL Id: hal-01847942https://hal.archives-ouvertes.fr/hal-01847942
Preprint submitted on 24 Jul 2018
HAL is a multi-disciplinary open accessarchive for the deposit and dissemination of sci-entific research documents, whether they are pub-lished or not. The documents may come fromteaching and research institutions in France orabroad, or from public or private research centers.
L’archive ouverte pluridisciplinaire HAL, estdestinée au dépôt et à la diffusion de documentsscientifiques de niveau recherche, publiés ou non,émanant des établissements d’enseignement et derecherche français ou étrangers, des laboratoirespublics ou privés.
Real exchange rate and competitiveness of an EU’sultra-peripheral region: La Reunion Island
Fabien Candau, Michaël Goujon, Jean-François Hoarau, Serge Rey
To cite this version:Fabien Candau, Michaël Goujon, Jean-François Hoarau, Serge Rey. Real exchange rate and competi-tiveness of an EU’s ultra-peripheral region: La Reunion Island. 2013. �hal-01847942�
Centre d’Analyse Théorique et de Traitement des données économiques
CATT-UPPA UFR Droit, Economie et Gestion Avenue du Doyen Poplawski - BP 1633 64016 PAU Cedex Tél. (33) 5 59 40 80 01 Internet : http://catt.univ-pau.fr/live/
CATT WP No. 6 October 2013
REAL EXCHANGE RATE AND
COMPETITIVENESS OF AN EU'S ULTRA-PERIPHERAL REGION:
LA REUNION ISLAND
Fabien CANDAU Michaël GOUJON
Jean-François HOARAU Serge REY
1
Real exchange rate and competitiveness of an EU’s ultra-peripheral region: La Reunion Island
Fabien CANDAU CATT-UNIV PAU & PAYS ADOUR
Michaël GOUJON CERDI, University of Auvergne
Jean-François HOARAU CEMOI, University of LaReunion
Serge REY CATT-UNIV PAU & PAYS ADOUR
September 2013
Abstract:
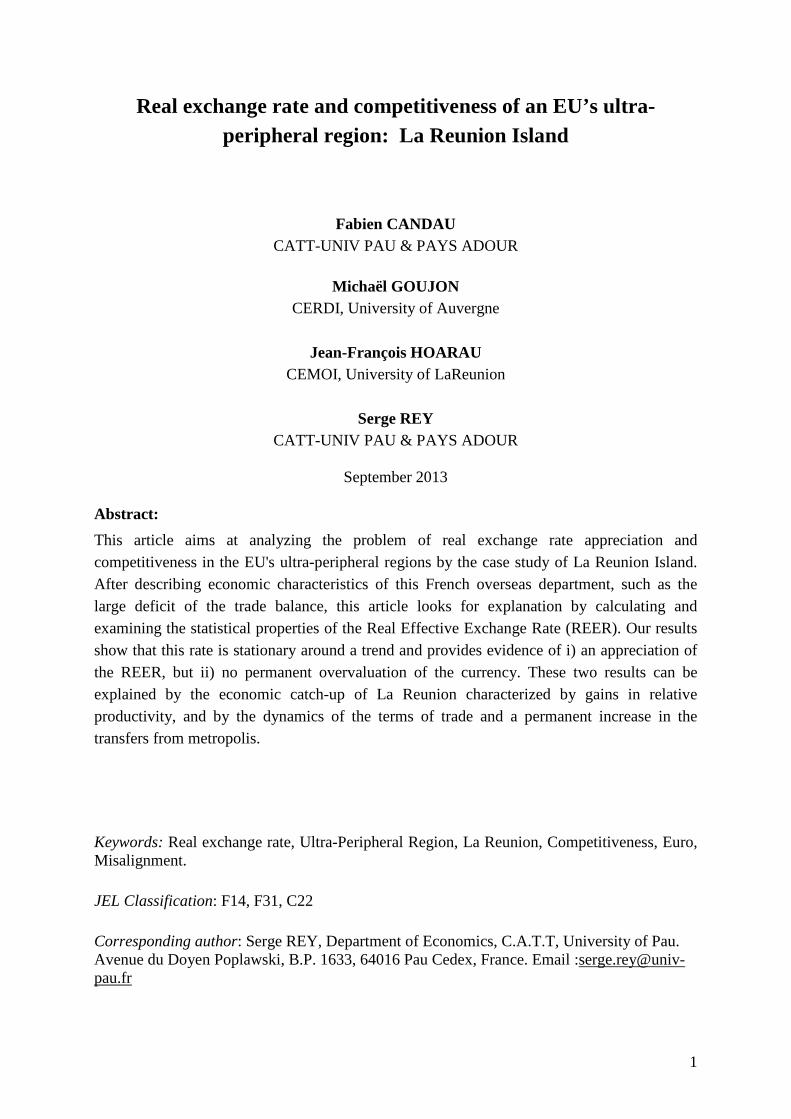
This article aims at analyzing the problem of real exchange rate appreciation and competitiveness in the EU's ultra-peripheral regions by the case study of La Reunion Island. After describing economic characteristics of this French overseas department, such as the large deficit of the trade balance, this article looks for explanation by calculating and examining the statistical properties of the Real Effective Exchange Rate (REER). Our results show that this rate is stationary around a trend and provides evidence of i) an appreciation of the REER, but ii) no permanent overvaluation of the currency. These two results can be explained by the economic catch-up of La Reunion characterized by gains in relative productivity, and by the dynamics of the terms of trade and a permanent increase in the transfers from metropolis.
Keywords: Real exchange rate, Ultra-Peripheral Region, La Reunion, Competitiveness, Euro, Misalignment.
JEL Classification: F14, F31, C22 Corresponding author: Serge REY, Department of Economics, C.A.T.T, University of Pau. Avenue du Doyen Poplawski, B.P. 1633, 64016 Pau Cedex, France. Email :[email protected]
2
Real exchange rate and competitiveness of an EU’s ultra-peripheral region: Reunion Island
1. Introduction
The outermost regions of Europe, with more than 4 millions of inhabitants (Eurostat, 2011), represent a particular challenge for the European integration. Located in the Atlantic and Indian Oceans, in the Caribbean Sea and in South America, these regions are eloquently defined along remoteness, small size, economic dependency on a few products and insularity.1These ultra-peripheral regions are the four French overseas departments (Reunion, Guadeloupe, French Guyana and Martinique), two Portuguese autonomous regions (Azores and Madeira) and one Spanish autonomous community (Canary Islands)2. The Euro is the official currency in these regions, which is problematic in term of competitiveness when exchange rate changes, driven by the overall situation of the Euro Zone, are disconnected from economic fundamentals in these islands. Actually, ultra-peripheral regions may face the same problem than some Southern European countries. Obviously, overseas departments receive transfers from the metropolitan country that represent a major difference, but this advantage could fade away in a near future. Austerity and budget constraints in Europe will inevitably lead to a reduction in transfers and many politicians in ultra-peripheral regions fear to lose an important instrument of adjustment. With less transfers, economic conditions of development can deteriorate with increasing risks of instability and poverty. In this context, a strong Euro is devastating for exports but brings purchasing power on imports that characterized these regions. The current article focuses on La Reunion Island that is representative of many problems encounter by an ultra-peripheral region. Conclusions that can be drawn from our study may contribute to the debate on specialization and suboptimal monetary union. Basic development indicators show that despite significant improvements, gaps between La Reunion and its metropolitan patron remain relatively large. Concerning the GDP per capita, according to INSEE [The French Statistical Office], the level of La Reunion represents only 37% and 59% of the national average in 1985 and 2008 respectively3. Furthermore these results are supported in all the three dimensions of the Human Development Index, health, education and standard of living (Goujon, 2008, 2009; Sudrie, 2012).The vulnerability of this small island is also pronounced in the external dimension (Candau et al., 2012). The export rate is particularly low, averaging 6% of GDP in 2005 and the ratio of exports to imports is stable around 6-7% only since the beginning of the 1990s. The current trade balance deficit increased continuously over the last three decades to exceed 25% of GDP in the late 2000s.
1See Article 299 of the European Community Treaty. 2On 11July 2012,the European Council recommended that Mayotte (French department in the Indian Ocean) take the status of an “ultra-peripheral region” of the European Union as of1 January2014. 318200 € against 30700 € in 2008.
3
Such economic results would suggest a lack of competitiveness. In order to analyze such a possibility for La Reunion, we adopt in this article a medium run macroeconomic perspective. More precisely, we calculate a usual indicator in international economics, the Real Effective Exchange Rate (REER, Hinkle and Nsengiyumva, 1999) against the major trade partners over the last decades. We find that REER fluctuations result from changes in the nominal exchange rate but also from inflation rate differentials between La Reunion and its trade partners. Moreover, the REER shows an appreciation trend. This outcome should imply a loss in competitiveness if not caused by an improvement in fundamentals, as an increase in the relative productivity. So, we try to identify whether this appreciation trend is associated to an equilibrating or a disequilibrating movement.
In a first step, using quarterly data, we follow Kejriwal and Lopez (2013) and verify that there is no structural break in the REER series. Then, we can use a set of standard unit root tests (Dickey, Fuller, 1981; Phillips, Perron, 1988; Kwiatkowski et al., 1992; Elliott et al., 1996; Ng, Perron, 2001),which show that La Reunion’s REER is stationary around a deterministic trend. In a second step, using annual data, we try to explain the appreciation trend by estimating an equation for REER’s fundamentals. Results show that REER is driven by gains in productivity, terms of trade and public transfers.
In a third step, REER misalignments are computed as the gap between observed REER and the equilibrium REER defined as a simple deterministic trend or as the predicted REER from the equation of REER’s fundamentals. Both methods detect similar phases of misalignments, and estimated misalignments are found to be small.
The rest of the paper is as follows. Section 2 gives several stylized facts about the structure of La Reunion’s foreign trade and the catching up effect at work. Section 3 presents analytical elements of the REER. Section 4 reports computations of the bilateral and multilateral levels of the real exchange rates for La Reunion over the period 1990-2010. Section 5examines the statistical properties of the REER using the different unit root tests mentioned above. In this section, we also introduce a first estimation of the REER misalignment. Finally, Section 6 concludes.
2. Trade structure and trade performances of La Reunion
The weak economic performances of La Reunion Island has been studied both at microeconomic and long term macroeconomic perspectives (Dimou, 2004, Jean-Pierre, 2007). Here we adopt a medium run macroeconomic perspective by focusing on the international competitiveness4. Indeed, as showed below, La Reunion’s economy is characterized by a large trade balance deficit, which is a usual suspect for a deficiency in competitiveness.
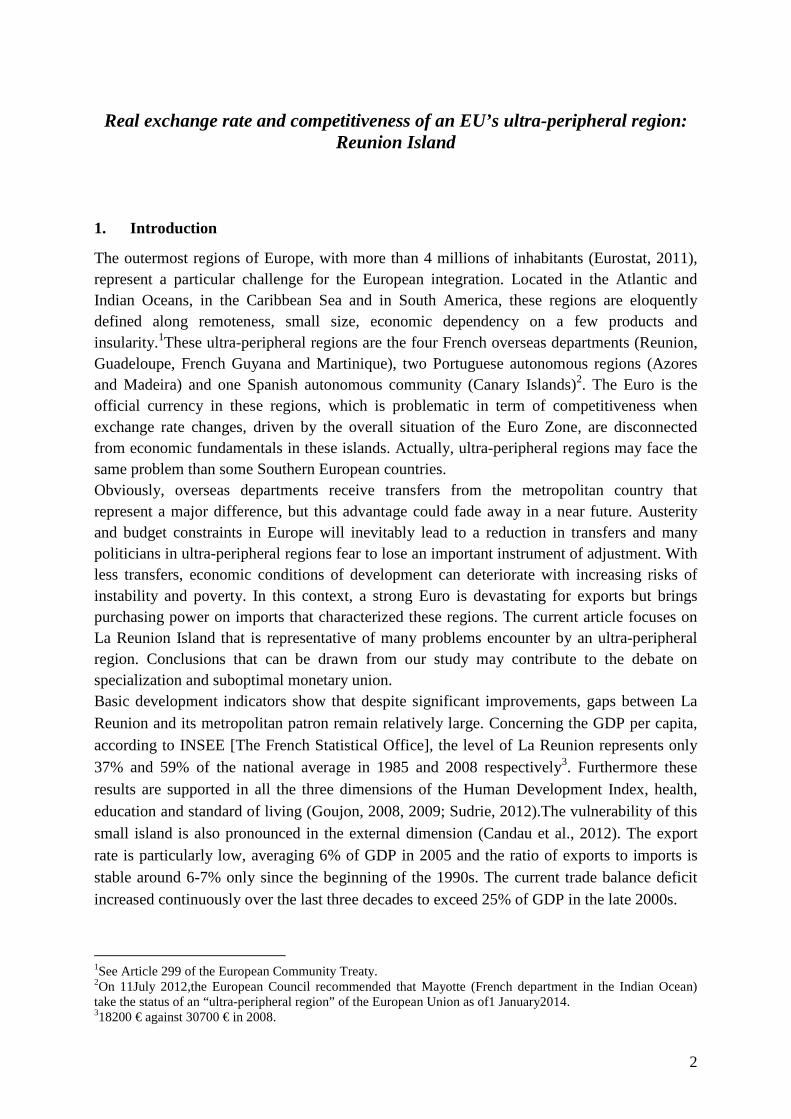
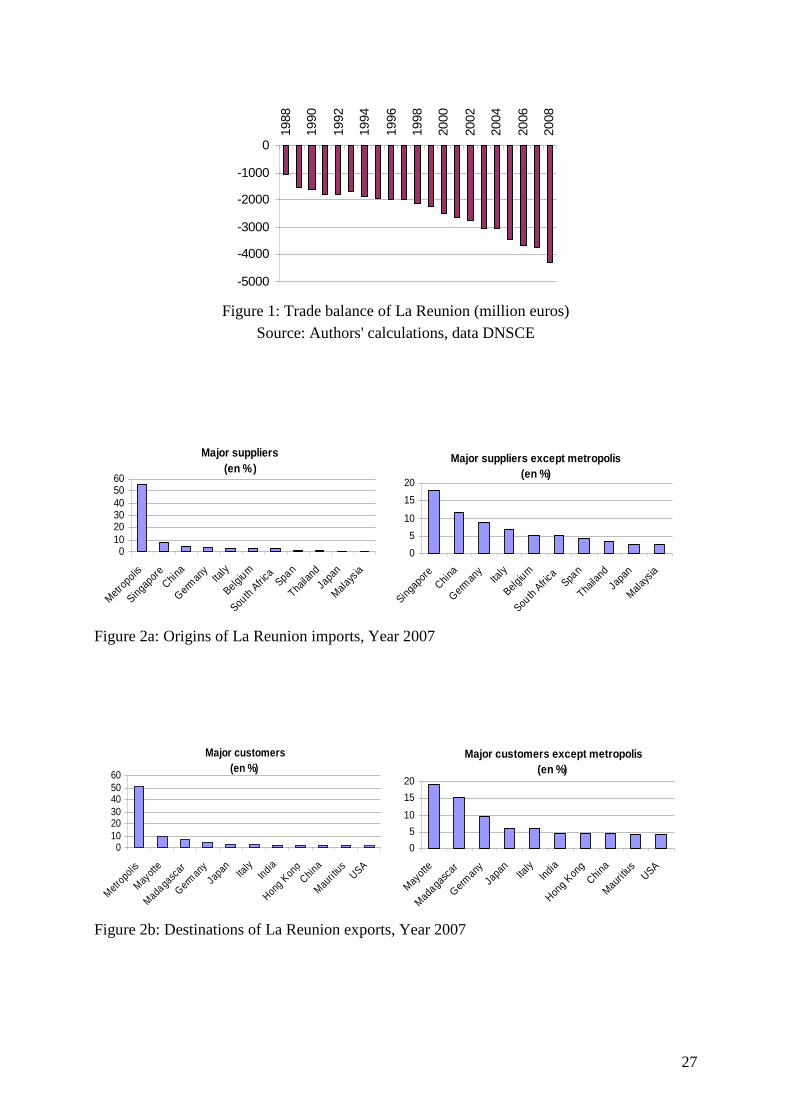
La Reunion’s trade balance (trade with the metropolitan France being included) has experienced a permanent deficit for four decades (Figure 1). Since the 1980’s, this deficit has
4We focus on price competitiveness only, excluding non-price competitiveness dimensions (quality, marketing …).
4
progressively widened and exceed four billion euros in 2008. In percentage of GDP, the deficit is globally stable around 28%. This situation is mainly explained by weak exports, which amount €0.259 billion only in 2008, compared to a level of imports of €4.53 billion. Consequently the ratio of exports to imports is very low, falling below 10% at the end of the 1980’s and stabilizing around 6-7% in the last two decades.5
Insert Figure 1
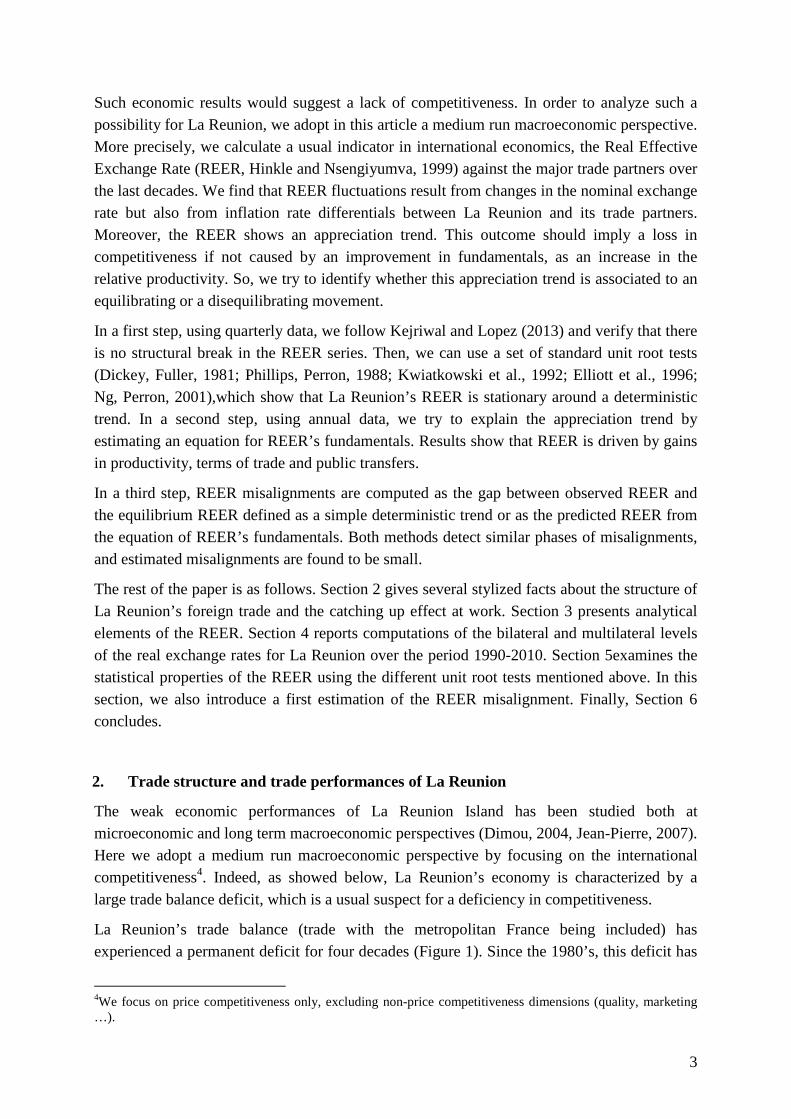
Figures 2a and 2b highlight the overwhelming weight of metropolitan France in both imports and exports. After France, La Reunion’s imports originate from Asia, the European Union and South Africa, while exports are oriented towards Indian Ocean’s partners, Asia, the European Union and the United States.
Insert Figures 2a and 2b
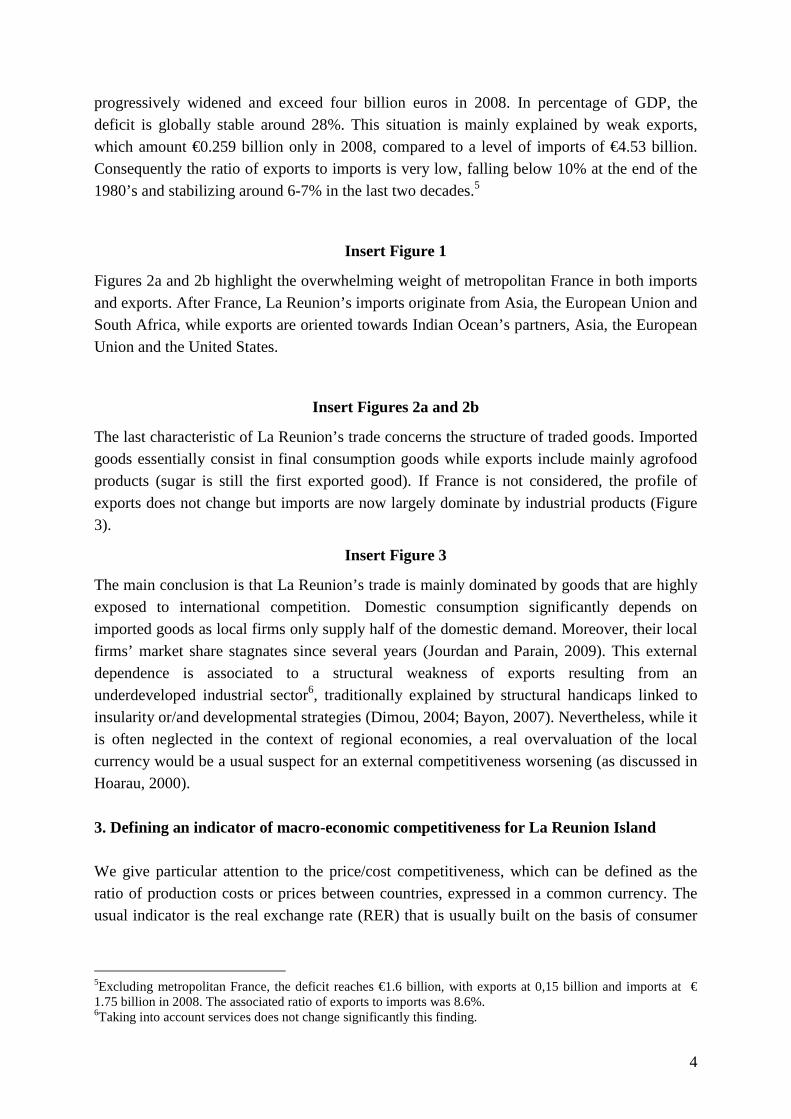
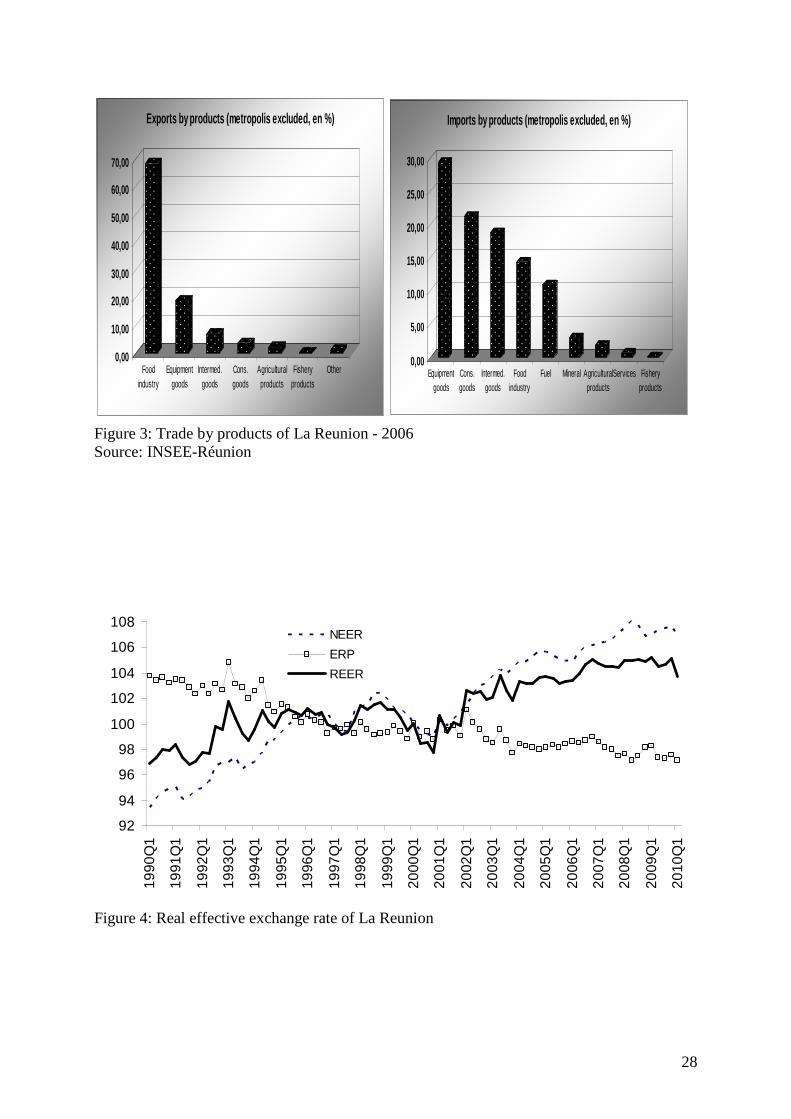
The last characteristic of La Reunion’s trade concerns the structure of traded goods. Imported goods essentially consist in final consumption goods while exports include mainly agrofood products (sugar is still the first exported good). If France is not considered, the profile of exports does not change but imports are now largely dominate by industrial products (Figure 3).
Insert Figure 3
The main conclusion is that La Reunion’s trade is mainly dominated by goods that are highly exposed to international competition. Domestic consumption significantly depends on imported goods as local firms only supply half of the domestic demand. Moreover, their local firms’ market share stagnates since several years (Jourdan and Parain, 2009). This external dependence is associated to a structural weakness of exports resulting from an underdeveloped industrial sector6, traditionally explained by structural handicaps linked to insularity or/and developmental strategies (Dimou, 2004; Bayon, 2007). Nevertheless, while it is often neglected in the context of regional economies, a real overvaluation of the local currency would be a usual suspect for an external competitiveness worsening (as discussed in Hoarau, 2000).
3. Defining an indicator of macro-economic competitiveness for La Reunion Island We give particular attention to the price/cost competitiveness, which can be defined as the ratio of production costs or prices between countries, expressed in a common currency. The usual indicator is the real exchange rate (RER) that is usually built on the basis of consumer
5Excluding metropolitan France, the deficit reaches €1.6 billion, with exports at 0,15 billion and imports at € 1.75 billion in 2008. The associated ratio of exports to imports was 8.6%. 6Taking into account services does not change significantly this finding.
5
prices indices, instead of the prices of internationally traded goods, capturing a more extended notion of competitiveness.7 3.1 Measures of the RER
Many definitions of the RER exist, that can be gathered under two broad categories (Edwards, 1988). The first category is based on purchasing power parity, leading to the “external” RER (ERER) that aims at measuring the country's external competitiveness, i.e. the competitiveness of a country compared to its foreign partners. The external RER is computed as the ratio of the world prices to domestic prices, expressed in the same currency, N.P/P*, N being the nominal exchange rate (number of foreign currency units per unit of domestic currency), P* an index of world prices and P an index of domestic prices. Then, an increase in N (a nominal appreciation) or in P/P* (a faster increase in domestic prices compared to foreign prices) generate a real appreciation, and should cause a loss of competitiveness of the domestic economy. The second category is based on the dependent economy or Scandinavian model (Salter 1959, Swan 1960, Aukrust 1977). It leads to the “internal” real exchange rate (IRER), which aims at capturing the country “internal competitiveness”, i.e. the incentives to produce tradable goods (exportable and importable goods) compared to non-tradable goods. Formally, the IRER is computed as the relative price PNT/PT with PNT the prices of non-tradable goods and PT the prices of tradable goods8. An increase in the IRER encourages production of non-tradable goods rather than traded goods, resulting in resources transfers to the non-tradable goods sector and therefore a lower capacity to export and to produce import-substitutable goods, resulting in a loss of competitiveness. Arguably, for a small developing country, tradable goods prices are determined on the world markets, so that external competitiveness depends only on internal incentives to produce tradable goods. 3.2 The analytical relationship between the measures of RER
For La Reunion Island, the dependent economy model seems rather appropriate. However, as in most of the empirical analysis, the measure we used is the ERER since data are more available than for the IRER. In the following, we examine the relationship between these two measures to conclude that the choice of the ERER is relevant in our case9. The ERER is equal to:
7As noted by Chinn (2006), "[...] there are numerous measures of effective exchange rates. There is no simple answer to the question of which one is the best. Rather, the selection of the effective exchange rate measure depends upon the economic issue being analyzed" (Chinn, 2006, pp. 126)We will discuss this further in the following for the case of La Reunion. 8Defining a synthetic price index of tradable (exportable + importable) goods makes sense when terms of trade are not affected by significant changes. 9This relationship is discussed in Hinkle and Montiel (1999).
6
**t
tt
tt
tt
P
PN
PP
NERER == , (1)
an increase in the ERER signals a real appreciation of the currency. The prices level in the domestic country P and in foreign countries P* can be expressed as a combination of the price of tradable goods and of the price of non-tradable goods:
)1(. θθ −= NTT PPP and)1*(** . λλ −= NTT PPP (2)
With θ and λ the shares of tradable sectors in the domestic country and abroad respectively. Substituting P and P* in relation (1), we get
)1*(,
*,
)1(,,
.
.λλ
θθ
−
−
=tNTtT
tNTtTtt PP
PPNERER (3)
( )( ) )1(*
,*
,
)1(,,
*,
, ..
λ
θ
−
−
=
tTtNT
tTtNT
tT
tTtt
PP
PP
P
PNERER = )1*(
)1(
*,
, ..
λ
θ
−
−
t
t
tT
tTt
IRER
IRER
P
PN (4)
The ERER is therefore a combination of three components: (i) the relative price of tradable goods between the domestic and foreign countries, (ii) the IRER in the domestic country, (iii) the IRER in foreign countries. Then, the ERER and the domestic IRER would systematically follow the same dynamics under two conditions. The first condition is the law of one price for tradable goods which leads the prices of tradable goods between countries to equalize. In this case,
*,,. tTtTt PPN = (5)
The first term of equation (4) is then equal to 1, and the equation (4) reduces to:
)1(*
)1(
λ
θ
−
−
=t
tt
IRER
IRERERER (6)
The second condition is that changes in the foreign IRER are negligible compared to changes in the domestic IRER. In the simplified case where there is no change in IRER*, the changes in the ERER are proportional to those of the domestic IRER. If the two conditions are met, the use of the ERER is relevant because it is sufficiently general to capture both external and internal price-competitiveness of the economy.
7
4. The real exchange rate of La Reunion Island Although La Reunion Island is not an independent country, the small-economy model can be applied because of its remoteness from the metropolitan country. The only drawback might concern the currency since this overseas territory has the same than its main trading partner (France and the Euro-zone). Therefore, contrasting with other similar territories with independent currency (like Mauritius), La Reunion cannot pursue an autonomous monetary policy. The use of the French Franc and of the Euro since 1999 imposes that its competitiveness (against its other euro-zone partners) is impacted by the fluctuations of the exchange rate of the euro against the currencies of its partners. However, even in this field, La Reunion’s case is not so different from the ones of countries that have abandoned their own currencies for an international currency (dollarization, euroization) or that have opted for an anchor to a "strong" currency.10 The computation of the ERER for La Reunion finally follows a standard method. Against the euro-zone countries, competitiveness only depends on the inflation differential. Against the other partners, competitiveness is function of both the inflation differential and the change in the (bilateral) nominal exchange rates. 4.1. The real effective exchange rate
Country competitiveness can be studied with respect to each trading partner or to a group of partners, i.e. using bilateral RERs or a multilateral RER, the so-called real effective exchange rate (REER). The REER is defined as the geometric average of the bilateral RERs:
REER = ∏=
n
i 1
ωi
i
réuréu/i P
P . N
with ∑=
n
i 1ωi = 1 (7)
Where Nreu/i is the index of the bilateral nominal exchange rate between the currency of country i and the La Reunion euro (number of foreign currency units for 1 euro). Preu and Pi are La Reunion’s and foreign country’s consumption price index respectively. The weights ωi reflect the trade structure of La Reunion, limited to the first n trade partners11. An increase (decrease) in the REER is a real appreciation (depreciation) of La Reunion’s currency. The REER can be decomposed into two components, the nominal effective exchange rate (NEER, the geometric average of the bilateral nominal exchange rates), and the effective relative price index (ERP, the geometric average of the relative prices): 10Few studies are dedicated to the competitiveness of small insular and possibly dependent territories. Edwards and Magendzo (2001, 2006) find that “dollarized” countries, including dependent territories or colonies, experienced a lower rate of inflation and a lower GDP growth than non-dollarized ones; but a similar macroeconomic volatility. 11See appendix 1 for details.
8
REER = NEER.ERP
with NEER = ∏=
n
i 1{ }ωi
N réu/i and ERP = ∏=
n
i 1
ωi
i
réu
P
P
(8)
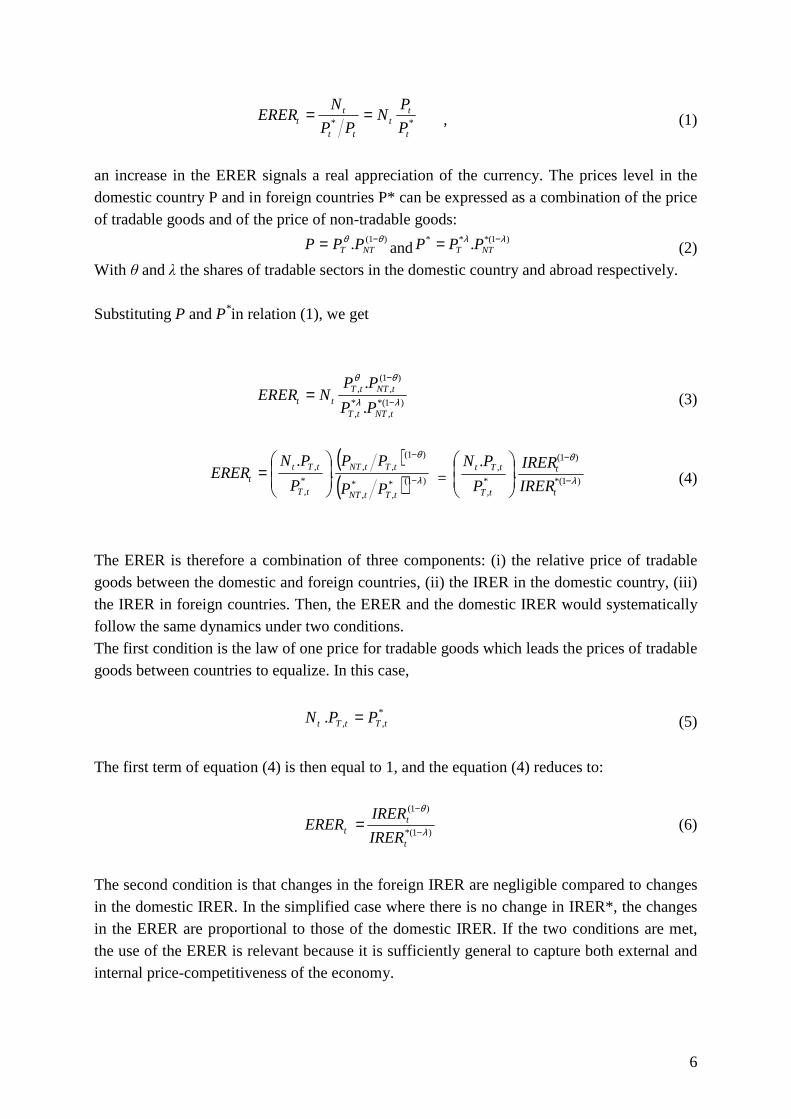
Data availability allows the REER to be computed against 20 trading partners gathering 87% of La Reunion’s trade in 2000. Figure 4 reports changes in the computed NEER, ERP and REER for La Reunion. The ERP shows a downward trend over the period, meaning that inflation in La Reunion is lower than foreign inflation, which contributes to the depreciation of the REER, while the NEER shows an upward trend. Altogether, the change in the NEER dominates, pushing the REER to appreciate, signaling a possible loss in competitiveness especially from the early 2000s.
Insert Figure 4 However the change in the REER may mask disparities with regard to partner countries, which can be revealed only through the examination of the bilateral RERs.
4.2. Bilateral real exchange rates
A logarithmic form of equation 7 ensures that the real effective exchange rate is a linear combination of bilateral rates. It may be useful to distinguish bilateral RERs, against developed countries, and against developing countries.
Consider equation (4), ( )( ) λ
θ
−
−
=
1*,
*,
1,,
*,
, ..
tTtNT
tTtNT
tT
tTtt
PP
PP
P
PNR .
In the case of perfect competition, and assuming equality in average cost and marginal cost (constant returns), firms set prices at the level of unit costs (wages adjusted for labor productivity) in each sector:
***
***
/
/
/
/
NTNTNT
TTT
NTNTNT
TTT
awP
awP
awP
awP
=
=
==
(9)
where Tw and NTw are the wage rates in the sectors of traded and non-traded goods, ea and nea
the productivities of these two sectors. Combining equations (4) and (9) and assuming equality of traded goods prices (law of one price), the real exchange rate expressed in first difference becomes:
9
[ ] [ ]****).1().1( NTTTNTNTTTNTt aawwaawwR &&&&&&&&& −+−−−−+−−= λθ , (10)
where tt LogXX ∆=& . Equation (10) gives the dynamic of each real exchange rate of Reunion
vis-à-vis its partners, developed and developing countries. This rate is,
i
reureu/i P
P . N .
4.2.1. Competition with developed countries
[ ])()().1( **NTTNTTt aaaaR &&&&& −−−−= θ (11)
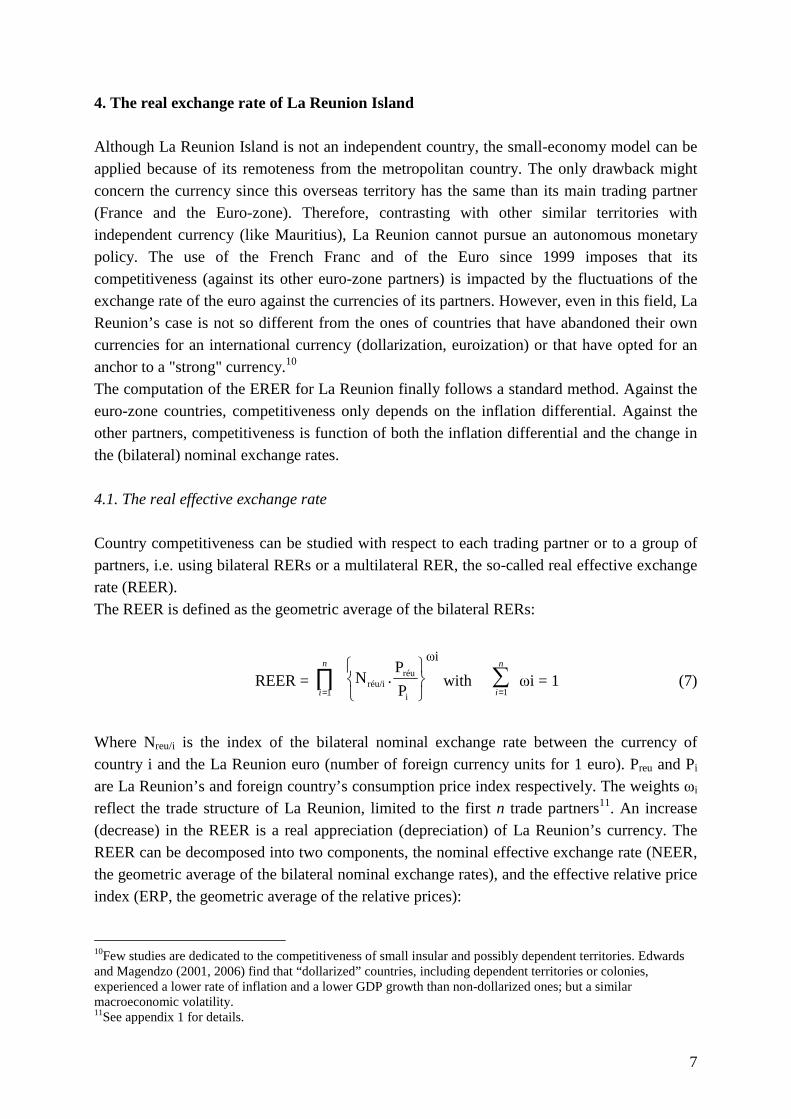
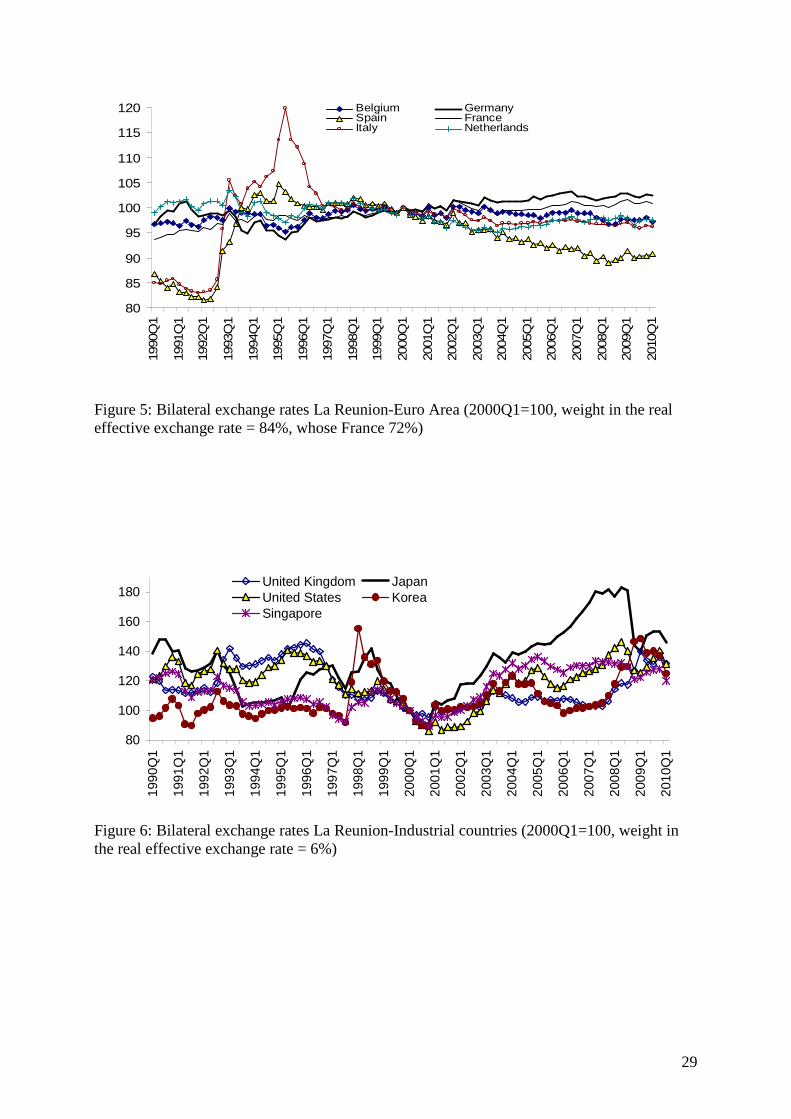
An increase in the real exchange rate will result from higher productivity gains in the traded good sector of La Reunion. This is the so-called Balassa/Samuelson productivity bias, which can explain a continuous appreciation of the real effective exchange rate of La Reunion (see Figure 4).This conclusion may emerge from the observation of the limited changes in bilateral RER vis-à-vis Germany and France (see Figure5).Vis-à-vis France, only the inflation differential explains the changes in the RER because of the common currency (Franc and Euro). For the same reasons, bilateral RER changes are limited since 1999 with the adoption of the Euro. Inflation in La Reunion however is significantly lower than inflation in Belgium, Netherlands, Italy, and especially in Spain, leading La Reunion to benefit from a real depreciation vis-à-vis these countries (around 10% vis-à-vis Spain).
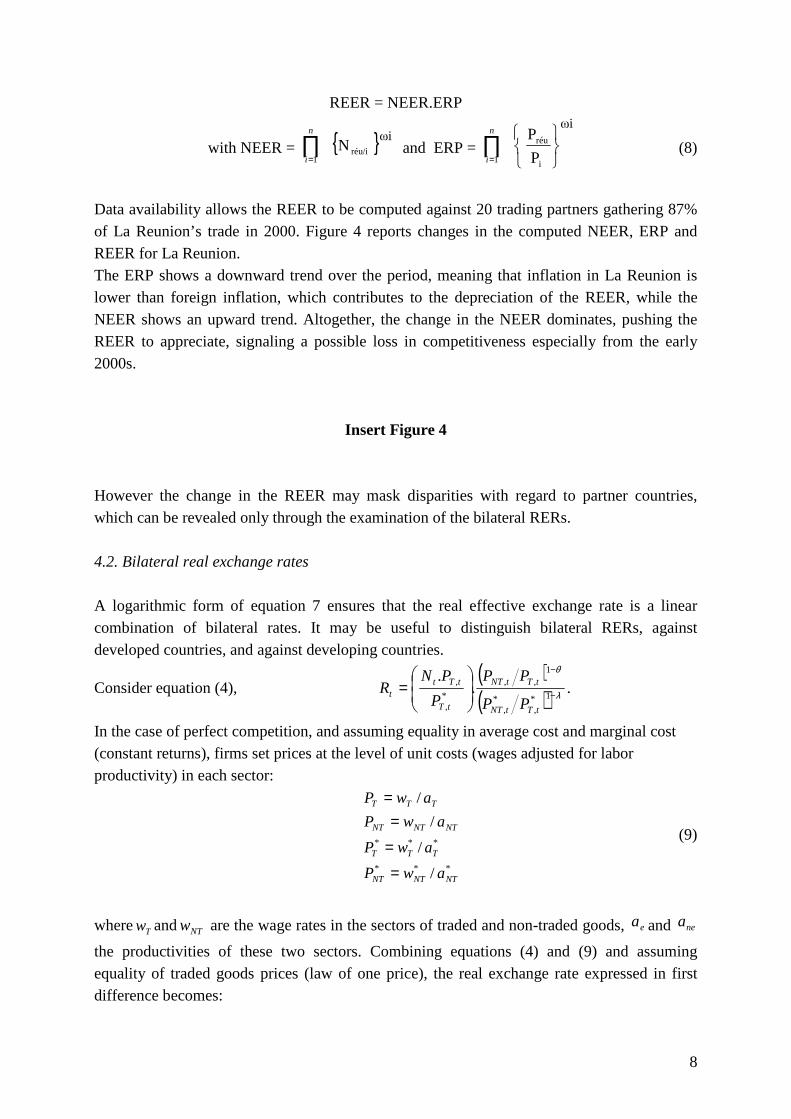
Insert Figure 5 Conversely, the trend observed since the early 2000s in bilateral RER vis-à-vis countries outside the euro area (see figure 6) has more chance to be due to changes in the nominal exchange rates.
Insert Figure 6
Insofar as these countries have relatively low levels of inflation, fluctuations are explained by changes in the euro against the currencies of these countries. Especially since 2001, the Euro appreciates against the British Pound, the Japanese Yen and the U.S. dollar (and thus against the Singapore Dollar and the Korean Won that are anchored to the U.S. dollar). The real appreciation is approximately 30% against the British pound.
10
4.2.2. Competition with developing countries Assuming that in developing countries wages do not increase at the same rate in both sectors, equation 11 becomes:
[ ])()()().1( ****NTTNTTNTTt aawwaaR &&&&&&& −−−+−−= θ , (12)
or
[ ])()().1( **NTTNTTt ccaaR &&&&& −+−−= θ , (12’)
cbeing the unit labor cost. If we consider 0>− NTT aa && , it is possible that the RER of La
Reunion appreciates against some competitors and depreciates against others, depending on
whether 0** >− NTT cc && or not.
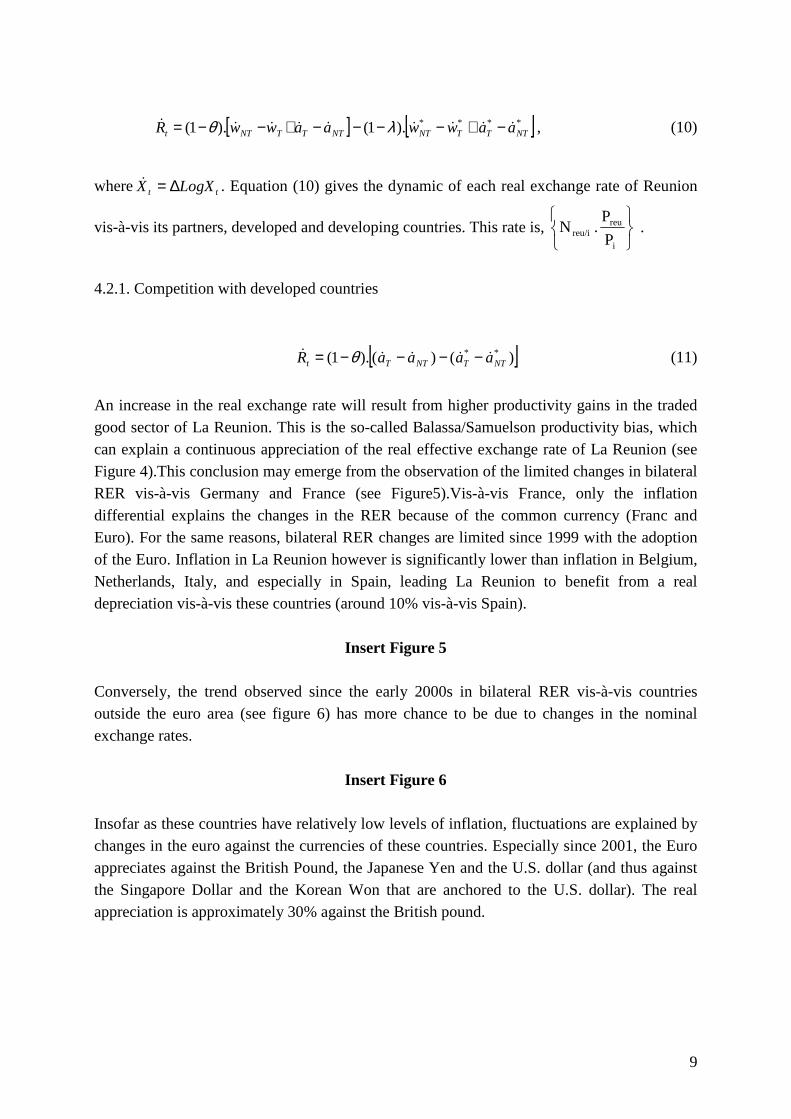
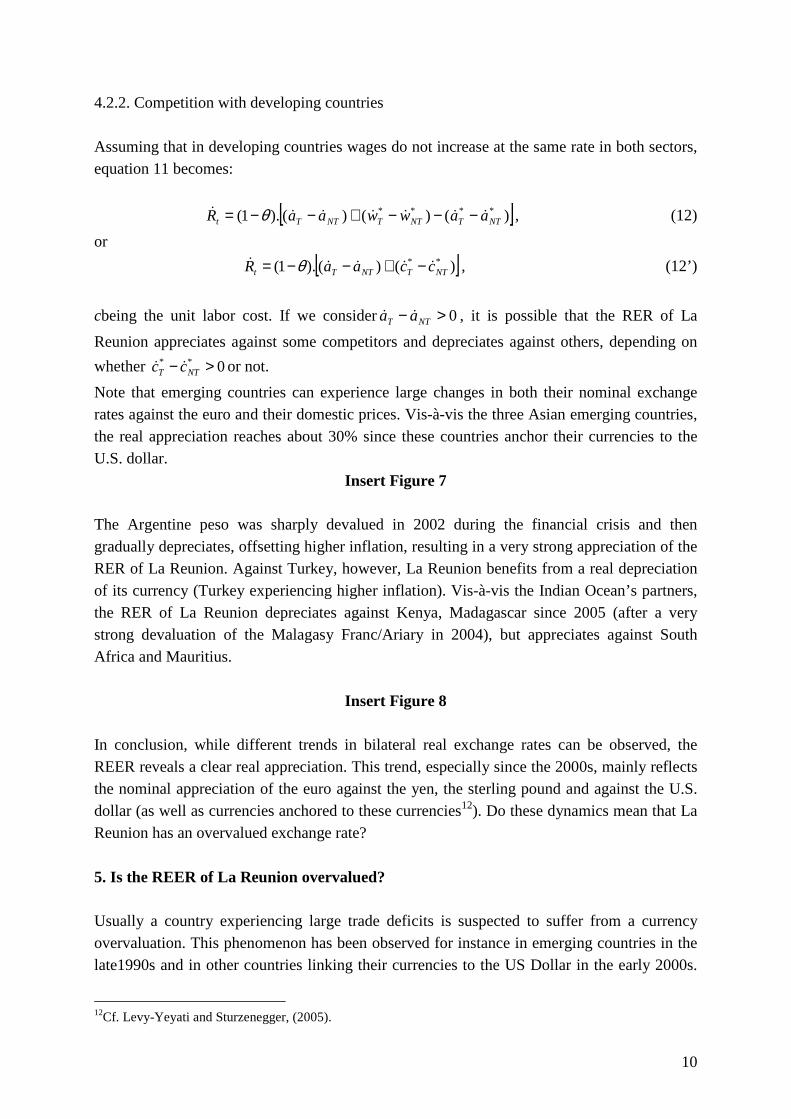
Note that emerging countries can experience large changes in both their nominal exchange rates against the euro and their domestic prices. Vis-à-vis the three Asian emerging countries, the real appreciation reaches about 30% since these countries anchor their currencies to the U.S. dollar.
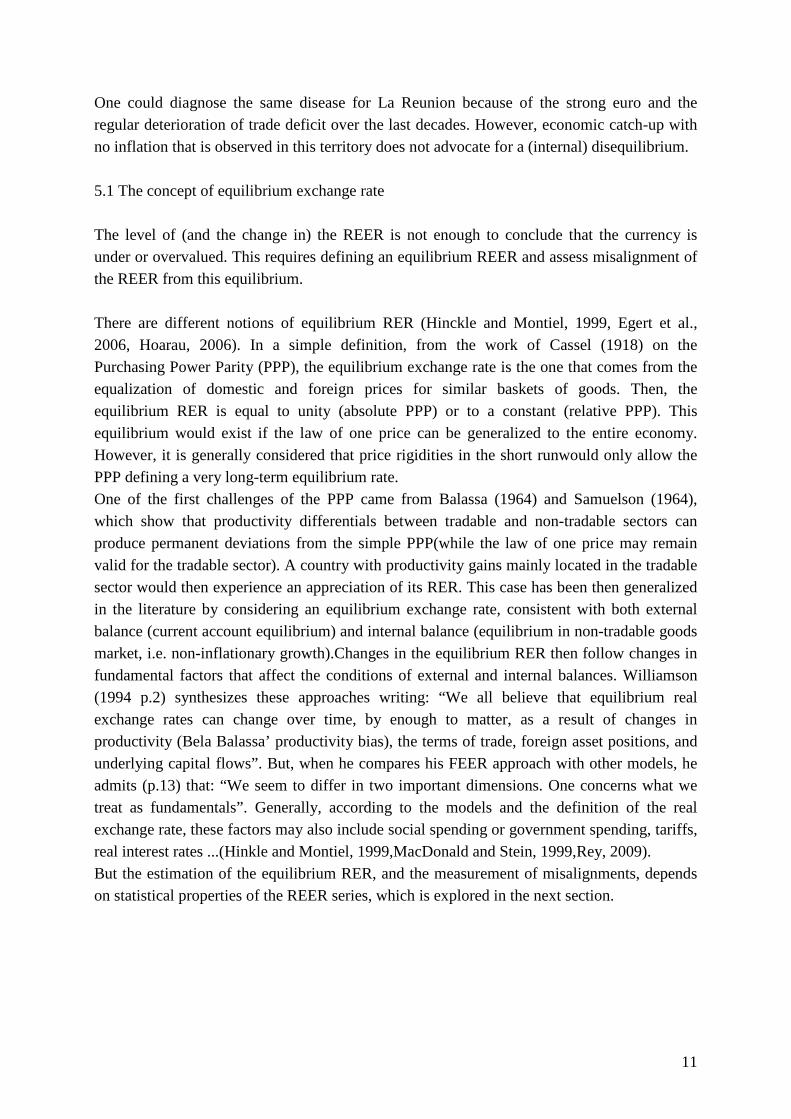
Insert Figure 7 The Argentine peso was sharply devalued in 2002 during the financial crisis and then gradually depreciates, offsetting higher inflation, resulting in a very strong appreciation of the RER of La Reunion. Against Turkey, however, La Reunion benefits from a real depreciation of its currency (Turkey experiencing higher inflation). Vis-à-vis the Indian Ocean’s partners, the RER of La Reunion depreciates against Kenya, Madagascar since 2005 (after a very strong devaluation of the Malagasy Franc/Ariary in 2004), but appreciates against South Africa and Mauritius.
Insert Figure 8 In conclusion, while different trends in bilateral real exchange rates can be observed, the REER reveals a clear real appreciation. This trend, especially since the 2000s, mainly reflects the nominal appreciation of the euro against the yen, the sterling pound and against the U.S. dollar (as well as currencies anchored to these currencies12). Do these dynamics mean that La Reunion has an overvalued exchange rate?
5. Is the REER of La Reunion overvalued? Usually a country experiencing large trade deficits is suspected to suffer from a currency overvaluation. This phenomenon has been observed for instance in emerging countries in the late1990s and in other countries linking their currencies to the US Dollar in the early 2000s.
12Cf. Levy-Yeyati and Sturzenegger, (2005).
11
One could diagnose the same disease for La Reunion because of the strong euro and the regular deterioration of trade deficit over the last decades. However, economic catch-up with no inflation that is observed in this territory does not advocate for a (internal) disequilibrium. 5.1 The concept of equilibrium exchange rate The level of (and the change in) the REER is not enough to conclude that the currency is under or overvalued. This requires defining an equilibrium REER and assess misalignment of the REER from this equilibrium. There are different notions of equilibrium RER (Hinckle and Montiel, 1999, Egert et al., 2006, Hoarau, 2006). In a simple definition, from the work of Cassel (1918) on the Purchasing Power Parity (PPP), the equilibrium exchange rate is the one that comes from the equalization of domestic and foreign prices for similar baskets of goods. Then, the equilibrium RER is equal to unity (absolute PPP) or to a constant (relative PPP). This equilibrium would exist if the law of one price can be generalized to the entire economy. However, it is generally considered that price rigidities in the short runwould only allow the PPP defining a very long-term equilibrium rate. One of the first challenges of the PPP came from Balassa (1964) and Samuelson (1964), which show that productivity differentials between tradable and non-tradable sectors can produce permanent deviations from the simple PPP(while the law of one price may remain valid for the tradable sector). A country with productivity gains mainly located in the tradable sector would then experience an appreciation of its RER. This case has been then generalized in the literature by considering an equilibrium exchange rate, consistent with both external balance (current account equilibrium) and internal balance (equilibrium in non-tradable goods market, i.e. non-inflationary growth).Changes in the equilibrium RER then follow changes in fundamental factors that affect the conditions of external and internal balances. Williamson (1994 p.2) synthesizes these approaches writing: “We all believe that equilibrium real exchange rates can change over time, by enough to matter, as a result of changes in productivity (Bela Balassa’ productivity bias), the terms of trade, foreign asset positions, and underlying capital flows”. But, when he compares his FEER approach with other models, he admits (p.13) that: “We seem to differ in two important dimensions. One concerns what we treat as fundamentals”. Generally, according to the models and the definition of the real exchange rate, these factors may also include social spending or government spending, tariffs, real interest rates ...(Hinkle and Montiel, 1999,MacDonald and Stein, 1999,Rey, 2009). But the estimation of the equilibrium RER, and the measurement of misalignments, depends on statistical properties of the REER series, which is explored in the next section.
12
5.2 Estimation of equilibrium real exchange rate To calculate an equilibrium exchange rate for La Reunion, we need information on both statistical properties of the REER and on possible fundamental factors of the real exchange rate. We retain two complementary approaches. The first one uses quarterly series of the REER over the period 1990-2010. For this period, quarterly data are only available for the REER and not for usual fundamentals. We only test for the presence of a deterministic trend in quarterly data of REER. If the series of REER is stationary around the deterministic trend, the equilibrium REER may be defined by this trend.13 The second approach use annual data for the REER and its fundamentals over 1980-2011, allowing to test for the determinants of the REER appreciation. 5.2.1 Trend in the REER Before assessing an equilibrium exchange rate for the La Reunion’s REER, we need to know whether this latter could be identified as a unit root or a stationary process. Many standard unit root tests exist in the literature (see Darné and Diebolt, 2005 for an exhaustive review). However these ones are not robust for at least two reasons. Firstly, the possible presence of structural breaks is not taken into account, which can lead to wrongly accept the null hypothesis of a unit root (Perron, 1989, 2006). Since the seminal work of Perron (1989), many procedures including the presence of structural breaks have been developed (Perronand Vogelsang, 1992; Lumsdaine and Papell, 1997; Perron, 1997; Papell and Prodan, 2006). Nevertheless, one crucial problem remains: the commonly used unit root tests consider structural breaks only under the alternative hypothesis of stationarity. Then, they could suffer from serious power and size distortions (Lee and Strazicich, 2001, 2003; Kim and Perron, 2009). Secondly, the presence of a deterministic trend can also bias the findings resulting from unit root tests (Dejong et al., 1992; Harvey et al., 2009). Indeed, conclusions based on a specification including a deterministic trend would be inappropriate if this one finally does not exist. Several tests for identifying the existence of a linear trend have been recently proposed irrespective of the integration order of the series, namely if the series are I(O) or I(1) (Harvey et al., 2007; Perron and Yabu, 2009a). Accordingly, here we follow Kejrival and Lopez (2013) by proceeding in two steps: (i) testing for the presence of structural breaks both in the level and the slope of the linear trend, and (ii) implementing the reliable unit root tests according to the previous results.
13See Baffes et al. (1999) for a discussion on the determination of the equilibrium value of the REER when it is stationary (example of Burkina-Faso).
13
• Detection of structural breaks in the linear trend Our econometric methodology is based on the strategy adopted by Kejrival and Lopez (2013). Consider the general specification:
111
110
,,...,2,
,...,1
vuTtvuu
TtwithDTDUy
ttt
K
ititi
K
iititt
==+=
=++++=
−
==∑∑
α
µβµβµ
Where )( iit TtIDU >= , )()( iiit TtITtDT >−= , i=1,...K. A break in the trend occurs at time
][ ii TT λ= when 0≠iβ . The breaks date (iT ), and the number of breaks (K) are supposed to
be unknown. The error u can follow either a I(0) process ( 1<α ) or a I(1) process ( 1=α ).
The stochastic one { }tu is assumed to be stationary, but not necessarily identically and
independently distributed thereby allowing for a general error structure for tu .
In the first step, we test for the presence of one structural break (K=1) in the slope of the
deterministic trend that is the null hypothesis 0=iβ against the alternative 0≠iβ . To this
regard, we run the recent approach of Perron and Yabu (2009b). Following Perron and Yabu (2009a), these authors proposed a robust test on the slope of a linear trend function integrating potential structural breaks at unknown dates when the integration order of the series is not a priori identified, i.e. either I(0) or I(1). The stability of the trend function is tested by the Feasible Quasi Generalized Least Squares procedure. In the second step, we try to detect the
presence of a break in the level of the linear trend by testing the null hypothesis 0=iu against
the alternative 0≠iu . Thus, we implement the Harvey et al. (2010) procedure which built a
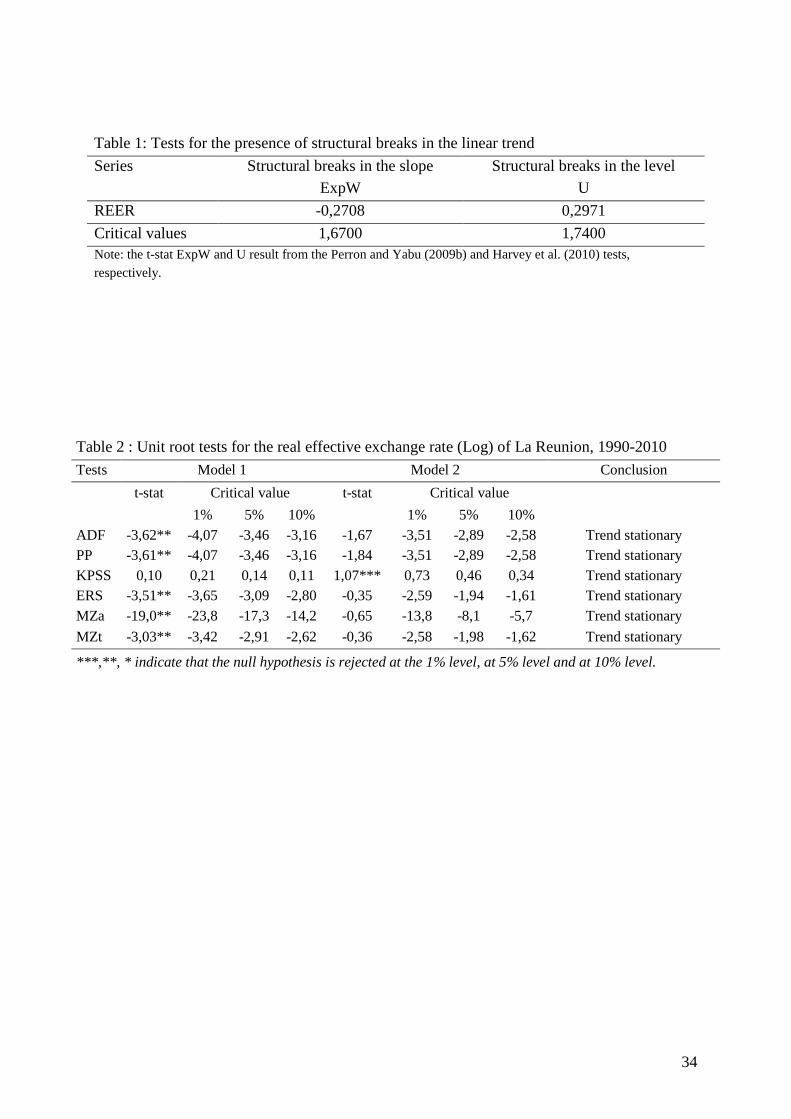
test for detecting multiple level breaks that is robust to unit root or stationarity properties of the data. Finally, the results are given in Table (1). These ones clearly show that it is impossible to reject the null hypothesis, so that there is no evidence of structural breaks in the REER of La Reunion14.
INSERT Table 1
• Testing for the presence of a unit root Given the rejection of a structural break, we can apply a battery of standard stationarity or unit root tests. Two sets of tests were used: (i) the classical tests of Dickey and Fuller in its expanded version (1981) [ADF], Phillips and Perron (1988) [PP] and Kwiatkowski et al. (1992) [KPSS] and (ii) efficient tests of Elliott et al. (1996) [ERS] and Ng and Perron (2001)
14We also implemented the outliers’ detection method of Gomez and Maravall (1997). The resulting outcomes support the previous finding of no structural breaks in the series.
14
[MZA and MZT], which are largely used in the literature (Taylor and Taylor 2004, Taylor 2006). Two specifications were considered for each procedure: with a deterministic trend and a constant [model 1], which allows testing a PPP adjusted for productivity gains in the Balassa-Samuelson version (Papell and Prodan, 2006, Hoarau, 2009), and with only a constant [model 2], that allows testing the simple version of the Cassel’s PPP. Results in Table 2 lead to the same conclusions. First, the specification that best fits the data includes a deterministic trend, which is still significant at5%, rejecting Cassel’s PPP. Second, trend-stationarity is significant in model 1 at the 5% level (but not at the very restrictive threshold of 1%).
Insert table 2 These results reveal one of the predictions of the Balassa-Samuelson theory, with the change in La Reunion’s REER showing an appreciation trend (section 2), associated with the productivity catch-up phenomenon that can be observed on the basis of GDP per capita (see section 1). 5.2.2 Equation of REER’s fundamentals Insofar La Reunion is a small economy, the dynamics of the real exchange rate can be explained by productivity gains (Balassa-Samuelson effect), terms of trade, the social consumption, etc...(cf. among others Edwards, 1994, Stein, 1994). Technological progress is
proxied by the rate of growth in per capita real GDP ( LnGDPpc∆ ). Imports and exports
prices are unavailable for La Reunion. Since developed countries constitute the main partners of La Reunion, we suppose that imports and exports prices of La Reunion are respectively proxied by exports (hereafter PX*) and imports prices (hereafter PM*) of advanced economies. Finally, large public transfers from the metropolis are proxied by transfers-to-GDP ratio. The REER model is:
),,( ** GDPTransfPMPXGDPpcREERREER ∆= (13)
Where GDPpc represents the real GDP per capita, (PX*/PM*) the relative price or inverse of terms of trade, and (Transf/GDP) the public transfers in terms of GDP. To estimate this model it is necessary to study the statistical properties of the variables. Sources of data and results of unit root tests are provided in appendix 3. All variables (in logarithm) are stationary. GDP per capita is I(1) in (log) level, but I(0) in first difference. The previous result concerning REER is confirmed with annual data and on a longer period. Assuming that fundamentals are exogenous, we use the OLS estimator. The equation to be estimated is:

15
tttttt aGDPTransfLnaPMPXLnaTechnoaLnREERLnREER ελ +++++= − 4)/(.3)/(.2.1 **1
(14)
where technological progress (Techno) is alternatively proxied by LnGDPpc∆ or by a trend,
and the error terms,tε , are i.i.d. This autoregressive form allows distinguishing short run
effects, a1, a2, a3 and long-run effects a1/1-λ, a2/1-λ and a3/1-λ15.
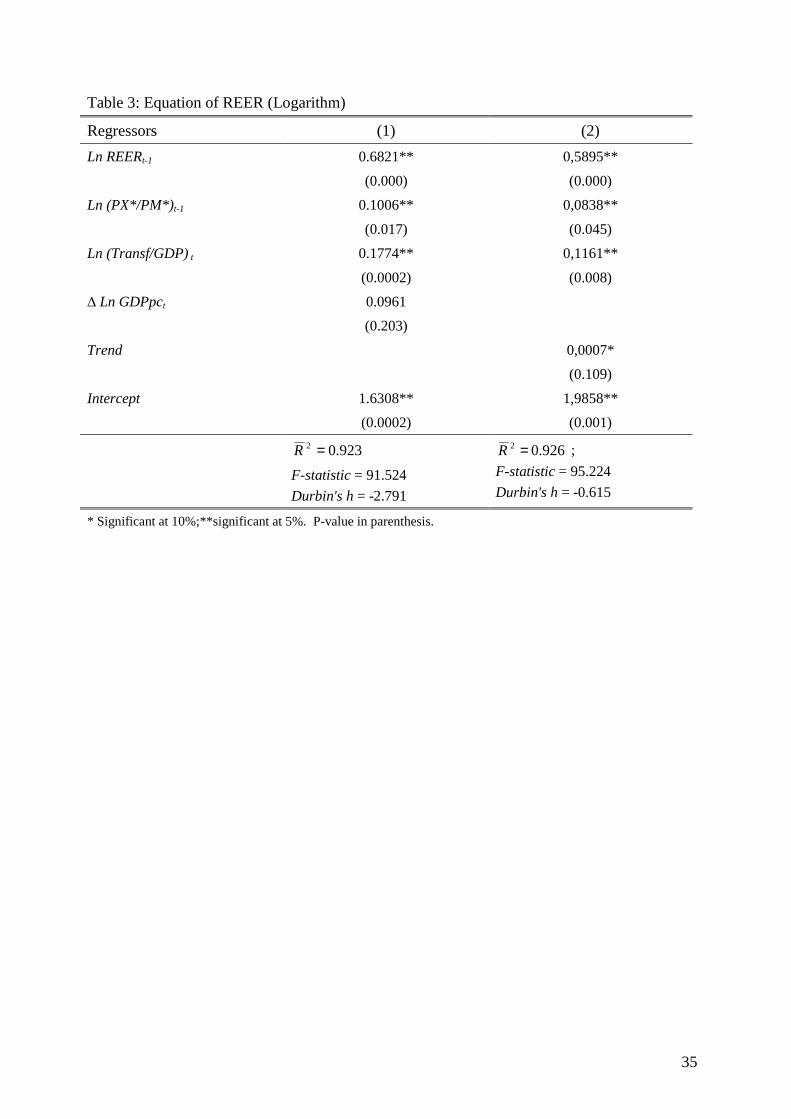
Table 3 reports the estimated coefficients with LnGDPpc∆ in column 1 and the trend in
column 2. The estimated coefficient for LnGDPpc∆ has the expected positive sign but is
insignificant, while the coefficient of the trend is significant at the10 % level and the Durbin’h confirms the hypothesis of no autocorrelation in the residuals. So we retain the results with the trend. A rise in the relative prices, i.e. a deterioration of the La Reunion’s terms of trade appreciates the REER.16An increase in transfers appreciates the REER as expected.
Insert table 3 The long-run relationship is17:
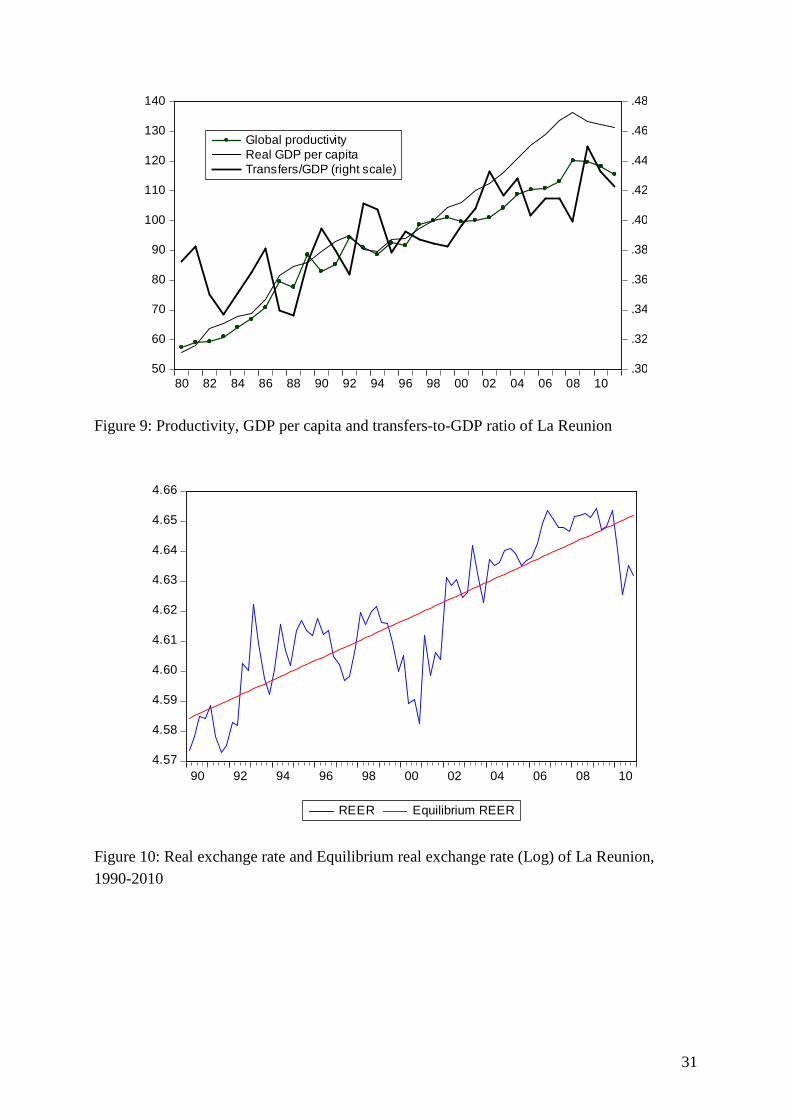
8376.4Trend0018.0P)(Transf/GDLn 2831.0)/PM(PXLn 2041.0REERLn ** +++= (15) Transfers have a high impact on the REER in the long-run. A rise of the transfers-to-GDP ratio of 1% generates a real appreciation of 0.28%. The coefficient of the trend is small, but the transfer variable would partly capture the Balassa effect if GDP per capita depends on transfers18. Figure 9 shows increasing trends in these three variables over the entire period that clearly calls for an appreciation of the RER.
Insert Figure 9 5.3. Assessment of REER misalignments
A misalignment (noted MIS) is defined as the gap (in percentage) between the current REER and the estimated equilibrium REER, or MIS=Ln REER-Ln REEReq. A positive (negative) gap implies a real overvaluation (undervaluation).The major difficulty is to define and calculate the equilibrium REER. Following our previous results and the approach of Baffes et al. (1999), we retain two operational methods to calculate REER misalignments.
15 For a similar specification, see Edwards (1994).. 16 A deterioration of the terms of trade has a negative income effect that induces a fall in the demand for non-tradable goods and consequently a real depreciation of the RER. This income effect dominates here the substitution effect that appreciates the RER through a rise in imported good price. 17For the relative price, the long-run elasticity is (0.0838/(1-0.5895)) = 0.2041, etc… 18 Indeed, we show the existence of a long-run relationship between the real GDP per capita, the transfers and the global productivity. Detailed results are presented in appendix 4.
16
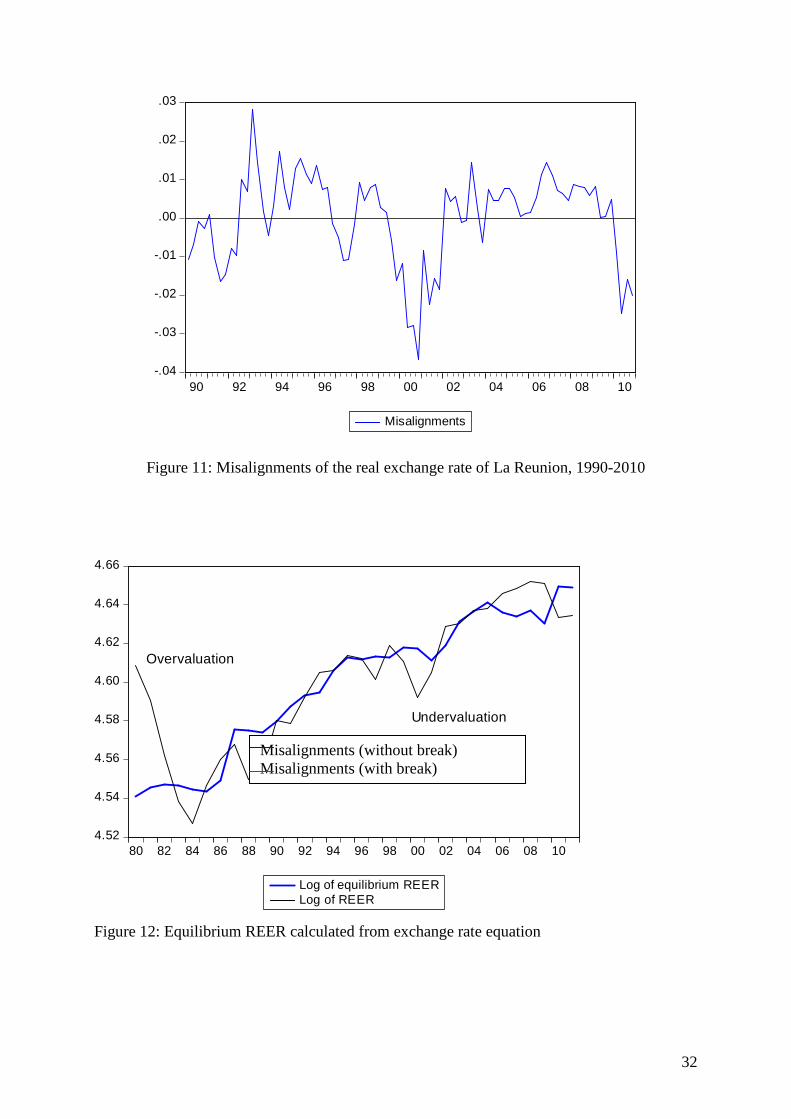
Firstly, trend stationarity allows defining the equilibrium REER as a deterministic trend. Figure 11 shows the REER deviations from the trend, the so-called misalignments (in percentage)19. Three main periods are detected: (i) an overvaluation over the 1990s, and from 2006 to 2008, (ii) an undervaluation over the period 1999-2002, and (iii) a relative balance over the period 2002-2006.
Insert figure 10
Insert figure 11
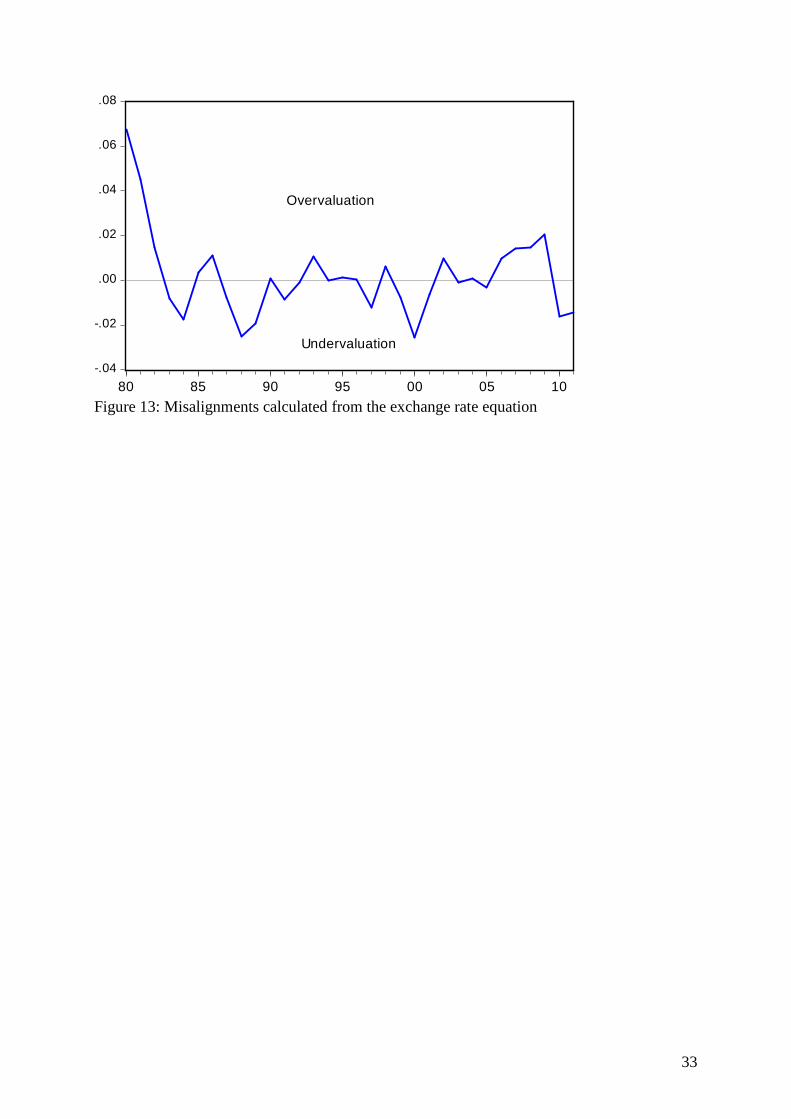
Second, considering now the equation of REER’s fundamentals, the equilibrium REER is obtained by using equilibrium values of the fundamentals in equation (15). These equilibrium values are obtained by an exponential smoothing (Bowerman and O’Connell 1979).Figure 12 reports the observed REER and the estimated equilibrium value and Figure 13 shows estimated misalignments.
Insert figure 12
Insert figure 13
The REER appears to be overvalued in the early 1980s, during the second half of the 1990s and during the 2000s. The nominal appreciation of the euro has certainly contributed to the phase of overvaluation in 2002-2008.
Overall, both methods detect similar phases of misalignments and show that estimated misalignments are small. Apart from the early 1980s when there is an overvaluation of 7%, thereafter, the over or under evaluations lie in a range of 2% to 3% only.
6. Conclusion and final remarks
The main results show that there is no permanent overvaluation of the exchange rate for La Reunion, despite a continuous appreciation of the REER. Indeed, the appreciation of the REER is consistent with the phenomenon of economic catch-up, characterized by relative gains in productivity (Balassa-Samuelson hypothesis). We also show that transfers have contributed to this appreciation, but also to the gains in productivity. The importance of transfers, particularly for the dependent territories, is not always discussed in studies on territories with no separate legal tender (see for instance Edwards, 2002, 2006).
19 Note that our econometric methodology used to estimate the equilibrium REER is very trivial. So we could anticipate that the misalignment periods should be more pronounced in reality. Therefore the resulting estimates must be taken with caution for operational exercises.
17
We do not detect an evident problem of competitiveness at the macro level, based on the usual measures of REER and misalignments. Permanent and high trade deficits of La Reunion are then not caused by an overvalued currency and should be explained by, for instance, structural factors, or socioeconomic and political factors. La Reunion and other countries that are trading partners today have in common to be the former colonies of France, which contributes to higher trade intensity. Finally, structural factors, such as geographical distance, should be decisive for trade in a small island economy (see Candau et al. 2012).
References AHLERS, T.O. and L.E. HINKLE (1999), “Estimating the equilibrium RER empirically:
operational approaches”, in HINKLE L.E. and MONTIEL P., Exchange rate
misalignment: Concepts and measurement for developing countries, Oxford University Press, New York, chapter 7, pp. 293-358.
AUKRUST, O. (1977), “Inflation on the open economy: a Norwegian model”, in KRAUSE L. and SALANT M., Worldwide Inflation: Theory and Recent Experience, (Washington, D.C.: The Brookings Institution.
BAFFES, J., ELBADAWI, I.A., and S.A. O’CONNELL (1999), “Single-equation estimation of the equilibrium real exchange rate”, in HINKLE, L.E. and MONTIEL, P.J., Exchange Rate Misalignment. Concepts and Measurement for Developing Countries, A World Bank Research Publication, OxfordUniversity Press.
BALASSA, B. (1964), “The Purchasing Power Parity Doctrine: A Reappraisal”, Journal of
Political Economy, 72, Dec., pp. 584-96.
BAYON, D. (2007), “Des économies vulnérables et dépendantes”, in N. LEVRATTO (eds.), Comprendre les économies d’outre-mer, chapitre 2, Paris, L’Harmattan, pp.67-103.
BOWERMAN, B. L. and R. T. O’CONNELL (1979), Time Series and Forecasting: An
Applied Approach, New York: Duxbury Press.
CASSEL, G. (1918), “Abnormal deviations in international exchanges”, The Economic
Journal, 28, pp. 413-415.
CANDAU, F., J.-F. HOARAU and S. REY (2012), “ L’impact de la distance et de l’intégration sur le commerce d’une région ultrapériphérique d’Europe: l’île de La Réunion ”, European Journal of Development Research, advance online publication, May 31; DOI: 10.1057/ejdr.2012.17.
CHINN, M.D. (2006), “A Primer on Real Effective Exchange Rates: Determinants, Overvaluation, Trade Flows and Competitive Devaluation”, Open Economies Review, 17, pp. 115-143.
18
DARNE, O. and C. DIEBOLT (2005), “Nonstationarity Tests of Macroeconomic Time Series”, in DIEBOLT C., KYRTSOU C. et la collaboration de DARNÉ O. (eds.) New
Trends in Macroeconomics, Editions Springer, Berlin, pp. 173-194.
DEJONG, D.N, J.C. NANKERVIS, N.E. SAVIN and C.H. WHITEMAN (1992), “Integration versus Trend Stationarity in Time Series”,Econometrica, 60 (2), pp. 423-433, March.
DICKEY, D.A. and W.A. FULLER (1981), “Likelihood ratio statistics for autoregressive time series with a unit root”, Econometrica, 49, pp. 1057-1071.
DIMOU, M (2004), “Economies insulaires et trajectoires de développement, une comparaison entre Maurice et La Reunion”, Région et Développement n°20-2004.
EDWARDS, S. and I. I. MAGENDZO, (2001): “Dollarization, Inflation and Growth”, NBER Working Paper No. 8671, Cambridge MA, http://www.nber.org/papers/w8671.
EDWARDS, S. and I. I. MAGENDZO (2006), “Strict Dollarization and Economic Performance: An Empirical Investigation”, Journal of Money, Credit, and Banking, Volume 38, Number 1, pp. 269-282
EGERT, B., L. HALPERN and R. MACDONALD (2006), “Equilibrium exchange rates in transition economies: Taking Stock of the Issues”, Journal of Economic Surveys, 20(2), pp. 257-324.
ELLIOTT, G., T.J. ROTHENBERG and J.H. STOCK (1996), “Efficient tests for an autoregressive unit root”, Econometrica, 64, pp. 813-836.
GOMEZ, V. and A. MARAVALLl (1997). "Programs TRAMO and SEATS: Instructions for the user (Beta version: June 1997)", Working paper No 97001, Ministerio de Economıa y Hacienda, Direccion General de Analisis y ProgramacionPresupuestaria.
GOUJON, M. (2008), “L’indice de développement humain: Une évaluation pour La Réunion”, Région et Développement, 27, pp.225-244
GOUJON, M. (2009), “Indice de développement humain: des progrès depuis 20 ans mais un retard persistant”, Economie de La Réunion, 134, pp.32-36, INSEE, St-Denis de La Réunion.
HARVEY, D.I., S.J. LEYBOURNE and A.M.R. TAYLOR (2009), “Simple, robust and powerful tests of breaking trend hypothesis”, Econometric Theory, 25, pp. 995-1029.
HARVEY, D.I., S.J. LEYBOURNE and A.M.R. TAYLOR (2010), “Robust methods for detecting multiple level breaks in autocorrelated time series”, Journal of Econometrics, 157, 342-358.
HEGWOOD, N.D. and D.H. PAPELL (1998), “Quasi purchasing power parity”, International Journal of Finance and Economics, 3, pp. 279-289.
HINKLE, L. E. and P. MONTIEL (1999), Exchange rate misalignment: Concepts and
measurement for developing countries, Oxford University Press, New York.
19
HOARAU, J.F. (2000), “Les exportations: un moteur possible pour la création d’emplois”, Economie de La Réunion, 105, troisième trimestre, pp. 6-8.
HOARAU, J.-F. (2006), “Les régimes monétaires en Australie, 1977-2000: Une mise en perspective à l'aide d'un indicateur de distorsions du taux de change réel”, Economie
Internationale, 105, pp. 85-112.
HOARAU, J.F. (2009), “Does long-run purchasing power parity hold in eastern and southern african countries? Evidence from panel data stationary tests with multiple structural breaks”, International Journal of Finance and Economics, 15(4), pp. 307-315.
HUGOUNENQ, R. and V. CHAUVIN, (2006), “Les évolutions comparées des prix à la consommation dans les DOM et en métropole”, Bulletin trimestriel de la Banque de
France, n°151, juillet, pp. 33-46.
JEAN-PIERRE, Ph. (2007), “Transferts et déséquilibres macroéconomiques des économies ultramarines”, Document de travail, Agence Française de Développement, 51, pp. 1-37, novembre.
KEJRIWAL, M. and C. LOPEZ (2013), “Unit roots, level shifts, and trend breaks in per capita output: A robust evaluation”, Econometrics Reviews, 32, pp. 892-927.
KIM, D. and P. PERRON (2009), “Unit root tests allowing for a break in the trend function at an unknown time under both the null and alternative hypotheses”, Journal of
Econometrics, 148, pp. 1-13.
KWIATKOWSKI, D., P.C.B. PHILLIPS, P. SCHMIDT and Y. SHIN (1992), “Testing the null hypothesis of stationarity against the alternative of a unit root”, Journal of
econometrics, 54, pp. 91-115.
LEE, J. and M.C. STRAZICICH (2001), “Break point estimation and spurious rejections with endogenous unit root tests”, Oxford Bulletin of Economics and Statistics, 63, pp. 535-558.
LEVY-YEYATI, E. and F. STURZENEGGER, (2005), “Classifying exchange rate regimes: Deeds vs. words”, European Economic Review , 49(6), pp. 1603-1635.
LUMSDAINE, R.L. and D.H. PAPELL (1997), “Multiple trend breaks and the unit root hypothesis”, The Review of Economics and Statistics, pp. 212-218, Mai.
MACDONALD, R. (2000), “Concepts to Calculate Equilibrium Exchange Rates: An Overview”, Discussion Paper Series 1: Economic Studies, 03, Deutsche Bundesbank, Research Centre.
MACDONALD, R. and J.L. STEIN (1999), Equilibrium exchange rates, Kluwer Academic Publishers.
MURRAY, C.J. and CR. NELSON (2000), “The uncertain trend in U.S. GDP”, Journal of
Monetary Economics, 46, pp. 79-95.
20
NG, S. and P. PERRON (2001), “Lag length selection and the construction of unit root tests with good size and power”, Econometrica, 69, pp. 1519-1554.
PAPELL, DH, R. PRODAN (2006), “Additional evidence of long-run purchasing power parity with restricted structural changes”, Journal of Money, Credit, and Banking, 38(5), pp. 1329–1349.
PERRON, P. (1997), “Further evidence on breaking trend functions in macroeconomics variables”, Journal of Econometrics, 80, pp. 355-385.
PERRON, P. (2006), “Dealing with structural breaks”, in MILLS T.C. and PATTERSON K. (eds), Palgrave Handbook of Econometrics, 1, Palgrave MacMillan, pp. 278-352.
PERRON, P. and T.J. VOGELSANG (1992), “Nonstationarity and level shifts with an application to purchasing power parity”, Journal of Business and Economic Statistics, 10, pp. 301-320.
PERRON, P. and T. YABU (2009a), “Estimating deterministic trends with an integrated or stationary noise component”, Journal of Econometrics, 151, pp. 56-69.
PERRON, P. and T. YABU (2009b), “Testing for shifts in trend with an integrated or stationary noise component”, Journal of Business and Economic Statistics, 27, pp. 369-396.
PESARAN, M.H., Y. SHIN, and R. SMITH (2001), “Bounds testing approaches to the analysis of level relationships”, Journal of Applied Econometrics, 16, pp. 289-326.
PHILLIPS, P.C.B. and P. PERRON (1988), “Testing for a unit root in time series regression”, Biometrika, 75, pp. 335-346.
REY, S. (2009), “L'apport du NATREX à la modélisation des taux de change d'équilibre: théorie et application au dollar canadien”, L’Actualité Economique : Revue d’Analyse
Economique, 85(2), pp. 131-181.
SAMUELSON, P.A. (1964), “Theoretical Notes on Trade Problems”, The Review of
Economics and Statistics, 46, pp. 595-608.
STEIN, J. L. (1994), “The natural real exchange rate of the US dollar and determinants of capital flows,” in WILLIAMSON J. (ed.), Estimating equilibrium exchange rate, Washington, D.C., Institute for International Economics.
SUDRIE, O. (2012), “Quel développement des départements et collectivités d’outre-mer ? Une approche par l’indice de développement humain ”, Document de travail de l’AFD, n°129, November (updated in Febrary 2013).
TAYLOR, A.M. and M.P. TAYLOR (2004), “The purchasing power parity debate”, Journal
of Economic Perspectives, 18, pp. 135-158.
TAYLOR, M.P. (2006), “Real exchange rates and purchasing power parity: mean-reversion in economic thought”, Applied Financial Economics, 16, pp. 1-17.

21
WILLIAMSON J. (1994), Estimating equilibrium exchange rate, Washington, D.C., Institute for International Economics.
YIN, Y. and G.S. MADDALA (1997), “The effects of different types of outliers on unit root tests”, in FOMBY T.B. et HILL R.C. (eds.), Advances in Econometrics, 13, JAI Press, Greenwich, Conn.
22
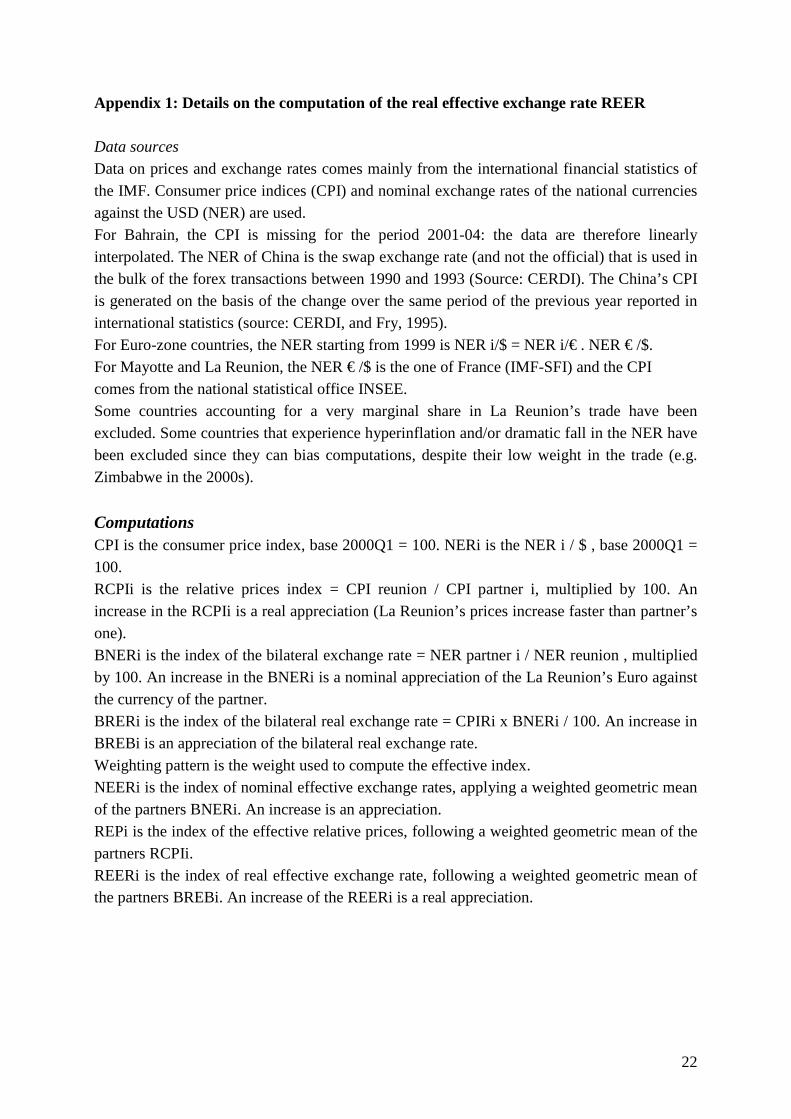
Appendix 1: Details on the computation of the real effective exchange rate REER Data sources
Data on prices and exchange rates comes mainly from the international financial statistics of the IMF. Consumer price indices (CPI) and nominal exchange rates of the national currencies against the USD (NER) are used. For Bahrain, the CPI is missing for the period 2001-04: the data are therefore linearly interpolated. The NER of China is the swap exchange rate (and not the official) that is used in the bulk of the forex transactions between 1990 and 1993 (Source: CERDI). The China’s CPI is generated on the basis of the change over the same period of the previous year reported in international statistics (source: CERDI, and Fry, 1995). For Euro-zone countries, the NER starting from 1999 is NER i/$ = NER i/€ . NER € /$. For Mayotte and La Reunion, the NER € /$ is the one of France (IMF-SFI) and the CPI comes from the national statistical office INSEE. Some countries accounting for a very marginal share in La Reunion’s trade have been excluded. Some countries that experience hyperinflation and/or dramatic fall in the NER have been excluded since they can bias computations, despite their low weight in the trade (e.g. Zimbabwe in the 2000s).
Computations CPI is the consumer price index, base 2000Q1 = 100. NERi is the NER i / $ , base 2000Q1 = 100. RCPIi is the relative prices index = CPI reunion / CPI partner i, multiplied by 100. An increase in the RCPIi is a real appreciation (La Reunion’s prices increase faster than partner’s one). BNERi is the index of the bilateral exchange rate = NER partner i / NER reunion , multiplied by 100. An increase in the BNERi is a nominal appreciation of the La Reunion’s Euro against the currency of the partner. BRERi is the index of the bilateral real exchange rate = CPIRi x BNERi / 100. An increase in BREBi is an appreciation of the bilateral real exchange rate. Weighting pattern is the weight used to compute the effective index. NEERi is the index of nominal effective exchange rates, applying a weighted geometric mean of the partners BNERi. An increase is an appreciation. REPi is the index of the effective relative prices, following a weighted geometric mean of the partners RCPIi. REERi is the index of real effective exchange rate, following a weighted geometric mean of the partners BREBi. An increase of the REERi is a real appreciation.
23
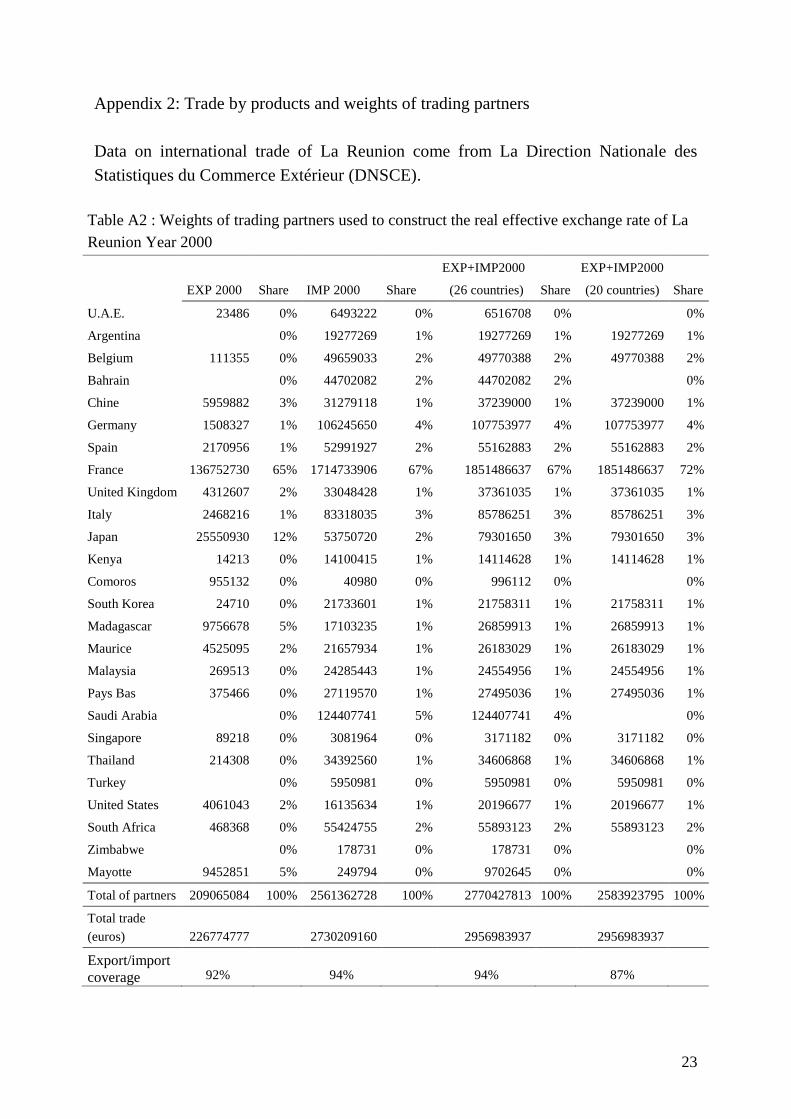
Appendix 2: Trade by products and weights of trading partners
Data on international trade of La Reunion come from La Direction Nationale des Statistiques du Commerce Extérieur (DNSCE).
Table A2 : Weights of trading partners used to construct the real effective exchange rate of La Reunion Year 2000
EXP 2000 Share IMP 2000 Share
EXP+IMP2000
(26 countries) Share
EXP+IMP2000
(20 countries) Share
U.A.E. 23486 0% 6493222 0% 6516708 0% 0%
Argentina 0% 19277269 1% 19277269 1% 19277269 1%
Belgium 111355 0% 49659033 2% 49770388 2% 49770388 2%
Bahrain 0% 44702082 2% 44702082 2% 0%
Chine 5959882 3% 31279118 1% 37239000 1% 37239000 1%
Germany 1508327 1% 106245650 4% 107753977 4% 107753977 4%
Spain 2170956 1% 52991927 2% 55162883 2% 55162883 2%
France 136752730 65% 1714733906 67% 1851486637 67% 1851486637 72%
United Kingdom 4312607 2% 33048428 1% 37361035 1% 37361035 1%
Italy 2468216 1% 83318035 3% 85786251 3% 85786251 3%
Japan 25550930 12% 53750720 2% 79301650 3% 79301650 3%
Kenya 14213 0% 14100415 1% 14114628 1% 14114628 1%
Comoros 955132 0% 40980 0% 996112 0% 0%
South Korea 24710 0% 21733601 1% 21758311 1% 21758311 1%
Madagascar 9756678 5% 17103235 1% 26859913 1% 26859913 1%
Maurice 4525095 2% 21657934 1% 26183029 1% 26183029 1%
Malaysia 269513 0% 24285443 1% 24554956 1% 24554956 1%
Pays Bas 375466 0% 27119570 1% 27495036 1% 27495036 1%
Saudi Arabia 0% 124407741 5% 124407741 4% 0%
Singapore 89218 0% 3081964 0% 3171182 0% 3171182 0%
Thailand 214308 0% 34392560 1% 34606868 1% 34606868 1%
Turkey 0% 5950981 0% 5950981 0% 5950981 0%
United States 4061043 2% 16135634 1% 20196677 1% 20196677 1%
South Africa 468368 0% 55424755 2% 55893123 2% 55893123 2%
Zimbabwe 0% 178731 0% 178731 0% 0%
Mayotte 9452851 5% 249794 0% 9702645 0% 0%
Total of partners 209065084 100% 2561362728 100% 2770427813 100% 2583923795 100%
Total trade (euros) 226774777 2730209160 2956983937 2956983937
Export/import coverage 92% 94% 94% 87%
24
Appendix 3: Annual data for the model of REER over the period 1980-2011 A3.1 Sources of data Real GDP per capita: The real GDP is the nominal GDP of La Reunion (million euro) deflated by the consumer price index. Then the real GDP is divided by the population to obtain the real GDP per capita. Data on GDP are extracted from INSEE, ISEE, ISPF – Comptes nationaux semi-définitifs, comptes rapides provisoires and from Besson and Dablin (1997). Historical population data are available in Widmer (2005). Cf. also Salmon and Antona (1991). CPI data: INSEE Besson, D. and J.-P. Dablin, (1997), « 25 ans de comptes économiques des départements »,
INSEE, (1987), «Comptes économiques 1970-1985 », Les dossiers de l’économie réunionnaise, n°9, août. Salmon, J.-M. and M. Antona (1991), “Le développement socio-économique dans les Dom-Tom: Etat des lieux”, rapport IFREMER. Widmer, I., (2005), « La Réunion et Maurice », Les cahiers de l’INED n°155, Institut National des Etudes Démographiques.
Global productivity: The global productivity is calculated as the ratio between Added Value of the economy of La Reunion and the total of salaried employees in the private sector and the public sector (INSEE).
Transfers: Transfers data are the net transfers from the metropolis. They are extracted from various numbers of “Panorama de l’économie de La Réunion” for the 1980s and 1990s,INSEE, and IEDOM for the recent years.
Relative prices: Data on imports and exports prices of advanced economies are extracted from IFS data, IMF.
25
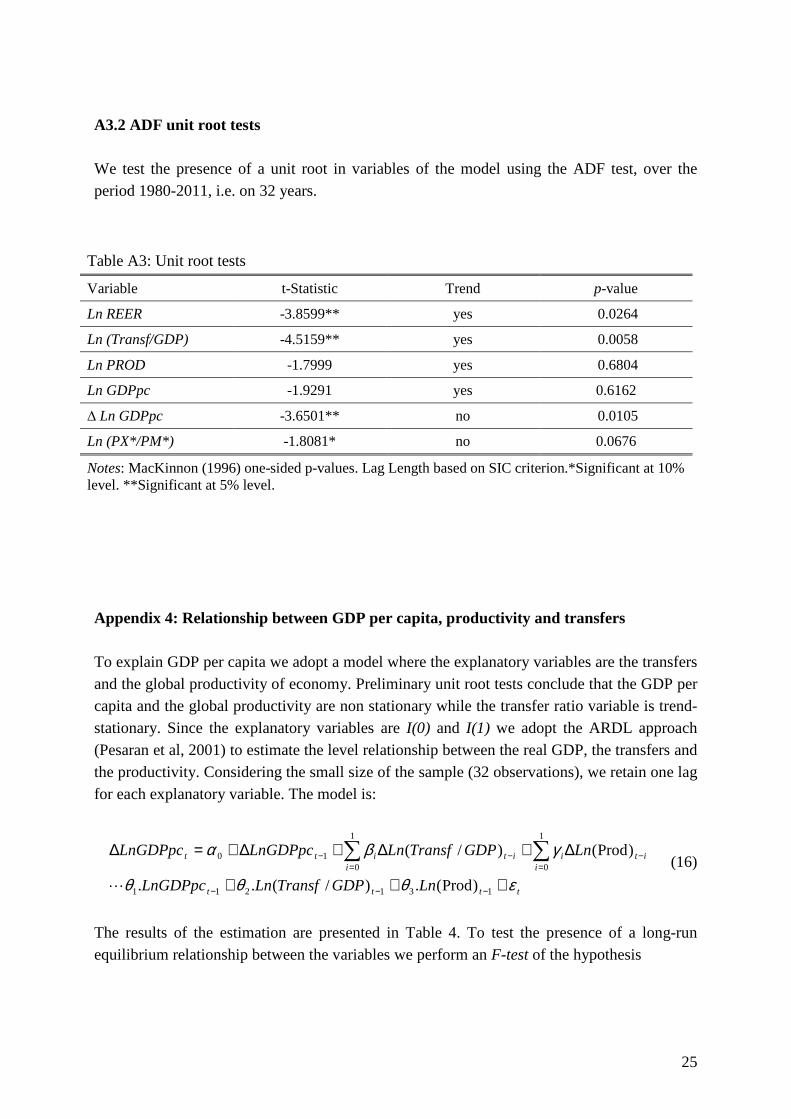
A3.2 ADF unit root tests We test the presence of a unit root in variables of the model using the ADF test, over the period 1980-2011, i.e. on 32 years.
Table A3: Unit root tests
Variable t-Statistic Trend p-value
Ln REER -3.8599** yes 0.0264
Ln (Transf/GDP) -4.5159** yes 0.0058
Ln PROD -1.7999 yes 0.6804
Ln GDPpc -1.9291 yes 0.6162
∆ Ln GDPpc -3.6501** no 0.0105
Ln (PX*/PM*) -1.8081* no 0.0676
Notes: MacKinnon (1996) one-sided p-values. Lag Length based on SIC criterion.*Significant at 10% level. **Significant at 5% level.
Appendix 4: Relationship between GDP per capita, productivity and transfers
To explain GDP per capita we adopt a model where the explanatory variables are the transfers and the global productivity of economy. Preliminary unit root tests conclude that the GDP per capita and the global productivity are non stationary while the transfer ratio variable is trend-stationary. Since the explanatory variables are I(0) and I(1) we adopt the ARDL approach (Pesaran et al, 2001) to estimate the level relationship between the real GDP, the transfers and the productivity. Considering the small size of the sample (32 observations), we retain one lag for each explanatory variable. The model is:
tttt
iiti
iititt
LnGDPTransfLnLnGDPpc
LnGDPTransfLnLnGDPpcLnGDPpc
εθθθ
γβα
+++
∆+∆+∆+=∆
−−−
=−
=−− ∑∑
131211
1
0
1
010
)Prod(.)/(..
)Prod()/(
L
(16)
The results of the estimation are presented in Table 4. To test the presence of a long-run equilibrium relationship between the variables we perform an F-test of the hypothesis
26
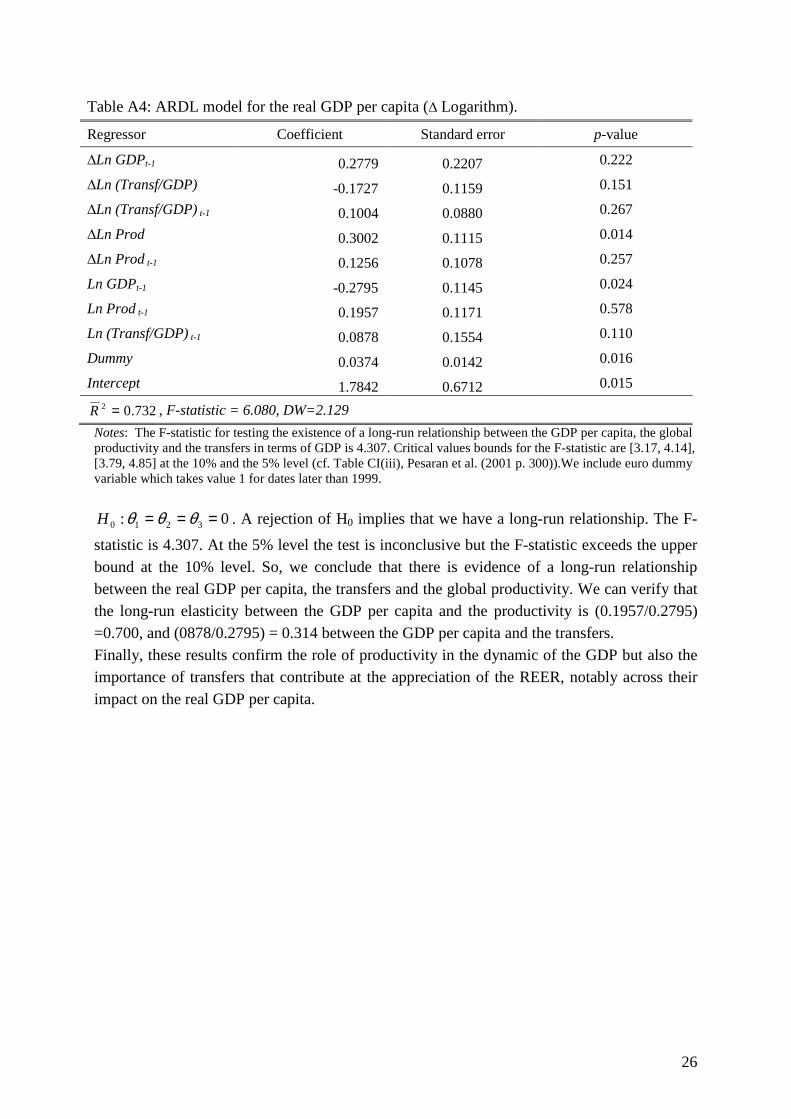
Table A4: ARDL model for the real GDP per capita (∆ Logarithm).
Regressor Coefficient Standard error p-value
∆Ln GDPt-1 0.2779 0.2207 0.222
∆Ln (Transf/GDP) -0.1727 0.1159 0.151
∆Ln (Transf/GDP) t-1 0.1004 0.0880 0.267
∆Ln Prod 0.3002 0.1115 0.014
∆Ln Prod t-1 0.1256 0.1078 0.257
Ln GDPt-1 -0.2795 0.1145 0.024
Ln Prod t-1 0.1957 0.1171 0.578
Ln (Transf/GDP) t-1 0.0878 0.1554 0.110
Dummy 0.0374 0.0142 0.016
Intercept 1.7842 0.6712 0.015
732.02 =R , F-statistic = 6.080, DW=2.129 Notes: The F-statistic for testing the existence of a long-run relationship between the GDP per capita, the global productivity and the transfers in terms of GDP is 4.307. Critical values bounds for the F-statistic are [3.17, 4.14], [3.79, 4.85] at the 10% and the 5% level (cf. Table CI(iii), Pesaran et al. (2001 p. 300)).We include euro dummy variable which takes value 1 for dates later than 1999.
0: 3210 === θθθH . A rejection of H0 implies that we have a long-run relationship. The F-
statistic is 4.307. At the 5% level the test is inconclusive but the F-statistic exceeds the upper bound at the 10% level. So, we conclude that there is evidence of a long-run relationship between the real GDP per capita, the transfers and the global productivity. We can verify that the long-run elasticity between the GDP per capita and the productivity is (0.1957/0.2795) =0.700, and (0878/0.2795) = 0.314 between the GDP per capita and the transfers. Finally, these results confirm the role of productivity in the dynamic of the GDP but also the importance of transfers that contribute at the appreciation of the REER, notably across their impact on the real GDP per capita.
27
Figure 1: Trade balance of La Reunion (million euros)
Source: Authors' calculations, data DNSCE
Figure 2a: Origins of La Reunion imports, Year 2007
Figure 2b: Destinations of La Reunion exports, Year 2007
-5000
-4000
-3000
-2000
-1000
0
1988
1990
1992
1994
1996
1998
2000
2002
2004
2006
2008
Major suppliers(en % )
0102030405060
Metrop
olis
Singap
ore
China
German
yIta
ly
Belgium
South
Africa
Span
Thaila
ndJa
pan
Malays
ia
Major suppliers except metropolis (en %)
0
5
10
15
20
Singap
ore
China
German
yIta
ly
Belgium
South
Africa
Span
Thaila
nd
Japa
n
Malays
ia
Major customers(en %)
0102030405060
Metropo
lis
Mayott
e
Madaga
scar
German
yJap
an Italy
India
Hong K
ongChin
a
Maurit
iusUSA
Major customers except metropolis(en %)
0
5
10
15
20
Mayott
e
Madaga
scar
German
yJa
pan
Italy
India
Hong K
ong
China
Maurit
ius USA
28
Figure 3: Trade by products of La Reunion - 2006 Source: INSEE-Réunion
Figure 4: Real effective exchange rate of La Reunion
0,00
10,00
20,00
30,00
40,00
50,00
60,00
70,00
Foodindustry
Equipmentgoods
Intermed.goods
Cons.goods
Agriculturalproducts
Fisheryproducts
Other
Exports by products (metropolis excluded, en %)
0,00
5,00
10,00
15,00
20,00
25,00
30,00
Equipmentgoods
Cons.goods
Intermed.goods
Foodindustry
Fuel Mineral Agriculturalproducts
Services Fisheryproducts
Imports by products (metropolis excluded, en %)
92
94
96
98
100
102
104
106
108
1990
Q1
1991
Q1
1992
Q1
1993
Q1
1994
Q1
1995
Q1
1996
Q1
1997
Q1
1998
Q1
1999
Q1
2000
Q1
2001
Q1
2002
Q1
2003
Q1
2004
Q1
2005
Q1
2006
Q1
2007
Q1
2008
Q1
2009
Q1
2010
Q1
NEER
ERP
REER
29
Figure 5: Bilateral exchange rates La Reunion-Euro Area (2000Q1=100, weight in the real effective exchange rate = 84%, whose France 72%)
Figure 6: Bilateral exchange rates La Reunion-Industrial countries (2000Q1=100, weight in the real effective exchange rate = 6%)
80
85
90
95
100
105
110
115
120
1990
Q1
1991
Q1
1992
Q1
1993
Q1
1994
Q1
1995
Q1
1996
Q1
1997
Q1
1998
Q1
1999
Q1
2000
Q1
2001
Q1
2002
Q1
2003
Q1
2004
Q1
2005
Q1
2006
Q1
2007
Q1
2008
Q1
2009
Q1
2010
Q1
Belgium GermanySpain FranceItaly Netherlands
80
100
120
140
160
180
1990
Q1
1991
Q1
1992
Q1
1993
Q1
1994
Q1
1995
Q1
1996
Q1
1997
Q1
1998
Q1
1999
Q1
2000
Q1
2001
Q1
2002
Q1
2003
Q1
2004
Q1
2005
Q1
2006
Q1
2007
Q1
2008
Q1
2009
Q1
2010
Q1
United Kingdom JapanUnited States KoreaSingapore

30
Figure 7: Bilateral exchange rates La Reunion-Emerging countries (2000Q1=100, weight in the real effective exchange rate = 5%)
Figure 8: Bilateral exchange rates La Reunion-Indian Ocean (2000Q1=100, weight in the real effective exchange rate = 5%)
70
90
110
130
150
170
190
210
1990
Q1
1991
Q2
1992
Q3
1993
Q4
1995
Q1
1996
Q2
1997
Q3
1998
Q4
2000
Q1
2001
Q2
2002
Q3
2003
Q4
2005
Q1
2006
Q2
2007
Q3
2008
Q4
2010
Q1
0
50
100
150
200
250
300
350
Arg
entin
a
China MalaysiaThailand ArgentinaTurkey
50
70
90
110
130
150
170
1990
Q1
1991
Q1
1992
Q1
1993
Q1
1994
Q1
1995
Q1
1996
Q1
1997
Q1
1998
Q1
1999
Q1
2000
Q1
2001
Q1
2002
Q1
2003
Q1
2004
Q1
2005
Q1
2006
Q1
2007
Q1
2008
Q1
2009
Q1
2010
Q1
Kenya MadagascarMauritius South AfricaMayotte
31
50
60
70
80
90
100
110
120
130
140
.30
.32
.34
.36
.38
.40
.42
.44
.46
.48
80 82 84 86 88 90 92 94 96 98 00 02 04 06 08 10
Global productivityReal GDP per capitaTransfers/GDP (right scale)
Figure 9: Productivity, GDP per capita and transfers-to-GDP ratio of La Reunion
Figure 10: Real exchange rate and Equilibrium real exchange rate (Log) of La Reunion, 1990-2010
4.57
4.58
4.59
4.60
4.61
4.62
4.63
4.64
4.65
4.66
90 92 94 96 98 00 02 04 06 08 10
REER Equilibrium REER
32
Figure 11: Misalignments of the real exchange rate of La Reunion, 1990-2010
4.52
4.54
4.56
4.58
4.60
4.62
4.64
4.66
80 82 84 86 88 90 92 94 96 98 00 02 04 06 08 10
Log of equilibrium REERLog of REER
Overvaluation
Undervaluation
Figure 12: Equilibrium REER calculated from exchange rate equation
-.04
-.03
-.02
-.01
.00
.01
.02
.03
90 92 94 96 98 00 02 04 06 08 10
Misalignments
Misalignments (without break) Misalignments (with break)
33
-.04
-.02
.00
.02
.04
.06
.08
80 85 90 95 00 05 10
Overvaluation
Undervaluation
Figure 13: Misalignments calculated from the exchange rate equation
34
Table 1: Tests for the presence of structural breaks in the linear trend
Series Structural breaks in the slope ExpW
Structural breaks in the level U
REER -0,2708 0,2971
Critical values 1,6700 1,7400 Note: the t-stat ExpW and U result from the Perron and Yabu (2009b) and Harvey et al. (2010) tests, respectively.
Table 2 : Unit root tests for the real effective exchange rate (Log) of La Reunion, 1990-2010
Tests Model 1 Model 2 Conclusion
t-stat Critical value t-stat Critical value 1% 5% 10% 1% 5% 10% ADF -3,62** -4,07 -3,46 -3,16 -1,67 -3,51 -2,89 -2,58 Trend stationary PP -3,61** -4,07 -3,46 -3,16 -1,84 -3,51 -2,89 -2,58 Trend stationary KPSS 0,10 0,21 0,14 0,11 1,07*** 0,73 0,46 0,34 Trend stationary ERS -3,51** -3,65 -3,09 -2,80 -0,35 -2,59 -1,94 -1,61 Trend stationary MZa -19,0** -23,8 -17,3 -14,2 -0,65 -13,8 -8,1 -5,7 Trend stationary MZt -3,03** -3,42 -2,91 -2,62 -0,36 -2,58 -1,98 -1,62 Trend stationary
***,**, * indicate that the null hypothesis is rejected at the 1% level, at 5% level and at 10% level.
35
Table 3: Equation of REER (Logarithm)
Regressors (1) (2)
Ln REERt-1 0.6821**
(0.000)
0,5895**
(0.000)
Ln (PX*/PM*)t-1 0.1006**
(0.017)
0,0838**
(0.045)
Ln (Transf/GDP) t 0.1774**
(0.0002)
0,1161**
(0.008)
∆ Ln GDPpct 0.0961
(0.203)
Trend 0,0007*
(0.109)
Intercept 1.6308**
(0.0002)
1,9858**
(0.001)
923.02 =R
F-statistic = 91.524 Durbin's h = -2.791
926.02 =R ; F-statistic = 95.224 Durbin's h = -0.615
* Significant at 10%;**significant at 5%. P-value in parenthesis.