Embed Size (px)
Citation preview
Page | 1 | PHILLIP SECURITIES RESEARCH (SINGAPORE) MCI (P) 062/10/2018 Ref. No.: SG2019_0112
Real Estate Agencies Can have pie and eat it, too
SINGAPORE | REAL ESTATE (AGENCIES)| INITIATION Both PropNex and APAC Realty (operating under the ERA brand) have close to half the
number of real estate agents in Singapore and handled an average c.85% of all property transactions (by no. of units) in 2018.
High unleveraged return on capital, due to asset-light nature of business and variable pay structure of most of the salesforce.
Resilient even in industry downturns, matching or beating the movements of the property market.
Initiate coverage on APAC Realty Limited (BUY; TP S$0.65) and PropNex Limited (BUY; TP S$0.63)
Investment Merits 1) Exceptional market share
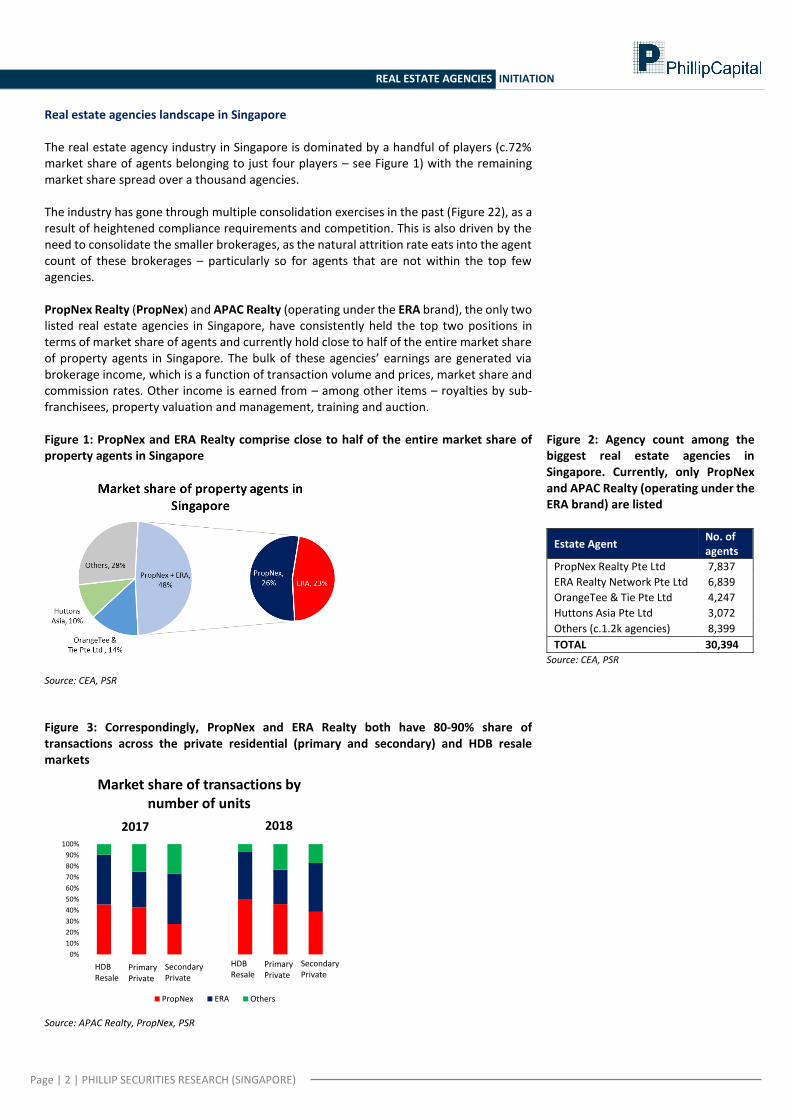
PropNex and ERA comprise c.48% of the property agents in Singapore (Figure 1). In 2018, these two brokerages made up for 93% / 77% / 83% of HDB resale / primary residential / secondary residential transactions (by no. of units) (Figure 2). Industry consolidation in the past has seen PropNex and ERA gain market share over the years, from 13% and 15% of total property agents in Singapore in 2012 to 26% and 23% in 2019, respectively. The dominance of these two market players within the real estate brokerage market in Singapore allowed them to capture a substantial amount of transactions, be it in a buyers’ market or sellers’ market.
2) High unleveraged return on capital Both companies clocked in high double-digit ROEs over the years – PropNex 31% and APAC Realty 17%, for FY2018 – with little to no leverage (the debt presently held under APAC Realty relates to a mortgage over its single investment property). The brokerage business is asset-light, with most of the salesforce being paid on a variable basis, allowing both companies to easily maintain or grow their high ROE.
3) Resilient even in industry downturns Both PropNex and APAC Realty were able to match or beat the movements of the property market each time, with their revenue YoY change overlapping that of the private residential transactions YoY change (Figure 20). In 2018 for example, PropNex and APAC Realty recorded a +6% and +30% increase in revenue, respectively, in spite of the -8% decline in private residential transactions. On the flip side, in 2017, PropNex and APAC Realty recorded a +39% and +35% increase in revenue, respectively, outstripping the +21% growth in private residential transactions.
Outlook The real estate agencies’ model is highly scalable and resilient, especially with both APAC Realty and PropNex capturing an average c.85% of total market transactions. Aside from gaining market share and being a proxy to the Singapore residential market when volumes pick up, a key upside would be the pivoting towards overseas markets – by eventually owning and consolidating said operations, thus also diversifying the earnings base out of Singapore. Investment Actions Initiate on the Real Estate Agencies sector: 1) BUY on APAC Realty Limited (TP: S$0.65) 2) BUY on PropNex Limited (TP: S$0.63)
3 June 2019
Tara Wong Research Analyst (+65 6212 1850) [email protected]
APAC REALTY
BUY (Initiation)LAST DONE PRICE
FORECAST DIV
TARGET PRICE
TOTAL RETURN
SGD 0.52
SGD 0.04
SGD 0.65
34.0%
PROPNEX REALTY
BUY (Initiation)LAST DONE PRICE
FORECAST DIV
TARGET PRICE
TOTAL RETURN
SGD 0.51
SGD 0.04
SGD 0.63
31.8%
Page | 2 | PHILLIP SECURITIES RESEARCH (SINGAPORE)
REAL ESTATE AGENCIES INITIATION
Real estate agencies landscape in Singapore The real estate agency industry in Singapore is dominated by a handful of players (c.72% market share of agents belonging to just four players – see Figure 1) with the remaining market share spread over a thousand agencies. The industry has gone through multiple consolidation exercises in the past (Figure 22), as a result of heightened compliance requirements and competition. This is also driven by the need to consolidate the smaller brokerages, as the natural attrition rate eats into the agent count of these brokerages – particularly so for agents that are not within the top few agencies. PropNex Realty (PropNex) and APAC Realty (operating under the ERA brand), the only two listed real estate agencies in Singapore, have consistently held the top two positions in terms of market share of agents and currently hold close to half of the entire market share of property agents in Singapore. The bulk of these agencies’ earnings are generated via brokerage income, which is a function of transaction volume and prices, market share and commission rates. Other income is earned from – among other items – royalties by sub-franchisees, property valuation and management, training and auction. Figure 1: PropNex and ERA Realty comprise close to half of the entire market share of property agents in Singapore
Source: CEA, PSR
Figure 3: Correspondingly, PropNex and ERA Realty both have 80-90% share of transactions across the private residential (primary and secondary) and HDB resale markets
Source: APAC Realty, PropNex, PSR
Figure 2: Agency count among the biggest real estate agencies in Singapore. Currently, only PropNex and APAC Realty (operating under the ERA brand) are listed
Estate Agent No. of agents
PropNex Realty Pte Ltd 7,837
ERA Realty Network Pte Ltd 6,839
OrangeTee & Tie Pte Ltd 4,247
Huttons Asia Pte Ltd 3,072
Others (c.1.2k agencies) 8,399
TOTAL 30,394 Source: CEA, PSR
0%
10%
20%
30%
40%
50%
60%
70%
80%
90%
100%
Market share of transactions by number of units
PropNex ERA Others
2017 2018
Primary Private
SecondaryPrivate
HDB Resale
Primary Private
SecondaryPrivate
HDB Resale
Page | 3 | PHILLIP SECURITIES RESEARCH (SINGAPORE)
REAL ESTATE AGENCIES INITIATION
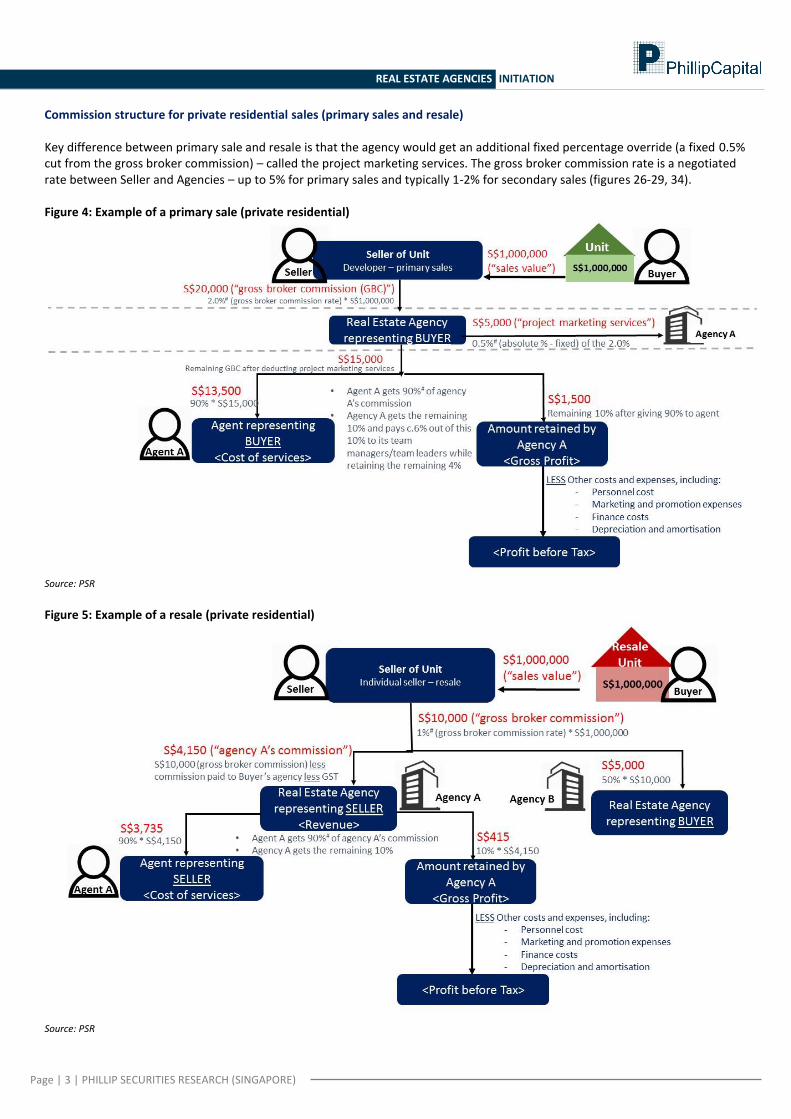
Commission structure for private residential sales (primary sales and resale) Key difference between primary sale and resale is that the agency would get an additional fixed percentage override (a fixed 0.5% cut from the gross broker commission) – called the project marketing services. The gross broker commission rate is a negotiated rate between Seller and Agencies – up to 5% for primary sales and typically 1-2% for secondary sales (figures 26-29, 34). Figure 4: Example of a primary sale (private residential)
Source: PSR
Figure 5: Example of a resale (private residential)
Source: PSR
Page | 4 | PHILLIP SECURITIES RESEARCH (SINGAPORE)
REAL ESTATE AGENCIES INITIATION
Key financial line items
Revenue Brokerage related (c.75-80% of revenue)
Private residential – primary launches
Private residential – resale
HDB – resale
Commercial/industrial – resale
Rental – Private residential, HDB, commercial/industrial
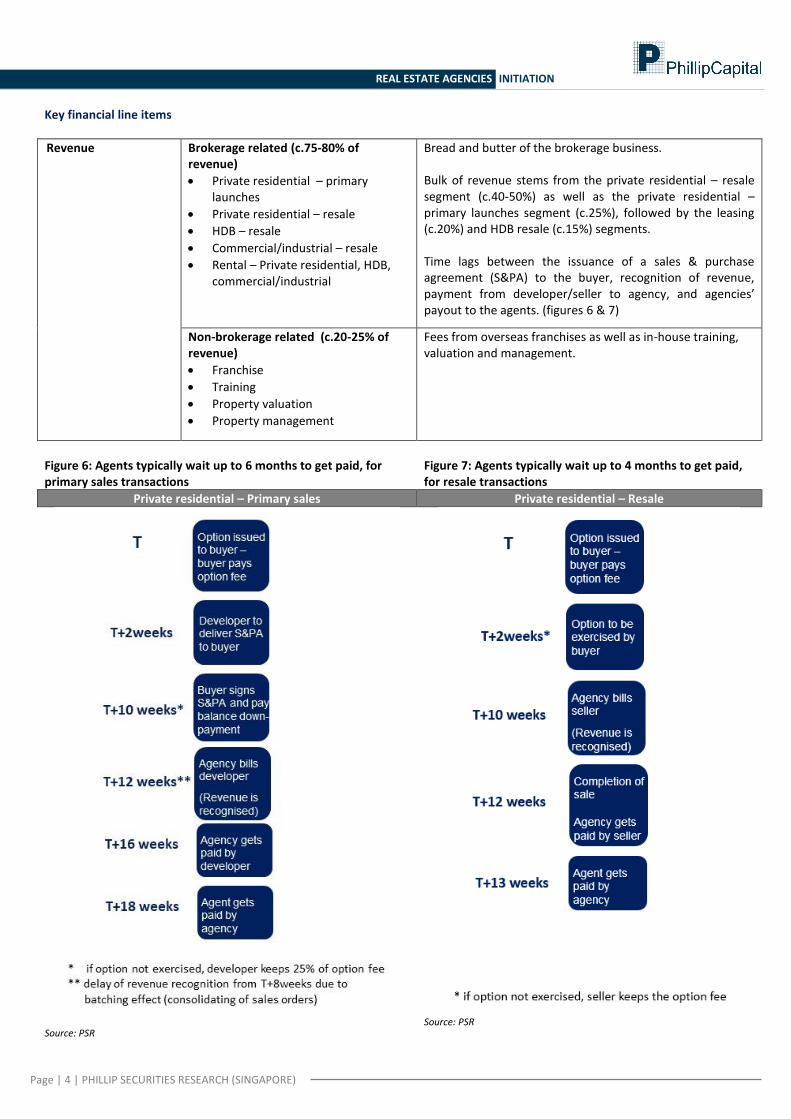
Bread and butter of the brokerage business. Bulk of revenue stems from the private residential – resale segment (c.40-50%) as well as the private residential – primary launches segment (c.25%), followed by the leasing (c.20%) and HDB resale (c.15%) segments. Time lags between the issuance of a sales & purchase agreement (S&PA) to the buyer, recognition of revenue, payment from developer/seller to agency, and agencies’ payout to the agents. (figures 6 & 7)
Non-brokerage related (c.20-25% of revenue)
Franchise
Training
Property valuation
Property management
Fees from overseas franchises as well as in-house training, valuation and management.
Figure 6: Agents typically wait up to 6 months to get paid, for primary sales transactions
Figure 7: Agents typically wait up to 4 months to get paid, for resale transactions
Private residential – Primary sales Private residential – Resale
Source: PSR
Source: PSR
Page | 5 | PHILLIP SECURITIES RESEARCH (SINGAPORE)
REAL ESTATE AGENCIES INITIATION
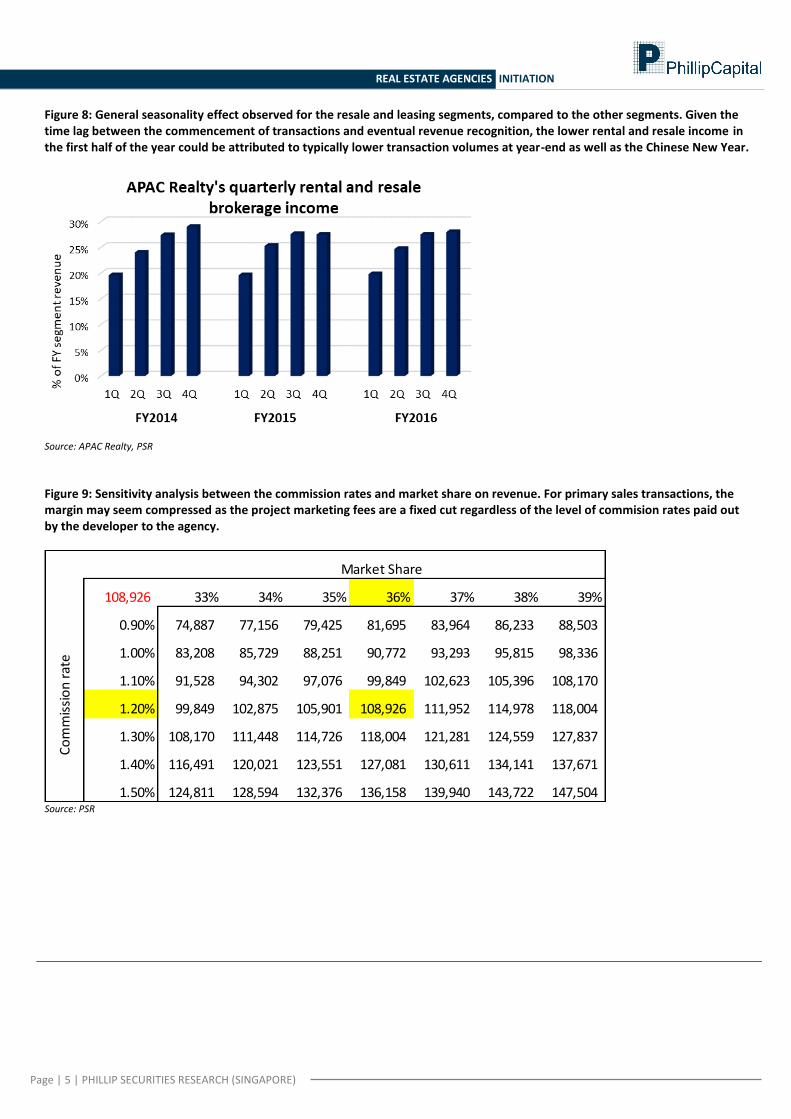
Figure 8: General seasonality effect observed for the resale and leasing segments, compared to the other segments. Given the time lag between the commencement of transactions and eventual revenue recognition, the lower rental and resale income in the first half of the year could be attributed to typically lower transaction volumes at year-end as well as the Chinese New Year.
Source: APAC Realty, PSR
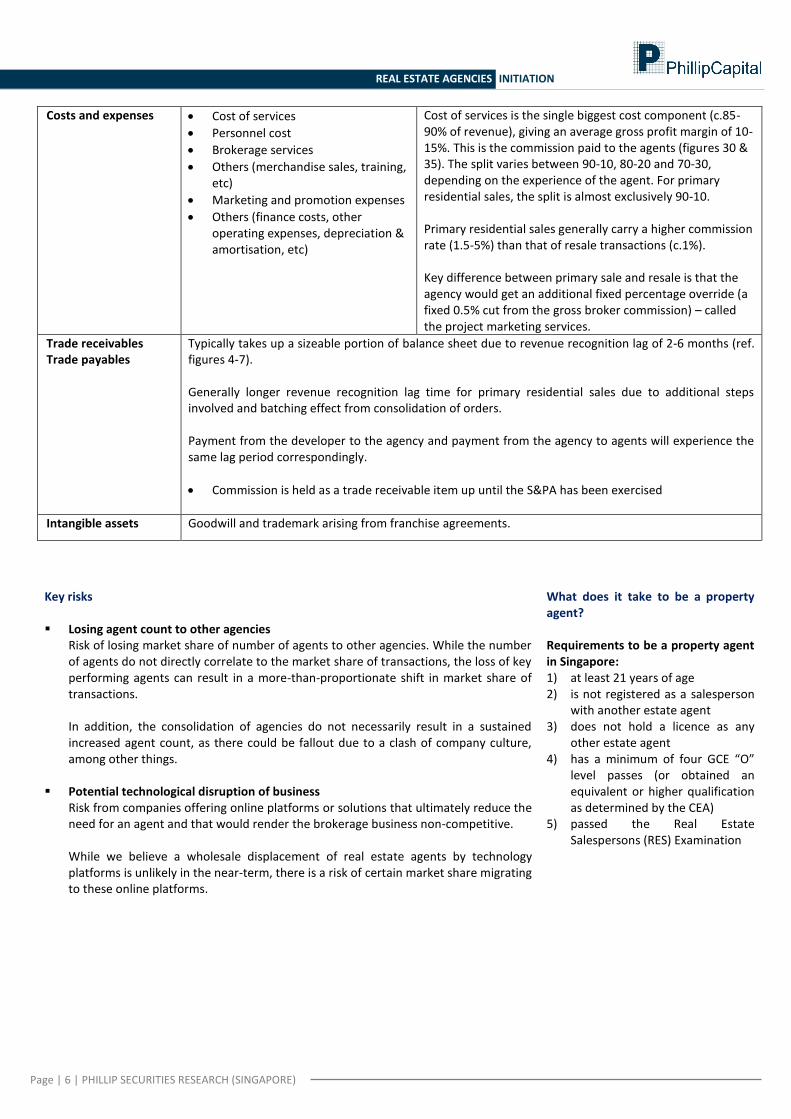
Figure 9: Sensitivity analysis between the commission rates and market share on revenue. For primary sales transactions, the margin may seem compressed as the project marketing fees are a fixed cut regardless of the level of commision rates paid out by the developer to the agency.
Source: PSR
108,926 33% 34% 35% 36% 37% 38% 39%
0.90% 74,887 77,156 79,425 81,695 83,964 86,233 88,503
1.00% 83,208 85,729 88,251 90,772 93,293 95,815 98,336
1.10% 91,528 94,302 97,076 99,849 102,623 105,396 108,170
1.20% 99,849 102,875 105,901 108,926 111,952 114,978 118,004
1.30% 108,170 111,448 114,726 118,004 121,281 124,559 127,837
1.40% 116,491 120,021 123,551 127,081 130,611 134,141 137,671
1.50% 124,811 128,594 132,376 136,158 139,940 143,722 147,504
Market Share
Co
mm
issi
on
rat
e
Page | 6 | PHILLIP SECURITIES RESEARCH (SINGAPORE)
REAL ESTATE AGENCIES INITIATION
Costs and expenses Cost of services
Personnel cost
Brokerage services
Others (merchandise sales, training, etc)
Marketing and promotion expenses
Others (finance costs, other operating expenses, depreciation & amortisation, etc)
Cost of services is the single biggest cost component (c.85-90% of revenue), giving an average gross profit margin of 10-15%. This is the commission paid to the agents (figures 30 & 35). The split varies between 90-10, 80-20 and 70-30, depending on the experience of the agent. For primary residential sales, the split is almost exclusively 90-10. Primary residential sales generally carry a higher commission rate (1.5-5%) than that of resale transactions (c.1%). Key difference between primary sale and resale is that the agency would get an additional fixed percentage override (a fixed 0.5% cut from the gross broker commission) – called the project marketing services.
Trade receivables Trade payables
Typically takes up a sizeable portion of balance sheet due to revenue recognition lag of 2-6 months (ref. figures 4-7). Generally longer revenue recognition lag time for primary residential sales due to additional steps involved and batching effect from consolidation of orders. Payment from the developer to the agency and payment from the agency to agents will experience the same lag period correspondingly.
Commission is held as a trade receivable item up until the S&PA has been exercised
Intangible assets Goodwill and trademark arising from franchise agreements.
Key risks Losing agent count to other agencies
Risk of losing market share of number of agents to other agencies. While the number of agents do not directly correlate to the market share of transactions, the loss of key performing agents can result in a more-than-proportionate shift in market share of transactions. In addition, the consolidation of agencies do not necessarily result in a sustained increased agent count, as there could be fallout due to a clash of company culture, among other things.
Potential technological disruption of business
Risk from companies offering online platforms or solutions that ultimately reduce the need for an agent and that would render the brokerage business non-competitive. While we believe a wholesale displacement of real estate agents by technology platforms is unlikely in the near-term, there is a risk of certain market share migrating to these online platforms.
What does it take to be a property agent? Requirements to be a property agent in Singapore: 1) at least 21 years of age 2) is not registered as a salesperson
with another estate agent 3) does not hold a licence as any
other estate agent 4) has a minimum of four GCE “O”
level passes (or obtained an equivalent or higher qualification as determined by the CEA)
5) passed the Real Estate Salespersons (RES) Examination
Page | 7 | PHILLIP SECURITIES RESEARCH (SINGAPORE)
REAL ESTATE AGENCIES INITIATION
Outlook for Singapore property market
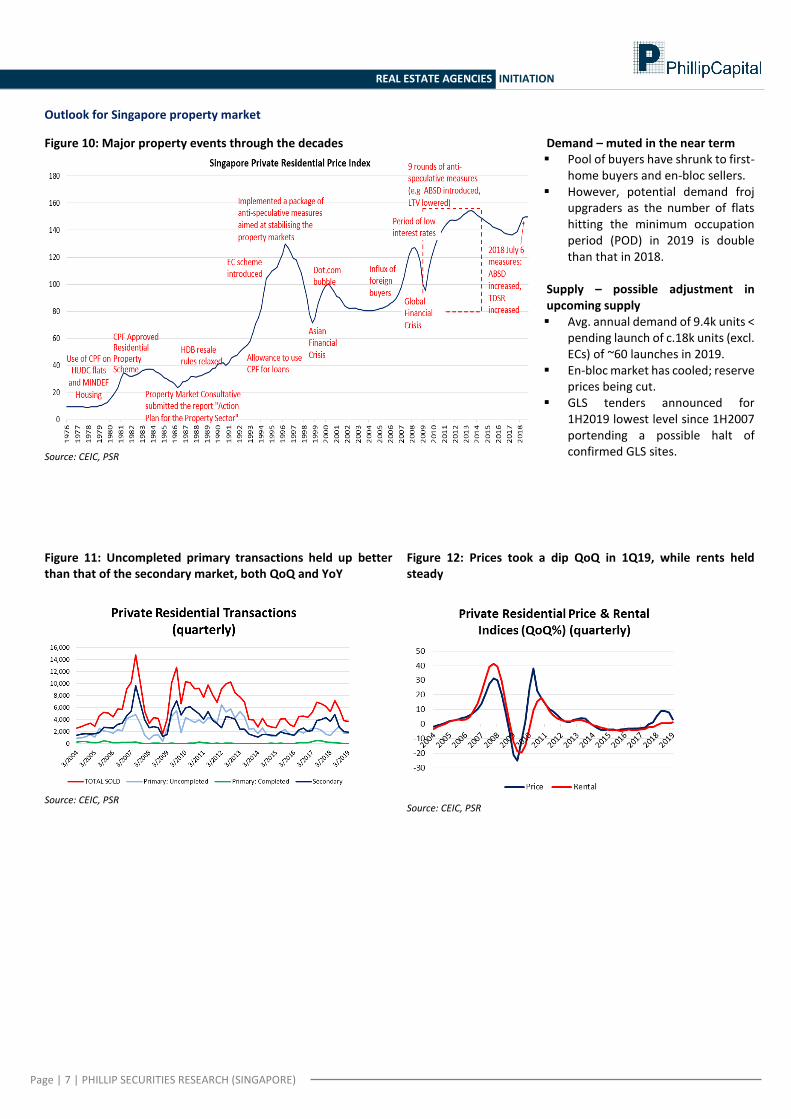
Figure 10: Major property events through the decades
Source: CEIC, PSR
Demand – muted in the near term Pool of buyers have shrunk to first-
home buyers and en-bloc sellers. However, potential demand froj
upgraders as the number of flats hitting the minimum occupation period (POD) in 2019 is double than that in 2018.
Supply – possible adjustment in upcoming supply Avg. annual demand of 9.4k units <
pending launch of c.18k units (excl. ECs) of ~60 launches in 2019.
En-bloc market has cooled; reserve prices being cut.
GLS tenders announced for 1H2019 lowest level since 1H2007 portending a possible halt of confirmed GLS sites.
Figure 11: Uncompleted primary transactions held up better than that of the secondary market, both QoQ and YoY
Source: CEIC, PSR
Figure 12: Prices took a dip QoQ in 1Q19, while rents held steady
Source: CEIC, PSR
Page | 8 | PHILLIP SECURITIES RESEARCH (SINGAPORE)
REAL ESTATE AGENCIES INITIATION
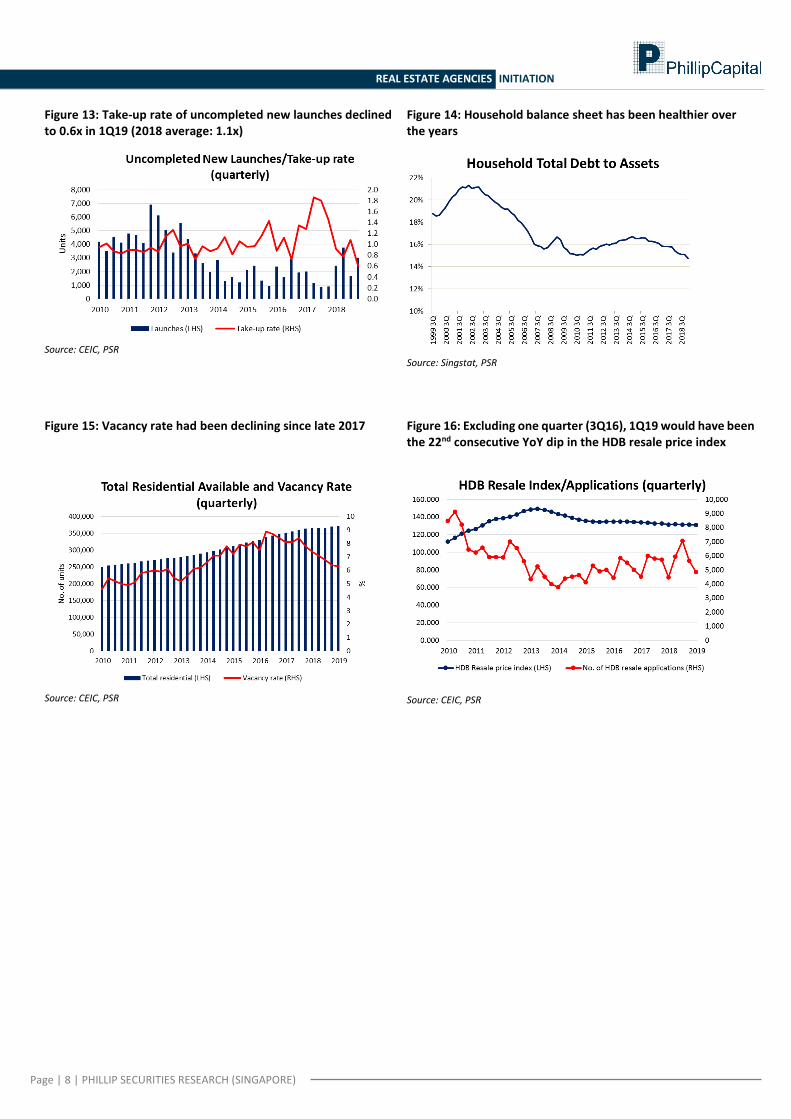
Figure 13: Take-up rate of uncompleted new launches declined to 0.6x in 1Q19 (2018 average: 1.1x)
Source: CEIC, PSR
Figure 14: Household balance sheet has been healthier over the years
Source: Singstat, PSR
Figure 15: Vacancy rate had been declining since late 2017
Source: CEIC, PSR
Figure 16: Excluding one quarter (3Q16), 1Q19 would have been the 22nd consecutive YoY dip in the HDB resale price index
Source: CEIC, PSR
Page | 9 | PHILLIP SECURITIES RESEARCH (SINGAPORE)
REAL ESTATE AGENCIES INITIATION
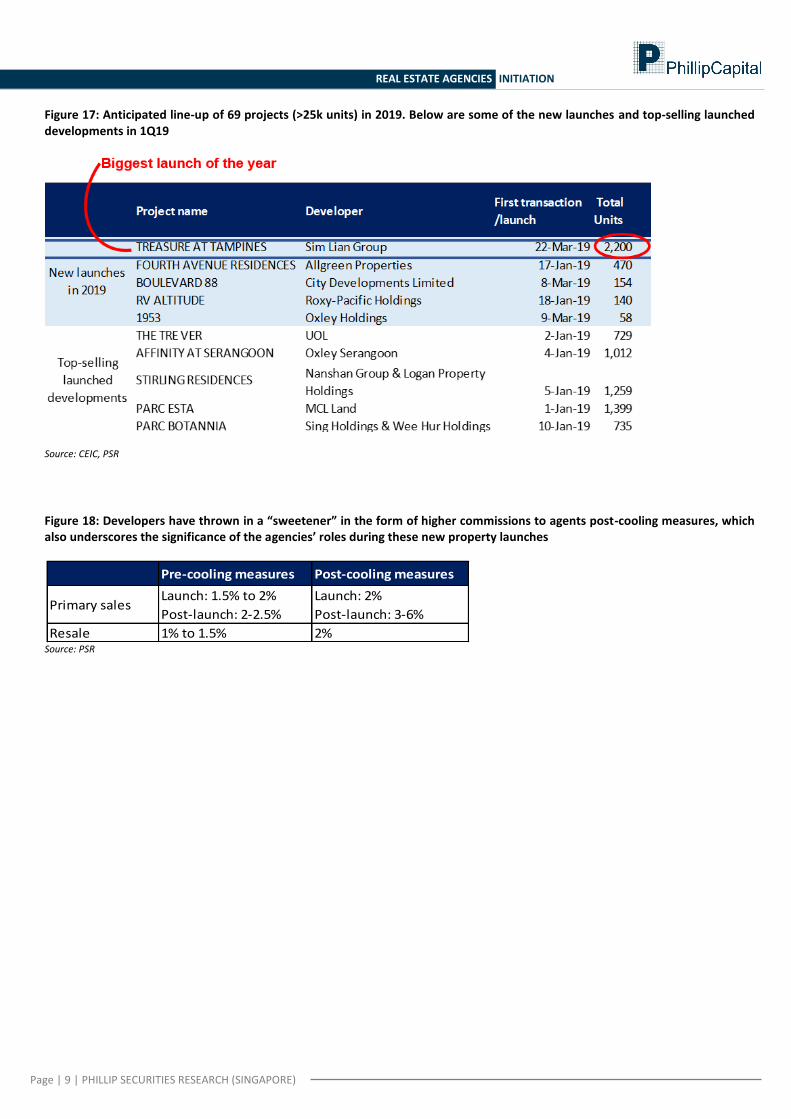
Figure 17: Anticipated line-up of 69 projects (>25k units) in 2019. Below are some of the new launches and top-selling launched developments in 1Q19
Source: CEIC, PSR
Figure 18: Developers have thrown in a “sweetener” in the form of higher commissions to agents post-cooling measures, which also underscores the significance of the agencies’ roles during these new property launches
Source: PSR
Pre-cooling measures Post-cooling measures
Primary salesLaunch: 1.5% to 2%
Post-launch: 2-2.5%
Launch: 2%
Post-launch: 3-6%
Resale 1% to 1.5% 2%
Page | 10 | PHILLIP SECURITIES RESEARCH (SINGAPORE)
REAL ESTATE AGENCIES INITIATION
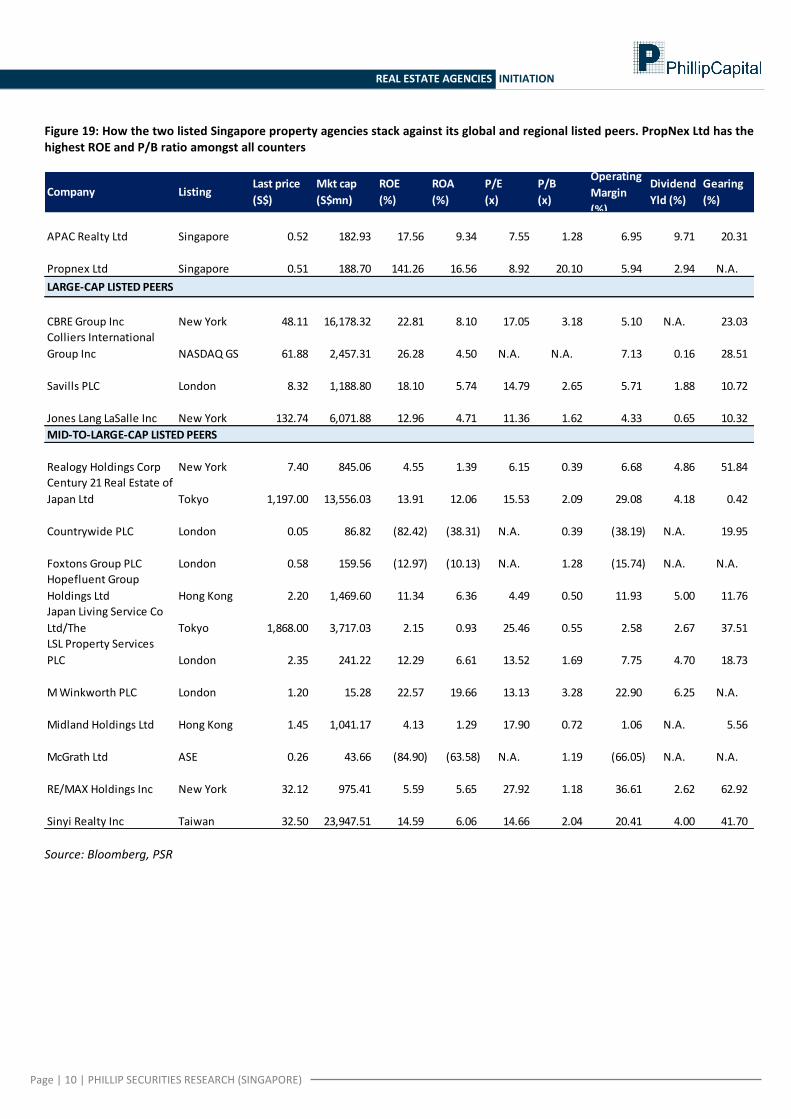
Figure 19: How the two listed Singapore property agencies stack against its global and regional listed peers. PropNex Ltd has the highest ROE and P/B ratio amongst all counters
Source: Bloomberg, PSR
Company ListingLast price
(S$)
Mkt cap
(S$mn)
ROE
(%)
ROA
(%)
P/E
(x)
P/B
(x)
Operating
Margin
(%)
Dividend
Yld (%)
Gearing
(%)
APAC Realty Ltd Singapore 0.52 182.93 17.56 9.34 7.55 1.28 6.95 9.71 20.31
Propnex Ltd Singapore 0.51 188.70 141.26 16.56 8.92 20.10 5.94 2.94 N.A.
CBRE Group Inc New York 48.11 16,178.32 22.81 8.10 17.05 3.18 5.10 N.A. 23.03
Colliers International
Group Inc NASDAQ GS 61.88 2,457.31 26.28 4.50 N.A. N.A. 7.13 0.16 28.51
Savills PLC London 8.32 1,188.80 18.10 5.74 14.79 2.65 5.71 1.88 10.72
Jones Lang LaSalle Inc New York 132.74 6,071.88 12.96 4.71 11.36 1.62 4.33 0.65 10.32
Realogy Holdings Corp New York 7.40 845.06 4.55 1.39 6.15 0.39 6.68 4.86 51.84
Century 21 Real Estate of
Japan Ltd Tokyo 1,197.00 13,556.03 13.91 12.06 15.53 2.09 29.08 4.18 0.42
Countrywide PLC London 0.05 86.82 (82.42) (38.31) N.A. 0.39 (38.19) N.A. 19.95
Foxtons Group PLC London 0.58 159.56 (12.97) (10.13) N.A. 1.28 (15.74) N.A. N.A.
Hopefluent Group
Holdings Ltd Hong Kong 2.20 1,469.60 11.34 6.36 4.49 0.50 11.93 5.00 11.76
Japan Living Service Co
Ltd/The Tokyo 1,868.00 3,717.03 2.15 0.93 25.46 0.55 2.58 2.67 37.51
LSL Property Services
PLC London 2.35 241.22 12.29 6.61 13.52 1.69 7.75 4.70 18.73
M Winkworth PLC London 1.20 15.28 22.57 19.66 13.13 3.28 22.90 6.25 N.A.
Midland Holdings Ltd Hong Kong 1.45 1,041.17 4.13 1.29 17.90 0.72 1.06 N.A. 5.56
McGrath Ltd ASE 0.26 43.66 (84.90) (63.58) N.A. 1.19 (66.05) N.A. N.A.
RE/MAX Holdings Inc New York 32.12 975.41 5.59 5.65 27.92 1.18 36.61 2.62 62.92
Sinyi Realty Inc Taiwan 32.50 23,947.51 14.59 6.06 14.66 2.04 20.41 4.00 41.70
LARGE-CAP LISTED PEERS
MID-TO-LARGE-CAP LISTED PEERS
Page | 11 | PHILLIP SECURITIES RESEARCH (SINGAPORE)
REAL ESTATE AGENCIES INITIATION
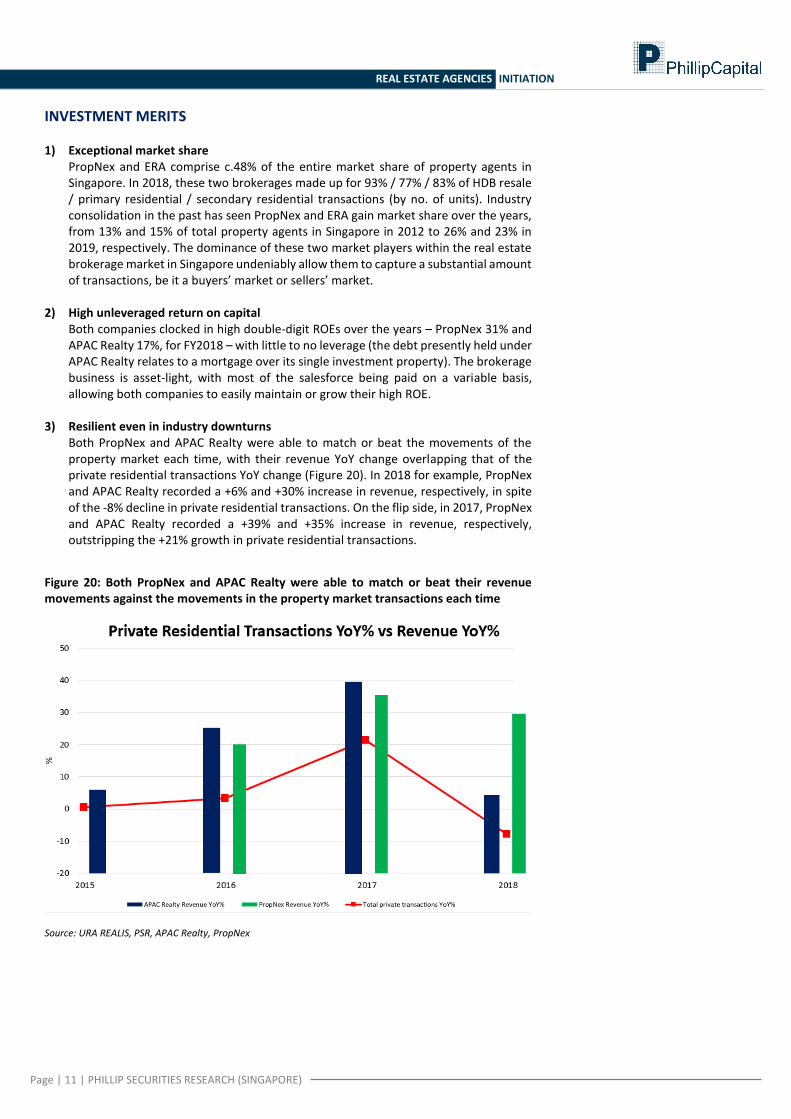
INVESTMENT MERITS
1) Exceptional market share PropNex and ERA comprise c.48% of the entire market share of property agents in Singapore. In 2018, these two brokerages made up for 93% / 77% / 83% of HDB resale / primary residential / secondary residential transactions (by no. of units). Industry consolidation in the past has seen PropNex and ERA gain market share over the years, from 13% and 15% of total property agents in Singapore in 2012 to 26% and 23% in 2019, respectively. The dominance of these two market players within the real estate brokerage market in Singapore undeniably allow them to capture a substantial amount of transactions, be it a buyers’ market or sellers’ market.
2) High unleveraged return on capital Both companies clocked in high double-digit ROEs over the years – PropNex 31% and APAC Realty 17%, for FY2018 – with little to no leverage (the debt presently held under APAC Realty relates to a mortgage over its single investment property). The brokerage business is asset-light, with most of the salesforce being paid on a variable basis, allowing both companies to easily maintain or grow their high ROE.
3) Resilient even in industry downturns
Both PropNex and APAC Realty were able to match or beat the movements of the property market each time, with their revenue YoY change overlapping that of the private residential transactions YoY change (Figure 20). In 2018 for example, PropNex and APAC Realty recorded a +6% and +30% increase in revenue, respectively, in spite of the -8% decline in private residential transactions. On the flip side, in 2017, PropNex and APAC Realty recorded a +39% and +35% increase in revenue, respectively, outstripping the +21% growth in private residential transactions.
Figure 20: Both PropNex and APAC Realty were able to match or beat their revenue movements against the movements in the property market transactions each time
Source: URA REALIS, PSR, APAC Realty, PropNex
Page | 12 | PHILLIP SECURITIES RESEARCH (SINGAPORE)
REAL ESTATE AGENCIES INITIATION
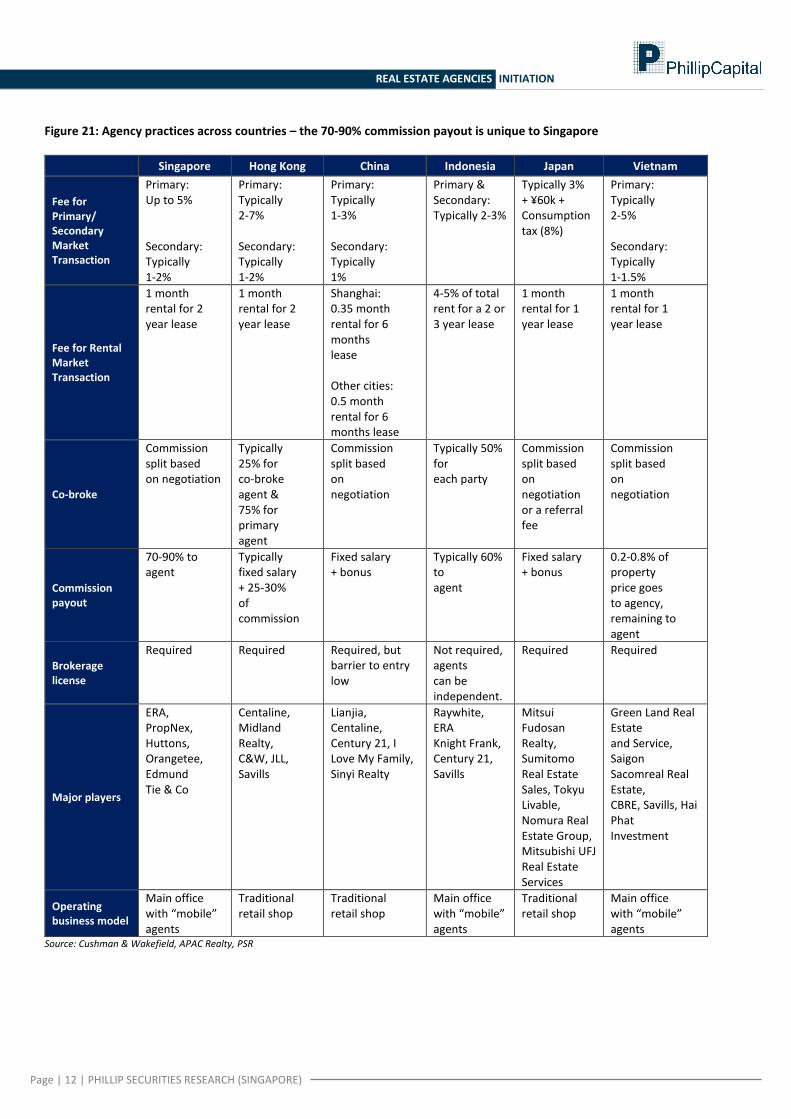
Figure 21: Agency practices across countries – the 70-90% commission payout is unique to Singapore
Singapore Hong Kong China Indonesia Japan Vietnam
Fee for Primary/ Secondary Market Transaction
Primary: Up to 5% Secondary: Typically 1-2%
Primary: Typically 2-7% Secondary: Typically 1-2%
Primary: Typically 1-3% Secondary: Typically 1%
Primary & Secondary: Typically 2-3%
Typically 3% + ¥60k + Consumption tax (8%)
Primary: Typically 2-5% Secondary: Typically 1-1.5%
Fee for Rental Market Transaction
1 month rental for 2 year lease
1 month rental for 2 year lease
Shanghai: 0.35 month rental for 6 months lease Other cities: 0.5 month rental for 6 months lease
4-5% of total rent for a 2 or 3 year lease
1 month rental for 1 year lease
1 month rental for 1 year lease
Co-broke
Commission split based on negotiation
Typically 25% for co-broke agent & 75% for primary agent
Commission split based on negotiation
Typically 50% for each party
Commission split based on negotiation or a referral fee
Commission split based on negotiation
Commission payout
70-90% to agent
Typically fixed salary + 25-30% of commission
Fixed salary + bonus
Typically 60% to agent
Fixed salary + bonus
0.2-0.8% of property price goes to agency, remaining to agent
Brokerage license
Required Required Required, but barrier to entry low
Not required, agents can be independent.
Required Required
Major players
ERA, PropNex, Huttons, Orangetee, Edmund Tie & Co
Centaline, Midland Realty, C&W, JLL, Savills
Lianjia, Centaline, Century 21, I Love My Family, Sinyi Realty
Raywhite, ERA Knight Frank, Century 21, Savills
Mitsui Fudosan Realty, Sumitomo Real Estate Sales, Tokyu Livable, Nomura Real Estate Group, Mitsubishi UFJ Real Estate Services
Green Land Real Estate and Service, Saigon Sacomreal Real Estate, CBRE, Savills, Hai Phat Investment
Operating business model
Main office with “mobile” agents
Traditional retail shop
Traditional retail shop
Main office with “mobile” agents
Traditional retail shop
Main office with “mobile” agents
Source: Cushman & Wakefield, APAC Realty, PSR
Page | 13 | PHILLIP SECURITIES RESEARCH (SINGAPORE)
REAL ESTATE AGENCIES INITIATION
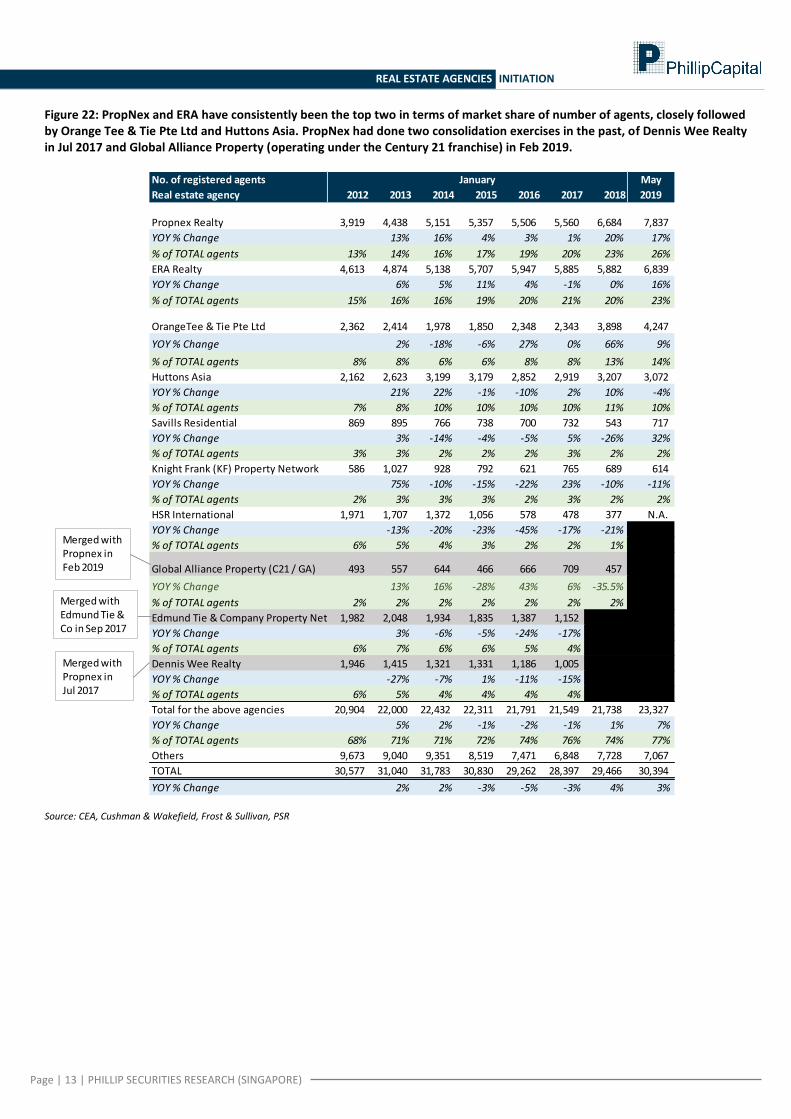
Figure 22: PropNex and ERA have consistently been the top two in terms of market share of number of agents, closely followed by Orange Tee & Tie Pte Ltd and Huttons Asia. PropNex had done two consolidation exercises in the past, of Dennis Wee Realty in Jul 2017 and Global Alliance Property (operating under the Century 21 franchise) in Feb 2019.
Source: CEA, Cushman & Wakefield, Frost & Sullivan, PSR
No. of registered agents May
Real estate agency 2012 2013 2014 2015 2016 2017 2018 2019
Propnex Realty 3,919 4,438 5,151 5,357 5,506 5,560 6,684 7,837
YOY % Change 13% 16% 4% 3% 1% 20% 17%
% of TOTAL agents 13% 14% 16% 17% 19% 20% 23% 26%
ERA Realty 4,613 4,874 5,138 5,707 5,947 5,885 5,882 6,839
YOY % Change 6% 5% 11% 4% -1% 0% 16%
% of TOTAL agents 15% 16% 16% 19% 20% 21% 20% 23%
OrangeTee & Tie Pte Ltd 2,362 2,414 1,978 1,850 2,348 2,343 3,898 4,247
YOY % Change 2% -18% -6% 27% 0% 66% 9%
% of TOTAL agents 8% 8% 6% 6% 8% 8% 13% 14%
Huttons Asia 2,162 2,623 3,199 3,179 2,852 2,919 3,207 3,072
YOY % Change 21% 22% -1% -10% 2% 10% -4%
% of TOTAL agents 7% 8% 10% 10% 10% 10% 11% 10%
Savills Residential 869 895 766 738 700 732 543 717
YOY % Change 3% -14% -4% -5% 5% -26% 32%
% of TOTAL agents 3% 3% 2% 2% 2% 3% 2% 2%
Knight Frank (KF) Property Network 586 1,027 928 792 621 765 689 614
YOY % Change 75% -10% -15% -22% 23% -10% -11%
% of TOTAL agents 2% 3% 3% 3% 2% 3% 2% 2%
HSR International 1,971 1,707 1,372 1,056 578 478 377 N.A.
YOY % Change -13% -20% -23% -45% -17% -21%
% of TOTAL agents 6% 5% 4% 3% 2% 2% 1%
Global Alliance Property (C21 / GA) 493 557 644 466 666 709 457
YOY % Change 13% 16% -28% 43% 6% -35.5%
% of TOTAL agents 2% 2% 2% 2% 2% 2% 2%
Edmund Tie & Company Property Network1,982 2,048 1,934 1,835 1,387 1,152
YOY % Change 3% -6% -5% -24% -17%
% of TOTAL agents 6% 7% 6% 6% 5% 4%
Dennis Wee Realty 1,946 1,415 1,321 1,331 1,186 1,005
YOY % Change -27% -7% 1% -11% -15%
% of TOTAL agents 6% 5% 4% 4% 4% 4%
Total for the above agencies 20,904 22,000 22,432 22,311 21,791 21,549 21,738 23,327
YOY % Change 5% 2% -1% -2% -1% 1% 7%
% of TOTAL agents 68% 71% 71% 72% 74% 76% 74% 77%
Others 9,673 9,040 9,351 8,519 7,471 6,848 7,728 7,067
TOTAL 30,577 31,040 31,783 30,830 29,262 28,397 29,466 30,394
YOY % Change 2% 2% -3% -5% -3% 4% 3%
Source: CEA, Cushman & Wakefield, Frost & Sullivan, PSR
January
Merged with Propnex in Jul 2017
Merged with Edmund Tie & Co in Sep 2017
Merged with Propnex in Feb 2019
Page | 14 | PHILLIP SECURITIES RESEARCH (SINGAPORE)
REAL ESTATE AGENCIES INITIATION
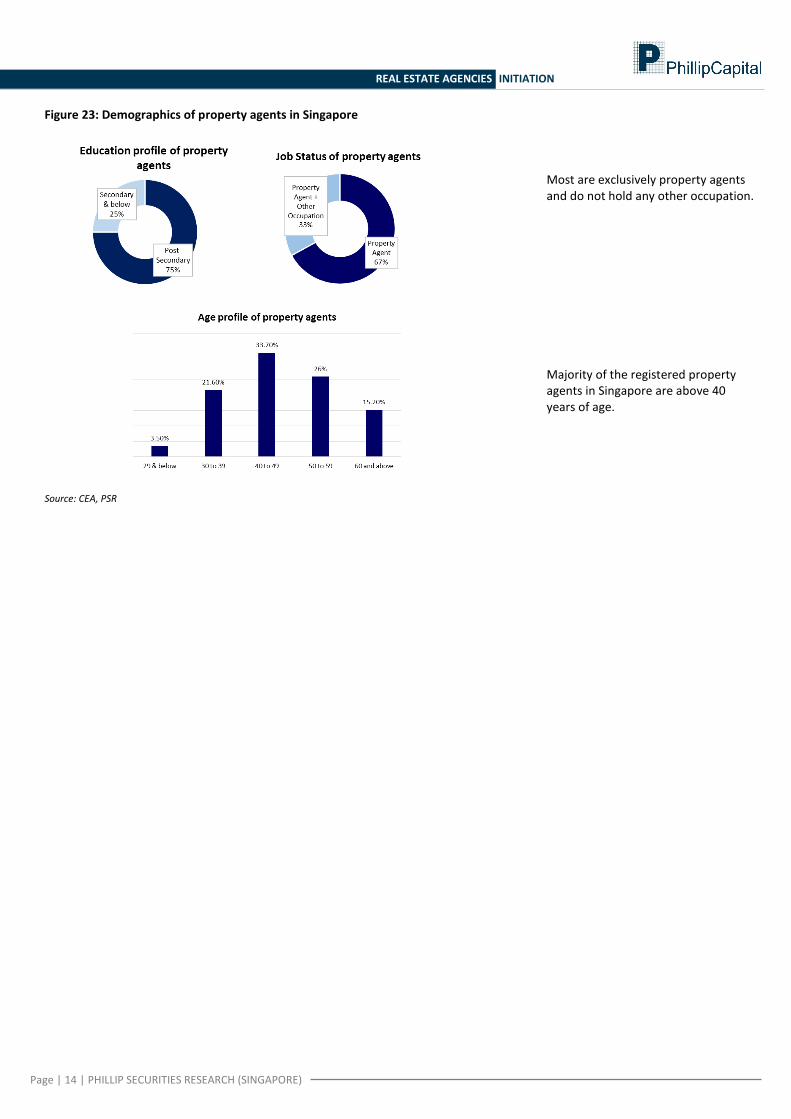
Figure 23: Demographics of property agents in Singapore
Source: CEA, PSR
Most are exclusively property agents and do not hold any other occupation. Majority of the registered property agents in Singapore are above 40 years of age.
Page | 15 | PHILLIP SECURITIES RESEARCH (SINGAPORE)
REAL ESTATE AGENCIES INITIATION
APAC Realty Limited Ushering in an ERA of growth
SINGAPORE | REAL ESTATE (AGENCIES)| INITIATION Established market player with demonstrated ability to organically grow its agent base. Building an international presence through the ERA regional master franchise rights for
17 countries. Announced in Feb 2019 strategic partnerships with ERA Indonesia and ERA Thailand.
Non-brokerage income stream with GP margins of 88% (brokerage 10%) to provide some buffer to the transaction based business.
Initiate coverage on APAC Realty with a BUY and TP of S$0.65.
Company Background ERA Realty Network Pte Ltd (ERA Realty), a wholly-owned subsidiary of APAC Realty Limited (APAC Realty), was established in 1982 and is among the top two real estate brokerages in Singapore. APAC Realty’s wholly-owned subsidiary Realty International Associates Pte Ltd (RIA) operates training programmes and courses for real estate agents and also undertakes valuation work on behalf of clients. APAC Realty holds the ERA regional master franchise rights for 17 countries in Asia Pacific as well as the master franchise rights for Coldwell Banker – one of the most established US real estate franchising companies – in Singapore. Prior to its listing on the SGX Mainboard in Sep 2017, the Group was part of Hersing Corporation Ltd (Hersing) – which was listed on the SGX-ST in 1998 and privatised in 2012. The Group subsequently acquired Hersing’s subsdiaries and incorporated APAC Realty in 2013. Investment Merits 1) Established market player
ERA Realty is a household name in the real estate brokerage scene in Singapore since 1982. Notwithstanding the consolidation activities in the agency market, the Group had consistently held the leading position in market share of transacted units across all segments. ERA Realty has had not had any agency consolidation exercises to-date, underscoring its ability to organically grow its agent base.
2) Meaningful international presence APAC Realty holds the ERA regional master franchise rights for 17 countries, nine of which are existing ERA sub-franchisees. In Feb 2019, the Group announced a partnership with ERA Indonesia to fund the purchase of the Indonesia country master franchise operations from its current shareholders. In addition, the Group entered into a strategic cooperation agreement to directly own the ERA master franchise rights for Thailand. These sets in motion future overseas expansion plans, to eventually diversify its earnings base out of Singapore.
3) Non-brokerage income stream to lend a buffer APAC Realty’s non-brokerage stream, which comprises its training, property valuation and management arms, comprised 15.8% of its FY2018 gross profit. The gross margins for the brokerage and non-brokerage segments are at 10.7% and 88%, respectively. The Group’s acquisition of ERA APAC Centre, via acquisition of shares in HC Home, in June 2018 adds on to the Group’s stream of non-brokerage income. While revenue from the brokerage segment will continue to be the mainstay, recurring income from its non-brokerage stream helps lend a buffer especially in property downcycles.
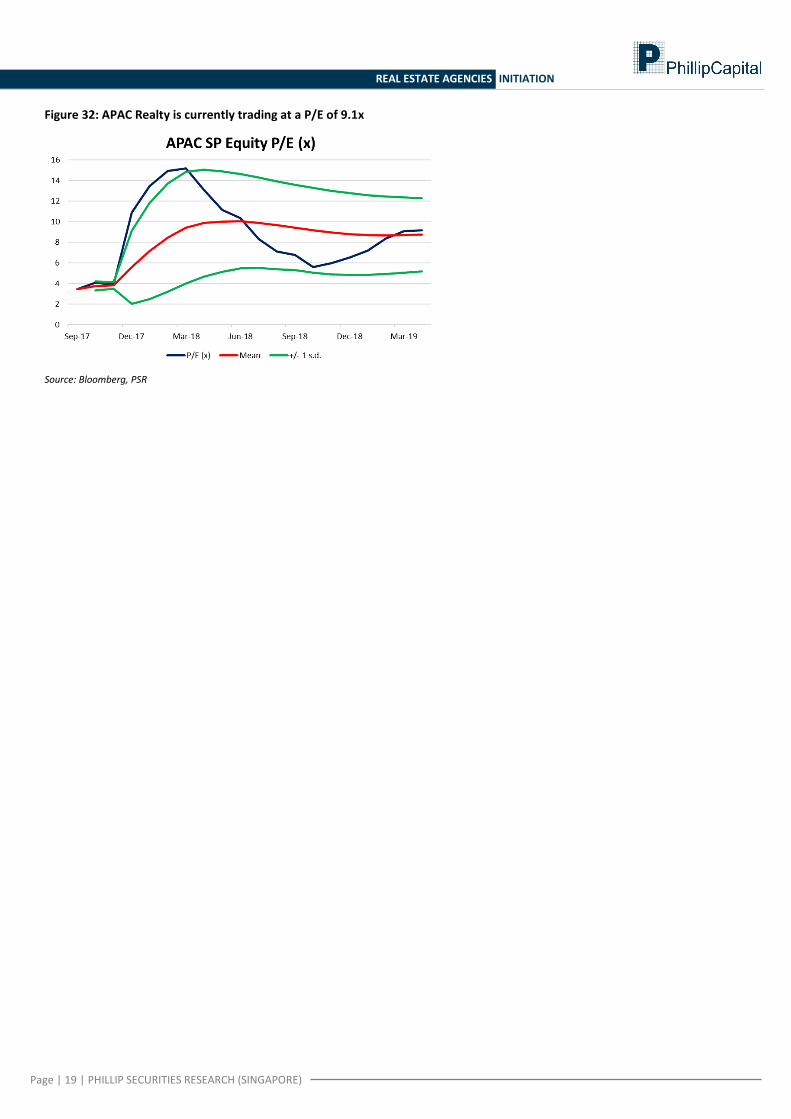
Initiate coverage on APAC Realty with a BUY and a TP of S$0.65 Our DCF-derived target price of S$0.65 is based on a cost of equity of 7.2% and a terminal growth rate of 0%. APAC Realty is currently trading at a PE ratio of 9.15x, which is on par with its historical mean and at a c.35% discount from that of its regional peers.
3 June 2019
APAC REALTY
BUY (Initiation)LAST DONE PRICE
FORECAST DIV
TARGET PRICE
TOTAL RETURN
COMPANY DATA
BLOOM BERG CODE: APAC SP Equity
O/S SHARES (M N) : 355
M ARKET CAP (USD mn / SGD mn) : 132 / 181
52 - WK HI/LO (SGD) : 0.95 / 0.44
3M Average Daily T/O (mn) : 1.87
MAJOR SHAREHOLDERS (%)
71.8%
FIL INVESTM ENT M ANAGEM ENT 4.3%
QILIN ASSET M ANAGEM ENT 3.4%
PRICE PERFORMANCE (%)
1M T H 3 M T H 1Y R
COM PANY (17.2) (7.7) (39.7)
STI RETURN (4.3) (1.2) (6.5)
PRICE VS. STI
Source: B loomberg, PSR
KEY FINANCIALS
Y / E D ec, SGD ( mn) F Y 17 F Y 18 F Y 19 e F Y 2 0 e
Revenue 401 424 437 460
Gross Profit 55 53 57 60
Operating Profit 29 29 33 36
PAT 26 24 28 30
P/E (x) 6.4 7.5 6.5 6.0
P/B (x) 1.2 1.1 1.5 1.6
EPS, SGD cents 8.0 6.8 7.9 8.6
Dividend yield, % 3.9 8.7 8.4 9.2
ROE, % 19% 17% 23% 27%
ROA, % 11% 9% 10% 11%
Source: Company Data, PSR
Valuation Method
DCF (Cost of equity 7.2%, Terminal growth 0%)
Tara Wong (+65 6212 1850)
Research Analyst
SGD 0.52
SGD 0.04
SGD 0.65
34.0%
TAN CHOON HONG
0.30
0.40
0.50
0.60
0.70
0.80
0.90
1.00
May-18 Sep-18 Jan-19 May-19APAC SP Equity FSSTI index
Page | 16 | PHILLIP SECURITIES RESEARCH (SINGAPORE)
REAL ESTATE AGENCIES INITIATION
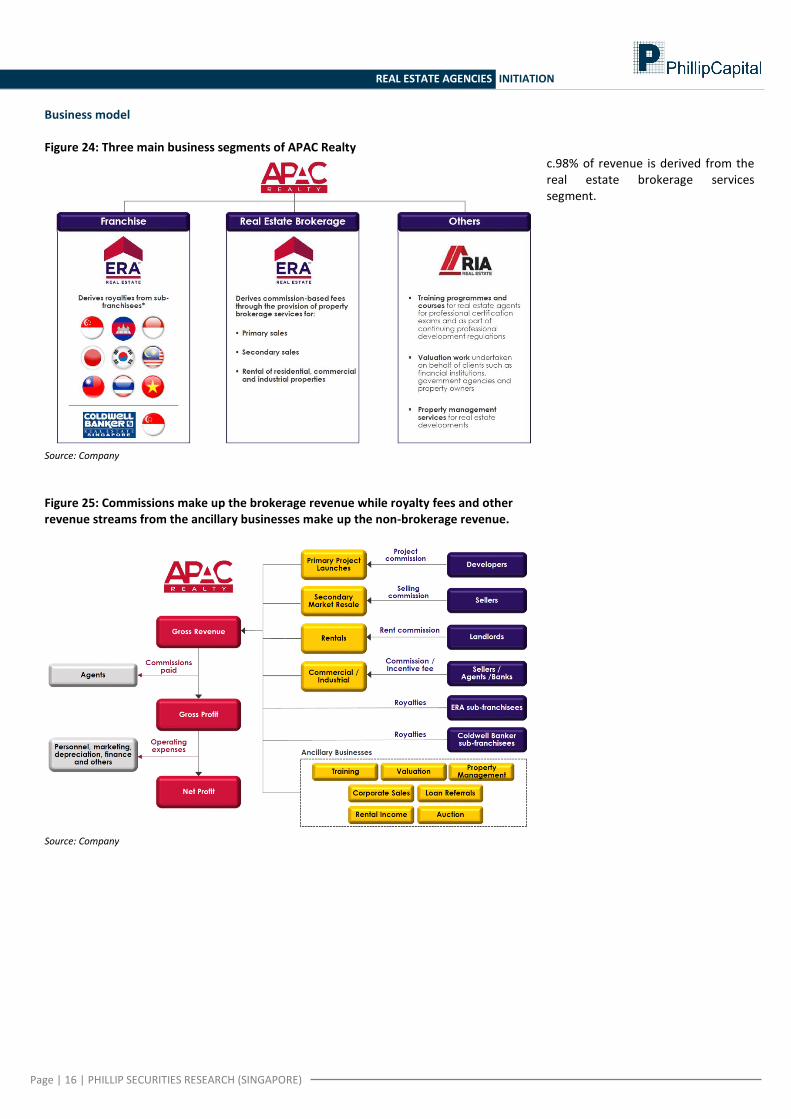
Business model Figure 24: Three main business segments of APAC Realty
Source: Company
Figure 25: Commissions make up the brokerage revenue while royalty fees and other revenue streams from the ancillary businesses make up the non-brokerage revenue.
Source: Company
c.98% of revenue is derived from the real estate brokerage services segment.
Page | 17 | PHILLIP SECURITIES RESEARCH (SINGAPORE)
REAL ESTATE AGENCIES INITIATION
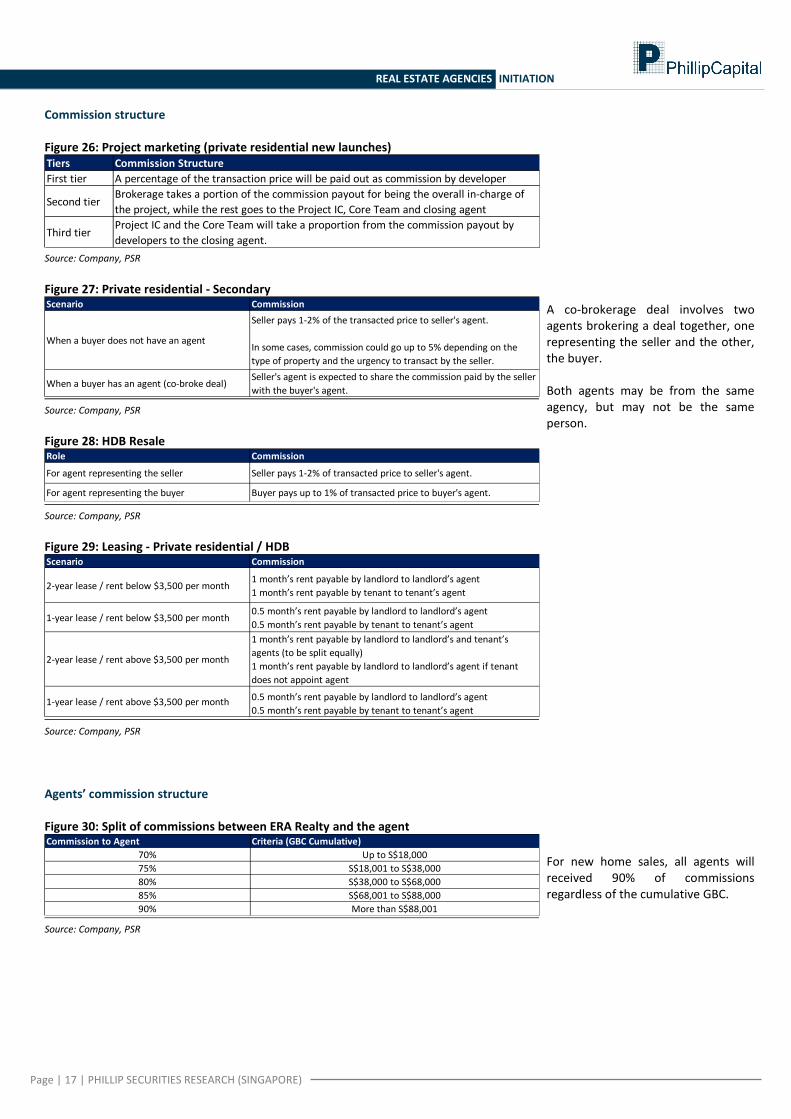
Commission structure Figure 26: Project marketing (private residential new launches)
Source: Company, PSR
Figure 27: Private residential - Secondary
Source: Company, PSR
Figure 28: HDB Resale
Source: Company, PSR
Figure 29: Leasing - Private residential / HDB
Source: Company, PSR
Agents’ commission structure Figure 30: Split of commissions between ERA Realty and the agent
Source: Company, PSR
A co-brokerage deal involves two agents brokering a deal together, one representing the seller and the other, the buyer. Both agents may be from the same agency, but may not be the same person. For new home sales, all agents will received 90% of commissions regardless of the cumulative GBC.
Tiers Commission Structure
First tier A percentage of the transaction price will be paid out as commission by developer
Second tierBrokerage takes a portion of the commission payout for being the overall in-charge of
the project, while the rest goes to the Project IC, Core Team and closing agent
Third tierProject IC and the Core Team will take a proportion from the commission payout by
developers to the closing agent.
Scenario Commission
When a buyer does not have an agent
Seller pays 1-2% of the transacted price to seller's agent.
In some cases, commission could go up to 5% depending on the
type of property and the urgency to transact by the seller.
When a buyer has an agent (co-broke deal)Seller's agent is expected to share the commission paid by the seller
with the buyer's agent.
Role Commission
For agent representing the seller Seller pays 1-2% of transacted price to seller's agent.
For agent representing the buyer Buyer pays up to 1% of transacted price to buyer's agent.
Scenario Commission
2-year lease / rent below $3,500 per month1 month’s rent payable by landlord to landlord’s agent
1 month’s rent payable by tenant to tenant’s agent
1-year lease / rent below $3,500 per month0.5 month’s rent payable by landlord to landlord’s agent
0.5 month’s rent payable by tenant to tenant’s agent
2-year lease / rent above $3,500 per month
1 month’s rent payable by landlord to landlord’s and tenant’s
agents (to be split equally)
1 month’s rent payable by landlord to landlord’s agent if tenant
does not appoint agent
1-year lease / rent above $3,500 per month 0.5 month’s rent payable by landlord to landlord’s agent
0.5 month’s rent payable by tenant to tenant’s agent
Commission to Agent Criteria (GBC Cumulative)
70% Up to S$18,000
75% S$18,001 to S$38,000
80% S$38,000 to S$68,000
85% S$68,001 to S$88,000
90% More than S$88,001
Page | 18 | PHILLIP SECURITIES RESEARCH (SINGAPORE)
REAL ESTATE AGENCIES INITIATION
Investment Merits 1) Established market player
ERA Realty is a household name in the real estate brokerage scene in Singapore since 1982. Notwithstanding the consolidation activities in the agency market, the Group had consistently held the leading position in market share of transacted units across all segments. ERA Realty has had not had any agency consolidation exercises to-date, underscoring its strength to organically grow its agent base.
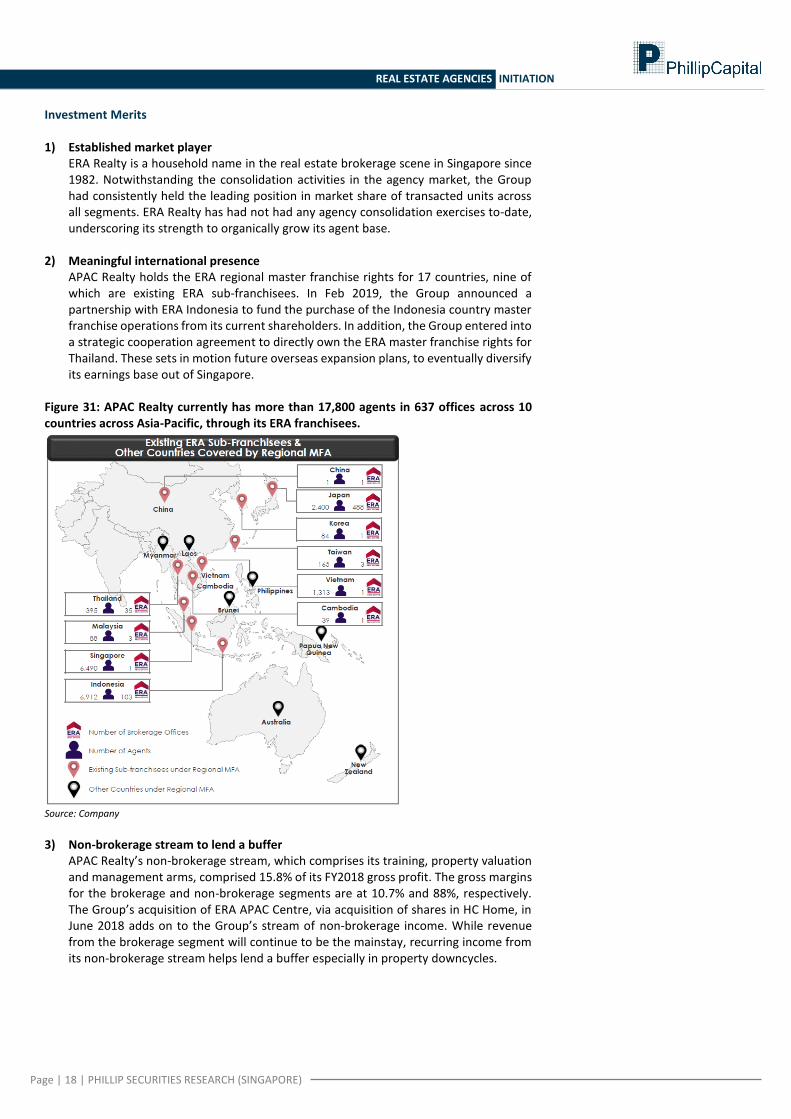
2) Meaningful international presence APAC Realty holds the ERA regional master franchise rights for 17 countries, nine of which are existing ERA sub-franchisees. In Feb 2019, the Group announced a partnership with ERA Indonesia to fund the purchase of the Indonesia country master franchise operations from its current shareholders. In addition, the Group entered into a strategic cooperation agreement to directly own the ERA master franchise rights for Thailand. These sets in motion future overseas expansion plans, to eventually diversify its earnings base out of Singapore.
Figure 31: APAC Realty currently has more than 17,800 agents in 637 offices across 10 countries across Asia-Pacific, through its ERA franchisees.
Source: Company
3) Non-brokerage stream to lend a buffer
APAC Realty’s non-brokerage stream, which comprises its training, property valuation and management arms, comprised 15.8% of its FY2018 gross profit. The gross margins for the brokerage and non-brokerage segments are at 10.7% and 88%, respectively. The Group’s acquisition of ERA APAC Centre, via acquisition of shares in HC Home, in June 2018 adds on to the Group’s stream of non-brokerage income. While revenue from the brokerage segment will continue to be the mainstay, recurring income from its non-brokerage stream helps lend a buffer especially in property downcycles.
Page | 19 | PHILLIP SECURITIES RESEARCH (SINGAPORE)
REAL ESTATE AGENCIES INITIATION
Figure 32: APAC Realty is currently trading at a P/E of 9.1x
Source: Bloomberg, PSR
Page | 20 | PHILLIP SECURITIES RESEARCH (SINGAPORE)
REAL ESTATE AGENCIES INITIATION
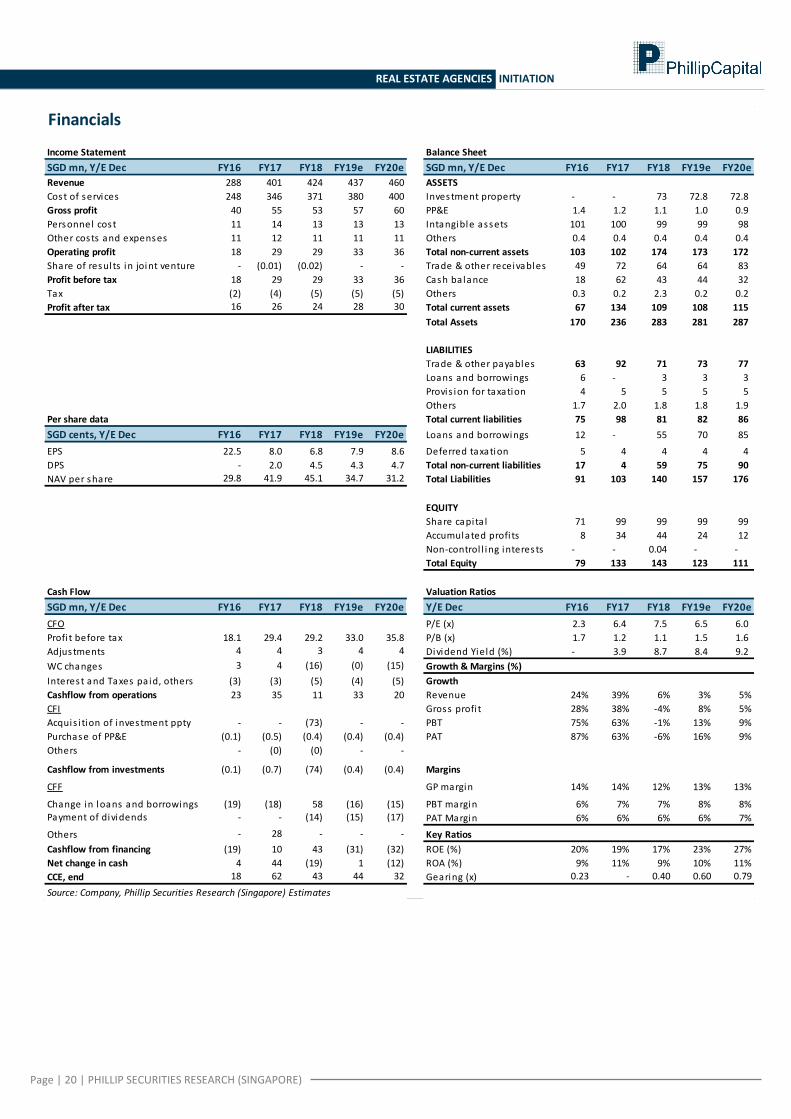
Financials
Income Statement Balance Sheet
SGD mn, Y/E Dec FY16 FY17 FY18 FY19e FY20e SGD mn, Y/E Dec FY16 FY17 FY18 FY19e FY20e
Revenue 288 401 424 437 460 ASSETS
Cost of services 248 346 371 380 400 Investment property - - 73 72.8 72.8
Gross profit 40 55 53 57 60 PP&E 1.4 1.2 1.1 1.0 0.9
Personnel cost 11 14 13 13 13 Intangible assets 101 100 99 99 98
Other costs and expenses 11 12 11 11 11 Others 0.4 0.4 0.4 0.4 0.4
Operating profit 18 29 29 33 36 Total non-current assets 103 102 174 173 172
Share of results in joint venture - (0.01) (0.02) - - Trade & other receivables 49 72 64 64 83
Profit before tax 18 29 29 33 36 Cash balance 18 62 43 44 32
Tax (2) (4) (5) (5) (5) Others 0.3 0.2 2.3 0.2 0.2
Profit after tax 16 26 24 28 30 Total current assets 67 134 109 108 115
Total Assets 170 236 283 281 287
LIABILITIES
Trade & other payables 63 92 71 73 77
Loans and borrowings 6 - 3 3 3
Provis ion for taxation 4 5 5 5 5
Others 1.7 2.0 1.8 1.8 1.9
Per share data Total current liabilities 75 98 81 82 86
SGD cents, Y/E Dec FY16 FY17 FY18 FY19e FY20e Loans and borrowings 12 - 55 70 85
EPS 22.5 8.0 6.8 7.9 8.6 Deferred taxation 5 4 4 4 4
DPS - 2.0 4.5 4.3 4.7 Total non-current liabilities 17 4 59 75 90
NAV per share 29.8 41.9 45.1 34.7 31.2 Total Liabilities 91 103 140 157 176
EQUITY
Share capita l 71 99 99 99 99
Accumulated profi ts 8 34 44 24 12
Non-control l ing interests - - 0.04 - -
Total Equity 79 133 143 123 111
Cash Flow Valuation Ratios
SGD mn, Y/E Dec FY16 FY17 FY18 FY19e FY20e Y/E Dec FY16 FY17 FY18 FY19e FY20e
CFO P/E (x) 2.3 6.4 7.5 6.5 6.0
Profi t before tax 18.1 29.4 29.2 33.0 35.8 P/B (x) 1.7 1.2 1.1 1.5 1.6
Adjustments 4 4 3 4 4 Dividend Yield (%) - 3.9 8.7 8.4 9.2
WC changes 3 4 (16) (0) (15) Growth & Margins (%)
Interest and Taxes pa id, others (3) (3) (5) (4) (5) Growth
Cashflow from operations 23 35 11 33 20 Revenue 24% 39% 6% 3% 5%
CFI Gross profi t 28% 38% -4% 8% 5%
Acquis i tion of investment ppty - - (73) - - PBT 75% 63% -1% 13% 9%
Purchase of PP&E (0.1) (0.5) (0.4) (0.4) (0.4) PAT 87% 63% -6% 16% 9%
Others - (0) (0) - -
Cashflow from investments (0.1) (0.7) (74) (0.4) (0.4) Margins
CFF GP margin 14% 14% 12% 13% 13%
Change in loans and borrowings (19) (18) 58 (16) (15) PBT margin 6% 7% 7% 8% 8%Payment of dividends - - (14) (15) (17) PAT Margin 6% 6% 6% 6% 7%
Others - 28 - - - Key Ratios
Cashflow from financing (19) 10 43 (31) (32) ROE (%) 20% 19% 17% 23% 27%
Net change in cash 4 44 (19) 1 (12) ROA (%) 9% 11% 9% 10% 11%
CCE, end 18 62 43 44 32 Gearing (x) 0.23 - 0.40 0.60 0.79
Source: Company, Phillip Securities Research (Singapore) Estimates
Page | 21 | PHILLIP SECURITIES RESEARCH (SINGAPORE)
REAL ESTATE AGENCIES INITIATION
Total Returns Recommendation Rating
> +20% Buy 1
+5% to +20% Accumulate 2
-5% to +5% Neutra l 3
-5% to -20% Reduce 4
< -20% Sel l 5
Ratings History
PSR Rating System
Remarks
We do not base our recommendations entirely on the above quanti tative
return bands . We cons ider qual i tative factors l ike (but not l imited to) a s tock's
ri sk reward profi le, market sentiment, recent rate of share price appreciation,
presence or absence of s tock price catalysts , and speculative undertones
surrounding the s tock, before making our fina l recommendation
1 2 3 4 5
0.20
0.40
0.60
0.80
1.00
1.20
1.40
Oct-1
7
Jan
-18
Ap
r-18
Jul-1
8
Oct-1
8
Jan
-19
Ap
r-19
Jul-1
9
Oct-1
9
Jan
-20
Ap
r-20
Source: Bloomberg, PSR
Market Price
Target Price
Page | 22 | PHILLIP SECURITIES RESEARCH (SINGAPORE)
REAL ESTATE AGENCIES INITIATION
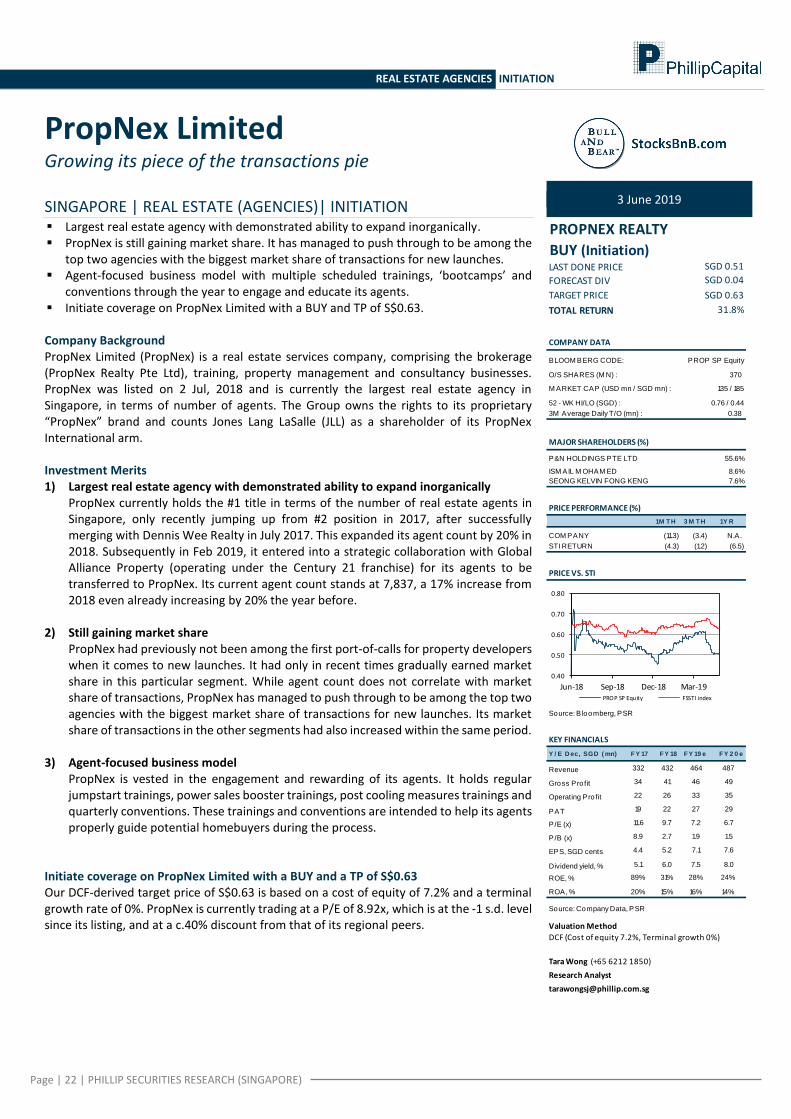
PropNex Limited Growing its piece of the transactions pie
SINGAPORE | REAL ESTATE (AGENCIES)| INITIATION Largest real estate agency with demonstrated ability to expand inorganically. PropNex is still gaining market share. It has managed to push through to be among the
top two agencies with the biggest market share of transactions for new launches. Agent-focused business model with multiple scheduled trainings, ‘bootcamps’ and
conventions through the year to engage and educate its agents. Initiate coverage on PropNex Limited with a BUY and TP of S$0.63. Company Background PropNex Limited (PropNex) is a real estate services company, comprising the brokerage (PropNex Realty Pte Ltd), training, property management and consultancy businesses. PropNex was listed on 2 Jul, 2018 and is currently the largest real estate agency in Singapore, in terms of number of agents. The Group owns the rights to its proprietary “PropNex” brand and counts Jones Lang LaSalle (JLL) as a shareholder of its PropNex International arm. Investment Merits 1) Largest real estate agency with demonstrated ability to expand inorganically
PropNex currently holds the #1 title in terms of the number of real estate agents in Singapore, only recently jumping up from #2 position in 2017, after successfully merging with Dennis Wee Realty in July 2017. This expanded its agent count by 20% in 2018. Subsequently in Feb 2019, it entered into a strategic collaboration with Global Alliance Property (operating under the Century 21 franchise) for its agents to be transferred to PropNex. Its current agent count stands at 7,837, a 17% increase from 2018 even already increasing by 20% the year before.
2) Still gaining market share
PropNex had previously not been among the first port-of-calls for property developers when it comes to new launches. It had only in recent times gradually earned market share in this particular segment. While agent count does not correlate with market share of transactions, PropNex has managed to push through to be among the top two agencies with the biggest market share of transactions for new launches. Its market share of transactions in the other segments had also increased within the same period.
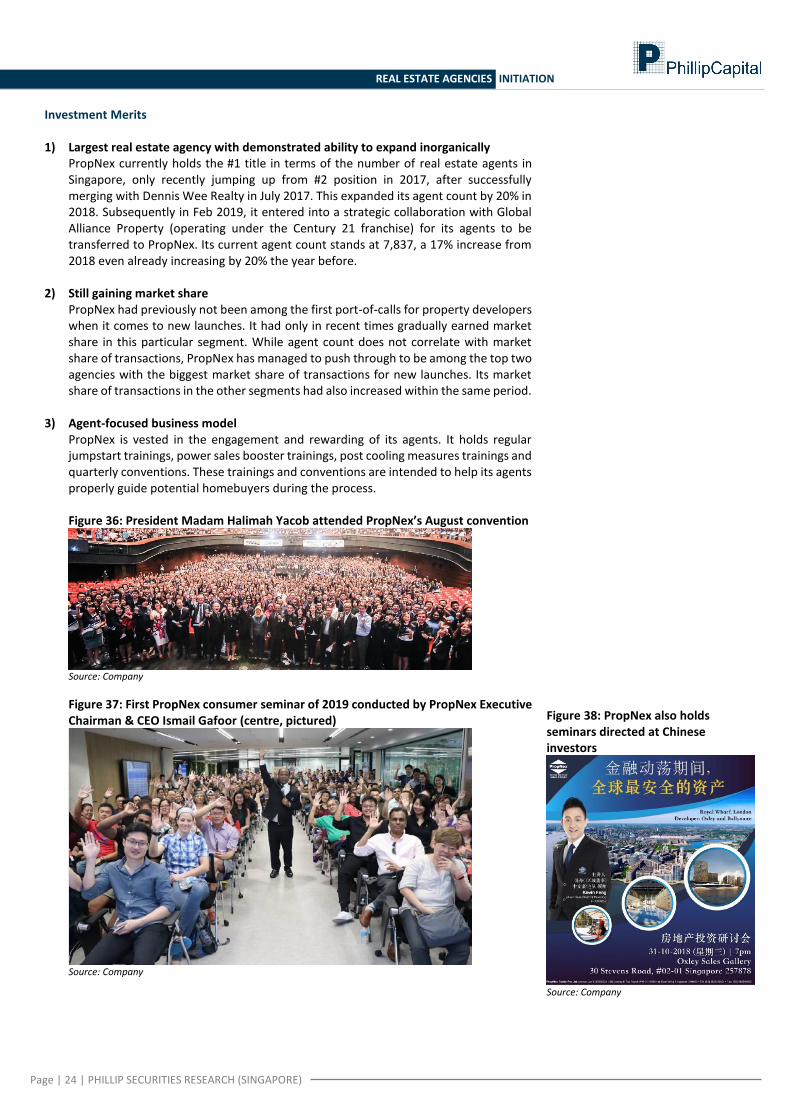
3) Agent-focused business model PropNex is vested in the engagement and rewarding of its agents. It holds regular jumpstart trainings, power sales booster trainings, post cooling measures trainings and quarterly conventions. These trainings and conventions are intended to help its agents properly guide potential homebuyers during the process.
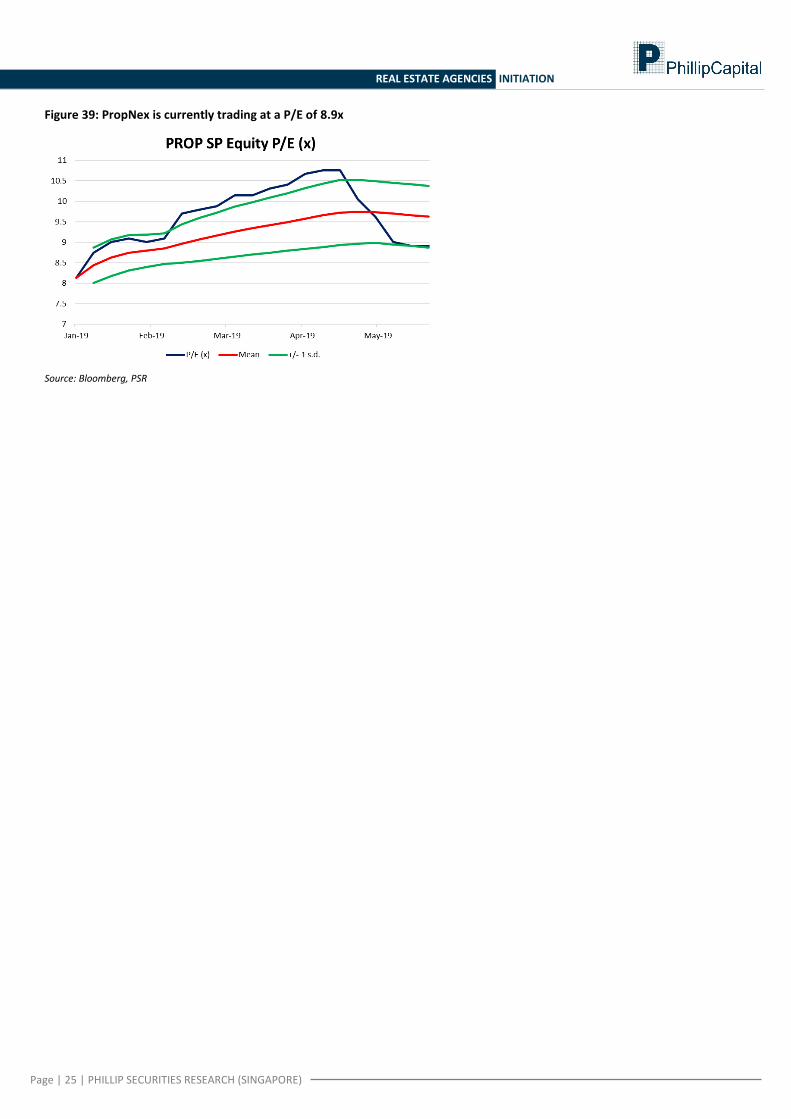
Initiate coverage on PropNex Limited with a BUY and a TP of S$0.63 Our DCF-derived target price of S$0.63 is based on a cost of equity of 7.2% and a terminal growth rate of 0%. PropNex is currently trading at a P/E of 8.92x, which is at the -1 s.d. level since its listing, and at a c.40% discount from that of its regional peers.
3 June 2019
PROPNEX REALTY
BUY (Initiation)LAST DONE PRICE
FORECAST DIV
TARGET PRICE
TOTAL RETURN
COMPANY DATA
BLOOM BERG CODE: PROP SP Equity
O/S SHARES (M N) : 370
M ARKET CAP (USD mn / SGD mn) : 135 / 185
52 - WK HI/LO (SGD) : 0.76 / 0.44
3M Average Daily T/O (mn) : 0.38
MAJOR SHAREHOLDERS (%)
55.6%
ISM AIL M OHAM ED 8.6%
SEONG KELVIN FONG KENG 7.6%
PRICE PERFORMANCE (%)
1M T H 3 M T H 1Y R
COM PANY (11.3) (3.4) N.A.
STI RETURN (4.3) (1.2) (6.5)
PRICE VS. STI
Source: B loomberg, PSR
KEY FINANCIALS
Y / E D ec, SGD ( mn) F Y 17 F Y 18 F Y 19 e F Y 2 0 e
Revenue 332 432 464 487
Gross Profit 34 41 46 49
Operating Profit 22 26 33 35
PAT 19 22 27 29
P/E (x) 11.6 9.7 7.2 6.7
P/B (x) 8.9 2.7 1.9 1.5
EPS, SGD cents 4.4 5.2 7.1 7.6
Dividend yield, % 5.1 6.0 7.5 8.0
ROE, % 89% 31% 28% 24%
ROA, % 20% 15% 16% 14%
Source: Company Data, PSR
Valuation Method
DCF (Cost of equity 7.2%, Terminal growth 0%)
Tara Wong (+65 6212 1850)
Research Analyst
SGD 0.51
SGD 0.04
SGD 0.63
31.8%
P&N HOLDINGS PTE LTD
0.40
0.50
0.60
0.70
0.80
Jun-18 Sep-18 Dec-18 Mar-19PROP SP Equity FSSTI index
Page | 23 | PHILLIP SECURITIES RESEARCH (SINGAPORE)
REAL ESTATE AGENCIES INITIATION
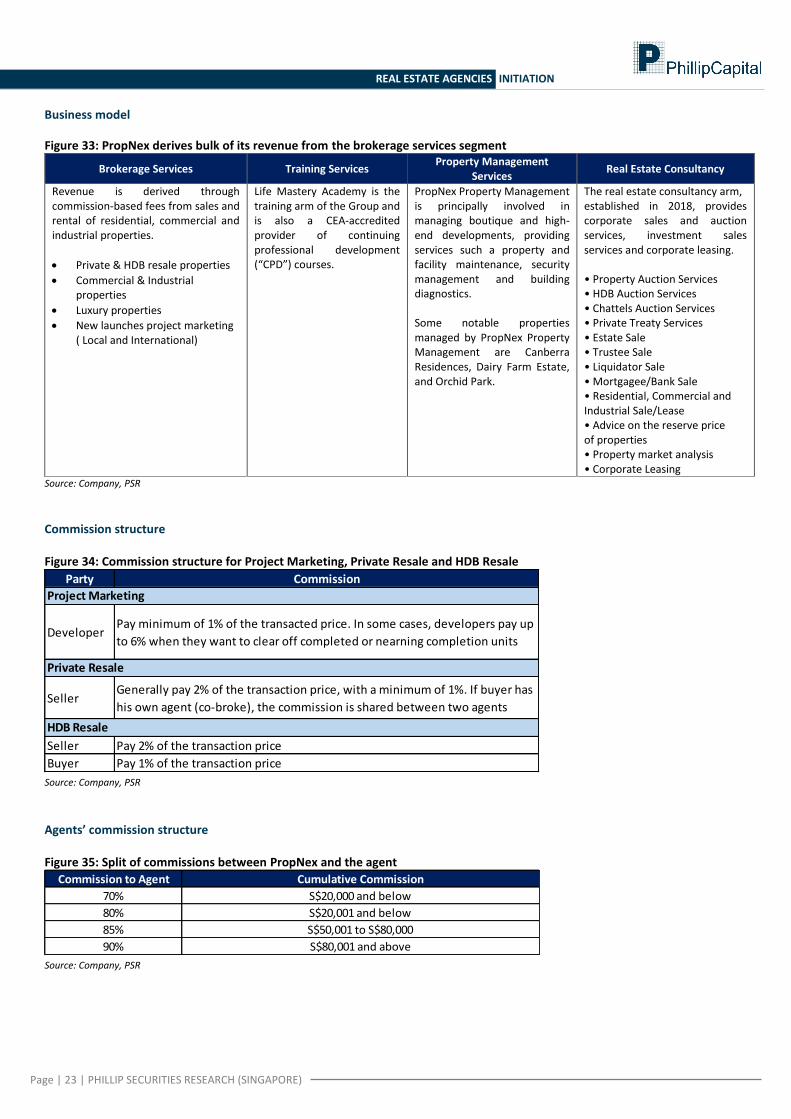
Business model
Figure 33: PropNex derives bulk of its revenue from the brokerage services segment
Brokerage Services Training Services Property Management
Services Real Estate Consultancy
Revenue is derived through commission-based fees from sales and rental of residential, commercial and industrial properties.
Private & HDB resale properties
Commercial & Industrial properties
Luxury properties
New launches project marketing ( Local and International)
Life Mastery Academy is the training arm of the Group and is also a CEA-accredited provider of continuing professional development (“CPD”) courses.
PropNex Property Management is principally involved in managing boutique and high-end developments, providing services such a property and facility maintenance, security management and building diagnostics. Some notable properties managed by PropNex Property Management are Canberra Residences, Dairy Farm Estate, and Orchid Park.
The real estate consultancy arm, established in 2018, provides corporate sales and auction services, investment sales services and corporate leasing. • Property Auction Services • HDB Auction Services • Chattels Auction Services • Private Treaty Services • Estate Sale • Trustee Sale • Liquidator Sale • Mortgagee/Bank Sale • Residential, Commercial and Industrial Sale/Lease • Advice on the reserve price of properties • Property market analysis • Corporate Leasing
Source: Company, PSR
Commission structure Figure 34: Commission structure for Project Marketing, Private Resale and HDB Resale
Source: Company, PSR
Agents’ commission structure Figure 35: Split of commissions between PropNex and the agent
Source: Company, PSR
Party Commission
DeveloperPay minimum of 1% of the transacted price. In some cases, developers pay up
to 6% when they want to clear off completed or nearning completion units
SellerGenerally pay 2% of the transaction price, with a minimum of 1%. If buyer has
his own agent (co-broke), the commission is shared between two agents
Seller Pay 2% of the transaction price
Buyer Pay 1% of the transaction price
HDB Resale
Private Resale
Project Marketing
Commission to Agent Cumulative Commission
70% S$20,000 and below
80% S$20,001 and below
85% S$50,001 to S$80,000
90% S$80,001 and above
Page | 24 | PHILLIP SECURITIES RESEARCH (SINGAPORE)
REAL ESTATE AGENCIES INITIATION
Investment Merits 1) Largest real estate agency with demonstrated ability to expand inorganically
PropNex currently holds the #1 title in terms of the number of real estate agents in Singapore, only recently jumping up from #2 position in 2017, after successfully merging with Dennis Wee Realty in July 2017. This expanded its agent count by 20% in 2018. Subsequently in Feb 2019, it entered into a strategic collaboration with Global Alliance Property (operating under the Century 21 franchise) for its agents to be transferred to PropNex. Its current agent count stands at 7,837, a 17% increase from 2018 even already increasing by 20% the year before.
2) Still gaining market share
PropNex had previously not been among the first port-of-calls for property developers when it comes to new launches. It had only in recent times gradually earned market share in this particular segment. While agent count does not correlate with market share of transactions, PropNex has managed to push through to be among the top two agencies with the biggest market share of transactions for new launches. Its market share of transactions in the other segments had also increased within the same period.
3) Agent-focused business model PropNex is vested in the engagement and rewarding of its agents. It holds regular jumpstart trainings, power sales booster trainings, post cooling measures trainings and quarterly conventions. These trainings and conventions are intended to help its agents properly guide potential homebuyers during the process. Figure 36: President Madam Halimah Yacob attended PropNex’s August convention
Source: Company
Figure 37: First PropNex consumer seminar of 2019 conducted by PropNex Executive Chairman & CEO Ismail Gafoor (centre, pictured)
Source: Company
Figure 38: PropNex also holds seminars directed at Chinese investors
Source: Company
Page | 25 | PHILLIP SECURITIES RESEARCH (SINGAPORE)
REAL ESTATE AGENCIES INITIATION
Figure 39: PropNex is currently trading at a P/E of 8.9x
Source: Bloomberg, PSR
Page | 26 | PHILLIP SECURITIES RESEARCH (SINGAPORE)
REAL ESTATE AGENCIES INITIATION
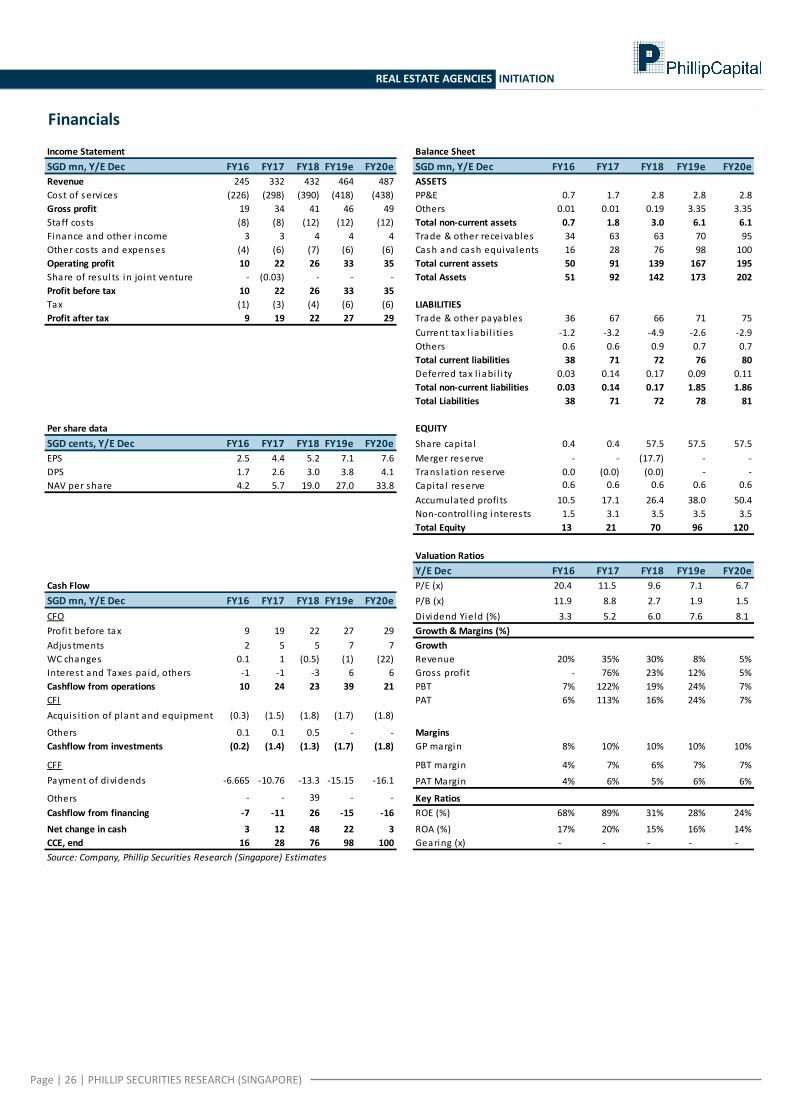
Financials
Income Statement Balance Sheet
SGD mn, Y/E Dec FY16 FY17 FY18 FY19e FY20e SGD mn, Y/E Dec FY16 FY17 FY18 FY19e FY20e
Revenue 245 332 432 464 487 ASSETS
Cost of services (226) (298) (390) (418) (438) PP&E 0.7 1.7 2.8 2.8 2.8
Gross profit 19 34 41 46 49 Others 0.01 0.01 0.19 3.35 3.35
Staff costs (8) (8) (12) (12) (12) Total non-current assets 0.7 1.8 3.0 6.1 6.1
Finance and other income 3 3 4 4 4 Trade & other receivables 34 63 63 70 95
Other costs and expenses (4) (6) (7) (6) (6) Cash and cash equiva lents 16 28 76 98 100
Operating profit 10 22 26 33 35 Total current assets 50 91 139 167 195
Share of results in joint venture - (0.03) - - - Total Assets 51 92 142 173 202
Profit before tax 10 22 26 33 35
Tax (1) (3) (4) (6) (6) LIABILITIES
Profit after tax 9 19 22 27 29 Trade & other payables 36 67 66 71 75
Current tax l iabi l i ties -1.2 -3.2 -4.9 -2.6 -2.9
Others 0.6 0.6 0.9 0.7 0.7
Total current liabilities 38 71 72 76 80
Deferred tax l iabi l i ty 0.03 0.14 0.17 0.09 0.11
Total non-current liabilities 0.03 0.14 0.17 1.85 1.86
Total Liabilities 38 71 72 78 81
Per share data EQUITY
SGD cents, Y/E Dec FY16 FY17 FY18 FY19e FY20e Share capita l 0.4 0.4 57.5 57.5 57.5
EPS 2.5 4.4 5.2 7.1 7.6 Merger reserve - - (17.7) - -
DPS 1.7 2.6 3.0 3.8 4.1 Trans lation reserve 0.0 (0.0) (0.0) - -
NAV per share 4.2 5.7 19.0 27.0 33.8 Capita l reserve 0.6 0.6 0.6 0.6 0.6
Accumulated profi ts 10.5 17.1 26.4 38.0 50.4
Non-control l ing interests 1.5 3.1 3.5 3.5 3.5
Total Equity 13 21 70 96 120
Valuation Ratios
Y/E Dec FY16 FY17 FY18 FY19e FY20e
Cash Flow P/E (x) 20.4 11.5 9.6 7.1 6.7
SGD mn, Y/E Dec FY16 FY17 FY18 FY19e FY20e P/B (x) 11.9 8.8 2.7 1.9 1.5
CFO Dividend Yield (%) 3.3 5.2 6.0 7.6 8.1
Profi t before tax 9 19 22 27 29 Growth & Margins (%)
Adjustments 2 5 5 7 7 Growth
WC changes 0.1 1 (0.5) (1) (22) Revenue 20% 35% 30% 8% 5%
Interest and Taxes pa id, others -1 -1 -3 6 6 Gross profi t - 76% 23% 12% 5%
Cashflow from operations 10 24 23 39 21 PBT 7% 122% 19% 24% 7%
CFI PAT 6% 113% 16% 24% 7%
Acquis i tion of plant and equipment (0.3) (1.5) (1.8) (1.7) (1.8)
Others 0.1 0.1 0.5 - - Margins
Cashflow from investments (0.2) (1.4) (1.3) (1.7) (1.8) GP margin 8% 10% 10% 10% 10%
CFF PBT margin 4% 7% 6% 7% 7%
Payment of dividends -6.665 -10.76 -13.3 -15.15 -16.1 PAT Margin 4% 6% 5% 6% 6%
Others - - 39 - - Key Ratios
Cashflow from financing -7 -11 26 -15 -16 ROE (%) 68% 89% 31% 28% 24%
Net change in cash 3 12 48 22 3 ROA (%) 17% 20% 15% 16% 14%
CCE, end 16 28 76 98 100 Gearing (x) - - - - -
Source: Company, Phillip Securities Research (Singapore) Estimates
Page | 27 | PHILLIP SECURITIES RESEARCH (SINGAPORE)
REAL ESTATE AGENCIES INITIATION
Total Returns Recommendation Rating
> +20% Buy 1
+5% to +20% Accumulate 2
-5% to +5% Neutra l 3
-5% to -20% Reduce 4
< -20% Sel l 5
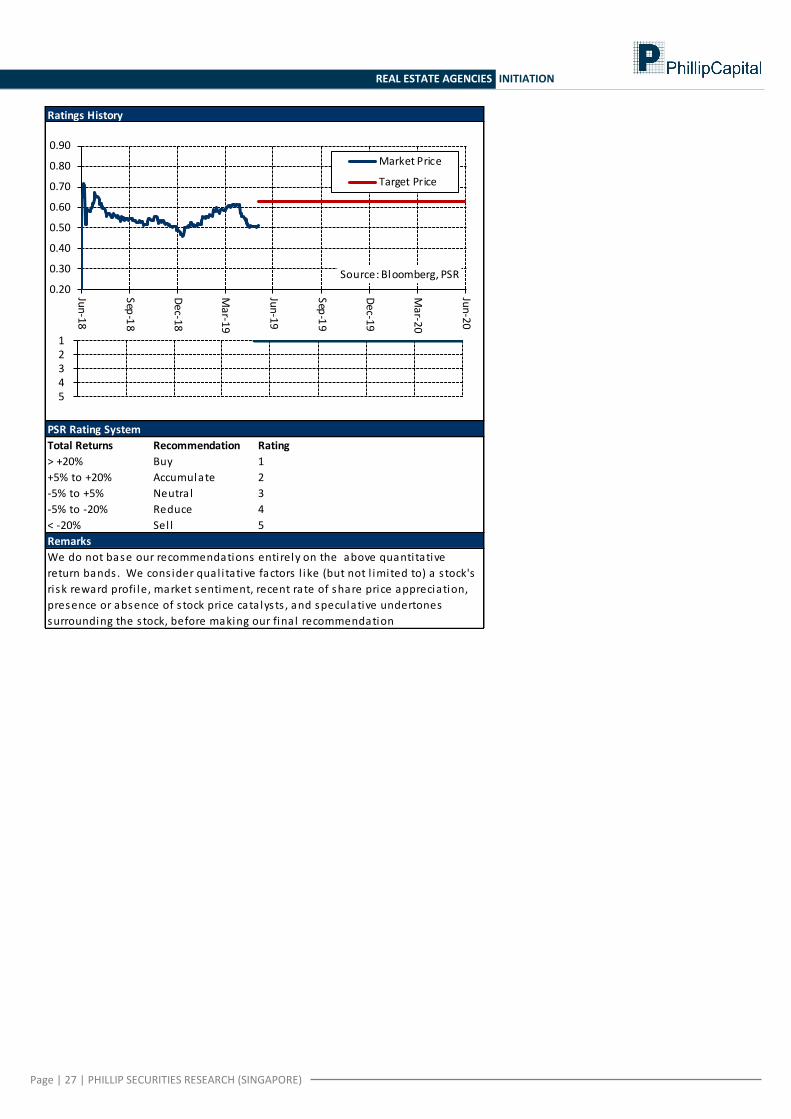
Ratings History
PSR Rating System
Remarks
We do not base our recommendations entirely on the above quanti tative
return bands . We cons ider qual i tative factors l ike (but not l imited to) a s tock's
ri sk reward profi le, market sentiment, recent rate of share price appreciation,
presence or absence of s tock price catalysts , and speculative undertones
surrounding the s tock, before making our fina l recommendation
1 2 3 4 5
0.20
0.30
0.40
0.50
0.60
0.70
0.80
0.90
Jun
-18
Sep
-18
De
c-18
Ma
r-19
Jun
-19
Sep
-19
De
c-19
Ma
r-20
Jun
-20
Source: Bloomberg, PSR
Market Price
Target Price

Page | 28 | PHILLIP SECURITIES RESEARCH (SINGAPORE)
REAL ESTATE AGENCIES INITIATION
Contact Information (Singapore Research Team) Head of Research Research Admin Paul Chew – [email protected] Siti Nursyazwina - [email protected]
Banking & Finance | Healthcare Oil & Gas | Energy Telco | Technology Tin Min Ying – [email protected] Chen Guangzhi - [email protected] Alvin Chia - [email protected] Property | REITs REITs China/HK Equity Tara Wong - [email protected] Natalie Ong - [email protected] Zheng Jieyuan – [email protected] US Equity Technical Analyst Edmund Xue – [email protected] Chua Wei Ren – [email protected]
Contact Information (Regional Member Companies) SINGAPORE
Phillip Securities Pte Ltd Raffles City Tower
250, North Bridge Road #06-00 Singapore 179101 Tel +65 6533 6001 Fax +65 6535 6631
Website: www.poems.com.sg
MALAYSIA Phillip Capital Management Sdn Bhd
B-3-6 Block B Level 3 Megan Avenue II, No. 12, Jalan Yap Kwan Seng, 50450
Kuala Lumpur Tel +603 2162 8841 Fax +603 2166 5099
Website: www.poems.com.my
HONG KONG Phillip Securities (HK) Ltd
11/F United Centre 95 Queensway Hong Kong
Tel +852 2277 6600 Fax +852 2868 5307
Websites: www.phillip.com.hk
JAPAN
Phillip Securities Japan, Ltd. 4-2 Nihonbashi Kabuto-cho Chuo-ku,
Tokyo 103-0026 Tel +81-3 3666 2101 Fax +81-3 3666 6090
Website: www.phillip.co.jp
INDONESIA PT Phillip Securities Indonesia
ANZ Tower Level 23B, Jl Jend Sudirman Kav 33A Jakarta 10220 – Indonesia
Tel +62-21 5790 0800 Fax +62-21 5790 0809
Website: www.phillip.co.id
CHINA Phillip Financial Advisory (Shanghai) Co Ltd
No 550 Yan An East Road, Ocean Tower Unit 2318,
Postal code 200001 Tel +86-21 5169 9200 Fax +86-21 6351 2940
Website: www.phillip.com.cn
THAILAND Phillip Securities (Thailand) Public Co. Ltd
15th Floor, Vorawat Building, 849 Silom Road, Silom, Bangrak,
Bangkok 10500 Thailand Tel +66-2 6351700 / 22680999
Fax +66-2 22680921 Website www.phillip.co.th
FRANCE King & Shaxson Capital Limited
3rd Floor, 35 Rue de la Bienfaisance 75008 Paris France
Tel +33-1 45633100 Fax +33-1 45636017
Website: www.kingandshaxson.com
UNITED KINGDOM King & Shaxson Capital Limited
6th Floor, Candlewick House, 120 Cannon Street, London, EC4N 6AS
Tel +44-20 7426 5950 Fax +44-20 7626 1757
Website: www.kingandshaxson.com
UNITED STATES Phillip Capital Inc
141 W Jackson Blvd Ste 3050 The Chicago Board of Trade Building
Chicago, IL 60604 USA Tel +1-312 356 9000 Fax +1-312 356 9005
Website: www.phillipusa.com
AUSTRALIA Phillip Capital Limited
Level 10, 330 Collins Street Melbourne, Victoria 3000, Australia
Tel +61-03 8633 9803 Fax +61-03 8633 9899
Website: www.phillipcapital.com.au
SRI LANKA Asha Phillip Securities Limited
No. 60, 5th Lane, Colombo 3, Sri Lanka Tel: (94) 11 2429 100 Fax: (94) 11 2429 199
Website: www.ashaphillip.net
INDIA
PhillipCapital (India) Private Limited No.1, 18th Floor, Urmi Estate 95, Ganpatrao Kadam Marg
Lower Parel West, Mumbai 400-013 Maharashtra, India
Tel: +91-22-2300 2999 / Fax: +91-22-2300 2969 Website: www.phillipcapital.in
TURKEY PhillipCapital Menkul Degerler
Dr. Cemil Bengü Cad. Hak Is Merkezi No. 2 Kat. 6A Caglayan 34403 Istanbul, Turkey
Tel: 0212 296 84 84 Fax: 0212 233 69 29
Website: www.phillipcapital.com.tr
DUBAI Phillip Futures DMCC
Member of the Dubai Gold and Commodities Exchange (DGCX)
Unit No 601, Plot No 58, White Crown Bldg, Sheikh Zayed Road, P.O.Box 212291
Dubai-UAE Tel: +971-4-3325052 / Fax: + 971-4-3328895
CAMBODIA
Phillip Bank Plc Ground Floor of B-Office Centre,#61-64, Norodom Blvd Corner Street 306,Sangkat Boeung Keng Kang 1, Khan Chamkamorn,
Phnom Penh, Cambodia Tel: 855 (0) 7796 6151/855 (0) 1620 0769
Website: www.phillipbank.com.kh

Page | 29 | PHILLIP SECURITIES RESEARCH (SINGAPORE)
REAL ESTATE AGENCIES INITIATION
Important Information
This report is prepared and/or distributed by Phillip Securities Research Pte Ltd ("Phillip Securities Research"), which is a holder of a financial adviser’s license under the Financial Advisers Act, Chapter 110 in Singapore.
By receiving or reading this report, you agree to be bound by the terms and limitations set out below. Any failure to comply with these terms and limitations may constitute a violation of law. This report has been provided to you for personal use only and shall not be reproduced, distributed or published by you in whole or in part, for any purpose. If you have received this report by mistake, please delete or destroy it, and notify the sender immediately.
The information and any analysis, forecasts, projections, expectations and opinions (collectively, the “Research”) contained in this report has been obtained from public sources which Phillip Securities Research believes to be reliable. However, Phillip Securities Research does not make any representation or warranty, express or implied that such information or Research is accurate, complete or appropriate or should be relied upon as such. Any such information or Research contained in this report is subject to change, and Phillip Securities Research shall not have any responsibility to maintain or update the information or Research made available or to supply any corrections, updates or releases in connection therewith.
Any opinions, forecasts, assumptions, estimates, valuations and prices contained in this report are as of the date indicated and are subject to change at any time without prior notice. Past performance of any product referred to in this report is not indicative of future results.
This report does not constitute, and should not be used as a substitute for, tax, legal or investment advice. This report should not be relied upon exclusively or as authoritative, without further being subject to the recipient’s own independent verification and exercise of judgment. The fact that this report has been made available constitutes neither a recommendation to enter into a particular transaction, nor a representation that any product described in this report is suitable or appropriate for the recipient. Recipients should be aware that many of the products, which may be described in this report involve significant risks and may not be suitable for all investors, and that any decision to enter into transactions involving such products should not be made, unless all such risks are understood and an independent determination has been made that such transactions would be appropriate. Any discussion of the risks contained herein with respect to any product should not be considered to be a disclosure of all risks or a complete discussion of such risks.
Nothing in this report shall be construed to be an offer or solicitation for the purchase or sale of any product. Any decision to purchase any product mentioned in this report should take into account existing public information, including any registered prospectus in respect of such product.
Phillip Securities Research, or persons associated with or connected to Phillip Securities Research, including but not limited to its officers, directors, employees or persons involved in the issuance of this report, may provide an array of financial services to a large number of corporations in Singapore and worldwide, including but not limited to commercial / investment banking activities (including sponsorship, financial advisory or underwriting activities), brokerage or securities trading activities. Phillip Securities Research, or persons associated with or connected to Phillip Securities Research, including but not limited to its officers, directors, employees or persons involved in the issuance of this report, may have participated in or invested in transactions with the issuer(s) of the securities mentioned in this report, and may have performed services for or solicited business from such issuers. Additionally, Phillip Securities Research, or persons associated with or connected to Phillip Securities Research, including but not limited to its officers, directors, employees or persons involved in the issuance of this report, may have provided advice or investment services to such companies and investments or related investments, as may be mentioned in this report.
Phillip Securities Research or persons associated with or connected to Phillip Securities Research, including but not limited to its officers, directors, employees or persons involved in the issuance of this report may, from time to time maintain a long or short position in securities referred to herein, or in related futures or options, purchase or sell, make a market in, or engage in any other transaction involving such securities, and earn brokerage or other compensation in respect of the foregoing. Investments will be denominated in various currencies including US dollars and Euro and thus will be subject to any fluctuation in exchange rates between US dollars and Euro or foreign currencies and the currency of your own jurisdiction. Such fluctuations may have an adverse effect on the value, price or income return of the investment.
To the extent permitted by law, Phillip Securities Research, or persons associated with or connected to Phillip Securities Research, including but not limited to its officers, directors, employees or persons involved in the issuance of this report, may at any time engage in any of the above activities as set out above or otherwise hold an interest, whether material or not, in respect of companies and investments or related investments, which may be mentioned in this report. Accordingly, information may be available to Phillip Securities Research, or persons associated with or connected to Phillip Securities Research, including but not limited to its officers, directors, employees or persons involved in the issuance of this report, which is not reflected in this report, and Phillip Securities Research, or persons associated with or connected to Phillip Securities Research, including but not limited to its officers, directors, employees or persons involved in the issuance of this report, may, to the extent permitted by law, have acted upon or used the information prior to or immediately following its publication. Phillip Securities Research, or persons associated with or connected to Phillip Securities Research, including but not limited its officers, directors, employees or persons involved in the issuance of this report, may have issued other material that is inconsistent with, or reach different conclusions from, the contents of this report.
The information, tools and material presented herein are not directed, intended for distribution to or use by, any person or entity in any jurisdiction or country where such distribution, publication, availability or use would be contrary to the applicable law or regulation or which would subject Phillip Securities Research to any registration or licensing or other requirement, or penalty for contravention of such requirements within such jurisdiction.
This report is intended for general circulation only and does not take into account the specific investment objectives, financial situation or particular needs of any particular person. The products mentioned in this report may not be suitable for all investors and a person receiving or reading this report should seek advice from a professional and financial adviser regarding the legal, business, financial, tax and other aspects including the suitability of such products, taking into account the specific investment objectives, financial situation or particular needs of that person, before making a commitment to invest in any of such products.
This report is not intended for distribution, publication to or use by any person in any jurisdiction outside of Singapore or any other jurisdiction as Phillip Securities Research may determine in its absolute discretion. IMPORTANT DISCLOSURES FOR INCLUDED RESEARCH ANALYSES OR REPORTS OF FOREIGN RESEARCH HOUSES Where the report contains research analyses or reports from a foreign research house, please note:
(i) recipients of the analyses or reports are to contact Phillip Securities Research (and not the relevant foreign research house) in Singapore at 250 North Bridge Road, #06-00 Raffles City Tower, Singapore 179101, telephone number +65 6533 6001, in respect of any matters arising from, or in connection with, the analyses or reports; and
to the extent that the analyses or reports are delivered to and intended to be received by any person in Singapore who is not an accredited investor, expert investor or institutional investor, Phillip Securities Research accepts legal responsibility for the contents of the analyses or reports.