Embed Size (px)
Citation preview

Real Estate Market Size
A N N U A L U P D AT E O N T H E S I Z E O F T H E P R O F E S S I O N A L LY M A N A G E D G LO B A L R E A L E S TAT E I N V E S T M E N T M A R K E T
2019/20
Market size estimates in 2019
07Drivers of Market size changes in 2019
10MSCI market coverage and global transparency
16

R E A L E S T A T E M A R K E T S I Z E 2 0 1 9 / 2 0 R E P O R TM S C I
2Ov
ervi
ewM A R K E T S I Z E I N C R E A S E D I N 2 0 1 9
The size of the professionally managed global real estate investment market increased from $8.9 trillion in 2018 to $9.6 trillion in 2019.
Key takeways
C H I N A C O N T I N U E S T O B E T H E F O U R T H -L A R G E S T M A R K E T F O R T H E S E C O N D C O N S E C U T I V E Y E A R
China ranked as the fourth-largest national market, behind United States, Japan, United Kingdom for the second consecutive year having overtaken Germany in 2018.
$8.9trn2018
$9.6trn2019
C U R R E N C Y M O V E M E N T S H A D M A R G I N A L I M P A C T A S C O M P A R E D T O L A S T Y E A R
Currency movements marginally impacted the size of the global real estate investment market by approximately +0.1% in US Dollars (USD), in contrast to the negative impact in 2018 (-2.6%). Asset value growth and transaction activity of already existing portfolios, newly identified portfolios and new developments in the market, such as new construction and sale and leaseback transactions, also contributed to the growth in market size.
2018
2019
-2.6%
+0.1%U N I T E D S T A T E S W E I G H T I N C R E A S E D
The relative weight of the United States within the MSCI Global Annual Property Index (Unfrozen; Weighting: Market Size) increased further from 40.9% in 2018 to 41.3% in 2019.

R E A L E S T A T E M A R K E T S I Z E 2 0 1 9 / 2 0 R E P O R TM S C I
3Co
nten
ts04A B O U T T H E E S T I M A T E S
14R E S I D U A L
16M S C I M A R K E T C O V E R A G E A N D G L O B A L T R A N S P A R E N C Y
18C O N C L U S I O N
19 A P P E N D I X
05M A R K E T S I Z E E S T I M A T E C H A N G E
06C O U N T R Y M A R K E T S I Z E S
07M A R K E T S I Z E E S T I M A T E S I N 2 0 1 9
09R E L A T I V E M A R K E T S I Z E E S T I M A T E S
10D R I V E R S O F M A R K E T S I Z E C H A N G E S I N 2 0 1 9
12C U R R E N C Y I M P A C T
13C A P I T A L G R O W T H A N D A S S E T V A L U E G R O W T H
0 6C O U NT RY M A R K E TS I Z E S
1 0D R I V E R S O F M A R K E T
S I Z E C H A N G E S I N 2 0 1 9

R E A L E S T A T E M A R K E T S I Z E 2 0 1 9 / 2 0 R E P O R TM S C I
4
SCI began systematically estimating the size of professionally managed real
estate investment markets in 2004. These estimates are fundamental to the creation of the MSCI Global Annual Property Index (Unfrozen; Weighting: Market Size) and a range of other multinational indexes, and they provide insights into the coverage of MSCI’s direct property indexes. This paper sets out the 2019 market size estimates and explains the main changes that occurred between 2018 and 2019.
The MSCI Global Annual Property Index weighs real estate investment returns across 25 countries. While MSCI’s national indexes for Japan and Korea are included in the MSCI Global Annual Property Index, our market data for seven other Asian countries – China, Hong Kong, Indonesia, Malaysia, Singapore, Taiwan and Thailand – are excluded from that index. In this report, all national market sizes are based on bottom-up, portfolio-specific estimates, and these are converted into US Dollars using the year-end currency conversion rate.
MSCI captures a large amount of information on individual real estate investment portfolios around the world, which forms the foundation of our market information products (MSCI Real Estate Global Intel) and MSCI Real Estate Enterprise Analytics for direct real estate holdings at the asset level. By the end of 2019, the value of these directly measured real estate investment portfolios was $2.2 trillion. However, despite this high level of coverage, MSCI does not directly measure all portfolios in the market. While MSCI’s data is useful for understanding how the market is changing, additional data sources are needed to build up definitive estimates of market size. MSCI does this by combining bottom-up, portfolio-specific in-house information with data obtained from the public domain, including pre-existing databases, annual and quarterly reports from companies and data from company websites. This approach aims to identify all direct real estate holdings in each country on a portfolio-by-portfolio basis, following the MSCI methodology, which seeks only to capture the value of professionally managed real estate owned for investment purposes.
Invested real estate stock is defined as property owned for the primary purpose of benefitting from investment returns, as distinct from owner-occupied and non-investment leased real estate. The owner-occupied part of the market comprises real estate that is both owned and occupied
About the estimates
Explaining the main changesbetween 2018 and 2019
by private and public companies, real estate owned by governments and used for governmental purposes, and residential buildings owned by private homeowners. In addition, there are organizations that own and lease real estate to tenants but whose primary objective something other than generating an investment return. These include social housing organizations and municipalities, which in some countries have substantial real estate portfolios (see Appendix 1 for more information about the methodology used).
MSCI uses the total estimated size of the professionally managed real estate stock owned for investment purposes in each market to reweight national indexes that contribute to the generation of multinational indexes, including but not limited to the MSCI Global Annual Property Index. For this purpose, all country-level market size estimates are converted to US Dollars at year-end currency conversion rates. Due to differences in MSCI index coverage levels nationally, the indexes are reweighed to provide a more representative balance between markets in the multinational indexes to which they contribute. The market size estimates are used for reweighing the MSCI Global Annual Property Index, the MSCI Nordic Annual Property Index (Unfrozen) and the MSCI Europe Annual Property Index (Unfrozen; Weighting: Market Size), as well as other regional indexes and bespoke or custom indexes.
M

R E A L E S T A T E M A R K E T S I Z E 2 0 1 9 / 2 0 R E P O R TM S C I
5 Market sizeestimate change
Longer term changes in marketsize weights
The size of the professionally managed global real estate investment market increased by 7.8% from $8.9 trillion in 2018 to $9.6 trillion in 2019. The growth was higher as compared to 2018 when the market grew by 4.1%.
United States continued to be the largest market, while Japan and United Kingdom remained at the second and third postion respectively. China continued to be at the fourth postion for the second year in a row while Germany was at the fifth position.
The relative weights of individual countries in the MSCI Global Annual Property Index have shifted over time, as shown in Exhibit 2. These changes have resulted from a combination of asset value growth, currency impact and a residual component. The weight of the United States market continued to increase year
on year, going from 31.0% in 2009 to 41.3% in 2019. Germany, France and Canada continued to be around 7.0%, 5.3% and 4.4% respectively. The weight of the United Kingdom was around 9.0% as compared to 2014 when it was over 11.0%. There was a decline in Japan from 15.3% in 2009 to 10.6% in 2019.
E X H I B IT 1 : Change in Global Market Size Estimate and for 5 largest countries, USD Billion
1 0 ,0 0 0
2,0 0 0
4,0 0 0
6,0 0 0
8,0 0 0
20
06
20
07
20
08
20
09
20
10
20
11
20
12
20
13
20
14
20
15
20
16
20
17
20
18
20
19
-
United States United Kingdom Japan
Germany China
Other countries
E X H I B IT 2 : Weight of the Six Largest Countries in the MSCI Global Annual Property Index
Source: MSCI, KTI (Finland)
20
06
20
07
20
08
20
09
20
10
20
11
20
12
20
13
20
14
20
15
20
16
20
17
20
18
20
19
United States United Kingdom France
Japan Germany Canada
5 0%
4 0%
3 0%
2 0%
1 0%
0%

R E A L E S T A T E M A R K E T S I Z E 2 0 1 9 / 2 0 R E P O R TM S C I
6 Country Market Sizes
M A R K E T S I Z E E S T I M AT E S I N 2 0 1 9
R E L AT I V E M A R K E T S I Z E E S T I M AT E S
0 7
0 9

R E A L E S T A T E M A R K E T S I Z E 2 0 1 9 / 2 0 R E P O R TM S C I
7
Market size estimates in 2019Although individual market size estimates can potentially have a large impact on the MSCI Global Annual Property Index, they have proved relatively consistent from year to year. This consistency was again evident in 2019, although there were some important changes for individual countries, as shown in Exhibit 3. The largest absolute change was for the United States, with a market size increase of $271.8 billion. Interestingly, there was an increase in the absolute market size estimates across all
markets for 2019 vs. 2018 where we saw a decline in the market size estimates for several markets (United Kingdom, Australia, Italy, Belgium, Norway, South Africa, Taiwan, Ireland, Malaysia and New Zealand).
Other noticeable movements in the market size rankings included Netherlands moving up to the 12th position while Singapore moving down to 13th. Additionally, Taiwan moved up by 3 positions to the 21st position.
E X H I B IT 3 : Change in National Market Sizes between 2018 and 2019, USD Billion
Unite
d St
ates
Japa
n
Unite
d Ki
ngdo
m
Chin
a
Ger
man
y
Fran
ce
Hon
g Ko
ng
Cana
da
Aust
ralia
Switz
erla
nd
Swed
en
Net
herla
nds
Sing
apor
e
Italy
Spai
n
Sout
h Ko
rea
Finl
and
Denm
ark
Belg
ium
Nor
way
Taiw
an
Sout
h Af
rica
Pola
nd
Aust
ria
Irela
nd
Port
ugal
Mal
aysi
a
Czec
h Re
publ
ic
Thai
land
New
Zea
land
Indo
nesi
a
Hun
gary
3,4
18.1
881
.4
745
.5
592
.2
580
.1
441
.2
378
.3
361
.0
306
.8
266
.3
231
.5
184
.3
176
.0
128
.1
110
.8
88.
4
86.
5
70.
7
59.
8
56.
7
51.
9
50.
2
49.
8
45.
1
32.
1
30.
2
28.
6
28.
1
27.
7
20.
2
14.
3
10.
8
271.
8
50.1
31.7
51.8
44.7
14.6
12.0 41
.2
28.7
25.3
18.4
17.1
2.3
3.1
6.4
4.8
7.1
4.0
2.0
3.0
9.2
3.9
1.6
2.3
1.7
1.0
0.7
2.3
6.0
2.6
0.4
0.1
Market size in 2019
Net change from 2018
Source: MSCI, KTI (Finland)
R E A L E S T A T E M A R K E T S I Z E 2 0 1 9 / 2 0 R E P O R TM S C I
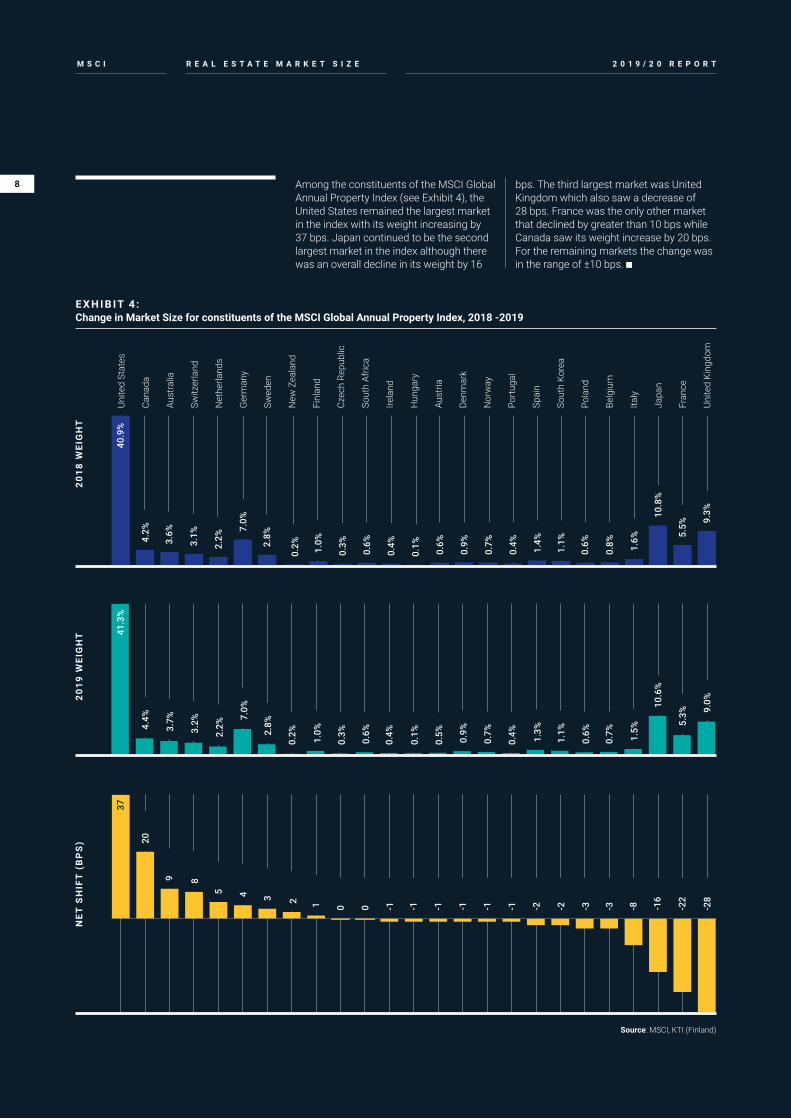
8 Among the constituents of the MSCI Global Annual Property Index (see Exhibit 4), the United States remained the largest market in the index with its weight increasing by 37 bps. Japan continued to be the second largest market in the index although there was an overall decline in its weight by 16
bps. The third largest market was United Kingdom which also saw a decrease of 28 bps. France was the only other market that declined by greater than 10 bps while Canada saw its weight increase by 20 bps. For the remaining markets the change was in the range of ±10 bps.
E X H I B IT 4 : Change in Market Size for constituents of the MSCI Global Annual Property Index, 2018 -2019
Unite
d St
ates
Cana
da
Aust
ralia
Switz
erla
nd
Net
herla
nds
Ger
man
y
Swed
en
New
Zea
land
Finl
and
Czec
h Re
publ
ic
Sout
h Af
rica
Irela
nd
Hun
gary
Aust
ria
Denm
ark
Nor
way
Port
ugal
Spai
n
Sout
h Ko
rea
Pola
nd
Belg
ium
Italy
Japa
n
Fran
ce
Unite
d Ki
ngdo
m
20
18
WEI
GH
T2
01
9 W
EIG
HT
NE
T S
HIF
T (
BP
S)
4.2%
4.4%
20
9 8
5 4 3 2 1 0 0 -1 -1 -1 -1 -1 -1 -2 -2 -3 -3 -8 -16
-22
-28
3.7%
3.2%
2.2%
7.0%
2.8%
0.2% 1.0%
0.3%
0.6%
0.4%
0.1%
0.5% 0.9%
0.7%
0.4% 1.3%
1.1%
0.6%
0.7% 1.5%
10.6
%
5.3% 9.
0%
40.9
%41
.3%
37
3.6%
3.1%
2.2%
7.0%
2.8%
0.2% 1.0%
0.3%
0.6%
0.4%
0.1% 0.6%
0.9%
0.7%
0.4% 1.4%
1.1%
0.6%
0.8% 1.6%
10.8
%
5.5%
9.3%
Source: MSCI, KTI (Finland)

R E A L E S T A T E M A R K E T S I Z E 2 0 1 9 / 2 0 R E P O R TM S C I
9 Relative market size estimates
xhibit 5 compares the national real estate market sizes with GDP
per capita, with clear regional differences emerging. The wealthy city-states of Singapore and Hong Kong have the largest relative market sizes. The size of the professionally managed real estate investment market in Hong Kong was over 100% of its GDP per capita (2018),
a level driven up significantly by the high value per floor area. Switzerland and Sweden continued to have the largest relative real estate investment market sizes in Europe. However, Norway, Europe’s second wealthiest country in terms of GDP per capita, continued to fall behind its Nordic neighbours in relative real estate market size.
E X H I B IT 5 : Relative Estimated Market Size by GDP per capita
$ 5 0,0 0 0
$ 4 0,0 0 0
$ 3 0,0 0 0
$ 2 0,0 0 0
$ 1 0,0 0 0
GDP per capita, 2018 (USD)
APAC E Europe Americas UK / IrelandNordics S Europe W Europe Pan-Asia
E
H O N G KO N G
RE = 100% of GDP
RE = 25% of GDP
RE = 10% of GDP
S I N G A P O R E S W IT Z E R L A N D
$ 2 0,0 0 0 $ 4 0,0 0 0 $ 6 0,0 0 0 $ 8 0,0 0 0 $ 1 0 0,0 0 0
N O R WAY
Source: World Bank, MSCI, KTI (Finland)
Size
of m
anag
ed m
arke
t in
2019
on
a pe
r-cap
ita b
asis
(USD
)

R E A L E S T A T E M A R K E T S I Z E 2 0 1 9 / 2 0 R E P O R TM S C I
1 0 Drivers of Market Size Changes in 2019
C U R R E N C Y I M PA CT
C A P ITA L G R O W T H A N D A S S E T VA LU E G R O W T H
R E S I D UA L
M S C I M A R K E T C O V E R A G E A N D G LO B A L T R A N S PA R E N C Y
1 2
1 3
1 4
1 6

R E A L E S T A T E M A R K E T S I Z E 2 0 1 9 / 2 0 R E P O R TM S C I
1 1 SCI’s estimates of the size of the professionally managed real estate investment market
are based on the most recent information available from public and private sources. The estimate changes are driven by national market changes, including local capital growth fluctuations, currency movements and structural changes within each market.
In a perfect world, all relevant information on known real estate portfolios would be updated to year-end for each national market, but in practice this is impossible. One reason is that not all the portfolios with available information report their year-end values by the dates when the market sizes are estimated. The timing question is particularly relevant to the investment portfolios of high net worth individuals, but also applies to some portfolios held by pension funds and sovereign wealth funds. These often have long lead times on the release of their annual reports, sometimes exceeding four months following period-end, while others have reporting years that deviate from calendar years. In general, listed companies do better, publishing their annual reports within three months of their reporting year end, often with quarterly or biannual reports as well. The information is also often regularly available for unlisted funds, particularly open-end funds, which tend to be more transparent than closed-end funds. To minimize the effect of the currency fluctuations resulting from lagging information, the vast majority of information is based on the value of the portfolio in local currency.
Around 75% of the total estimated market size is based on 2019 real estate market values. The proportion of updated information varies between countries, but generally stands at between 70% and 90% of the total identified investment stock. The proportion of updated information was above 60% in each of the 25 markets covered in the MSCI Global Annual Property Index, and above 70.0% for the seven emerging markets in Asia.
The changes in the market size estimates between 2018 and 2019 are considered below, broken down into the contributions of currency impacts, capital growth in local currency and other changes.
M +0.1%impact of currency movement on global real estate investment market size at global level
capital growth for the MSCI GlobalAnnual Property Index for standinginvestments
E X H I B IT 6 : Updated AUM by Country, 2019 Data
100%
89%
87%
86%
85%
85%
85%
84%
82%
80%
79%
79%
77%
76%
76%
74%
73%
73%
73%
72%
71%
71%
70%
70%
68%
67%
67%
66%
66%
65%
63%
63%
11%
13%
14%
15%
15%
15%
16%
18%
20%
21%
21%
23%
24%
24%
26%
27%
27%
27%
28%
29%
29%
30%
30%
32%
33%
33%
34%
34%
35%
37%
37%
Finland
Indonesia
Singapore
Sweden
Hong Kong
Canada
South Africa
Australia
Norway
China
Switzerland
Thailand
New Zealand
Ireland
Taiwan
Austria
United Kingdom
Malaysia
United States
France
Japan
Hungary
Denmark
Poland
Italy
Netherlands
Czech Republic
Germany
Spain
Portugal
Belgium
South Korea
Updated Not updated Source: MSCI, KTI (Finland)
1.9%

R E A L E S T A T E M A R K E T S I Z E 2 0 1 9 / 2 0 R E P O R TM S C I
1 2
-1%
The impact of currency on the market size at a global level was +0.1% in 2019. Each country’s currency impact expressed in terms of USD is shown in Exhibit 7.
The currencies for Canada, United Kingdom, South Africa, Switzerland, Japan and New Zealand appreciated against the USD, while those for the remaining countries in the MSCI Global Property
Index depreciated against the USD. In 2018, the Japanese Yen was the only currency that had appreciated against the USD while the overall Global impact was -2.6%.
For the remaining Asian countries we saw an appreciation against the USD in six of the seven countries, with Chinese RMB being the only currency amongst the seven that depreciated against the USD in 2019.
E X H I B IT 7 : Currency Impact by Country in 2019, Local Currencies vs. USD
5%
-1%
-0.1
%0%
-2%
-2%
-2%
-2%
-2%
-2%
-2%
-2%
-2%
-2%
-2%
-2%
-2%
-4%
-5%
4%
3%
2%
1% 1%
0.1%
9%
4%
3%
1% 1%
0.5%
GLO
BA
L
MSCI GLOBAL ANNUAL PROPERTY INDEX OT H E R-A S I A
Cana
da
Unite
d Ki
ngdo
m
Sout
h Af
rica
Switz
erla
nd
Japa
n
New
Zea
land
Thai
land
Indo
nesi
a
Taiw
an
Sing
apor
e
Mal
aysi
a
Hon
g Ko
ng
Unite
d St
ates
Aust
ralia
Nor
way
Belg
ium
Czec
h Re
publ
ic
Finl
and
Fran
ce
Ger
man
y
Hun
gary
Irela
nd
Italy
Net
herla
nds
Pola
nd
Port
ugal
Spai
n
Denm
ark
Sout
h Ko
rea
Swed
en
Chin
a
Currency impact
Source: MSCI, Reuters
Aust
ria-2
%

R E A L E S T A T E M A R K E T S I Z E 2 0 1 9 / 2 0 R E P O R TM S C I
1 3 Capital growth and asset value growth
23 of the 25 countries in the MSCI Global Annual Property Index showed a positive capital growth in local currency terms in 2019, as shown in Exhibit 8. A negative capital growth in local currency was observed only for South Africa and United Kingdom.The highest levels of annual capital growth at standing investment level were recorded for Hungary (8.8%) and the Netherlands (7.5%).
The Capital Growth for the MSCI Global Annual Property Index for standing investments was 1.9%.
Of the seven Asian markets China, Singapore and Malaysia had a positive capital growth rate while the remaining four markets have shown a negative capital growth.
Capital growth is not the most appropriate performance measure to compare the market size change. Instead the asset value growth, which doesn’t subtract the capital expenditure, could be used for comparing the market size growth instead. The Asset Value Growth for the MSCI Global Annual Property Index for standing investments was 2.9%. In exhibit 8 besides the capital growth, the impact of the capital expenditure on standing investments based on the asset value growth is shown. In the MSCI Global Annual Property Index the difference between the asset value growth and the capital growth is 1.1%. Deviations of more than 1.5% have been observed for New Zealand, Canada, Australia, United States and Finland. The deviations ranged from 4.2% for New Zealand to 1.6% for Finland.
E X H I B IT 8 : Capital Growth (CG) and Asset Value Growth (AVG) by Country in 2019, Local Currencies (Standing Investments)
Hun
gary
Net
herla
nds
Swed
en
New
Zea
land
Ger
man
y
Czec
h Re
publ
ic
Finl
and
Aust
ria
Spai
n
Fran
ce
Denm
ark
Cana
da
Nor
way
Sout
h Ko
rea
Switz
erla
nd
Japa
n
Unite
d St
ates
Italy
Port
ugal
Pola
nd
Irela
nd
Belg
ium
Sout
h Af
rica
Unite
d Ki
ngdo
m
Chin
a
Sing
apor
e
Mal
aysi
a
Taiw
an
Thai
land
Hon
g Ko
ng
Indo
nesi
a
GLO
BAL
8.8%
7.5%
6.3%
6.7%
5.8%
4.0%
4.4%
4.3%
4.2%
3.5%
2.0%
2.9%
3.3%
2.7%
1.9%
2.5%
1.3%
2.0%
2.3%
1.8% 2.
1%
-2.1
%
-3.1
%
1.2%
-3.8
%
3.3%
1.3%
0.4%
1.4%
4.2%
0.4%
0.7%
1.6%
0.5%
0.5%
0.6%
0.9%
2.0%
0.9%
0.3%
0.8%
1.1%
0.5%
1.6%
0.6%
0.2%
0.7%
0.4%
0.3%
0.5%
0.7%
0.6%
0.2%
| 1
.0%
0.4%
| 0
.5%
-0.3
% |
1.0
%
0.4%
| 0
.5%
-0.5
% |
1.0
%
-0.3
% |
0.7
%
Difference between AVG and CG Capital Growth (CG) Source: MSCI, KTI (Finland)
Aust
ralia
2.9%
1.8%
2.1%

R E A L E S T A T E M A R K E T S I Z E 2 0 1 9 / 2 0 R E P O R TM S C I
1 4 Residual Exhibit 9 shows the percentage change in market size estimates from 2018 to 2019, together
with the asset value growth. It should be noted that a residual item remained for many markets when comparing the impact of fundamental drivers and the overall change in estimated market size. The largest residuals were observed for Sweden at 7.0%, New Zealand at 6.7% and Australia at 6.6%. For the Asian markets large residuals were observed for Taiwan at 18.0%, Thailand at 17.0% and China at 8.6%. There are a number of possible reasons for the residual, including:
N E T I N V E S T M E N T D U E T O C A P I T A L E X P E N D I T U R E O N N E W D E V E L O P M E N T S A N D T R A N S A C T I O N A C T I V I T Y
While MSCI measures net investment on data-submitting portfolios, this sample may not necessarily reflect the wider market. In addition, it is not always possible to break down net investment figures sufficiently to avoid double-counting. Given the uncertainty of its composition, net investment is not reported separately in this exercise, instead it is included in the residual.
T R A N S A C T I O N S W I T H N O N - P R O F E S S I O N A L LY M A N A G E D O R G A N I Z A T I O N S
These could arise from the sale of portfolios to small private investors or the acquisition of properties from developers or owners that don’t meet the criteria for the professionally managed real investment portfolios.
Sale and leaseback transactions in which real estate becomes an invested asset, having previously been owner-occupied. This may relate to particular sectors that become investable, such as hotels and healthcare. In some cases tenants may acquire buildings that they previously leased.
T I M E L I N E S S O F R E P O R T I N G
As discussed above, not all portfolios reported end-2019 data in time to be included in this analysis. In 2019, 73.6% of those assets supporting MSCI Global Annual Property Index weights were updated with 2019 data (versus 73.1% in 2018), together with 82.5% for other Asian markets (versus 78.2% in 2018). The remainder were included using the most recently available data, mainly dated to the year 2018.
R E P O R T I N G B Y O W N E R S T A T U S
Lower rates of updating occurred for private investors and other direct asset owners that only release data on their portfolios after the first quarter of the year. In general information on listed companies was updated.
A S S E T Q U A L I T Y
Capital growth for MSCI-measured portfolios may differ from overall market capital growth because of differences in the quality of the underlying assets or sector deviations.
N E W LY I D E N T I F I E D P O R T F O L I O S
Newly identified portfolios that already existed, but were not previously included in market size estimates. These are more common in smaller, more opaque markets.
B E T T E R I N F O R M A T I O N
Newly identified information on portfolios previously included in market size estimates.
E

R E A L E S T A T E M A R K E T S I Z E 2 0 1 9 / 2 0 R E P O R TM S C I
Sweden 14.7%
14.2%
12.2%
10.9%
10.9%
10.5%
10.3%
9.6%
8.6%
8.5%
8.1%
8.1%
7.7%
7.3%
7.2%
7.1%
5.4%
5.4%
5.3%
5.3%
5.2%
5.0%
4.4%
2.6%
0.4%
18.5%
17.5%
11.2%
2.8%
1.5%
0%
-1%
New Zealand
Netherlands
Finland
Czech Republic
Australia
Germany
South Korea
United States
Switzerland
Denmark
Spain
Ireland
Austria
Canada
Norway
Belgium
South Africa
Portugal
France
Poland
Japan
Italy
Hungary
United Kingdom
Taiwan
Thailand
China
Hong Kong
Malaysia
Singapore
Indonesia
-5%
-10
%
5%
0%
10
%
15
%
20
%
-5%
-10
%
5%
0%
10
%
15
%
20
%
MS
CI
GLO
BA
L A
NN
UA
L P
RO
PER
TY
IN
DEX
OT
HER
AS
IA
E X H I B IT 9 : Drivers of Market Size Change, 2019
2019 asset-value growth Residual Total change (in local currency) Source: MSCI, KTI (Finland)

R E A L E S T A T E M A R K E T S I Z E 2 0 1 9 / 2 0 R E P O R TM S C I
1 6 MSCI Market coverage and global transparency
Among the 25 countries in the MSCI Global Annual Property Index, coverage ratios ranged from 63.1% in South Africa to 3.1% Denmark respectively. In aggregate, the 25 countries in the Global Index cover 24.2% of the estimated market by value.
The global coverage of the 32 countries – that comprise of the 25 countries in the MSCI Global Annual Property Index and the seven Asian markets, was 23.2%.
E X H I B IT 1 0: MSCI Global Annual Property Index Coverage of the Professionally Managed Market
New
Zea
land
| 4
8.8%So
uth
Afric
a |
63.1
%
Aust
ralia
| 4
6.3%
Swed
en |
45.
3%
Fran
ce |
44.
8%Sw
itzer
land
| 4
1.7%
Cana
da |
39.
4%Un
ited
King
dom
| 3
7.9%
Norw
ay |
36.0
%So
uth
Kore
a | 3
5.3%
Neth
erla
nds
| 35.
1%
Irelan
d | 3
1.1%
Finla
nd |
29.7
%Po
rtuga
l | 2
9.7%
Japa
n | 2
3.4%
Italy
| 22.5
%
Austria |
21.5%
Spain | 19.4%
Germany |
17.3%
Belgium | 13.7%
Poland | 13.2%
Czech Republic | 13.2%
United States | 12.8%
Denmark | 3.1% MSCI Global Annual Property Index | 24.2%
Singapore | 37.5%
Malaysia | 34.6%
Hong Kong | 24.4%
Thailand | 22.6%
Indonesia | 16.8%
Taiwan | 5.8%
China | 4.4%
Total Global coverage | 23.2%
Hungary | 6.7%
MSCI Property Indexes
MSCI Global Annual Property Index
Other Asia
Total Global coverage
Source: MSCI, KTI (Finland)
32countries
24.2%of estimated market by value is covered by the MSCI Global Annual Property Index
MSCI Real Estate global coverage

R E A L E S T A T E M A R K E T S I Z E 2 0 1 9 / 2 0 R E P O R TM S C I
1 7 In a number of countries, MSCI measures the performance of portfolios not included in the coverage figures in Exhibit 10; these are portfolios that do not fulfill the requirements for index inclusion. This applies, for example, to several portfolios in the United Kingdom that do not have a December-end reporting year. The coverage of more frequent indexes (monthly, quarterly and biannual) available in some countries is lower than that shown in Exhibit 10. This applies to the MSCI UK Monthly Property Index, quarterly indexes in the United States, the Netherlands and the United Kingdom, and biannual indexes in France and Italy. The coverage of these indexes is shown in Appendix 3. MSCI will closely monitor future changes in coverage for Denmark and Hungary, where the coverage level has fallen below 10%, to ensure the representativeness of these indexes
remains sufficient to reflect the overall market. The coverage of China and Taiwan also stands below 10%, indicating that the results for these two countries are not reported in an MSCI national market index fact sheet.
Exhibit 11 plots MSCI’s real estate index coverage against JLL’s Global Real Estate Transparency Index (GRETI), with the country rankings along each axis. The exhibit shows that the more transparent markets generally had a higher MSCI real estate index coverage ratio, with a modest positive correlation. MSCI produced index results for each of JLL’s 27 most transparent ranked markets with the exception of Taiwan . MSCI real estate indexes are published quarterly in each of the eight most transparent markets, with the exception of France, where index results are published biannually.
E X H I B IT 1 1: Country Ranking, MSCI Real Estate Coverage and JLL Global Real Estate Transparency Index
12 of the 25 markets in the MSCI Global Annual Property Index had a coverge of greater than 30.0%.All these markets have been ranked high on the JLL (GRETI). United Kingdom and Australia had a high coverage in the MSCI Global Annual Property Index and the JLL (GRETI). South Africa had the highest coverage in the MSCI Global Annual Property Index and its JLL (GRETI) rank is 24, while the lowest transparency rank among the constituents of the MSCI Global Annual Property Index was for South Korea.
Among the seven Asian countries not included in the MSCI Global Annual Property Index (Unfrozen; Weighting: Market Size), Singapore and Hong Kong have independent indexes and have a JLL transparency rank of 14 and 15 respectively.
1 1.2 5
3 3.7 5
2 2.5
4 5
Mor
e tra
nspa
rent
Highest coverage ratio Lowest coverage ratio
Less
tran
spar
ent
0 5 10
15
20
25
30
35
S O U T H A F R I C A
AU S T R A L I A
S O U T H KO R E A
G E R M A NY
U N IT E D S TAT E SU N IT E D K I N G D O M
JLL
Glo
bal T
rans
pare
ncy
Rank
, 202
0
MSCI Coverage Rank, 2019
Source: MSCI, KTI (Finland), JLL Global Real Estate Transparency Index 2020

R E A L E S T A T E M A R K E T S I Z E 2 0 1 9 / 2 0 R E P O R TM S C I
1 8Co
nclu
sion
The size of the professionally managed global real estate market expanded to $9.6 trillion in 2019 from $8.9 trillion in 2018. MSCI began systematically estimating the size of the professionally managed real estate market in 2004. These estimates underpin the weightings of the MSCI Global Annual Property Index and a range of other multinational indexes, and they provide insights into the coverage of MSCI’s direct property indexes.
Although individual market size estimates have changed from year to year, weightings have proved relatively consistent for each of the 25 countries within the MSCI Global Annual Property Index. At a global level, currency movements marginally increased the size of the global real estate investment market by approximately 0.1% in USD terms, while capital growth and other factors (including new developments) increased total market size.
A U T H O R S :B E R T T E U B E NR A Z I A N E S H AT

R E A L E S T A T E M A R K E T S I Z E 2 0 1 9 / 2 0 R E P O R TM S C I
1 9 Appendix 1: Market Size Estimate MethodologyMSCI defines the real estate investment universe in each national market as the aggregation of real estate assets that meet all of the following conditions:
They are held as investments for the purposes of delivering a mix of income and capital returns.
They are professionally managed for the achievement of these purposes, either by the beneficial owners or by third party management businesses.
They are structured as investment interests within portfolios.
These direct real estate portfolios, managed on behalf of institutional or private investors, are financed via a mix of equity and debt.
The criteria that are adopted for the market size estimates are summarized in Exhibit 12, with further clarifications including:
M O R T G A G E S
Only direct real estate portfolios are included. We have excluded portfolios of mortgages.
I N D I R E C T H O L D I N G S
In order to avoid double-counting, funds of funds are excluded from the analysis along with the indirect investment holdings of all portfolios.
J O I N T V E N T U R E S
In order to avoid double-counting, joint ventures are included as separate holdings, but only with the value of the share of the asset or portfolio included for each holding.
P R I V A T E I N V E S T O R S
The number of direct private investors is enormous, ranging from those holding a single residential unit to some with portfolios of over USD 1 billion. MSCI assumes that any portfolio with a value in excess of USD 100 million is professionally managed. While this figure is somewhat arbitrary, such a threshold is required to compile results. MSCI assumes that the majority of the professionally managed market will be captured by including these larger portfolios.
O T H E R R E A L A S S E T S
This analysis aims to estimate the size of real estate markets globally. For this purpose infrastructure (such as airports, ports and toll roads), timberland and farmland are excluded.
D E V E L O P E R S
Pure development companies are excluded from this analysis as they do not seek an investment return, but investment property under development and construction is included.
I N C LU D E D E XC LU D E D
Insurance and pension funds Small private landlords (< USD 100 million)
Sovereign wealth funds Owner-occupied portfolios (pubs, hotels, hospitals)
Unlisted funds (closed and open end) Timberland, farmland and infrastructure
Traditional estates and charities Mortgage companies
Listed funds Development companies
Large private landlords (> USD 100 million) Funds of funds and indirect holdings (double counting)
Leased office, retail, industrial, residential and other property
Municipal and social housing
Investment property under development
Exhibit 12:
Market Size Estimate Inclusion Criteria
Source: MSCI
R E A L E S T A T E M A R K E T S I Z E 2 0 1 9 / 2 0 R E P O R TM S C I
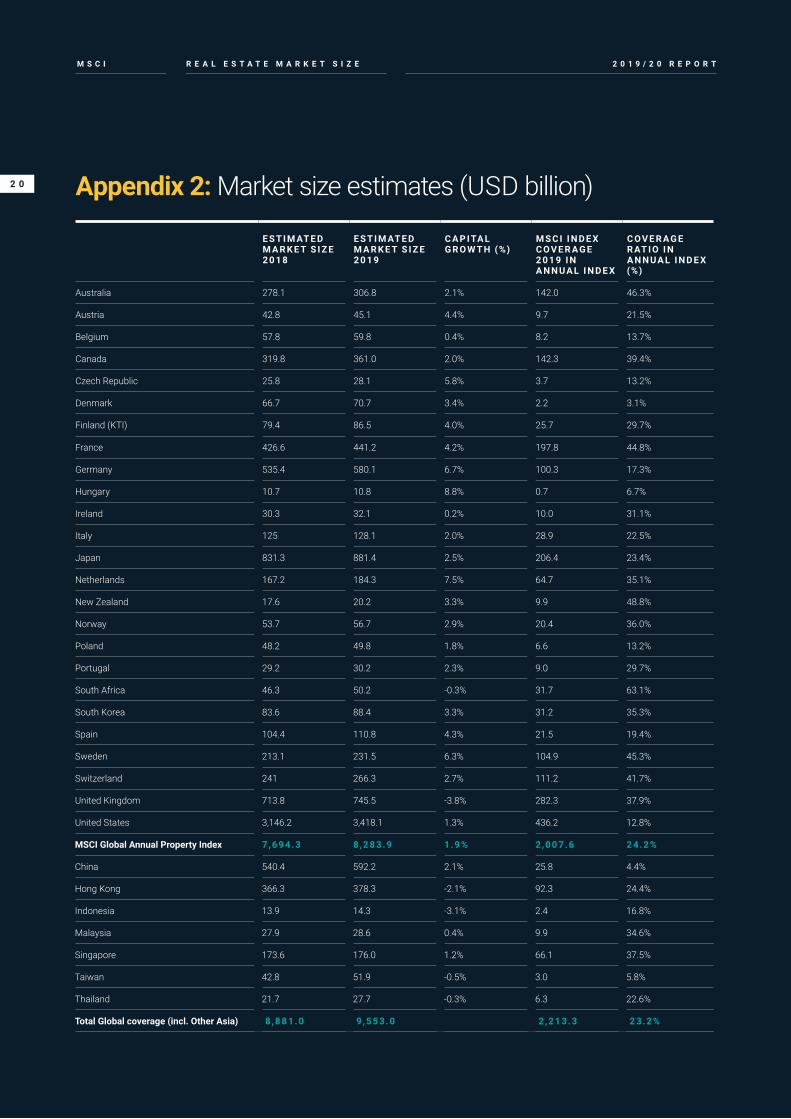
2 0 Appendix 2: Market size estimates (USD billion)
E S T I M AT E D M A R K E T S I Z E 2 0 1 8
E S T I M AT E D M A R K E T S I Z E 2 0 1 9
C A P ITA L G R O W T H (%)
M S C I I N D E X C O V E R A G E 2 0 1 9 I N A N N U A L I N D E X
C O V E R A G E R AT I O I N A N N U A L I N D E X (%)
Australia 278.1 306.8 2.1% 142.0 46.3%
Austria 42.8 45.1 4.4% 9.7 21.5%
Belgium 57.8 59.8 0.4% 8.2 13.7%
Canada 319.8 361.0 2.0% 142.3 39.4%
Czech Republic 25.8 28.1 5.8% 3.7 13.2%
Denmark 66.7 70.7 3.4% 2.2 3.1%
Finland (KTI) 79.4 86.5 4.0% 25.7 29.7%
France 426.6 441.2 4.2% 197.8 44.8%
Germany 535.4 580.1 6.7% 100.3 17.3%
Hungary 10.7 10.8 8.8% 0.7 6.7%
Ireland 30.3 32.1 0.2% 10.0 31.1%
Italy 125 128.1 2.0% 28.9 22.5%
Japan 831.3 881.4 2.5% 206.4 23.4%
Netherlands 167.2 184.3 7.5% 64.7 35.1%
New Zealand 17.6 20.2 3.3% 9.9 48.8%
Norway 53.7 56.7 2.9% 20.4 36.0%
Poland 48.2 49.8 1.8% 6.6 13.2%
Portugal 29.2 30.2 2.3% 9.0 29.7%
South Africa 46.3 50.2 -0.3% 31.7 63.1%
South Korea 83.6 88.4 3.3% 31.2 35.3%
Spain 104.4 110.8 4.3% 21.5 19.4%
Sweden 213.1 231.5 6.3% 104.9 45.3%
Switzerland 241 266.3 2.7% 111.2 41.7%
United Kingdom 713.8 745.5 -3.8% 282.3 37.9%
United States 3,146.2 3,418.1 1.3% 436.2 12.8%
MSCI Global Annual Property Index 7,6 9 4.3 8 ,2 8 3.9 1.9% 2,0 0 7.6 2 4.2%
China 540.4 592.2 2.1% 25.8 4.4%
Hong Kong 366.3 378.3 -2.1% 92.3 24.4%
Indonesia 13.9 14.3 -3.1% 2.4 16.8%
Malaysia 27.9 28.6 0.4% 9.9 34.6%
Singapore 173.6 176.0 1.2% 66.1 37.5%
Taiwan 42.8 51.9 -0.5% 3.0 5.8%
Thailand 21.7 27.7 -0.3% 6.3 22.6%
Total Global coverage (incl. Other Asia) 8 ,881.0 9 ,553.0 2,2 1 3.3 2 3.2%

R E A L E S T A T E M A R K E T S I Z E 2 0 1 9 / 2 0 R E P O R TM S C I
2 1 Appendix 3: Market Coverage for Non-Annual Indexes
E S T I M AT E D M A R K E T S I Z E 2 0 1 9 (U S D B I L L I O N)
M S C I I N D E X C O V E R A G E 2 0 1 9 (U S D B I L L I O N)
C O V E R A G E R AT I O (%)
United Kingdom (Monthly) 745.5 55.6 7.5%
United Kingdom (Quarterly) 745.5 212.6 28.5%
Netherlands (Quarterly) 184.3 47.4 25.7%
United States (Quarterly) 3,418.1 378.7 11.1%
France (Bi-Annual) 441.2 55.4 12.6%
Italy (Bi-Annual) 128.1 17.4 13.6%

R E A L E S T A T E M A R K E T S I Z E 2 0 1 9 / 2 0 R E P O R TM S C I
2 2 A M E R I C A S
Canada + 1 416 687 6284
US + 1 212 804 3900
E U R O P E , M I D D L E E A S T & A F R I C A
UK + 44 20 7336 9200
France + 44 20 7336 4783
Germany + 49 691 3385 900
Italy + 44 20 7336 9684
Spain + 34 93 467 7403
South Africa + 27 11 656 2115
Sweden + 46 8 400 252 30
A S I A P A C I F I C
Australia + 61 2 9033 9300
Hong Kong + 852 2844 9333
Singapore + 65 6826 9339
Japan + 81 3 5211 1455
Cont
act u
s A B O U T M S C I
MSCI is a leading provider of critical decision support tools and services for the global investment community. With over 45 years of expertise in research, data and technology, we power better investment decisions by enabling clients to understand and analyze key drivers of risk and return and confidently build more effective portfolios. We create industry-leading research-enhanced solutions that clients use to gain insight into and improve transparency across the investment process.
msci.com/real-estate
@msci
msci-real-estate
msci.com

R E A L E S T A T E M A R K E T S I Z E 2 0 1 9 / 2 0 R E P O R TM S C I
2 3
N O T I C E A N D D I S C L A I M E R
This document and all of the information contained in it, including without limitation all text, data, graphs, charts (collectively, the “Information”) is the property of MSCI Inc. or its subsidiaries (collectively, “MSCI”), or MSCI’s licensors, direct or indirect suppliers or any third party involved in making or compiling any Information (collectively, with MSCI, the “Information Providers”) and is provided for informational purposes only. The Information may not be modified, reverse-engineered, reproduced or redisseminated in whole or in part without prior written permission from MSCI. All rights in the Information are reserved by MSCI and/or its Information Providers.The Information may not be used to create derivative works or to verify or correct other data or information. For example (but without limitation), the Information may not be used to create indexes, databases, risk models, analytics, software, or in connection with the issuing, offering, sponsoring, managing or marketing of any securities, portfolios, financial products or other investment vehicles utilizing or based on, linked to, tracking or otherwise derived from the Information or any other MSCI data, information, products or services.The user of the Information assumes the entire risk of any use it may make or permit to be made of the Information. NONE OF THE INFORMATION PROVIDERS MAKES ANY EXPRESS OR IMPLIED WARRANTIES OR REPRESENTATIONS WITH RESPECT TO THE INFORMATION (OR THE RESULTS TO BE OBTAINED BY THE USE THEREOF), AND TO THE MAXIMUM EXTENT PERMITTED BY APPLICABLE LAW, EACH INFORMATION PROVIDER EXPRESSLY DISCLAIMS ALL IMPLIED WARRANTIES (INCLUDING, WITHOUT LIMITATION, ANY IMPLIED WARRANTIES OF ORIGINALITY, ACCURACY, TIMELINESS, NON-INFRINGEMENT, COMPLETENESS, MERCHANTABILITY AND FITNESS FOR A PARTICULAR PURPOSE) WITH RESPECT TO ANY OF THE INFORMATION.Without limiting any of the foregoing and to the maximum extent permitted by applicable law, in no event shall any Information Provider have any liability regarding any of the Information for any direct, indirect, special, punitive, consequential (including lost profits) or any other damages even if notified of the possibility of such damages. The foregoing shall not exclude or limit any liability that may not by applicable law be excluded or limited, including without limitation (as applicable), any liability for death or personal injury to the extent that such injury results from the negligence or willful default of itself, its servants, agents or sub-contractors.Information containing any historical information, data or analysis should not be taken as an indication or guarantee of any future performance, analysis, forecast or prediction. Past performance does not guarantee future results.The Information should not be relied on and is not a substitute for the skill, judgment and experience of the user, its management, employees, advisors and/or clients
when making investment and other business decisions. All Information is impersonal and not tailored to the needs of any person, entity or group of persons.None of the Information constitutes an offer to sell (or a solicitation of an offer to buy), any security, financial product or other investment vehicle or any trading strategy.It is not possible to invest directly in an index. Exposure to an asset class or trading strategy or other category represented by an index is only available through third party investable instruments (if any) based on that index. MSCI does not issue, sponsor, endorse, market, offer, review or otherwise express any opinion regarding any fund, ETF, derivative or other security, investment, financial product or trading strategy that is based on, linked to or seeks to provide an investment return related to the performance of any MSCI index (collectively, “Index Linked Investments”). MSCI makes no assurance that any Index Linked Investments will accurately track index performance or provide positive investment returns. MSCI Inc. is not an investment adviser or fiduciary and MSCI makes no representation regarding the advisability of investing in any Index Linked Investments.Index returns do not represent the results of actual trading of investible assets/securities. MSCI maintains and calculates indexes, but does not manage actual assets. Index returns do not reflect payment of any sales charges or fees an investor may pay to purchase the securities underlying the index or Index Linked Investments. The imposition of these fees and charges would cause the performance of an Index Linked Investment to be different than the MSCI index performance.The Information may contain back tested data. Back-tested performance is not actual performance, but is hypothetical. There are frequently material differences between back tested performance results and actual results subsequently achieved by any investment strategy.Constituents of MSCI equity indexes are listed companies, which are included in or excluded from the indexes according to the application of the relevant index methodologies. Accordingly, constituents in MSCI equity indexes may include MSCI Inc., clients of MSCI or suppliers to MSCI. Inclusion of a security within an MSCI index is not a recommendation by MSCI to buy, sell, or hold such security, nor is it considered to be investment advice.Data and information produced by various affiliates of MSCI Inc., including MSCI ESG Research LLC and Barra LLC, may be used in calculating certain MSCI indexes. More information can be found in the relevant index methodologies on www.msci.com.MSCI receives compensation in connection with licensing its indexes to third parties. MSCI Inc.’s revenue includes fees based on assets in Index Linked Investments. Information can be found in MSCI Inc.’s company filings on the Investor Relations section of www.msci.com.
MSCI ESG Research LLC is a Registered Investment Adviser under the Investment Advisers Act of 1940 and a subsidiary of MSCI Inc. Except with respect to any applicable products or services from MSCI ESG Research, neither MSCI nor any of its products or services recommends, endorses, approves or otherwise expresses any opinion regarding any issuer, securities, financial products or instruments or trading strategies and MSCI’s products or services are not intended to constitute investment advice or a recommendation to make (or refrain from making) any kind of investment decision and may not be relied on as such. Issuers mentioned or included in any MSCI ESG Research materials may include MSCI Inc., clients of MSCI or suppliers to MSCI, and may also purchase research or other products or services from MSCI ESG Research. MSCI ESG Research materials, including materials utilized in any MSCI ESG Indexes or other products, have not been submitted to, nor received approval from, the United States Securities and Exchange Commission or any other regulatory body.Any use of or access to products, services or information of MSCI requires a license from MSCI. MSCI, Barra, RiskMetrics, IPD and other MSCI brands and product names are the trademarks, service marks, or registered trademarks of MSCI or its subsidiaries in the United States and other jurisdictions. The Global Industry Classification Standard (GICS) was developed by and is the exclusive property of MSCI and Standard & Poor’s. “Global Industry Classification Standard (GICS)” is a service mark of MSCI and Standard & Poor’s.MIFID2/MIFIR notice: MSCI ESG Research LLC does not distribute or act as an intermediary for financial instruments or structured deposits, nor does it deal on its own account, provide execution services for others or manage client accounts. No MSCI ESG Research product or service supports, promotes or is intended to support or promote any such activity. MSCI ESG Research is an independent provider of ESG data, reports and ratings based on published methodologies and available to clients on a subscription basis. We do not provide custom or one-off ratings or recommendations of securities or other financial instruments upon request. Privacy notice: For information about how MSCI collects and uses personal data, please refer to our Privacy Notice at https://www.msci.com/privacy-pledge.NO REGULATED USE OF ANY MSCI PRIVATE REAL ASSETS INDEXES IN ANY JURISDICTION IS PERMITTED WITHOUT MSCI’S EXPRESS WRITTEN AUTHORIZATION. THE PROCESS FOR APPLYING FOR MSCI’S EXPRESS WRITTEN AUTHORIZATION CAN BE FOUND ON THE INDEX REGULATION PAGE OF MSCI’S WEBSITE AT: https://www.msci.com/index-regulation.