Embed Size (px)
Citation preview

Real Estate Market
Participants’ Survey
Fall 2017

Real Estate Market Participant Survey Results
In Fall 2017, the VCU Kornblau Real Estate Program in association with Knight Dorin and Rountrey conducted
a market participants survey using principles of anticipation to predict real estate market trends. This is a
compilation of those results.
About
Since 1992, Knight, Dorin & Rountrey has surveyed the Central Virginia commercial real estate market to learn of market participants’ sentiment. In Fall 2017, the Kornblau Real Estate Program teamed up with Knight, Dorin & Rountrey to produce this semi-annual survey. This is our first joint study. The study’s goal is to provide a diverse perspective of the real estate market for a more universal analysis. Eventually we hope to expand the survey’s scope beyond the Central Virginia area.
Parameters
The study was administered through email via Survey Monkey. Participation in the study was voluntary and
participants were encouraged to skip inapplicable questions. The 24 questions asked about the respondents’
future expectations for various sectors of the real estate market.
Scope
The survey results were collected in September 2017 and had 769 respondents from various real estate
backgrounds.
Feedback
We received feedback regarding the questions we asked and hope to improve our survey parameters and
questions in future surveys.
If you would like to participate in the next semi-annual survey, please contact:
Robert Taylor Executive Director Kornblau Real Estate Program VCU School of Business (804) 828-3169 [email protected]
Edward G. Knight President Knight Dorin & Rountrey (804) 427-6001 [email protected]

Summary
769 Respondents from diverse backgrounds.
Most market participants feel that we are in the growth phase of the real estate market, with the
exception of office and retail—most participants feel those sectors are in the maturity phase.
Respondents are cautiously optimistic
about market expectations for the
next six months.
Retail is seeing a negative trend
regarding market growth.
Financing for
Multi-family is currently more
abundant than other property types.

Demographics
The first few questions gathered demographic information. As illustrated in the graphs, respondents are
from a variety of backgrounds in multiple sectors—including private, commercial, and corporate—as well
as other levels and disciplines—including property management, insurance, law, and construction.
Which of the following best describes your principle industry? n=768
Which of the following best describes your job function? n=754

(Participants who answered “Other” predominately work in Virginia or somewhere in the Mid-Atlantic.)
What is your primary market? n=762
OUTLOOK
Expectations for the real estate market over the next six months remain the same. But the outlook leans
more positively towards “better,” with the exception of Retail, which had mixed results and leans more
negatively.
What are your real estate market expectations in the next six months as compared to the previous six months?
n=746

REAL ESTATE MARKET CYCLE
Overall, most sectors seem to be in the growth stage, with Industrial and Multi-family transitioning to the
mature stage. Office is in the mature stage, while Retail again shows a downward slope, with about equal
expectations in the mature and recession stages.
Recovery Growth Mature Recession Total
Respondents
Hospitality 9.89% 43.10% 42.35% 4.66% 536
Industrial 14.92% 51.57% 29.10% 4.42% 543
Multi-family 2.79% 49.39% 44.85% 2.97% 573
Office 16.34% 25.31% 47.22% 11.13% 557
Residential 9.40% 62.39% 25.81% 2.39% 585
Retail 9.09% 19.27% 37.45% 34.18% 550
Please select the stage of the real estate market cycle you think currently applies for each property type.
Respondents were able to select an answer for multiple sectors which applied to them,
but did not necessarily have to answer all. This resulted in a total of 630 responses.
ENTREPRENEURIAL INCENTIVE
Total hard and soft costs (land and improvements) averages are within +/- one percent of the overall
average (14%).
Regarding new development ventures, what is your current minimum acceptable level of
anticipated entrepreneurial profit (unleveraged) as expressed as a percentage?
n=305
Central Virginia Hampton Roads NOVA Southwest All
Range Range Range Range Range
Average Average Average Average Average
Total hard and soft costs
(land and improvements)
8% - 20% 6% - 20% 8% - 20% 8% - 20% 8% - 20%
14% 13% 13% 12% 14%

Relative to a residential subdivision, what is the value of an average unimproved lot as a percentage of the total price of the finished home package in the following price ranges?
n=220
LAND VALUE ALLOCATION
When compared to the overall average, starter housing has a slightly higher expectation in the Hampton Roads and NOVA regions (+2% and 4%, respectively), while move-up housing has a slightly lower expectation in the Southwest region (-3%).
LAND LEASE RATES
NOVA has the lowest averages in all categories when compared to the other areas. Hampton Roads has the
highest averages.
Central Virginia Hampton Roads NOVA Southwest All
Range Range Range Range Range
Average Average Average Average Average
Subordinated Lease - Cap Rate (with flat rent)
4.5% - 8.0% 5.5% - 8.0% 4.0% - 6.0% 4.0% - 11.0% 4.5% - 10.0%
6.2% 6.9% 5.4% 6.8% 7.0%
Subordinated Lease - Cap Rate (with rent escalations)
4.5% - 8.0% 5.0% - 8.0% 3.0% - 5.0% 5.0% - 10.0% 4.5% - 9.5%
6.0% 6.7% 4.5% 6.5% 6.6%
Unsubordinated Lease - Cap Rate (with flat rent)
5.0% - 9.0% 6.0% - 10.0% 4.5% - 8.0% 6.0% - 9.0% 5.0% - 10.0%
7.1% 8.2% 6.5% 8.0% 7.4%
Unsubordinated Lease - Cap Rate (with rent escalations)
4.5% - 8.5% 6.0% - 10.0% 4.0% - 7.0% 6.0% - 8.0% 4.5% - 9.5%
6.2% 7.9% 5.5% 7.5% 6.9%
For typical long-term (20 year plus) net commercial land leases, particularly retail outparcels, what return is expected relative to land value? (ex: $500,000 land value, $50,000 annual rent = 10 percent return/cap rate)
n=47
Lot Price Ratios
Central Virginia Hampton Roads NOVA Southwest All
Range Range Range Range Range
Average Average Average Average Average
Starter housing 15% - 25% 15% - 35% 15% - 35% 15% - 30% 15% - 30%
20% 23% 25% 21% 21%
Move-up housing 20% - 30% 20% - 30% 20% - 30% 15% - 30% 20% - 30%
23% 23% 24% 21% 24%
Luxury 20% - 30% 20% - 30% 20% - 30% 20% - 35% 20% - 30%
24% 26% 24% 27% 24%
High-end luxury housing 15% - 35% 15% - 35% 15% - 35% 15% - 35% 15% - 35%
25% 27% 26% 26% 25%
Townhouses 15% - 25% 15% - 25% 15% - 25% 15% - 30% 15% - 30%
20% 20% 21% 20% 21%

COST OF SALE
What is your estimated cost of sale (commissions, legal and recording fees, etc.) of most types of commercial real estate expressed as a percentage of the total sales price for the following value ranges?
n=88
AVAILABILITY OF MORTGAGE FINANCING
All sectors show high levels of adequate financing availability. Multi-family was split almost equally between
adequate and abundant.
Please rate your experience regarding the current availability of mortgage financing for the following property types.
Respondents were able to select an answer for multiple sectors which applied to them, but did not necessarily have to answer all. This resulted in a total of 174 responses.
Inadequate Adequate Abundant Total
Respondents
Hospitality 31.07% 61.17% 7.77% 103
Industrial 14.68% 64.22% 21.10% 109
Multi-family 12.03% 43.61% 44.36% 133
Office 18.75% 66.07% 15.18% 112
Residential (A&D) 15.79% 63.91% 20.30% 133
Retail 25.45% 62.73% 11.82% 110
Central Virginia Hampton Roads NOVA Southwest All
Range Range Range Range Range
Average Average Average Average Average
Less than $1 million 4.5% - 6.5% 5.0% - 10.0% 3.0% - 6.0% 4.0% - 6.4% 4.7% - 6.8%
5.4% 7.4% 4.8% 5.2% 5.8%
$1 million to $5 million 4.0% - 5.5% 4.0% - 8.0% 3.0% - 5.5% 3.3% - 5.4% 4.1% - 5.7%
4.6% 6.1% 4.4% 4.3% 4.9%
$5 million to $15 million 3.0% - 4.0% 2.0% - 6.0% 2.0% - 4.5% 2.3% - 4.3% 2.5% - 4.4%
3.5% 3.8% 3.3% 3.3% 3.4%
Over $15 million 1.5% - 3.0% 1.0% - 5.0% 2.0% - 3.5% 1.8% - 4.0% 1.5% - 2.5%
2.3% 2.6% 2.6% 2.9% 2.0%
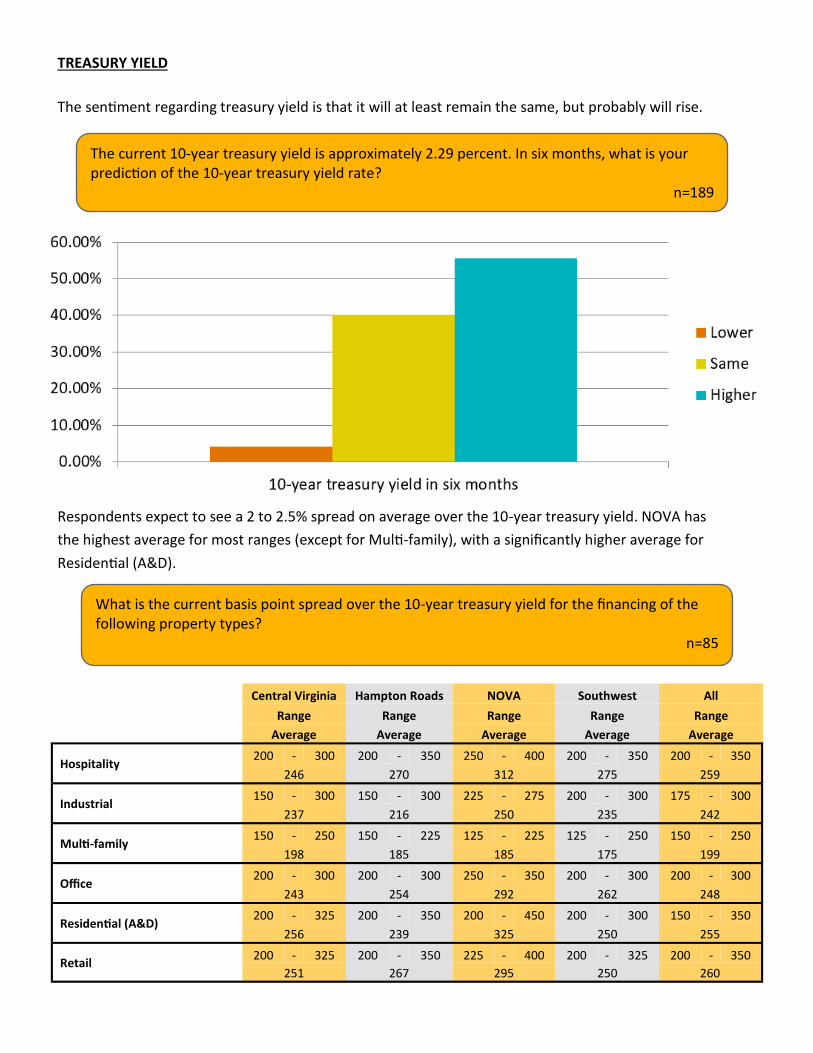
TREASURY YIELD
The sentiment regarding treasury yield is that it will at least remain the same, but probably will rise.
Central Virginia Hampton Roads NOVA Southwest All
Range Range Range Range Range
Average Average Average Average Average
Hospitality 200 - 300 200 - 350 250 - 400 200 - 350 200 - 350
246 270 312 275 259
Industrial 150 - 300 150 - 300 225 - 275 200 - 300 175 - 300
237 216 250 235 242
Multi-family 150 - 250 150 - 225 125 - 225 125 - 250 150 - 250
198 185 185 175 199
Office 200 - 300 200 - 300 250 - 350 200 - 300 200 - 300
243 254 292 262 248
Residential (A&D) 200 - 325 200 - 350 200 - 450 200 - 300 150 - 350
256 239 325 250 255
Retail 200 - 325 200 - 350 225 - 400 200 - 325 200 - 350
251 267 295 250 260
Respondents expect to see a 2 to 2.5% spread on average over the 10-year treasury yield. NOVA has
the highest average for most ranges (except for Multi-family), with a significantly higher average for
Residential (A&D).
What is the current basis point spread over the 10-year treasury yield for the financing of the following property types?
n=85
The current 10-year treasury yield is approximately 2.29 percent. In six months, what is your prediction of the 10-year treasury yield rate?
n=189

Real Estate Liquidity – Marketing Period
Less
than six
months
Six to 12
months
Twelve
to 24
months
Over 24
months
Less
than six
months
Six to 12
months
Twelve
to 24
months
Over 24
months
Less
than six
months
Six to 12
months
Twelve
to 24
months
Over 24
months
Less
than six
months
Six to 12
months
Twelve
to 24
months
Over 24
months
Less
than six
months
Six to 12
months
Twelve
to 24
months
Over 24
months
Retail:
Free-standing store41% 43% 15% 2% 52% 26% 19% 4% 43% 36% 21% 0% 30% 70% 0% 0% 38% 40% 18% 3%
Unanchored shopping center15% 41% 30% 15% 15% 48% 19% 19% 21% 50% 29% 0% 10% 70% 10% 10% 14% 39% 30% 17%
Anchored neighborhood
shopping center 37% 41% 20% 2% 43% 32% 21% 4% 57% 43% 0% 0% 40% 30% 20% 10% 33% 40% 23% 5%
Community and power
shopping center 31% 40% 27% 2% 27% 42% 31% 0% 62% 23% 15% 0% 40% 10% 30% 20% 25% 42% 27% 6%
Regional shopping center -
poorly leased 4% 19% 35% 42% 8% 15% 42% 35% 8% 15% 31% 46% 10% 10% 20% 60% 2% 16% 39% 43%
Regional shopping center -
well leased 29% 50% 19% 2% 28% 64% 8% 0% 46% 38% 8% 8% 20% 30% 40% 10% 24% 52% 18% 5%
Multi-Family:
Apartment complex (less than
120 units) 62% 31% 7% 0% 61% 32% 6% 0% 71% 21% 7% 0% 55% 45% 0% 0% 57% 34% 9% 0%
Apartment complex (more than
120 units) 59% 29% 11% 1% 57% 30% 10% 3% 79% 7% 14% 0% 45% 45% 9% 0% 55% 30% 12% 3%
Office:
Large office building – well
leased 38% 49% 11% 2% 32% 44% 12% 12% 40% 50% 10% 0% 29% 57% 14% 0% 31% 53% 12% 5%
Large office building – poorly
leased 5% 33% 35% 27% 4% 24% 40% 32% 10% 10% 50% 30% 14% 14% 57% 14% 5% 26% 41% 28%
Small office building (less than
20,000 SF) – well leased 36% 56% 7% 0% 40% 52% 8% 0% 30% 60% 10% 0% 14% 71% 14% 0% 34% 53% 13% 0%
Small office building (less than
20,000 SF) – poorly leased 18% 27% 29% 25% 4% 32% 52% 12% 10% 20% 50% 20% 14% 29% 43% 14% 13% 26% 39% 22%
Industrial:
Small single user
office/warehouse buildings 46% 42% 12% 0% 39% 35% 26% 0% 50% 50% 0% 0% 17% 83% 0% 0% 43% 41% 16% 0%
Multi-tenant flex/bulk
distribution 42% 43% 11% 4% 25% 42% 21% 13% 50% 40% 10% 0% 33% 17% 50% 0% 31% 43% 20% 5%
Vacant Land:
Single-family residential
development 21% 36% 34% 9% 21% 39% 32% 7% 27% 45% 9% 18% 14% 29% 0% 57% 23% 34% 30% 13%
Multi-family residential
development 26% 48% 23% 3% 35% 42% 19% 4% 27% 64% 9% 0% 13% 63% 13% 13% 29% 44% 22% 5%
Retail4% 22% 61% 14% 15% 27% 35% 23% 8% 33% 50% 8% 0% 38% 50% 13% 8% 22% 51% 19%
Office4% 20% 50% 26% 17% 13% 46% 25% 11% 33% 33% 22% 0% 50% 33% 17% 6% 21% 43% 30%
Industrial11% 32% 32% 25% 25% 29% 25% 21% 33% 33% 33% 0% 20% 20% 20% 40% 13% 33% 33% 22%
Special Purpose Properties:
Banks, historic, churches, etc.5% 37% 33% 25% 4% 38% 38% 19% 8% 67% 8% 17% 14% 43% 29% 14% 3% 38% 34% 25%
Central Virginia Hampton Roads NOVA Southwest All
Please select the most appropriate block regarding your opinion of reasonable selling/liquidity time (from the date of listing to the date of closing) relative to the following property types. This assumes the property is realistically priced to sell by a reasonably motivated seller.
n=88-120
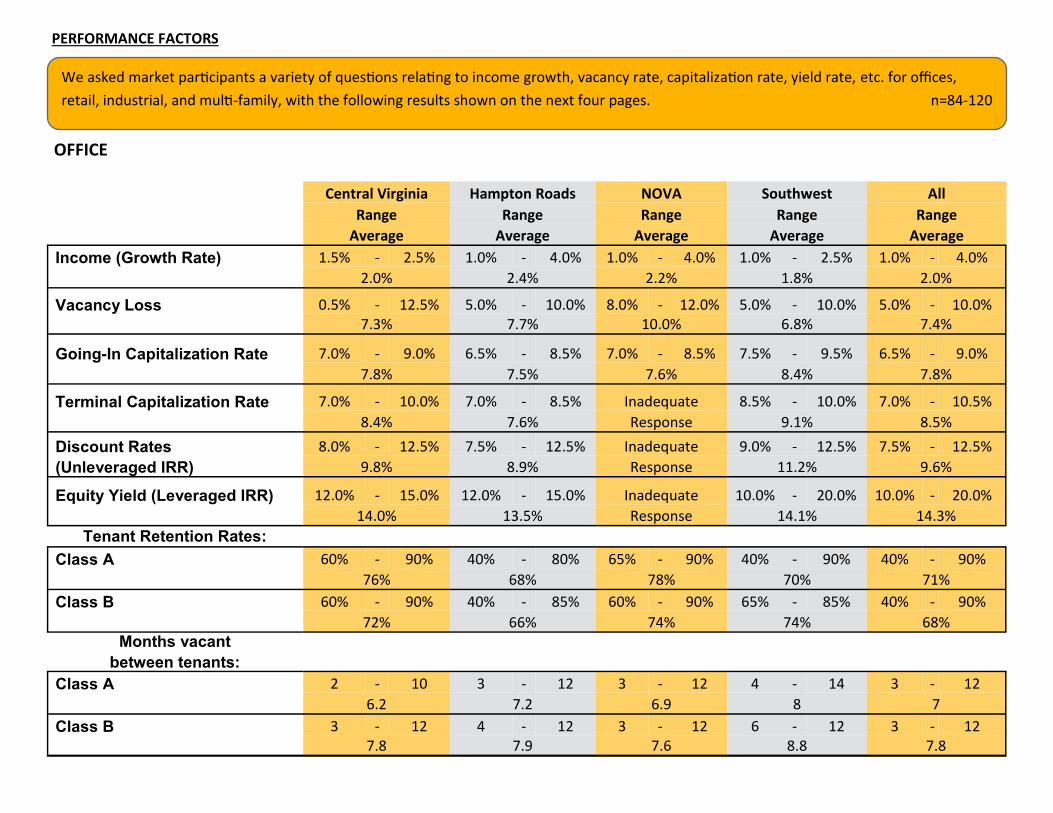
PERFORMANCE FACTORS
We asked market participants a variety of questions relating to income growth, vacancy rate, capitalization rate, yield rate, etc. for offices,
retail, industrial, and multi-family, with the following results shown on the next four pages. n=84-120
OFFICE
Central Virginia Hampton Roads NOVA Southwest All
Range Range Range Range Range
Average Average Average Average Average
Income (Growth Rate) 1.5% - 2.5% 1.0% - 4.0% 1.0% - 4.0% 1.0% - 2.5% 1.0% - 4.0%
2.0% 2.4% 2.2% 1.8% 2.0%
Vacancy Loss 0.5% - 12.5% 5.0% - 10.0% 8.0% - 12.0% 5.0% - 10.0% 5.0% - 10.0%
7.3% 7.7% 10.0% 6.8% 7.4%
Going-In Capitalization Rate 7.0% - 9.0% 6.5% - 8.5% 7.0% - 8.5% 7.5% - 9.5% 6.5% - 9.0%
7.8% 7.5% 7.6% 8.4% 7.8%
Terminal Capitalization Rate 7.0% - 10.0% 7.0% - 8.5% Inadequate 8.5% - 10.0% 7.0% - 10.5%
8.4% 7.6% Response 9.1% 8.5%
Discount Rates 8.0% - 12.5% 7.5% - 12.5% Inadequate 9.0% - 12.5% 7.5% - 12.5%
(Unleveraged IRR) 9.8% 8.9% Response 11.2% 9.6%
Equity Yield (Leveraged IRR) 12.0% - 15.0% 12.0% - 15.0% Inadequate 10.0% - 20.0% 10.0% - 20.0%
14.0% 13.5% Response 14.1% 14.3%
Tenant Retention Rates:
Class A 60% - 90% 40% - 80% 65% - 90% 40% - 90% 40% - 90%
76% 68% 78% 70% 71%
Class B 60% - 90% 40% - 85% 60% - 90% 65% - 85% 40% - 90%
72% 66% 74% 74% 68% Months vacant
between tenants:
Class A 2 - 10 3 - 12 3 - 12 4 - 14 3 - 12
6.2 7.2 6.9 8 7
Class B 3 - 12 4 - 12 3 - 12 6 - 12 3 - 12 7.8 7.9 7.6 8.8 7.8

RETAIL
Central Virginia Hampton Roads NOVA Southwest All
Range Range Range Range Range
Average Average Average Average Average
Income (Growth Rate) 1.0% - 2.5% 1.0% - 4.0% 1.0% - 3.0% 1.0% - 2.0% 1.0% - 4.0%
1.6% 2.1% 1.8% 1.4% 1.9%
Vacancy Loss 2.5% - 15.0% 5.0% - 10.0% 5.0% - 10.0% 2.0% - 8.0% 5.0% - 10.0%
7.4% 7.7% 6.0% 5.4% 7.3.%
Going-In Capitalization Rate 6.0% - 9.0% 6.5% - 8.5% 6.5% - 7.5% 7.0% - 9.5% 6.0% - 9.0%
7.5% 7.5% 7.0% 7.9% 7.5%
Terminal Capitalization Rate 7.5% - 10.0% 7.5% - 9.0% 7.0% - 9.0% 8.0% - 10.0% 7.0% - 10.5%
8.5% 8.3% 8.5% 8.5% 8.6%
Discount Rates (Unleveraged 7.5% - 13.0% 8.5% - 12.0% Inadequate 8.5% - 12.0% 7.5% - 12.0%
IRR) 10.4% 9.4% Response 10.6% 9.8%
Equity Yield (Leveraged IRR) 13.0% - 17.5% 12.5% - 14.0% Inadequate 10.0% - 17.0% 8.5% - 20.0%
15.4% 13.2% Response 13.0% 13.3%
Tenant Retention Rates:
Neighborhood 40% - 90% 40% - 90% 40% - 90% 40% - 90% 40% - 90%
68% 68% 68% 70% 66%
Community 40% - 90% 40% - 90% 60% - 90% 65% - 90% 40% - 90%
68% 69% 79% 80% 68%
Months vacant
between tenants:
Neighborhood 4 - 12 6 - 12 6 - 24 6 - 24 4 - 12 7.8 8.1 12.1 12.1 8.3
Community 4 - 12 4 - 12 6 - 14 4 - 20 4 - 12
7.8 7.6 9.8 11.5 8.1
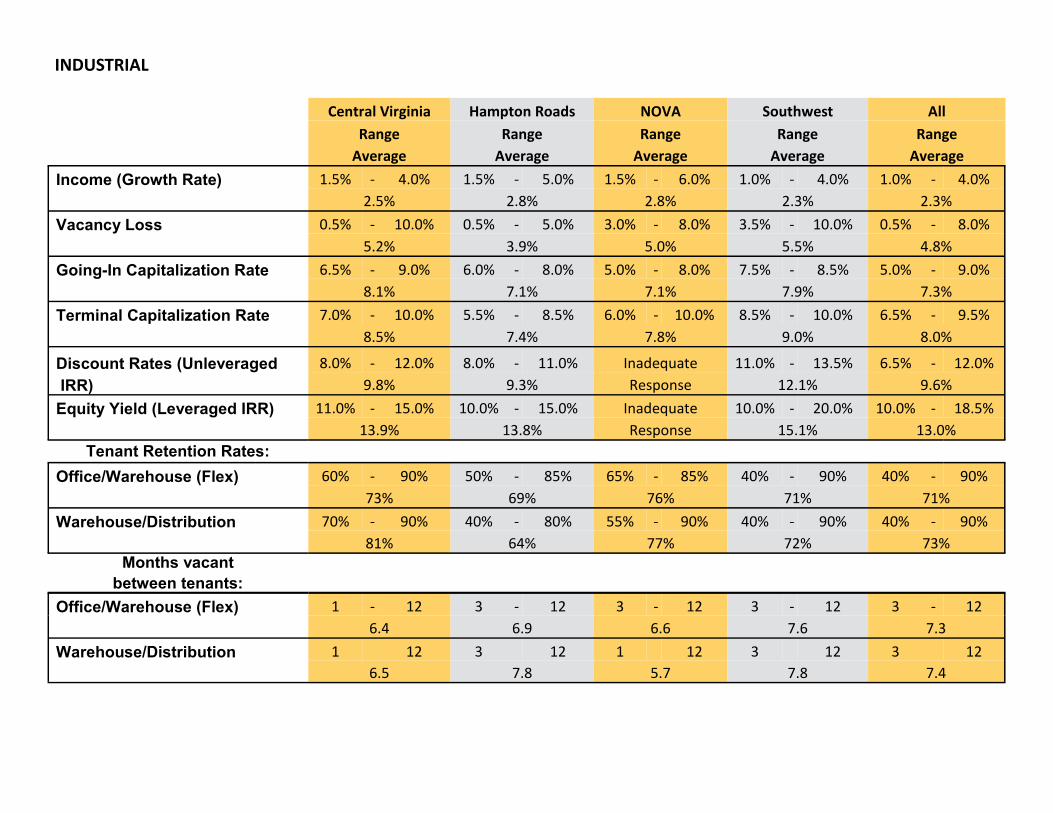
INDUSTRIAL
Central Virginia Hampton Roads NOVA Southwest All
Range Range Range Range Range
Average Average Average Average Average
Income (Growth Rate) 1.5% - 4.0% 1.5% - 5.0% 1.5% - 6.0% 1.0% - 4.0% 1.0% - 4.0%
2.5% 2.8% 2.8% 2.3% 2.3%
Vacancy Loss 0.5% - 10.0% 0.5% - 5.0% 3.0% - 8.0% 3.5% - 10.0% 0.5% - 8.0%
5.2% 3.9% 5.0% 5.5% 4.8%
Going-In Capitalization Rate 6.5% - 9.0% 6.0% - 8.0% 5.0% - 8.0% 7.5% - 8.5% 5.0% - 9.0%
8.1% 7.1% 7.1% 7.9% 7.3%
Terminal Capitalization Rate 7.0% - 10.0% 5.5% - 8.5% 6.0% - 10.0% 8.5% - 10.0% 6.5% - 9.5%
8.5% 7.4% 7.8% 9.0% 8.0%
Discount Rates (Unleveraged 8.0% - 12.0% 8.0% - 11.0% Inadequate 11.0% - 13.5% 6.5% - 12.0%
IRR) 9.8% 9.3% Response 12.1% 9.6%
Equity Yield (Leveraged IRR) 11.0% - 15.0% 10.0% - 15.0% Inadequate 10.0% - 20.0% 10.0% - 18.5%
13.9% 13.8% Response 15.1% 13.0%
Tenant Retention Rates:
Office/Warehouse (Flex) 60% - 90% 50% - 85% 65% - 85% 40% - 90% 40% - 90%
73% 69% 76% 71% 71%
Warehouse/Distribution 70% - 90% 40% - 80% 55% - 90% 40% - 90% 40% - 90%
81% 64% 77% 72% 73% Months vacant
between tenants:
Office/Warehouse (Flex) 1 - 12 3 - 12 3 - 12 3 - 12 3 - 12
6.4 6.9 6.6 7.6 7.3
Warehouse/Distribution 1 12 3 12 1 12 3 12 3 12
6.5 7.8 5.7 7.8 7.4

APARTMENTS
Central Virginia Hampton Roads NOVA Southwest All
Range Range Range Range Range
Average Average Average Average Average
Income (Growth Rate) 2.0% - 4.0% 2.0% - 4.0% 1.5% - 3.0% 1.0% - 3.0% 1.0% - 4.0%
2.7% 2.7% 2.6% 2.2% 2.5%
Vacancy Loss 0.5% - 7.0% 0.0% - 7.0% 0.5% - 5.0% 0.0% - 6.0% 0.5% - 7.0%
3.9% 3.8% 3.5% 3.2% 4.1%
Going-In Capitalization Rate 5.5% - 8.0% 5.5% - 6.5% 4.5% - 6.0% 4.5% - 7.0% 4.5% - 8.0%
6.4% 5.9% 5.5% 5.9% 6.2%
Terminal Capitalization Rate 6.0% - 8.0% 5.0% - 7.5% 5.0% - 7.5% 6.0% - 8.0% 5.0% - 8.5%
6.8% 6.4% 6.5% 6.8% 6.7%
Discount Rates (Unleveraged 7.0% - 12.0% 7.0% - 12.0% Inadequate 6.5% - 12.5% 6.0% - 12.0%
IRR) 9.4% 9.0% Response 10.1% 8.7%
Equity Yield (Leveraged IRR) 10.0% - 15.0% 10.0% - 15.0% Inadequate 10.0% - 18.0% 8.5% - 16.0%
12.8% 12.8% Response 13.6% 12.3%
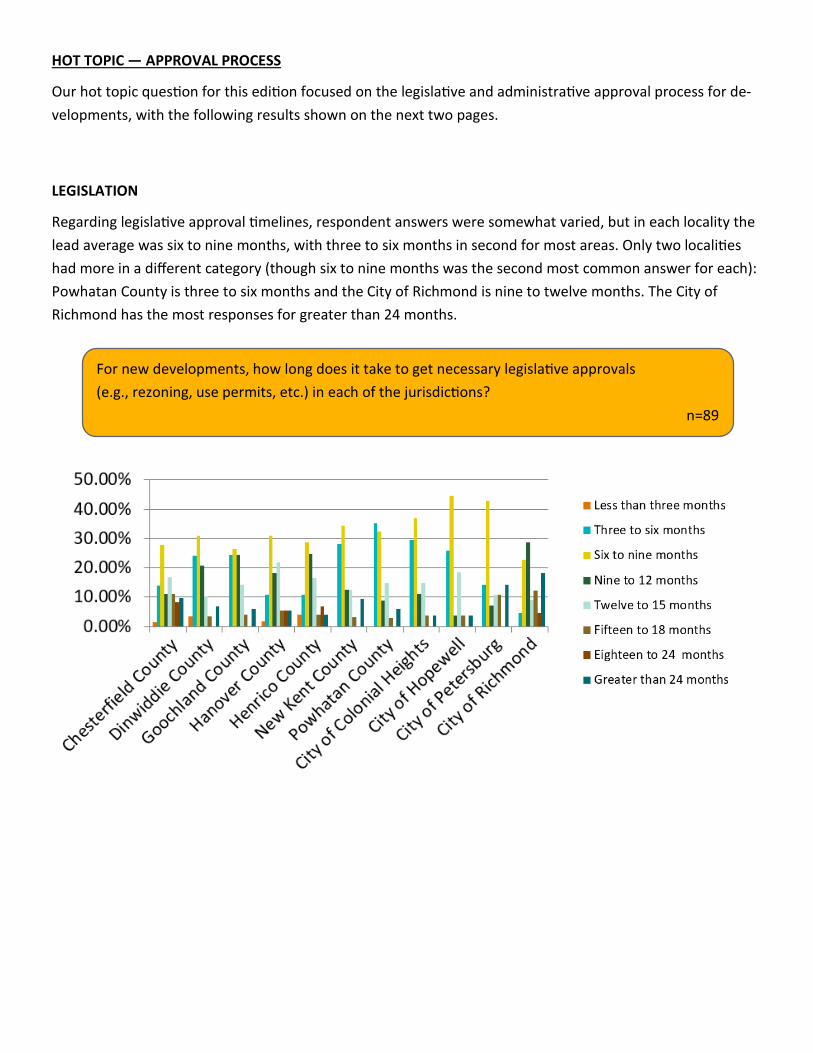
LEGISLATION
Regarding legislative approval timelines, respondent answers were somewhat varied, but in each locality the
lead average was six to nine months, with three to six months in second for most areas. Only two localities
had more in a different category (though six to nine months was the second most common answer for each):
Powhatan County is three to six months and the City of Richmond is nine to twelve months. The City of
Richmond has the most responses for greater than 24 months.
For new developments, how long does it take to get necessary legislative approvals
(e.g., rezoning, use permits, etc.) in each of the jurisdictions?
n=89
HOT TOPIC — APPROVAL PROCESS
Our hot topic question for this edition focused on the legislative and administrative approval process for de-
velopments, with the following results shown on the next two pages.
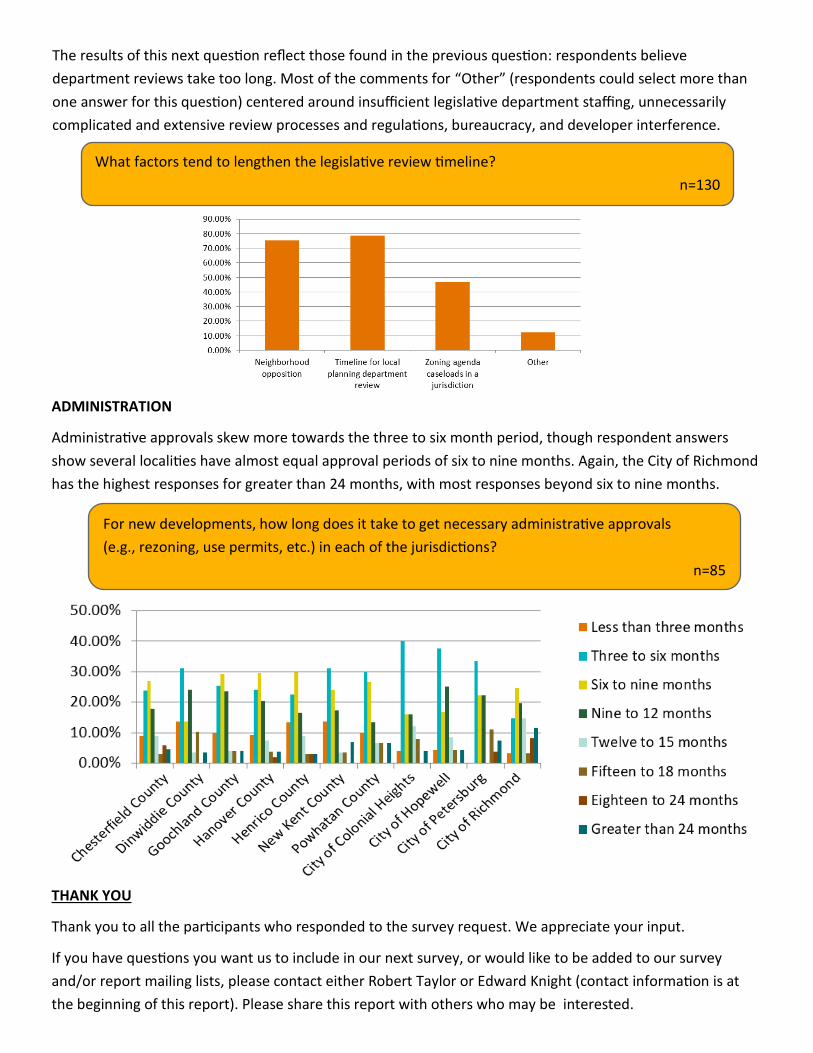
ADMINISTRATION
Administrative approvals skew more towards the three to six month period, though respondent answers
show several localities have almost equal approval periods of six to nine months. Again, the City of Richmond
has the highest responses for greater than 24 months, with most responses beyond six to nine months.
THANK YOU
Thank you to all the participants who responded to the survey request. We appreciate your input.
If you have questions you want us to include in our next survey, or would like to be added to our survey
and/or report mailing lists, please contact either Robert Taylor or Edward Knight (contact information is at
the beginning of this report). Please share this report with others who may be interested.
The results of this next question reflect those found in the previous question: respondents believe
department reviews take too long. Most of the comments for “Other” (respondents could select more than
one answer for this question) centered around insufficient legislative department staffing, unnecessarily
complicated and extensive review processes and regulations, bureaucracy, and developer interference.
What factors tend to lengthen the legislative review timeline?
n=130
For new developments, how long does it take to get necessary administrative approvals
(e.g., rezoning, use permits, etc.) in each of the jurisdictions?
n=85