Embed Size (px)
Citation preview
Dept. of Real Estate Management Master of Science Thesis no. 97
Div. of Building and Real Estate Economics
Real Estate Discounted Cash Flow Model
Development and Design
- The process of developing a new DCF model at a
multinational real estate consultancy
Authors: Supervisor:
Ahmed Fetibegovic Han-Suck Song
Adam Nilsson
Stockholm 2011
Master of Science thesis
Title Real Estate cash-flow model development and
design – The process of developing a new DCF
model at a multinational Real Estate consultancy
Authors Ahmed Fetibegovic, Adam Nilsson
Department Dep. of Real Estate Management
Div. of Building and Real Estate Economics
Thesis number 97
Supervisor Han-Suck Song
Keyword Discounted Cash Flow, Jones Lang LaSalle,
Valuation Model, Spreadsheet, Appraisal
Abstract
Due to increasing skill and awareness of overall functions in programs such as Excel, an
increasing number of analysts at real estate firms and consultancies have started developing
“desktop” versions of valuation models used for professional appraisal of property value. Due
to personal preferences, differences in schools and professional backgrounds, these so called
desktop models vary in quality, robustness, accuracy, design and user friendliness.
Professional software suites are not suitable either, as they are expensive, hard to learn, hard
to adapt to specific needs of the business, outdated design and need of additional IT resources.
At a multinational Real Estate consultancy such as Jones Lang LaSalle, requirements on tools
used for professional opinions on questions as important as property value, are rigorous.
Therefore, decision was made to develop a new DCF model which would be closely
monitored by management and have a prismatic approach meaning that the model would
satisfy the needs of more than one division at Jones Lang LaSalle. When reviewing existing
models and practices at the company, the result became a tailored DCF valuation model that
was focused on increasing efficiency of appraisers at Jones Lang LaSalle. Aside from being
robust and technically sophisticated, the result also suited the specific needs of Jones Lang
LaSalle in terms of features and user interface. Development of the model involved several
divisions to ensure that the needs were met for Research & Valuation, Capital Markets,
Corporate Solutions and Asset Management at Jones Lang LaSalle.
Acknowledgement
This Master of Science Thesis has been accomplished at the Division of Real Estate
Management at the Royal Institute of Technology in Stockholm, Sweden, during the spring of
2011.
We would like to acknowledge our supervisor Mr. Han-Suck Song for giving us sufficient
room to let us find our own path, achieving a superior DCF model for Jones Lang LaSalle.
This task would have been impossible if this freedom was not granted by him, as very little
material was available for evaluation along the way.
We would also like to thank Mrs. Åsa Linder, head of Research & Valuation at Jones Lang
LaSalle. Without her dedication and patience, we would have stranded with this project at the
very beginning. Mrs. Åsa Linder had the necessary pedagogic approach with the at times very
complex definitions and requirements of high-end valuation practices. Her experience of real
estate appraisal laid the foundation for the final product, which has been received better than
we could ever expect.
There is no doubt that this exercise will aid us in our coming careers as professionals in the
real estate industry.
Ahmed Fetibegovic and Adam Nilsson
Stockholm, 10/06/2011
Contents
1. Introduction ............................................................................................................................ 1
1.1 Background ....................................................................................................................... 1
1.2 Purpose ............................................................................................................................. 1
1.3 Scope ................................................................................................................................ 1
1.4 Aim ................................................................................................................................... 2
1.5 Methodology ..................................................................................................................... 2
1.6 Quantitative vs. Qualitative approach .............................................................................. 3
1.7 Validity and reliability ...................................................................................................... 4
2. Valuation theory ..................................................................................................................... 5
2.1 The appraisal process ........................................................................................................ 5
2.2 Discounted Cash Flow analysis ........................................................................................ 7
2.2.1 Applicability of DCF ................................................................................................. 9
2.3 Comparable sales analysis .............................................................................................. 10
3. Existing valuation models .................................................................................................... 12
3.1 In-use models within Jones Lang LaSalle ...................................................................... 12
3.2 Commercial software suites ............................................................................................ 12
4. Specific needs of Jones Lang LaSalle .................................................................................. 15
4.1 Specific valuation practices ............................................................................................ 15
4.2 Branding ......................................................................................................................... 15
4.3 Company-wide ................................................................................................................ 16
4.4 Enhanced features for increased efficiency .................................................................... 16
5. Development of a new valuation model ............................................................................... 17
5.1 Technical challenges ....................................................................................................... 17
5.2 User interface .................................................................................................................. 18
5.3 Presentation and report automation ................................................................................ 18
6. Final product: ANVIL (Appraisal model for Nordic Valuation Intel) ................................. 21
6.1 Introduction .................................................................................................................... 21
6.2 Input ................................................................................................................................ 22
6.3 Rent roll .......................................................................................................................... 23
6.4 Costs ............................................................................................................................... 24
6.5 Cash flow ........................................................................................................................ 25
6.6 Financing ........................................................................................................................ 26
6.7 Sensitivity analysis ......................................................................................................... 27
6.8 CF table ........................................................................................................................... 28
6.9 Table tenant specification ............................................................................................... 29
6.10 Tables 2 ......................................................................................................................... 29
6.11 Graphs ........................................................................................................................... 30
6.12 Help cells ...................................................................................................................... 30
7. Advantages ........................................................................................................................... 31
8. Implementation ..................................................................................................................... 32
8.1 Valuation workshop at Jones Lang LaSalle ................................................................... 32
9. Conclusion ............................................................................................................................ 35
10. Discussion .......................................................................................................................... 37
Sources ..................................................................................................................................... 40
Litterature ............................................................................................................................. 40
Interviews ............................................................................................................................. 40
Electronic sources ................................................................................................................. 41
Appendix 1. Example of cash flow output sheet ...................................................................... 42
Figures
Figure 1. An overview of the appraisal process. ........................................................................ 6
Figure 2. Illustration of the two major components in real estate market value in a discounted
cash flow analysis; the present value of net operating income and exit price............................ 9
Figure 3. Screen shot of an example of external DCF software, Argus Valuation. ................. 13
Figure 4. Illustration of the formula that controls rental income per year and tenant. ............. 17
Figure 5. Example of an output graph. ..................................................................................... 19
Figure 6. Example of output pie graph. .................................................................................... 19
Figure 7. Custom user dialog window. .................................................................................... 20
Figure 8. Screen shot of front sheet of ANVIL. ....................................................................... 21
Figure 9. Screen shot of input sheet of ANVIL. ...................................................................... 22
Figure 10. Screen shot of tenancy schedule of ANVIL. .......................................................... 23
Figure 11. Custom user dialog window. Activated when the "Insert new row" button is
pressed. ..................................................................................................................................... 23
Figure 12. Screen shot of costs sheet of ANVIL. ..................................................................... 24
Figure 13. Screen shot of cash flow sheet of ANVIL. ............................................................. 25
Figure 15. Screen shot of financing sheet of ANVIL............................................................... 26
Figure 16. Screen shot of sensitivity sheet of ANVIL. ............................................................ 27
Figure 17. Screen shot of output sheet ("CF table") of ANVIL. .............................................. 28
Figure 18. Screen shot of tenant specification table sheet of ANVIL. ..................................... 29
Figure 19. Screen shot of table sheet of ANVIL. ..................................................................... 29
Figure 20. Screenshot of graph sheet in ANVIL. ..................................................................... 30
1
1. Introduction
1.1 Background
Jones Lang LaSalle is one of the largest real estate consultancies both globally and in Sweden
with over 40,000 employees worldwide. The company offers a wide range of real estate
related services, including valuation. Valuation is a fairly new service in Sweden that was
introduced at Jones Lang LaSalle in 2009 and has rapidly grown since then. It started as a side
service at the Research department, later to be renamed Research and Valuation as a result of
its growth in size and importance for Jones Lang LaSalle in Sweden.
The valuation team at Jones Lang LaSalle is mainly using discounted cash flow calculations
when estimating a value of a property. There are various versions of discounted cash flow
calculation models in use at the moment, and there is no consensus on which model is
preferable from a technically or user experience perspective. This resulted in the need of an
overhaul of the current models to develop a universal model that is used and understood by
the entire valuation team as well as other employees at Jones Lang LaSalle that is involved in
real estate valuations, for instance the Capital Markets department.
1.2 Purpose
Jones Lang LaSalle has expressed that there is a genuine demand for a newly developed
model for real estate valuation used by the appraisers. The purpose of this report is to examine
the background of the problem, identify the shortcomings of existing and alternative models,
and give an overview of how the problem was solved for Jones Lang LaSalle by the
introduction of the new discounted cash flow model.
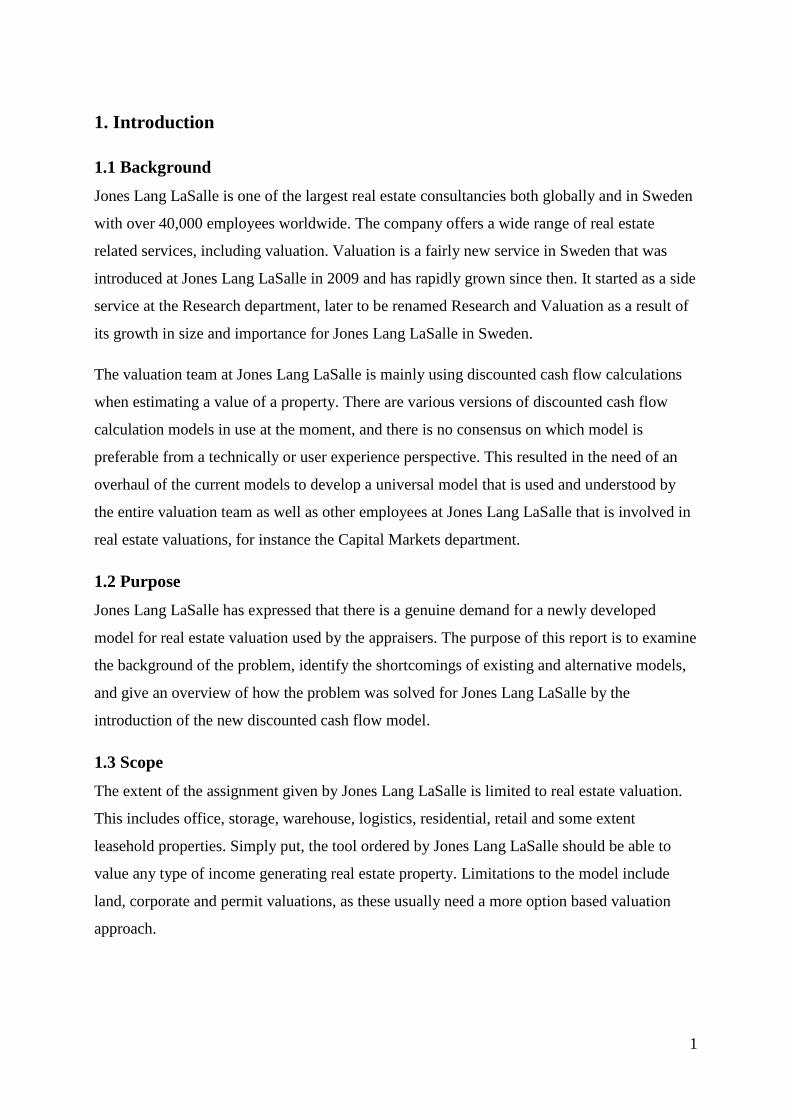
1.3 Scope
The extent of the assignment given by Jones Lang LaSalle is limited to real estate valuation.
This includes office, storage, warehouse, logistics, residential, retail and some extent
leasehold properties. Simply put, the tool ordered by Jones Lang LaSalle should be able to
value any type of income generating real estate property. Limitations to the model include
land, corporate and permit valuations, as these usually need a more option based valuation
approach.
2
1.4 Aim
Jones Lang LaSalle has received the model (from now on called “ANVIL”, Appraisal model
for Nordic Valuation Intel), which, according to Jones Lang LaSalle, has satisfied the need
previously described. This report merely aims at reviewing the process of investigation of
what this need really was. Furthermore, this paper aims to review the challenges involved in
the process of constructing such a model, the result achieved, and the feedback received by
Jones Lang LaSalle.
1.5 Methodology
This report uses a qualitative approach. The main focus is the current situation and needs of
the Swedish Research and Valuation team at Jones Lang LaSalle. By studying the existing
models and conducting interviews with members of the valuation team, the current valuation
model related needs and issues was discovered.
A number of models for real estate discounted cash flow calculation were gathered to study
the structure and scope, and further on used in the development process for benchmarking.
The authors of this report are involved in the daily operations at the Research and Valuation
and the Capital Markets departments, a necessity in order to study and understand the
valuation process and current practice at Jones Lang LaSalle.
During the development of the new discounted cash flow model, a number of feedback
sessions with stakeholders, such as Åsa Linder (National Director and Head of Research and
Valuation) and her colleagues, of the project were scheduled to ensure the quality and scope
of the product.
3
1.6 Quantitative vs. Qualitative approach
Due to the nature of the task given by Jones Lang LaSalle, i.e. developing a new and
improved valuation model based upon highly technical and mathematical principles, the study
can be claimed to be very quantitative in its nature. This is further enhanced by the fact that
the model had to be adequately robust to handle all types of property types combined with all
types of tenancies available in Sweden, still providing highly accurate value estimations. On
top of that, the model has to be user friendly, i.e. a high level of input process automation
through advanced mathematical binominal-like trees that in some cases expanded into a
quantity of branches. All of these factors argue that the study is of a quantitative nature, and it
is partially correct.
However, the study also relies on important qualitative approach. The end user of the newly
developed model is in fact the appraiser, and no model can be perfectly adapted to all end
users. Therefore, the majority of time was not put into the technical development of the model
(even if that amount of work is in no sense negligible in this case) but rigorous questioning of
the appraisers of Jones Lang LaSalle about the flaws in current and competing software.
Through these interviews, especially with mrs. Åsa Linder, National Director and Head of
Research & Valuation at Jones Lang LaSalle in Sweden, we managed to extract and formulate
the core of Jones Lang LaSalle’s needs and current issues.
4
1.7 Validity and reliability
Validity refers to us on account for Jones Lang LaSalle measuring what is relevant in the
specific context, while the reliability concerns that we measure in a reliable manner. In our
case, validity is much more important than reliability. This is because measuring the right
things is core to any valuation. The question about “measuring things right” is much more
clearly defined and the industry has very specific definitions of “what is what” in valuation
practices, therefore reliability is something that is assumed for any type of valuation tool.
Therefore, emphasis has been put on narrowing down and reduction of uncertainties to the
measurements of what is relevant to valuation practices. The validity in this report can be said
being able to specify in what situation and for which population the results are valid. The
scope of this thesis work is to provide a tool that provides accurate results no matter the
situation or appraiser the tool will be used by.
The valuation model presented to Jones Lang LaSalle has been rigorously tested to provide
experience-adjusted accurate values, i.e. the result of the model will reflect the level of user
experience. This is the main evidence of our reliability being highly accurate, but also the
more important aspect of validity being clearly defined and captured in this case. As
explained in further detail in the section 8.1, Jones Lang LaSalle appointed a full day
workshop for examination of the developed valuation model. In this workshop, it became
evident that the validity and reliability of the valuation model was adequately robust to
provide accurate values even with highly specific input criteria, input by staff members with
low or novice experience of real estate appraisal.
5
2. Valuation theory
The appraisal process is central in the development of a new discounted cash flow calculation
model. One must fully understand the procedure in order to find an efficient and intuitive
workflow path in the model as well as what parameters that are input and what parameters are
output even though many of them can function as both. For instance, key indicators can be
both input and output depending on the path of the process. (Andersson et. al., 2004)
As real estate in general are very complex assets with hundreds or thousands costs involved,
every valuation is a simplification of reality. (Damodaran, 2002) The time and resources
needed to assess every cost in detail for any given property would be unrealistic and the
precision would be diluted due to the forecasting of how those costs develop over time. A
simplification of the transactions is a necessity, the question is which of them to simplify and
to what extent, hence the need to study the appraisal process.
The layout and hierarchy of the input data is another side of the same coin. What is most
preferable in an everyday appraisal process, rent entered per square meter or a total figure?
That might depend on the character of the rent figure, be it an actual rental figure for an
existing tenant or an estimated rental value (also known as “ERV”). Hence, to achieve a
highly efficient valuation tool, each step of the appraisal process must be carefully considered.
This applies to both the theoretical real estate valuation framework and the everyday practices
of Research and Valuation department of Lones Lang LaSalle.
2.1 The appraisal process
The valuation process may differ from one appraiser to another, but there is an overall
systematic procedure that all must follow in order for the valuation to be reliable. The main
purpose of the value is to answer the questions of real estate value, in this case assumed to be
the clients’. Often it is the question of market value but there are other types of value, for
instance investment value or use value which is beyond the scope of this thesis. However, for
these different types of real estate value the overall framework is the same. (Andersson et. al.,
2004)
The process depends on the nature of the subject property and the data available. The
characteristics of the asset affects the range of the different steps involved in the appraisal
procedure. Failing to follow these steps would jeopardise the accuracy as well as the
understanding of the results that leads to the appraisal conclusions. (Appraisal Institute, 2001)
6
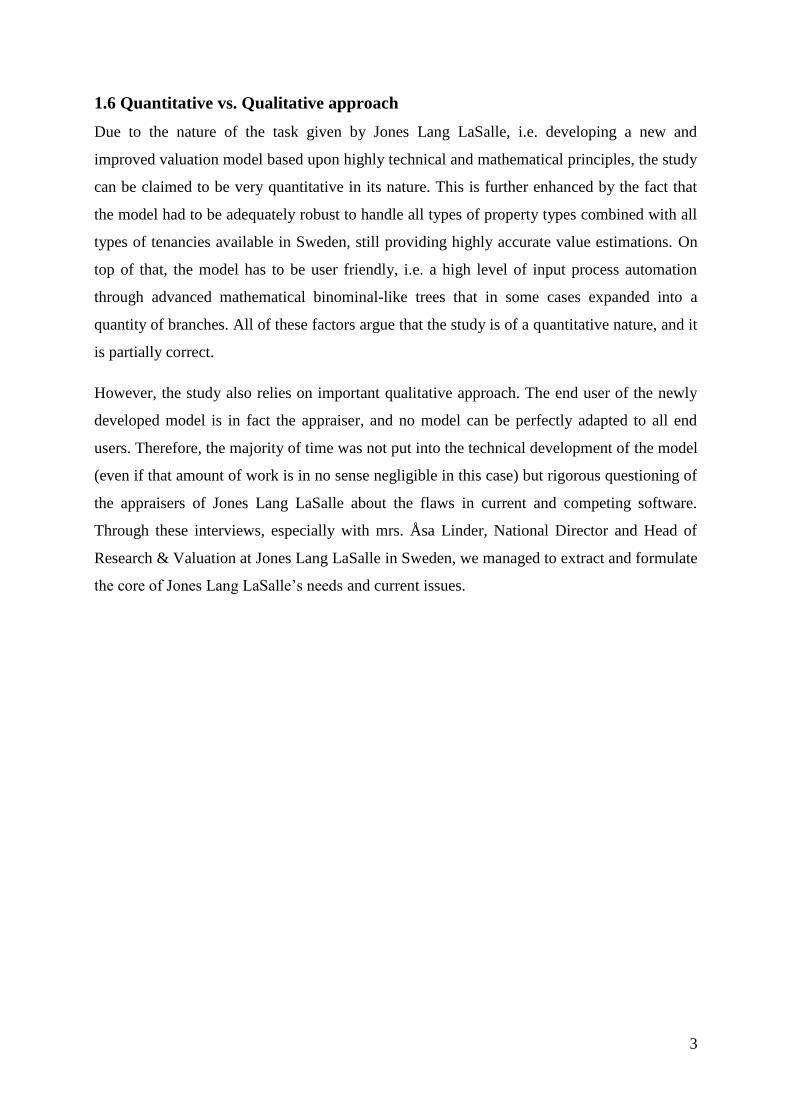
The appraisal process has its base in knowledge of the market, and the best knowledge comes
through thorough research. The first step, however, is to define the problem that is the cause
of the need of a valuation and the accompanying scope of work needed to arrive at the
conclusions to solve the problem as well as satisfy the needs of the client. When the problem
has been defined, relevant data collection can be initiated. (Damodaran, 2002)
Figure 1. An overview of the appraisal process.
The data needed is both the of the present situation in order to grasp the situation the property
is in today and past information in order to detect on going trends in order to make accurate
estimations. (Lusht, 2002) This data may be real estate specific data but should also be
information about the overall current economic situation that is likely to affect the real estate
industry. The real estate industry is highly interlinked with macro-economic variables such as
inflation or interest rates, but also regional changes. For instance, a property located in a
prospering and aggressively growing submarket could have a very different future
development compared to an asset in another submarket in the same city. (Appraisal Institute,
2001)
Data collection also includes legal information such as planned changes in legislation of
permits and taxes. The appraiser must be informed about such changes (or market
expectations of changes as those are equally valid) that would have an impact value.
Report of defined value
Reconciliation of value indications and final opinion of value
Application of the approaches of value
Land value options
Data analysis
Data collection and property description
Scope of work
Definition of the problem
7
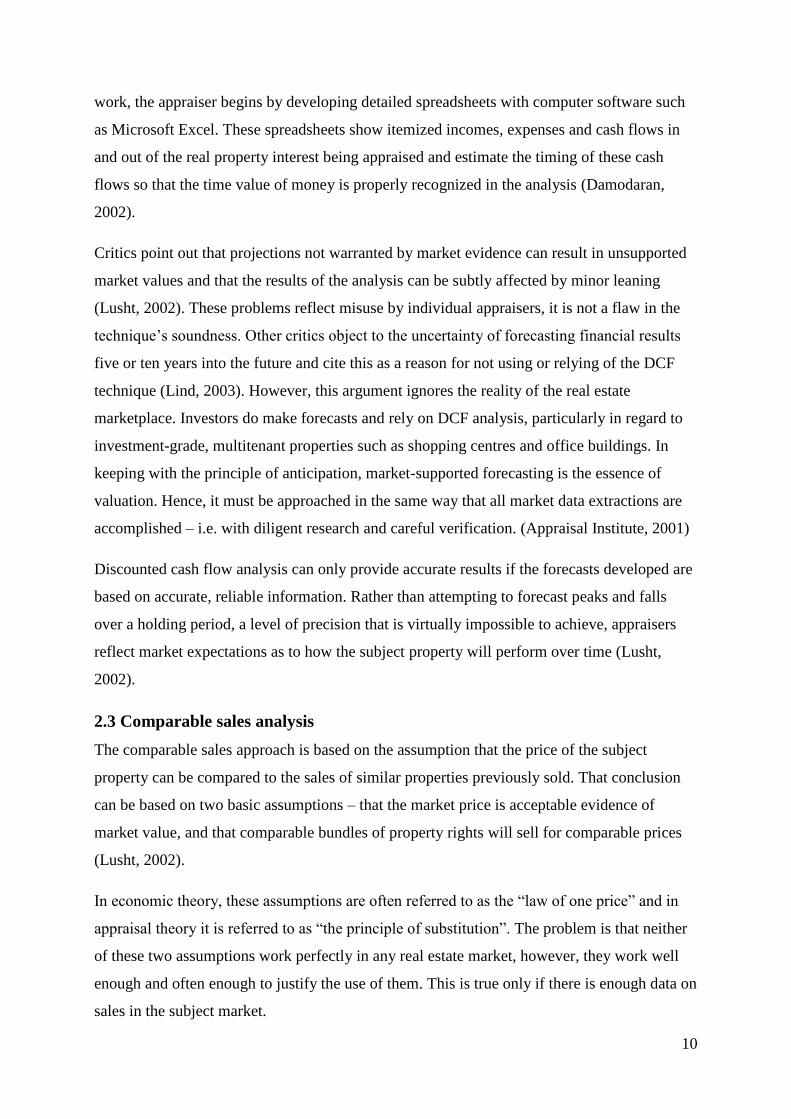
In addition, property specific data must be collected. This data includes physical, legal, cost,
income and expense attributes that is relevant to the valuation, including financial
arrangement that could have an impact on value. The physical state of the property is highly
important due to the possibility of neglected maintenance that could offset the cash flow over
the holding period and thus the market value. Data on comparable properties must be
collected as well to determine the supply and demand state of the market that the subject
property is located in. (Lusht, 2002)
When sufficient data is collected the data is examined and analysed. The analysis has two
components, market analysis and highest and best use analysis. The market analysis is a study
of the market conditions and the highest and best analysis is a consideration of the value of
the land as vacant and the property as improved. The conclusion of the highest and best use is
a specification of the lands optimal use for maximised value. Land value option is directly
related to the highest and best use analysis, the question of however the use of the land is best
with the current situation or if the value would increase if the land is converted into another
use. In many cases the value of the land must be separated from the value of the property as
those two values may evolve different over time. (Appraisal Institute, 2001)
Following the data analysis application of the approaches of value is done. The three main
approaches of value are cost, sales comparison and income capitalization. (Andersson et. al.,
2004) The method performed at Jones Lang LaSalle, and thus the focus of this report, is the
income capitalization approach through DCF analysis combined with the sales comparison
approach. The income of the property subject to a value appraisal is capitalized though for
instance yields derived through comparable sales. DCF and comparable sales are further
described in the section 2.2 and 2.3 respectively.
The appraisal process is finished when the appraiser performs a final reconciliation of value
indicators and a report is created where the estimated value is formulated along with the
arguments that are the foundation of the process defining the quoted value. (Lusht, 2002)
2.2 Discounted Cash Flow analysis
Real estate that is considered as income producing is usually an investment. From the
investors’ perspective, the income potential is the most important aspect for determination of
Real estate value. The most basic rule of investments is that the higher the earnings, the
higher value, as long as risk is kept at the same level. Simply put, an investor who purchases
8
real estate is trading present currency for an expected amount of currency in the future.
(Andersson et. al., 2004)
More formally put, in the cash flow and income capitalization approach, the analysis is
mainly focused on the property’s capacity to generate future benefits and capitalizes the
income into an indication of present value. The principle of anticipation is fundamental to the
approach. Techniques and procedures from this approach are used to analyze comparable
sales data and to measure obsolescence is the cost approach which is explained in the next
chapter. (Appraisal Institute, 2001)
For any types of patterns of regular or irregular income to a property, discounted cash flow
(DCF) is considered the most relevant and appropriate method by most modern researchers.
(Damodaran, 2002) DCF analysis also most preferred in most modern real estate valuation
companies. Basic models in excel built with relatively low level of mathematical skill can be
constructed in a short matter of time, which has led to an over-supply of DCF-models that all
vary in quality and accuracy. Many of these models are to be found in most companies doing
real estate valuations, as they are a practical tool for everyday valuation practices.
(Damodaran, 2002)
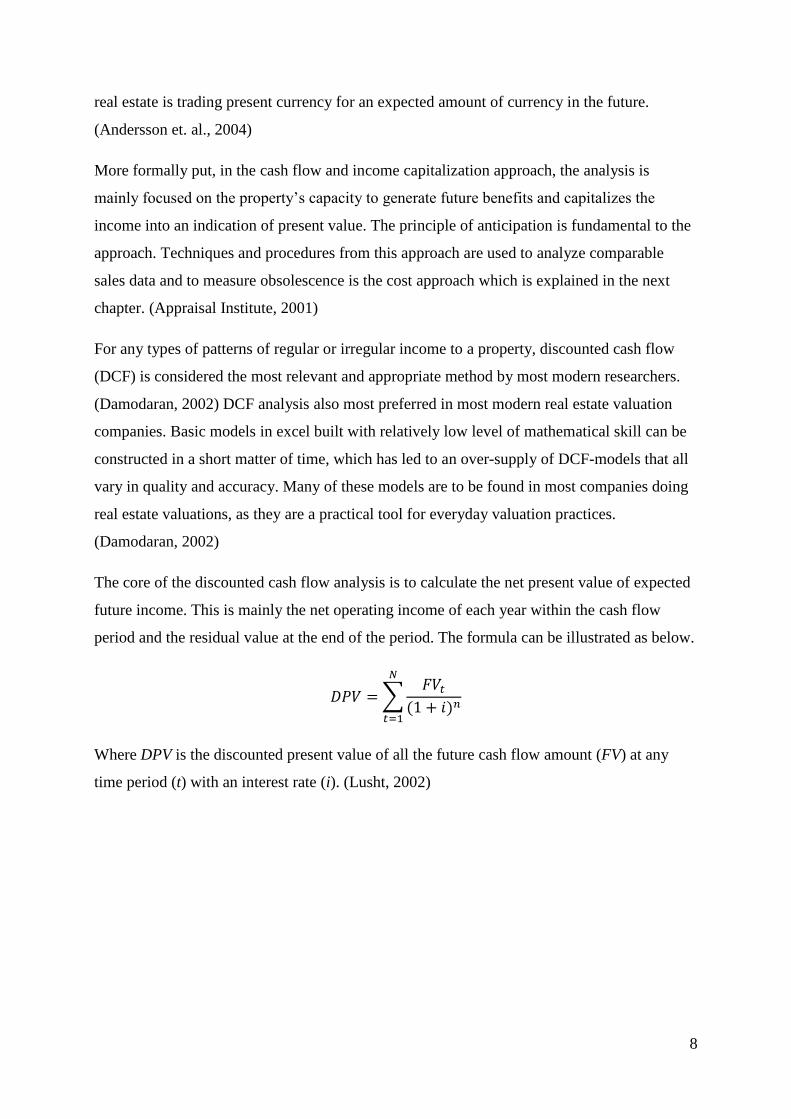
The core of the discounted cash flow analysis is to calculate the net present value of expected
future income. This is mainly the net operating income of each year within the cash flow
period and the residual value at the end of the period. The formula can be illustrated as below.
∑
Where DPV is the discounted present value of all the future cash flow amount (FV) at any
time period (t) with an interest rate (i). (Lusht, 2002)
9
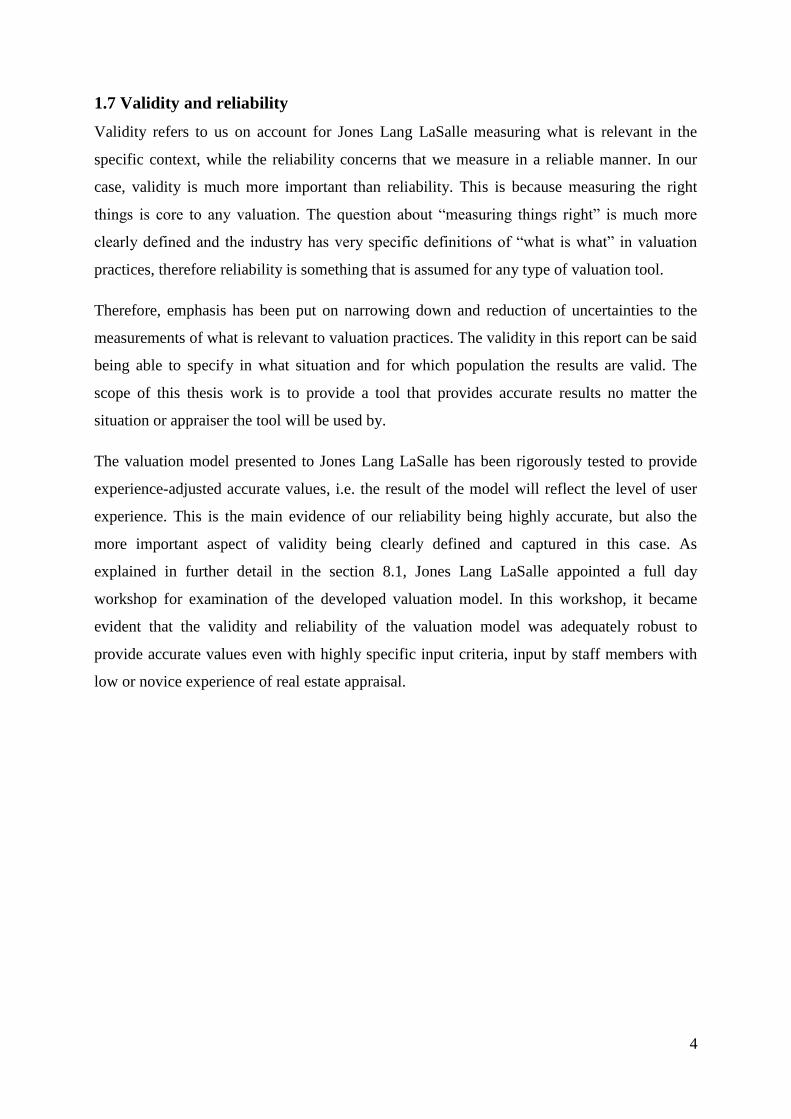
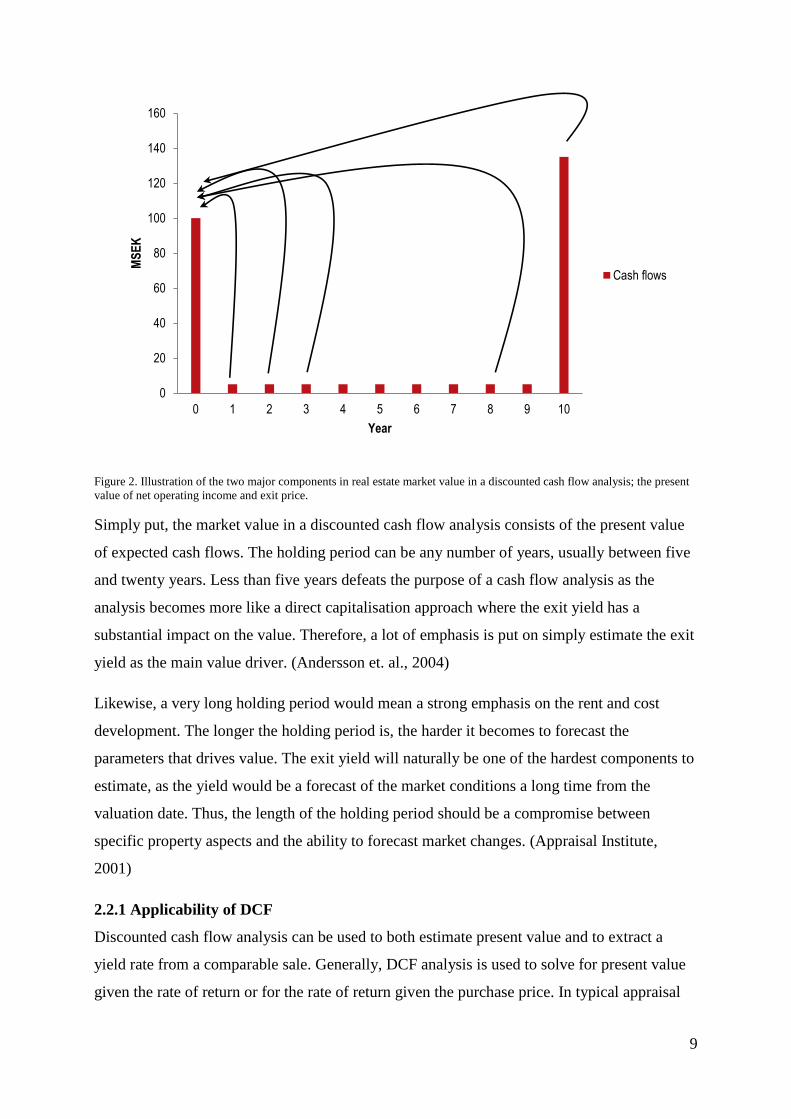
Figure 2. Illustration of the two major components in real estate market value in a discounted cash flow analysis; the present
value of net operating income and exit price.
Simply put, the market value in a discounted cash flow analysis consists of the present value
of expected cash flows. The holding period can be any number of years, usually between five
and twenty years. Less than five years defeats the purpose of a cash flow analysis as the
analysis becomes more like a direct capitalisation approach where the exit yield has a
substantial impact on the value. Therefore, a lot of emphasis is put on simply estimate the exit
yield as the main value driver. (Andersson et. al., 2004)
Likewise, a very long holding period would mean a strong emphasis on the rent and cost
development. The longer the holding period is, the harder it becomes to forecast the
parameters that drives value. The exit yield will naturally be one of the hardest components to
estimate, as the yield would be a forecast of the market conditions a long time from the
valuation date. Thus, the length of the holding period should be a compromise between
specific property aspects and the ability to forecast market changes. (Appraisal Institute,
2001)
2.2.1 Applicability of DCF
Discounted cash flow analysis can be used to both estimate present value and to extract a
yield rate from a comparable sale. Generally, DCF analysis is used to solve for present value
given the rate of return or for the rate of return given the purchase price. In typical appraisal
0
20
40
60
80
100
120
140
160
0 1 2 3 4 5 6 7 8 9 10
MS
EK
Year
Cash flows
10
work, the appraiser begins by developing detailed spreadsheets with computer software such
as Microsoft Excel. These spreadsheets show itemized incomes, expenses and cash flows in
and out of the real property interest being appraised and estimate the timing of these cash
flows so that the time value of money is properly recognized in the analysis (Damodaran,
2002).
Critics point out that projections not warranted by market evidence can result in unsupported
market values and that the results of the analysis can be subtly affected by minor leaning
(Lusht, 2002). These problems reflect misuse by individual appraisers, it is not a flaw in the
technique’s soundness. Other critics object to the uncertainty of forecasting financial results
five or ten years into the future and cite this as a reason for not using or relying of the DCF
technique (Lind, 2003). However, this argument ignores the reality of the real estate
marketplace. Investors do make forecasts and rely on DCF analysis, particularly in regard to
investment-grade, multitenant properties such as shopping centres and office buildings. In
keeping with the principle of anticipation, market-supported forecasting is the essence of
valuation. Hence, it must be approached in the same way that all market data extractions are
accomplished – i.e. with diligent research and careful verification. (Appraisal Institute, 2001)
Discounted cash flow analysis can only provide accurate results if the forecasts developed are
based on accurate, reliable information. Rather than attempting to forecast peaks and falls
over a holding period, a level of precision that is virtually impossible to achieve, appraisers
reflect market expectations as to how the subject property will perform over time (Lusht,
2002).
2.3 Comparable sales analysis
The comparable sales approach is based on the assumption that the price of the subject
property can be compared to the sales of similar properties previously sold. That conclusion
can be based on two basic assumptions – that the market price is acceptable evidence of
market value, and that comparable bundles of property rights will sell for comparable prices
(Lusht, 2002).
In economic theory, these assumptions are often referred to as the “law of one price” and in
appraisal theory it is referred to as “the principle of substitution”. The problem is that neither
of these two assumptions work perfectly in any real estate market, however, they work well
enough and often enough to justify the use of them. This is true only if there is enough data on
sales in the subject market.
11
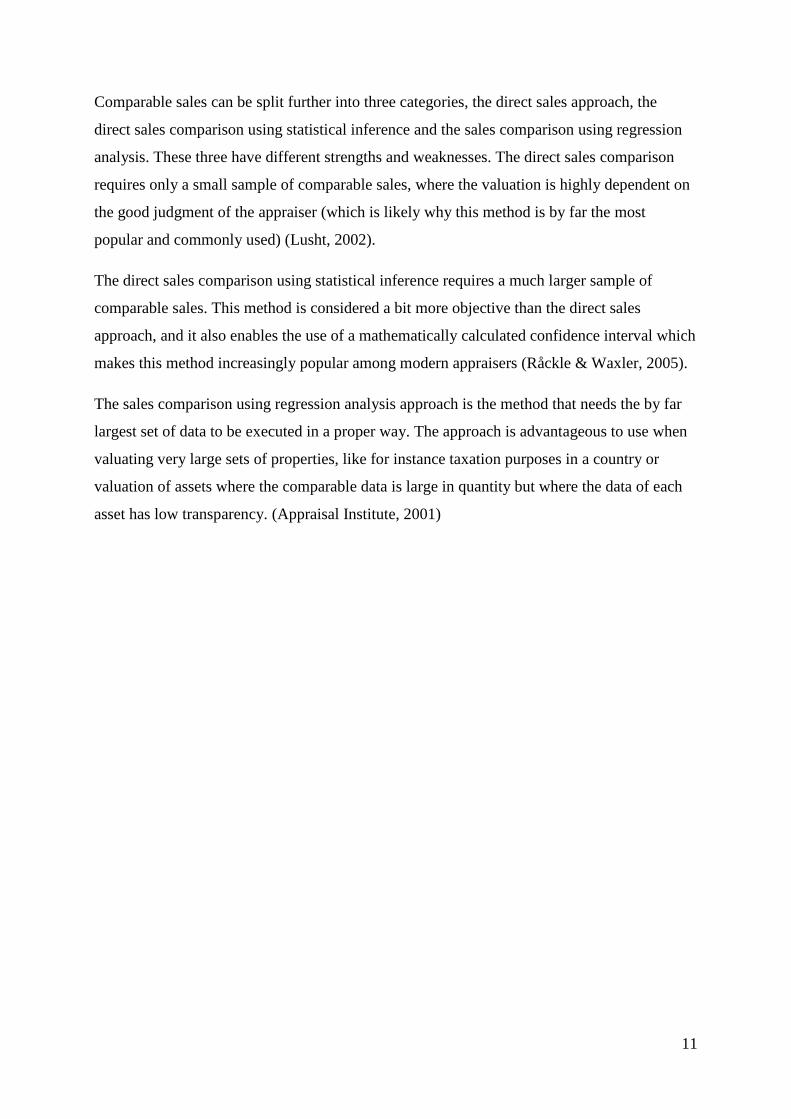
Comparable sales can be split further into three categories, the direct sales approach, the
direct sales comparison using statistical inference and the sales comparison using regression
analysis. These three have different strengths and weaknesses. The direct sales comparison
requires only a small sample of comparable sales, where the valuation is highly dependent on
the good judgment of the appraiser (which is likely why this method is by far the most
popular and commonly used) (Lusht, 2002).
The direct sales comparison using statistical inference requires a much larger sample of
comparable sales. This method is considered a bit more objective than the direct sales
approach, and it also enables the use of a mathematically calculated confidence interval which
makes this method increasingly popular among modern appraisers (Råckle & Waxler, 2005).
The sales comparison using regression analysis approach is the method that needs the by far
largest set of data to be executed in a proper way. The approach is advantageous to use when
valuating very large sets of properties, like for instance taxation purposes in a country or
valuation of assets where the comparable data is large in quantity but where the data of each
asset has low transparency. (Appraisal Institute, 2001)
12
3. Existing valuation models
Valuations are done on a daily basis. While they are highly regarded, professional valuations,
the tools used vary between clients and individual appraisers. As previously stated, it is
preferable to agree upon one universal discounted cash flow model to be used in the firm for
various reasons.
3.1 In-use models within Jones Lang LaSalle
There are a couple of models in use that vary in complexity and quality, however, none
satisfies the needs expressed by the Research and Valuation department at Jones Lang
LaSalle.
There is a trade off in efficiency between the level of complexity and user friendliness; a
technically sophisticated easily gets unintuitive and time consuming to understand and use
(interview Linder, May 4 2011). For example, there is a model supplied by a client1 that is so
complex and cumbersome to work with that the majority of time is spent on data
administration and entering instead of the analysis that is adding value to the client. A lot of
time is spent on merely learning and trying to understand the model, as the responsibility lies
with the appraiser that the output is correct. Nonetheless, very simple models are often
lacking in features resulting in a lot of extra work modifying the model.
To modify an existing model to completely suit the present need of Jones Lang LaSalle is not
feasible. It would require complete reengineering of the model and without the original
designer still employed, there is a risk of possible intrinsic errors being left in or created in the
process. It is simply too time consuming compared to building a new one.
3.2 Commercial software suites
There are various software suites available that can provide a professional appraiser with
discounted cash flow analyses, for instance Argus Software. The advantages are that they are
reliable in the sense that the algorithms that the calculations are based on are correct and
robust, and if there is a problem there is user support for the product.
The disadvantages are, however, severe. Merely the cost of such software solution may
eliminate it as a candidate as they normally costs several thousand dollars or more. On top of
this comes additional fees for multiple user licences. The workstations are continuously
1 Due to confidentiality agreements, specific client information cannot be exposed.
13
replaced as they get old and brakes, and the installation of additional software is a costly and
cumbersome process as user lack administrator privileges due to rigorous IT policies.
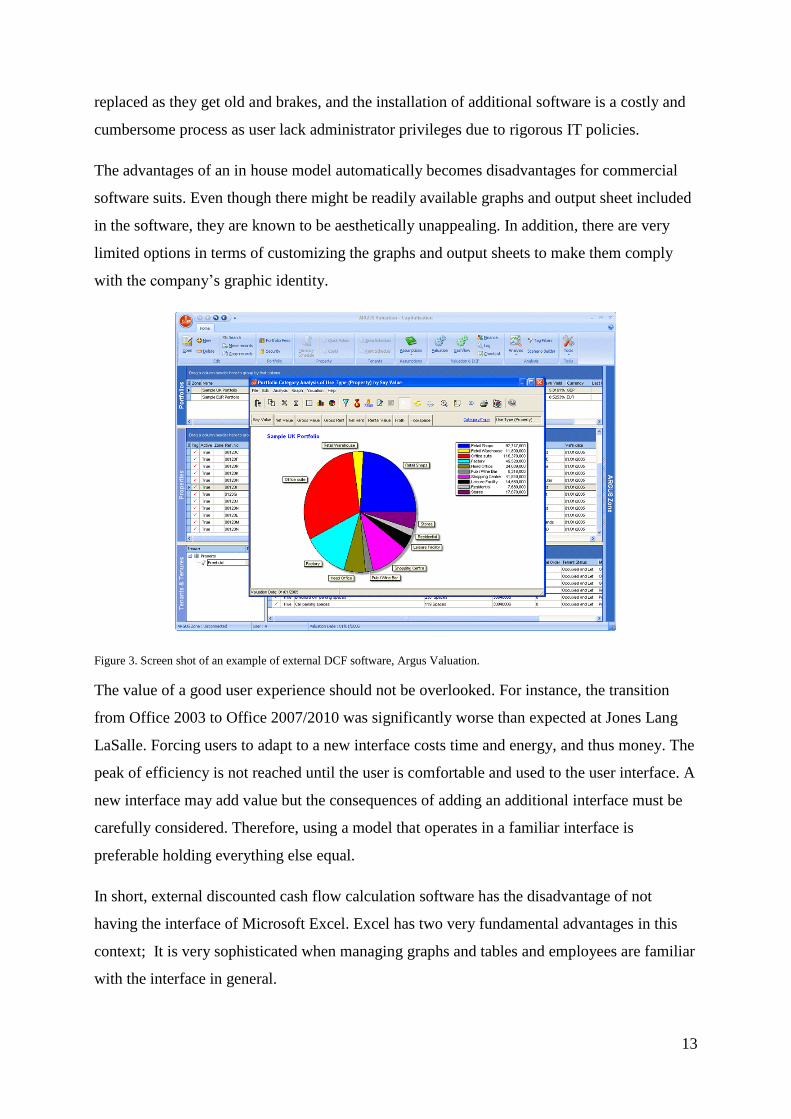
The advantages of an in house model automatically becomes disadvantages for commercial
software suits. Even though there might be readily available graphs and output sheet included
in the software, they are known to be aesthetically unappealing. In addition, there are very
limited options in terms of customizing the graphs and output sheets to make them comply
with the company’s graphic identity.
Figure 3. Screen shot of an example of external DCF software, Argus Valuation.
The value of a good user experience should not be overlooked. For instance, the transition
from Office 2003 to Office 2007/2010 was significantly worse than expected at Jones Lang
LaSalle. Forcing users to adapt to a new interface costs time and energy, and thus money. The
peak of efficiency is not reached until the user is comfortable and used to the user interface. A
new interface may add value but the consequences of adding an additional interface must be
carefully considered. Therefore, using a model that operates in a familiar interface is
preferable holding everything else equal.
In short, external discounted cash flow calculation software has the disadvantage of not
having the interface of Microsoft Excel. Excel has two very fundamental advantages in this
context; It is very sophisticated when managing graphs and tables and employees are familiar
with the interface in general.

14
Adding to this, manual changes and exceptions are not easily inserted compared to the Excel
based equivalent. With some knowledge of the features in Microsoft Excel, a model is easily
reengineered to suit specific conditions of a property for valuation purposes.
To summarise, there are enough shortcomings of external software suits to dismiss them.
Thus, henceforth software suits are regarded as unsuitable for valuation purposes at Jones
Lang LaSalle, given the available options.
15
4. Specific needs of Jones Lang LaSalle
The specific needs of Jones Lang LaSalle are one of the main reasons for the initiative of the
development of a new real estate discounted cash flow calculation model. There are a couple
of main areas where existing valuation models were underperforming.
4.1 Specific valuation practices
As the Jones Lang LaSalle’s Research and Valuation department in Sweden is a group of
individuals, the individual valuation practice needs to be considered during the development
of the new real estate discounted cash flow calculation model called ANVIL (Appraisal model
for Nordic Valuation Intel). Specific valuation practices incorporate technical aspects as well
as user interface.
While technical aspects may not fundamentally differ from common valuation practice in the
industry, the level of complexity and detail in terms of assumptions and data entering. For
instance, the holding period is customizable in the model with a resolution of one year from
one to twenty years, something that is usually fixed to only five or ten years. Furthermore,
default attributes such as structural vacancy must be alterable in an accessible way.
Vacancies is a problematic area. One of the specific requests from Åsa Linder was the ability
to adjust the effective vacancy rates (income losses) per year and per premises type. This is
due to the cumbersome procedure to adjust vacancy rate per tenant and per year of there a
large number of tenants in the subject property.
The user interface is, of course, a question of subjective taste. Fonts, colours and layout must
comply with user expectations (when not bound by company policy). Before the introduction
of ANVIL there were no such model that was aesthetically pleasing and graphically branded
by the Jones Lang LaSalle colour palette and font family.
4.2 Branding
Jones Lang LaSalle has a strict, global brand identity policy. This is relevant as graphs and
tables produced by the cash flow model must comply with the policy. For increased
efficiency, the user should have readily available graphs and tables with the necessary
information for direct insertion into the client report without the need to change the scope or
presentation of the information.
16
4.3 Company-wide
As previously mentioned, Research and Valuation is not the only department involved in real
estate appraisal. The Capital Markets team regularly performs real estate appraisals due to the
necessity to estimate a value of the asset as a part of a real estate transaction advisory service.
Having a common discounted cash flow model can be helpful to the internal encouragement
to collaborate between departments in order to facilitate efficiency and cross selling, hence
the need for the Capital Markets team to provide feedback in the development of the new
model.
4.4 Enhanced features for increased efficiency
The valuation team at Jones Lang LaSalle produces a large quantity of valuation reports every
year. Along with every report comes a set of graphs and tables, and because the absence of a
standardised model with readily available graphs they have to be done manually for every
new report written. Consequently, having automatically generated graphs was a priority from
an efficiency perspective during the development of the new discounted cash flow model.
More on the development of automated graphs and tables in the section 5. Development of the
new valuation model.
17
5. Development of a new valuation model
The development of the new real estate discounted cash flow model started with a blank excel
document. There were a number of reference models available that could have functioned as
templates, but since none of them met the requirements of Jones Lang LaSalle in terms of
features and user interface the decision was made to start from scratch.
5.1 Technical challenges
A notable phase in the development of the model was the design of the formula that calculates
the rent at a given time depending on dates entered by the user. The user enters the current
rent and dates for lease start and end eventually followed by a void period prior to a second
lease at estimated market rent (also known as ERV, estimated rental value). The model then
automatically determines how much and when rental income occurs. As a result, a couple of
criteria must be fulfilled in the formula before rental income is relevant. If fulfilled, the level
of income is dependent on rental growth (often anchored to inflation).
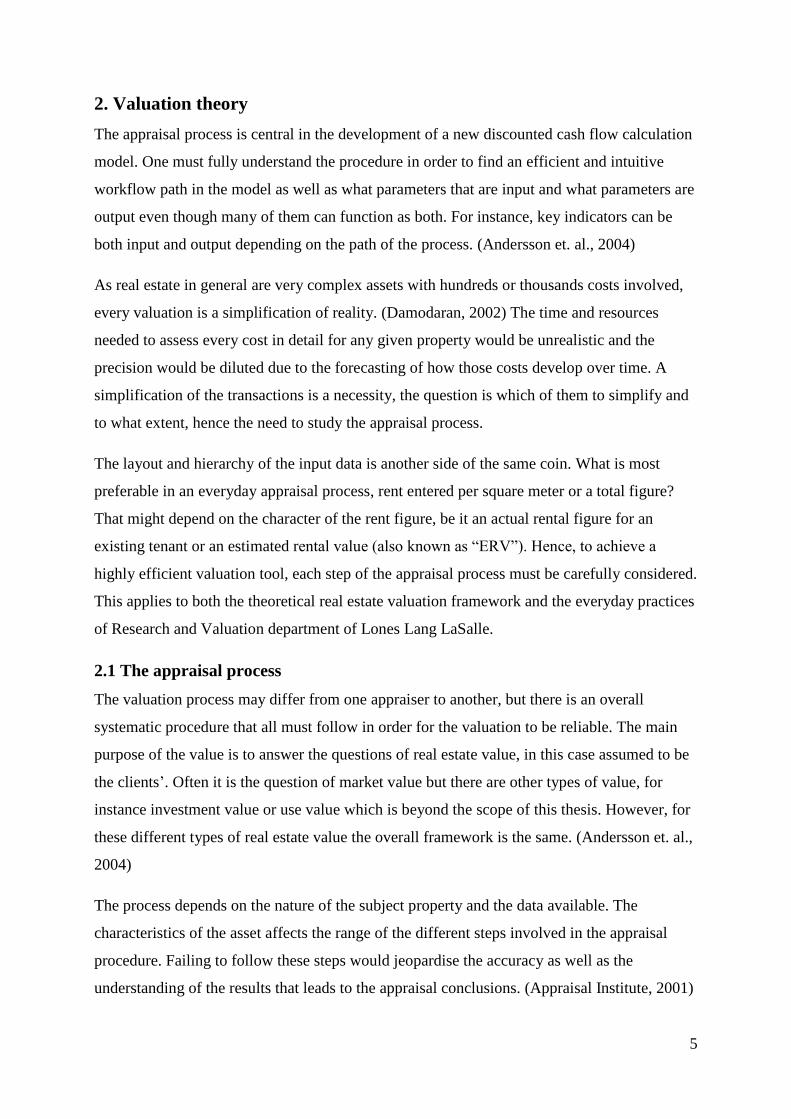
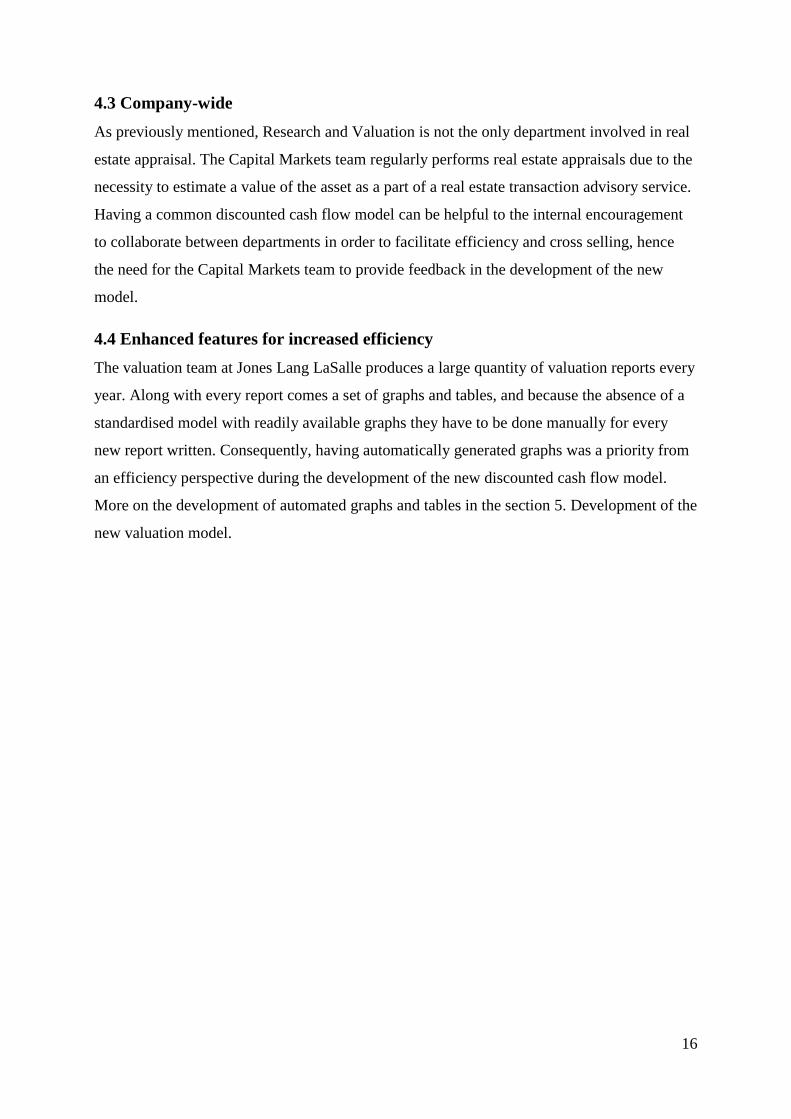
The core of the formula is a set of “IF” commands, each consisting of a logical test and values
for if the test is true or false.
Figure 4. Illustration of the formula that controls rental income per year and tenant.
Figure 4 is a tree like illustration of the part of the formula controlling the number of days of
rental income for year one (thereof the share of the year left ratio expression). After each
question, or IF command to be exact, a value or an additional question is activated depending
on the result of the logical test. The end result is multiplied by the rent including possible
Lease start < current year?
Expiry date > current year?
share of the year left * 365
expiry - starting date
Lease start = current year?
Lease expiry > current year?
Lease start > starting date?
End of current year - lease start
End of current year - starting
date expiry date - lease start
0
18
index adjustment. This structure is used for rental, tax and service charge calculation per year
and per tenant. Years other than the first have the share of the year left expression replaced by
the days of a full year.
This is a mere example of the technical level of the DCF model in the actual excel sheet. This
particular problem was chosen because its suitability for illustration.
5.2 User interface
A DCF model can be confusing and difficult to grasp at first sight, and colour coded cells is
an effective approach to make the model more intuitive. The user can quickly identify where
the cells are that require user input and the cells that include formulas and do not rely on
direct input. Colour codes are a common ingredient in DCF models, however, the use of the
colour scheme tend to be inconsistent, forcing the user to reverse engineer formulas in order
to sure that no important cells for user input are overlooked.
The need for this type of user interface improvements are necessary as there is a large number
of cells existing purely for technical purposes (calculating rent accurately for instance). The
tenancy schedule sheet include approximately 300 cells for the sole purpose of calculation (no
input or direct output) per tenant, resulting in approximately 3000 cells for a building with 10
tenants. As a result, extra attention has been given to this area in the development of the new
model.
5.3 Presentation and report automation
Having features in the discounted cash flow model intended for the client report is rational as
the information required for graphs and tables is based on the result of model or on the same
information entered in the model.
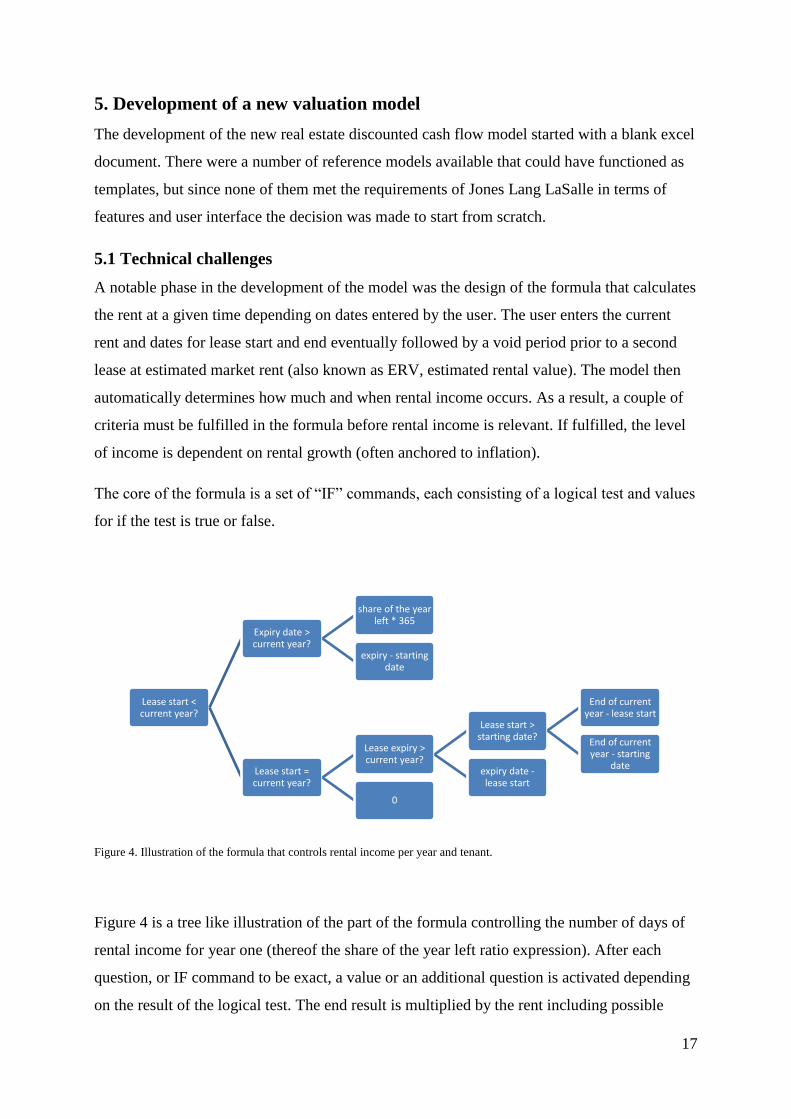
The process of developing graphs is a seemingly simple task given the powerful software
suits available today. The problem, however, is to have dynamic graphs that adjusts to the
number of years specified in the holding period input cell. That there are no easy way to
achieve this was discovered quickly. The problem was eventually solved through the use of
“OFFSET” functions and named cells through the name manager feature in excel, as the
graph tool would not allow formulas in the data entry field. While this technical issue was a
sort of an achievement to overcome by itself, what is important is the value added to the end
user. In the end, the new cash flow model was given a feature that the valuation department
had not seen in any other model to date.
19
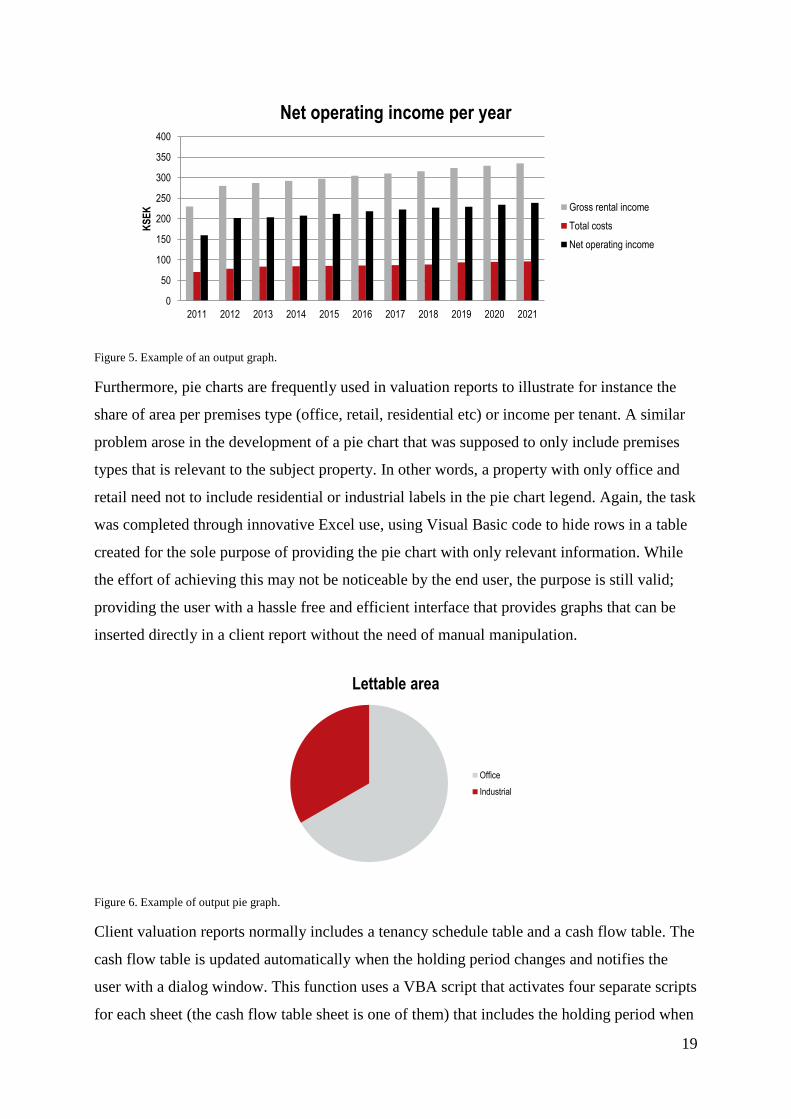
Figure 5. Example of an output graph.
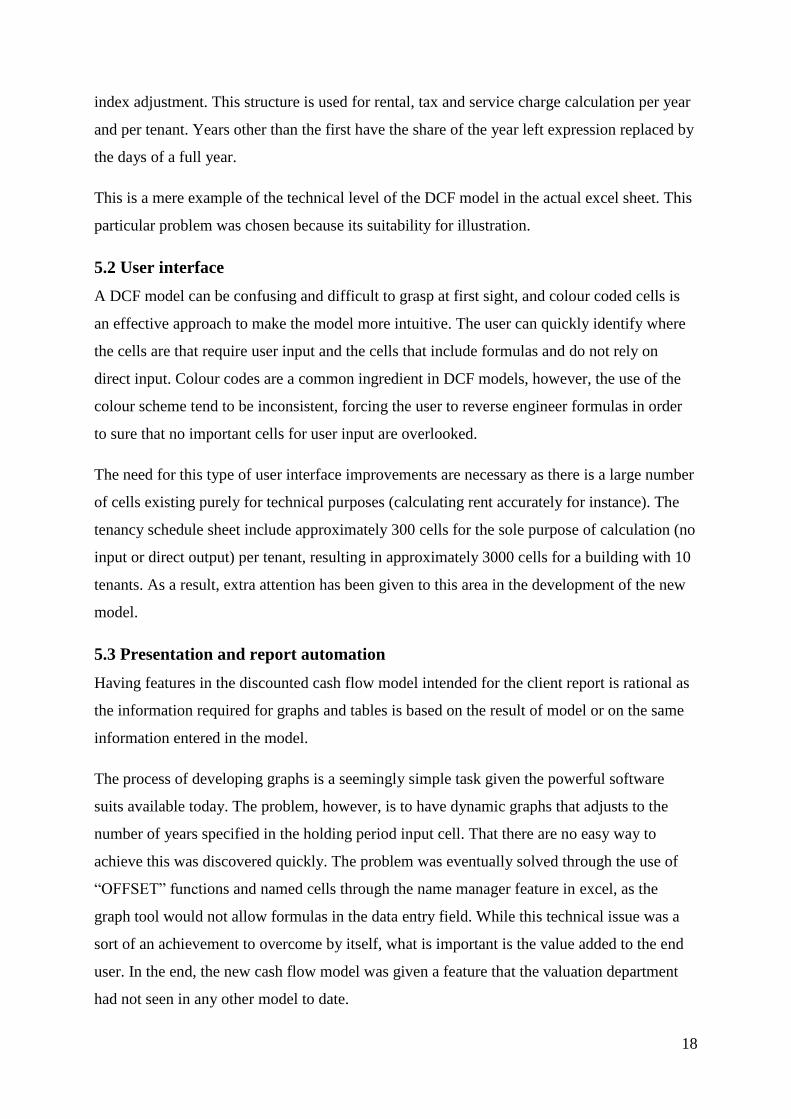
Furthermore, pie charts are frequently used in valuation reports to illustrate for instance the
share of area per premises type (office, retail, residential etc) or income per tenant. A similar
problem arose in the development of a pie chart that was supposed to only include premises
types that is relevant to the subject property. In other words, a property with only office and
retail need not to include residential or industrial labels in the pie chart legend. Again, the task
was completed through innovative Excel use, using Visual Basic code to hide rows in a table
created for the sole purpose of providing the pie chart with only relevant information. While
the effort of achieving this may not be noticeable by the end user, the purpose is still valid;
providing the user with a hassle free and efficient interface that provides graphs that can be
inserted directly in a client report without the need of manual manipulation.
Figure 6. Example of output pie graph.
Client valuation reports normally includes a tenancy schedule table and a cash flow table. The
cash flow table is updated automatically when the holding period changes and notifies the
user with a dialog window. This function uses a VBA script that activates four separate scripts
for each sheet (the cash flow table sheet is one of them) that includes the holding period when
0
50
100
150
200
250
300
350
400
2011 2012 2013 2014 2015 2016 2017 2018 2019 2020 2021
KS
EK
Net operating income per year
Gross rental income
Total costs
Net operating income
Lettable area
Office
Industrial
20
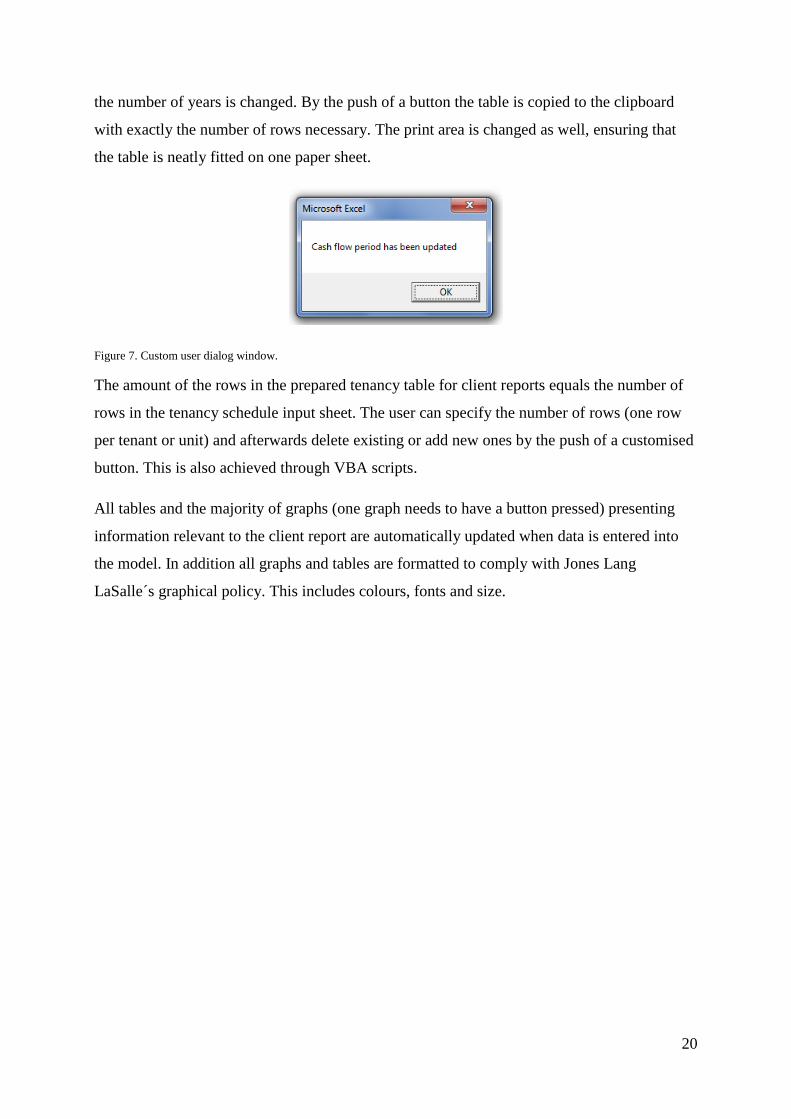
the number of years is changed. By the push of a button the table is copied to the clipboard
with exactly the number of rows necessary. The print area is changed as well, ensuring that
the table is neatly fitted on one paper sheet.
Figure 7. Custom user dialog window.
The amount of the rows in the prepared tenancy table for client reports equals the number of
rows in the tenancy schedule input sheet. The user can specify the number of rows (one row
per tenant or unit) and afterwards delete existing or add new ones by the push of a customised
button. This is also achieved through VBA scripts.
All tables and the majority of graphs (one graph needs to have a button pressed) presenting
information relevant to the client report are automatically updated when data is entered into
the model. In addition all graphs and tables are formatted to comply with Jones Lang
LaSalle´s graphical policy. This includes colours, fonts and size.
21
6. Final product: ANVIL (Appraisal model for Nordic Valuation Intel)
The resulting model, also known as ANVIL, consists of the following sheets (with dummy
information for demonstration purposes):
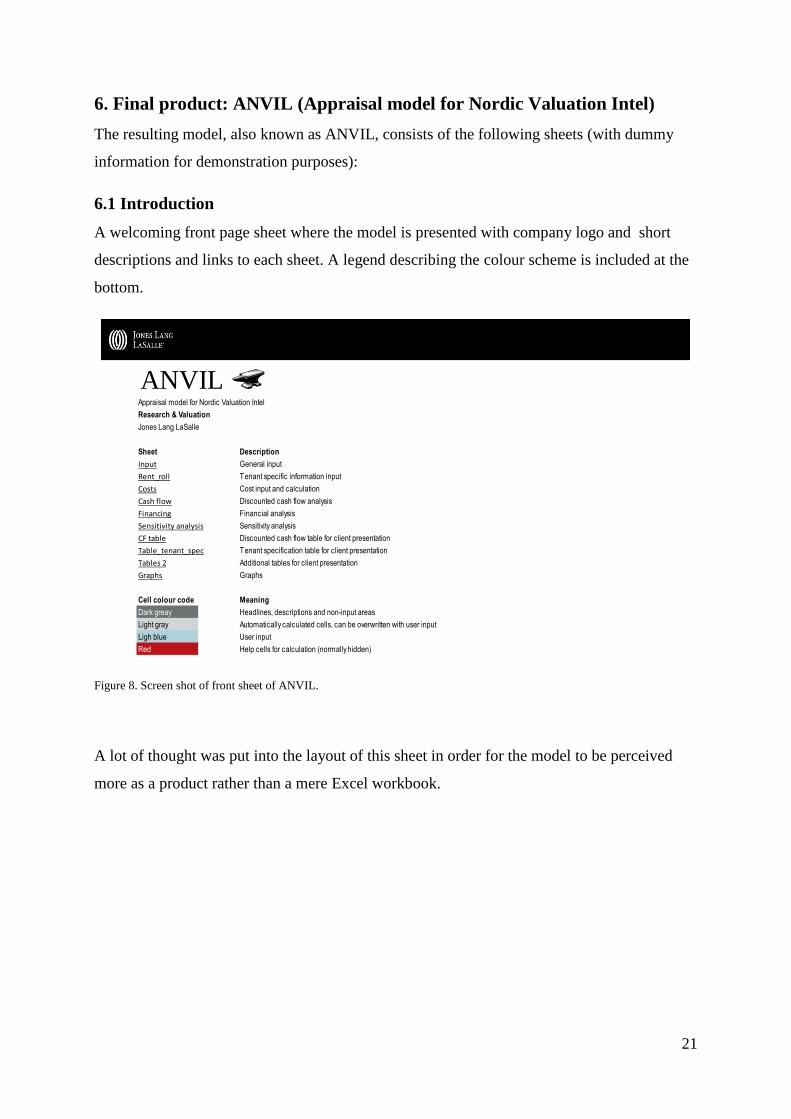
6.1 Introduction
A welcoming front page sheet where the model is presented with company logo and short
descriptions and links to each sheet. A legend describing the colour scheme is included at the
bottom.
Figure 8. Screen shot of front sheet of ANVIL.
A lot of thought was put into the layout of this sheet in order for the model to be perceived
more as a product rather than a mere Excel workbook.
Adam
ANVILAppraisal model for Nordic Valuation Intel
Research & Valuation
Jones Lang LaSalle
Sheet Description
Input General input
Rent_roll Tenant specific information input
Costs Cost input and calculation
Cash flow Discounted cash flow analysis
Financing Financial analysis
Sensitivity analysis Sensitivity analysis
CF table Discounted cash flow table for client presentation
Table_tenant_spec Tenant specification table for client presentation
Tables 2 Additional tables for client presentation
Graphs Graphs
Cell colour code Meaning
Dark greay Headlines, descriptions and non-input areas
Light gray Automatically calculated cells, can be overwritten with user input
Ligh blue User input
Red Help cells for calculation (normally hidden)
22
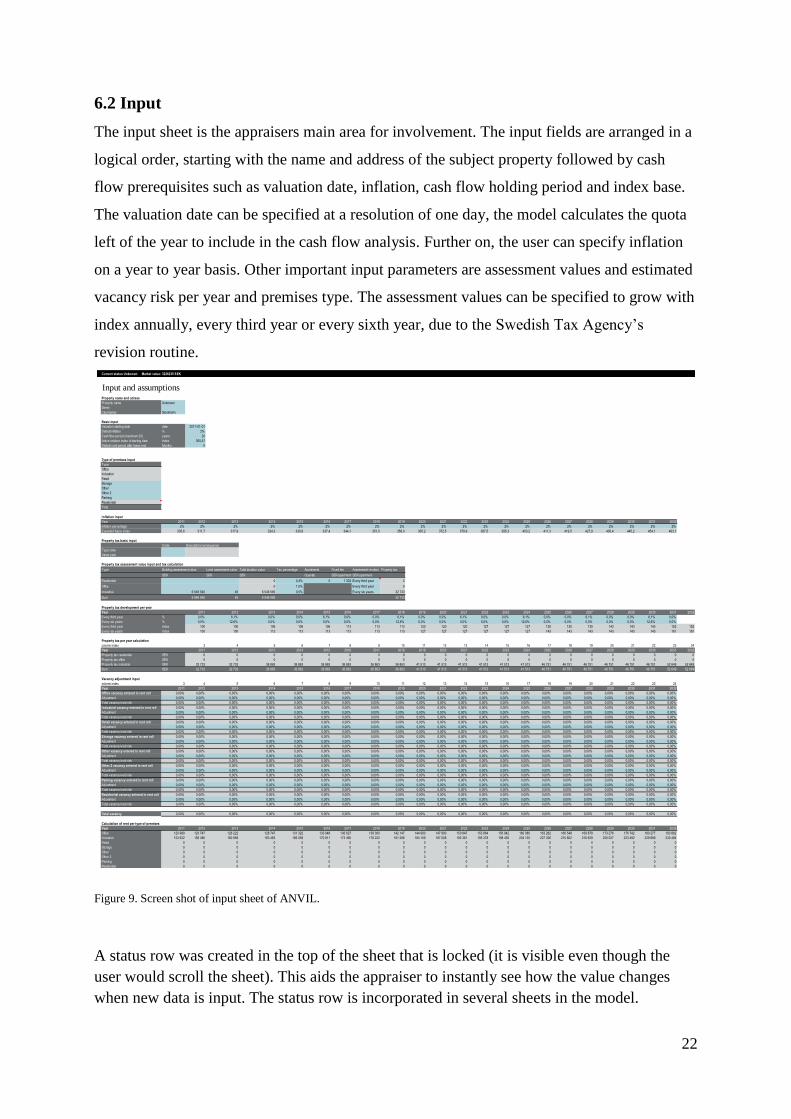
6.2 Input
The input sheet is the appraisers main area for involvement. The input fields are arranged in a
logical order, starting with the name and address of the subject property followed by cash
flow prerequisites such as valuation date, inflation, cash flow holding period and index base.
The valuation date can be specified at a resolution of one day, the model calculates the quota
left of the year to include in the cash flow analysis. Further on, the user can specify inflation
on a year to year basis. Other important input parameters are assessment values and estimated
vacancy risk per year and premises type. The assessment values can be specified to grow with
index annually, every third year or every sixth year, due to the Swedish Tax Agency’s
revision routine.
Figure 9. Screen shot of input sheet of ANVIL.
A status row was created in the top of the sheet that is locked (it is visible even though the
user would scroll the sheet). This aids the appraiser to instantly see how the value changes
when new data is input. The status row is incorporated in several sheets in the model.
Current status Unknown Market value: 3226235 SEK
Input and assumptionsProperty name and adress
Property name Unknown
Street
City/market Stockholm
Basic input
Valuation starting date date 2011-01-01
Default inflation % 2%
Cash flow period (maximum 20) years 20
Active october index of starting date index 305,57
Default void period after lease end Months 0
Type of premises input
Type
Office
Industrial
Retail
Storage
Other
Other 2
Parking
Residential
Total
Inflation input
Year 2011 2012 2013 2014 2015 2016 2017 2018 2019 2020 2021 2022 2023 2024 2025 2026 2027 2028 2029 2030 2031 2032
Inflation percentage 2% 2% 2% 2% 2% 2% 2% 2% 2% 2% 2% 2% 2% 2% 2% 2% 2% 2% 2% 2% 2% 2%
Expected future index 305,6 311,7 317,9 324,3 330,8 337,4 344,1 351,0 358,0 365,2 372,5 379,9 387,5 395,3 403,2 411,3 419,5 427,9 436,4 445,2 454,1 463,1
Property tax basic input
Code Description/consequence
Type code
Value year
Property tax assessment value input and tax calculation
Type Land assessment value Total taxation value Tax percentage Apartments Fixed fee Assessment revision Property tax
SEK SEK Quantity SEK/apartment SEK/apartment
Residential 0 0,4% 0 1 302 Every third year 0
Office 0 1,0% Every third year 0
Industrial 45 6 546 585 0,5% Every six years 32 733
Sum 45 6 546 585 32 733
Property tax development per year
Year 2011 2012 2013 2014 2015 2016 2017 2018 2019 2020 2021 2022 2023 2024 2025 2026 2027 2028 2029 2030 2031 2032
Every third year % 0,0% 6,1% 0,0% 0,0% 6,1% 0,0% 0,0% 6,1% 0,0% 0,0% 6,1% 0,0% 0,0% 6,1% 0,0% 0,0% 6,1% 0,0% 0,0% 6,1% 0,0%
Every six years % 0,0% 12,6% 0,0% 0,0% 0,0% 0,0% 0,0% 12,6% 0,0% 0,0% 0,0% 0,0% 0,0% 12,6% 0,0% 0,0% 0,0% 0,0% 0,0% 12,6% 0,0%
Every third year index 100 100 106 106 106 113 113 113 120 120 120 127 127 127 135 135 135 143 143 143 152 152
Every six years index 100 100 113 113 113 113 113 113 127 127 127 127 127 127 143 143 143 143 143 143 161 161
Property tax per year calculation
column index 3 4 5 6 7 8 9 10 11 12 13 14 15 16 17 18 19 20 21 22 23 24
Year 2011 2012 2013 2014 2015 2016 2017 2018 2019 2020 2021 2022 2023 2024 2025 2026 2027 2028 2029 2030 2031 2032
Property tax residential SEK 0 0 0 0 0 0 0 0 0 0 0 0 0 0 0 0 0 0 0 0 0 0
Property tax office SEK 0 0 0 0 0 0 0 0 0 0 0 0 0 0 0 0 0 0 0 0 0 0
Property tax industrial SEK 32 733 32 733 36 863 36 863 36 863 36 863 36 863 36 863 41 513 41 513 41 513 41 513 41 513 41 513 46 751 46 751 46 751 46 751 46 751 46 751 52 649 52 649
Sum SEK 32 733 32 733 36 863 36 863 36 863 36 863 36 863 36 863 41 513 41 513 41 513 41 513 41 513 41 513 46 751 46 751 46 751 46 751 46 751 46 751 52 649 52 649
Vacancy adjustment input
column index 3 4 5 6 7 8 9 10 11 12 13 14 15 16 17 18 19 20 21 22 23 24
Year 2011 2012 2013 2014 2015 2016 2017 2018 2019 2020 2021 2022 2023 2024 2025 2026 2027 2028 2029 2030 2031 2032
Office vacancy entered in rent roll 0,00% 0,00% 0,00% 0,00% 0,00% 0,00% 0,00% 0,00% 0,00% 0,00% 0,00% 0,00% 0,00% 0,00% 0,00% 0,00% 0,00% 0,00% 0,00% 0,00% 0,00% 0,00%
Adjustment 0,00% 0,00% 0,00% 0,00% 0,00% 0,00% 0,00% 0,00% 0,00% 0,00% 0,00% 0,00% 0,00% 0,00% 0,00% 0,00% 0,00% 0,00% 0,00% 0,00% 0,00% 0,00%
OfficeTotal vacancy/void risk 0,00% 0,00% 0,00% 0,00% 0,00% 0,00% 0,00% 0,00% 0,00% 0,00% 0,00% 0,00% 0,00% 0,00% 0,00% 0,00% 0,00% 0,00% 0,00% 0,00% 0,00% 0,00%
Industrial vacancy entered in rent roll 0,00% 0,00% 0,00% 0,00% 0,00% 0,00% 0,00% 0,00% 0,00% 0,00% 0,00% 0,00% 0,00% 0,00% 0,00% 0,00% 0,00% 0,00% 0,00% 0,00% 0,00% 0,00%
Adjustment 0,00% 0,00% 0,00% 0,00% 0,00% 0,00% 0,00% 0,00% 0,00% 0,00% 0,00% 0,00% 0,00% 0,00% 0,00% 0,00% 0,00% 0,00% 0,00% 0,00% 0,00% 0,00%
IndustrialTotal vacancy/void risk 0,00% 0,00% 0,00% 0,00% 0,00% 0,00% 0,00% 0,00% 0,00% 0,00% 0,00% 0,00% 0,00% 0,00% 0,00% 0,00% 0,00% 0,00% 0,00% 0,00% 0,00% 0,00%
Retail vacancy entered in rent roll 0,00% 0,00% 0,00% 0,00% 0,00% 0,00% 0,00% 0,00% 0,00% 0,00% 0,00% 0,00% 0,00% 0,00% 0,00% 0,00% 0,00% 0,00% 0,00% 0,00% 0,00% 0,00%
Adjustment 0,00% 0,00% 0,00% 0,00% 0,00% 0,00% 0,00% 0,00% 0,00% 0,00% 0,00% 0,00% 0,00% 0,00% 0,00% 0,00% 0,00% 0,00% 0,00% 0,00% 0,00% 0,00%
RetailTotal vacancy/void risk 0,00% 0,00% 0,00% 0,00% 0,00% 0,00% 0,00% 0,00% 0,00% 0,00% 0,00% 0,00% 0,00% 0,00% 0,00% 0,00% 0,00% 0,00% 0,00% 0,00% 0,00% 0,00%
Storage vacancy entered in rent roll 0,00% 0,00% 0,00% 0,00% 0,00% 0,00% 0,00% 0,00% 0,00% 0,00% 0,00% 0,00% 0,00% 0,00% 0,00% 0,00% 0,00% 0,00% 0,00% 0,00% 0,00% 0,00%
Adjustment 0,00% 0,00% 0,00% 0,00% 0,00% 0,00% 0,00% 0,00% 0,00% 0,00% 0,00% 0,00% 0,00% 0,00% 0,00% 0,00% 0,00% 0,00% 0,00% 0,00% 0,00% 0,00%
StorageTotal vacancy/void risk 0,00% 0,00% 0,00% 0,00% 0,00% 0,00% 0,00% 0,00% 0,00% 0,00% 0,00% 0,00% 0,00% 0,00% 0,00% 0,00% 0,00% 0,00% 0,00% 0,00% 0,00% 0,00%
Other vacancy entered in rent roll 0,00% 0,00% 0,00% 0,00% 0,00% 0,00% 0,00% 0,00% 0,00% 0,00% 0,00% 0,00% 0,00% 0,00% 0,00% 0,00% 0,00% 0,00% 0,00% 0,00% 0,00% 0,00%
Adjustment 0,00% 0,00% 0,00% 0,00% 0,00% 0,00% 0,00% 0,00% 0,00% 0,00% 0,00% 0,00% 0,00% 0,00% 0,00% 0,00% 0,00% 0,00% 0,00% 0,00% 0,00% 0,00%
OtherTotal vacancy/void risk 0,00% 0,00% 0,00% 0,00% 0,00% 0,00% 0,00% 0,00% 0,00% 0,00% 0,00% 0,00% 0,00% 0,00% 0,00% 0,00% 0,00% 0,00% 0,00% 0,00% 0,00% 0,00%
Other 2 vacancy entered in rent roll 0,00% 0,00% 0,00% 0,00% 0,00% 0,00% 0,00% 0,00% 0,00% 0,00% 0,00% 0,00% 0,00% 0,00% 0,00% 0,00% 0,00% 0,00% 0,00% 0,00% 0,00% 0,00%
Adjustment 0,00% 0,00% 0,00% 0,00% 0,00% 0,00% 0,00% 0,00% 0,00% 0,00% 0,00% 0,00% 0,00% 0,00% 0,00% 0,00% 0,00% 0,00% 0,00% 0,00% 0,00% 0,00%
Other 2Total vacancy/void risk 0,00% 0,00% 0,00% 0,00% 0,00% 0,00% 0,00% 0,00% 0,00% 0,00% 0,00% 0,00% 0,00% 0,00% 0,00% 0,00% 0,00% 0,00% 0,00% 0,00% 0,00% 0,00%
Parking vacancy entered in rent roll 0,00% 0,00% 0,00% 0,00% 0,00% 0,00% 0,00% 0,00% 0,00% 0,00% 0,00% 0,00% 0,00% 0,00% 0,00% 0,00% 0,00% 0,00% 0,00% 0,00% 0,00% 0,00%
Adjustment 0,00% 0,00% 0,00% 0,00% 0,00% 0,00% 0,00% 0,00% 0,00% 0,00% 0,00% 0,00% 0,00% 0,00% 0,00% 0,00% 0,00% 0,00% 0,00% 0,00% 0,00% 0,00%
ParkingTotal vacancy/void risk 0,00% 0,00% 0,00% 0,00% 0,00% 0,00% 0,00% 0,00% 0,00% 0,00% 0,00% 0,00% 0,00% 0,00% 0,00% 0,00% 0,00% 0,00% 0,00% 0,00% 0,00% 0,00%
Residential vacancy entered in rent roll 0,00% 0,00% 0,00% 0,00% 0,00% 0,00% 0,00% 0,00% 0,00% 0,00% 0,00% 0,00% 0,00% 0,00% 0,00% 0,00% 0,00% 0,00% 0,00% 0,00% 0,00% 0,00%
Adjustment 0,00% 0,00% 0,00% 0,00% 0,00% 0,00% 0,00% 0,00% 0,00% 0,00% 0,00% 0,00% 0,00% 0,00% 0,00% 0,00% 0,00% 0,00% 0,00% 0,00% 0,00% 0,00%
ResidentialTotal vacancy/void risk 0,00% 0,00% 0,00% 0,00% 0,00% 0,00% 0,00% 0,00% 0,00% 0,00% 0,00% 0,00% 0,00% 0,00% 0,00% 0,00% 0,00% 0,00% 0,00% 0,00% 0,00% 0,00%
Total vacancy 0,00% 0,00% 0,00% 0,00% 0,00% 0,00% 0,00% 0,00% 0,00% 0,00% 0,00% 0,00% 0,00% 0,00% 0,00% 0,00% 0,00% 0,00% 0,00% 0,00% 0,00% 0,00%
Calculation of rent per type of premises
Year 2011 2012 2013 2014 2015 2016 2017 2018 2019 2020 2021 2022 2023 2024 2025 2026 2027 2028 2029 2030 2031 2032
Office 120 989 123 747 126 222 128 747 131 322 133 948 136 627 139 360 142 147 144 990 147 890 150 847 153 864 156 942 160 080 163 282 166 548 169 879 173 276 176 742 180 277 183 882
Industrial 153 632 156 480 160 959 163 483 166 058 170 811 173 490 176 222 181 266 184 109 187 008 192 361 195 378 198 455 204 135 207 336 210 602 216 629 220 027 223 492 229 889 233 494
Retail 0 0 0 0 0 0 0 0 0 0 0 0 0 0 0 0 0 0 0 0 0 0
Storage 0 0 0 0 0 0 0 0 0 0 0 0 0 0 0 0 0 0 0 0 0 0
Other 0 0 0 0 0 0 0 0 0 0 0 0 0 0 0 0 0 0 0 0 0 0
Other 2 0 0 0 0 0 0 0 0 0 0 0 0 0 0 0 0 0 0 0 0 0 0
Parking 0 0 0 0 0 0 0 0 0 0 0 0 0 0 0 0 0 0 0 0 0 0
Residential 0 0 0 0 0 0 0 0 0 0 0 0 0 0 0 0 0 0 0 0 0 0
6 546 540
Building assessment value
SEK
6 546 540
23
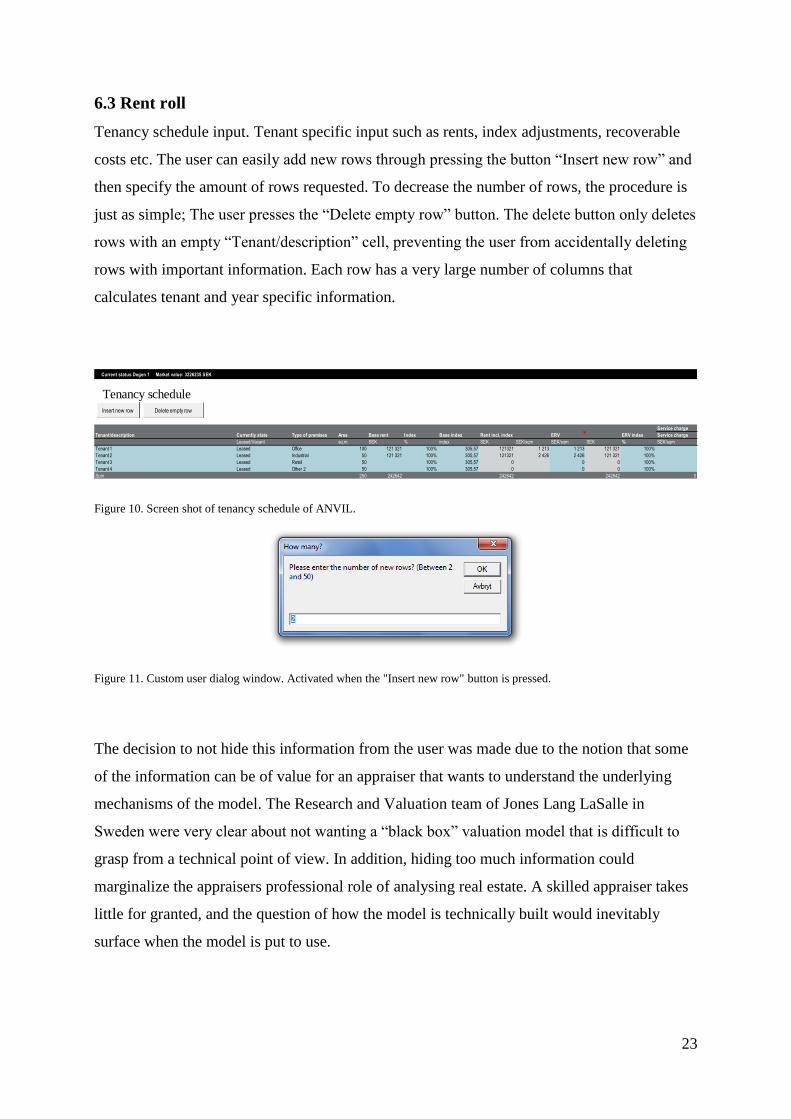
6.3 Rent roll
Tenancy schedule input. Tenant specific input such as rents, index adjustments, recoverable
costs etc. The user can easily add new rows through pressing the button “Insert new row” and
then specify the amount of rows requested. To decrease the number of rows, the procedure is
just as simple; The user presses the “Delete empty row” button. The delete button only deletes
rows with an empty “Tenant/description” cell, preventing the user from accidentally deleting
rows with important information. Each row has a very large number of columns that
calculates tenant and year specific information.
Figure 10. Screen shot of tenancy schedule of ANVIL.
Figure 11. Custom user dialog window. Activated when the "Insert new row" button is pressed.
The decision to not hide this information from the user was made due to the notion that some
of the information can be of value for an appraiser that wants to understand the underlying
mechanisms of the model. The Research and Valuation team of Jones Lang LaSalle in
Sweden were very clear about not wanting a “black box” valuation model that is difficult to
grasp from a technical point of view. In addition, hiding too much information could
marginalize the appraisers professional role of analysing real estate. A skilled appraiser takes
little for granted, and the question of how the model is technically built would inevitably
surface when the model is put to use.
Current status Degen 1 Market value: 3226235 SEK
Tenancy schedule
Service charge
Tenant/description Currently state Type of premises Area Base rent Index Base index Rent incl. index ERV ERV index Service charge
Leased/Vacant sq.m. SEK % index SEK SEK/sqm SEK/sqm SEK % SEK/sqm
Tenant 1 Leased Office 100 121 321 100% 305,57 121321 1 213 1 213 121 321 100%
Tenant 2 Leased Industrial 50 121 321 100% 305,57 121321 2 426 2 426 121 321 100%
Tenant 3 Leased Retail 50 100% 305,57 0 0 0 100%
Tenant 4 Leased Other 2 50 100% 305,57 0 0 0 100%
Sum 250 242642 242642 242642 0
Insert new row Delete empty row
24
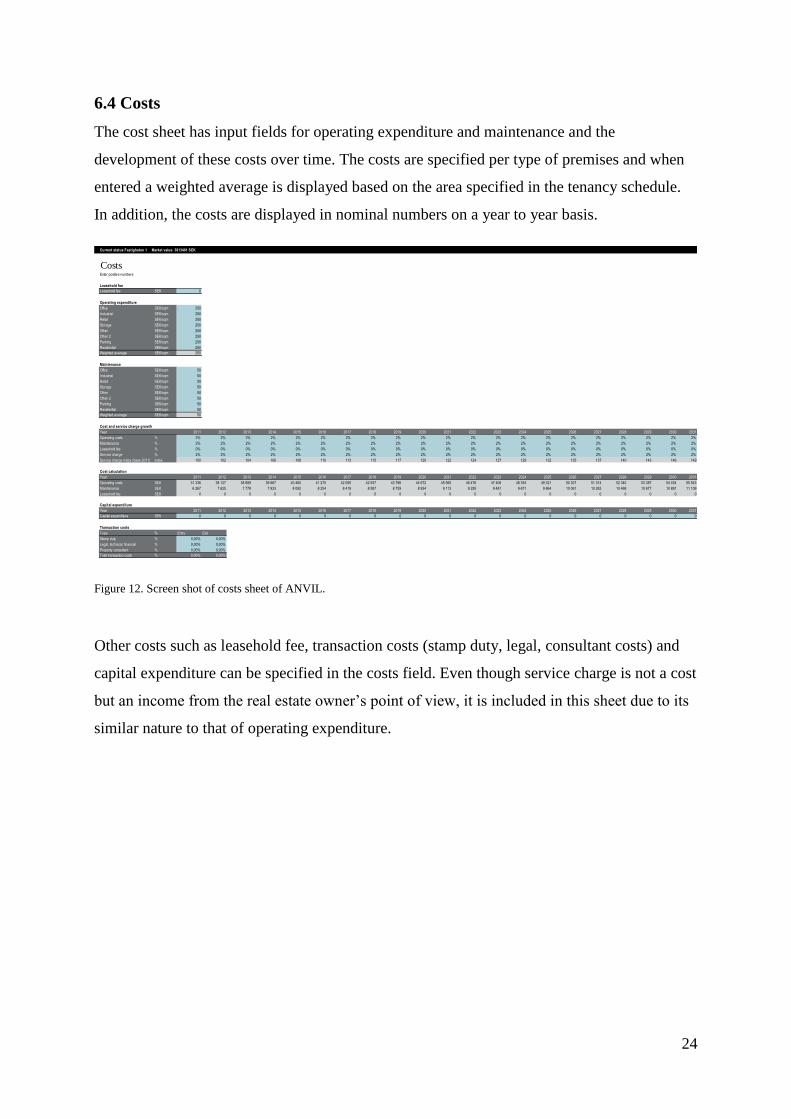
6.4 Costs
The cost sheet has input fields for operating expenditure and maintenance and the
development of these costs over time. The costs are specified per type of premises and when
entered a weighted average is displayed based on the area specified in the tenancy schedule.
In addition, the costs are displayed in nominal numbers on a year to year basis.
Figure 12. Screen shot of costs sheet of ANVIL.
Other costs such as leasehold fee, transaction costs (stamp duty, legal, consultant costs) and
capital expenditure can be specified in the costs field. Even though service charge is not a cost
but an income from the real estate owner’s point of view, it is included in this sheet due to its
similar nature to that of operating expenditure.
Current status Fastigheten 1 Market value: 3813401 SEK
Costs 1 1 1 1 1 1 1 1 1 1 1 1 1 1 1 1 1 1 1
Enter positive numbers
Leasehold fee
Leasehold fee SEK 0
Operating expenditure
Office SEK/sqm 250
Industrial SEK/sqm 250
Retail SEK/sqm 250
Storage SEK/sqm 250
Other SEK/sqm 250
Other 2 SEK/sqm 250
Parking SEK/sqm 250
Residential SEK/sqm 250
Weighted average SEK/sqm 250
Maintenance
Office SEK/sqm 50
Industrial SEK/sqm 50
Retail SEK/sqm 50
Storage SEK/sqm 50
Other SEK/sqm 50
Other 2 SEK/sqm 50
Parking SEK/sqm 50
Residential SEK/sqm 50
Weighted average SEK/sqm 50
Cost and service charge growth
Year 2011 2012 2013 2014 2015 2016 2017 2018 2019 2020 2021 2022 2023 2024 2025 2026 2027 2028 2029 2030 2031
Operating costs % 2% 2% 2% 2% 2% 2% 2% 2% 2% 2% 2% 2% 2% 2% 2% 2% 2% 2% 2% 2% 2%
Maintainance % 2% 2% 2% 2% 2% 2% 2% 2% 2% 2% 2% 2% 2% 2% 2% 2% 2% 2% 2% 2% 2%
Leasehold fee % 0% 0% 0% 0% 0% 0% 0% 0% 0% 0% 0% 0% 0% 0% 0% 0% 0% 0% 0% 0% 0%
Service charge % 2% 2% 2% 2% 2% 2% 2% 2% 2% 2% 2% 2% 2% 2% 2% 2% 2% 2% 2% 2% 2%
Service charge index (base 2011) index 100 102 104 106 108 110 113 115 117 120 122 124 127 129 132 135 137 140 143 146 149
Cost calculation
Year 2011 2012 2013 2014 2015 2016 2017 2018 2019 2020 2021 2022 2023 2024 2025 2026 2027 2028 2029 2030 2031
Operating costs SEK 31 336 38 127 38 889 39 667 40 460 41 270 42 095 42 937 43 796 44 672 45 565 46 476 47 406 48 354 49 321 50 307 51 314 52 340 53 387 54 454 55 543
Maintainance SEK 6 267 7 625 7 778 7 933 8 092 8 254 8 419 8 587 8 759 8 934 9 113 9 295 9 481 9 671 9 864 10 061 10 263 10 468 10 677 10 891 11 109
Leasehold fee SEK 0 0 0 0 0 0 0 0 0 0 0 0 0 0 0 0 0 0 0 0 0
Capital expenditure
Year 2011 2012 2013 2014 2015 2016 2017 2018 2019 2020 2021 2022 2023 2024 2025 2026 2027 2028 2029 2030 2031
Capital expenditure SEK 0 0 0 0 0 0 0 0 0 0 0 0 0 0 0 0 0 0 0 0 0
Transaction costs
Type % Entry Exit
Stamp duty % 0,00% 0,00%
Legal, technical, financial % 0,00% 0,00%
Property consultant % 0,00% 0,00%
Total transaction costs % 0,00% 0,00%
25
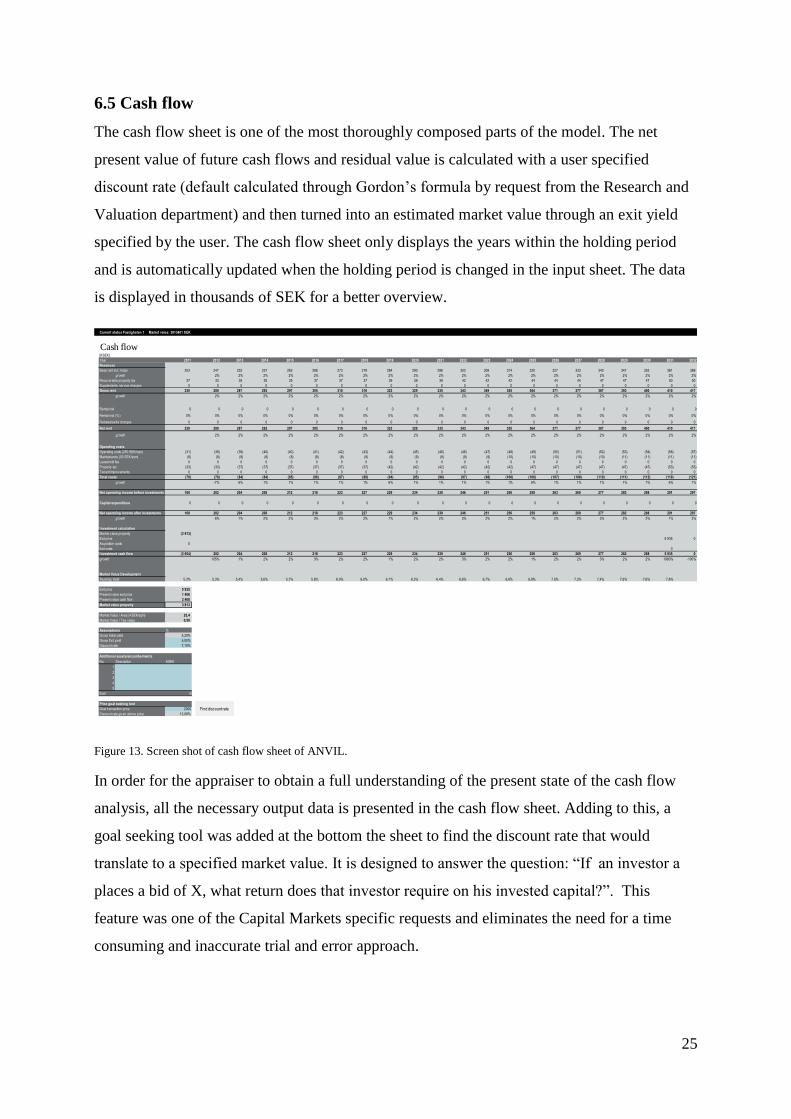
6.5 Cash flow
The cash flow sheet is one of the most thoroughly composed parts of the model. The net
present value of future cash flows and residual value is calculated with a user specified
discount rate (default calculated through Gordon’s formula by request from the Research and
Valuation department) and then turned into an estimated market value through an exit yield
specified by the user. The cash flow sheet only displays the years within the holding period
and is automatically updated when the holding period is changed in the input sheet. The data
is displayed in thousands of SEK for a better overview.
Figure 13. Screen shot of cash flow sheet of ANVIL.
In order for the appraiser to obtain a full understanding of the present state of the cash flow
analysis, all the necessary output data is presented in the cash flow sheet. Adding to this, a
goal seeking tool was added at the bottom the sheet to find the discount rate that would
translate to a specified market value. It is designed to answer the question: “If an investor a
places a bid of X, what return does that investor require on his invested capital?”. This
feature was one of the Capital Markets specific requests and eliminates the need for a time
consuming and inaccurate trial and error approach.
Current status Fastigheten 1 Market value: 3813401 SEK
Cash flow 1 1 1 1 1 1 1 1 1 1 1 1 1 1 1 1 1 1 1 1
[KSEK]
Year 2011 2012 2013 2014 2015 2016 2017 2018 2019 2020 2021 2022 2023 2024 2025 2026 2027 2028 2029 2030 2031 2032
Revenues
Base rent incl. Index 203 247 252 257 263 268 273 279 284 290 296 302 308 314 320 327 333 340 347 353 361 368
growth 2% 2% 2% 2% 2% 2% 2% 2% 2% 2% 2% 2% 2% 2% 2% 2% 2% 2% 2% 2% 2%
Recoverable property tax 27 33 35 35 35 37 37 37 39 39 39 42 42 42 44 44 44 47 47 47 50 50
Supplements, service charges 0 0 0 0 0 0 0 0 0 0 0 0 0 0 0 0 0 0 0 0 0 0
Gross rent 230 280 287 292 297 305 310 316 323 329 335 343 349 355 364 371 377 387 393 400 410 417
growth 2% 2% 2% 2% 2% 2% 2% 2% 2% 2% 2% 2% 2% 2% 2% 2% 2% 2% 2% 2% 2%
Rental risk 0 0 0 0 0 0 0 0 0 0 0 0 0 0 0 0 0 0 0 0 0 0
Rental risk (% ) 0% 0% 0% 0% 0% 0% 0% 0% 0% 0% 0% 0% 0% 0% 0% 0% 0% 0% 0% 0% 0% 0%
Rebates/extra charges 0 0 0 0 0 0 0 0 0 0 0 0 0 0 0 0 0 0 0 0 0 0
Net rent 230 280 287 292 297 305 310 316 323 329 335 343 349 355 364 371 377 387 393 400 410 417
growth 2% 2% 2% 2% 2% 2% 2% 2% 2% 2% 2% 2% 2% 2% 2% 2% 2% 2% 2% 2% 2%
Operating costs
Operating costs (250 SEK/sqm) (31) (38) (39) (40) (40) (41) (42) (43) (44) (45) (46) (46) (47) (48) (49) (50) (51) (52) (53) (54) (56) (57)
Maintainance (50 SEK/sqm) (6) (8) (8) (8) (8) (8) (8) (9) (9) (9) (9) (9) (9) (10) (10) (10) (10) (10) (11) (11) (11) (11)
Leasehold fee 0 0 0 0 0 0 0 0 0 0 0 0 0 0 0 0 0 0 0 0 0 0
Property tax (33) (33) (37) (37) (37) (37) (37) (37) (42) (42) (42) (42) (42) (42) (47) (47) (47) (47) (47) (47) (53) (53)
Tenant improvements 0 0 0 0 0 0 0 0 0 0 0 0 0 0 0 0 0 0 0 0 0 0
Total costs (70) (78) (84) (84) (85) (86) (87) (88) (94) (95) (96) (97) (98) (100) (106) (107) (108) (110) (111) (112) (119) (121)
growth -7% 6% 1% 1% 1% 1% 1% 6% 1% 1% 1% 1% 1% 6% 1% 1% 1% 1% 1% 6% 1%
Net operating income before investments 160 202 204 208 212 218 223 227 229 234 239 246 251 256 258 263 269 277 282 288 291 297
Capital expenditure 0 0 0 0 0 0 0 0 0 0 0 0 0 0 0 0 0 0 0 0 0 0
Net operating income after investments 160 202 204 208 212 218 223 227 229 234 239 246 251 256 258 263 269 277 282 288 291 297
growth 6% 1% 2% 2% 3% 2% 2% 1% 2% 2% 3% 2% 2% 1% 2% 2% 3% 2% 2% 1% 2%
Investment calculation
Market value property (3 813)
Exit price 5 935 0
Acquisition costs 0
Exit costs 0
Investment cash flow (3 654) 202 204 208 212 218 223 227 229 234 239 246 251 256 258 263 269 277 282 288 5 935 0
growth 105% 1% 2% 2% 3% 2% 2% 1% 2% 2% 3% 2% 2% 1% 2% 2% 3% 2% 2% 1960% -100%
Market Value Development
Running Yield 5,3% 5,3% 5,4% 5,6% 5,7% 5,8% 6,0% 6,0% 6,1% 6,3% 6,4% 6,6% 6,7% 6,8% 6,9% 7,0% 7,3% 7,4% 7,6% 7,6% 7,8%
Exit price 5 935
Present value exit price 1 406
Present value cash flow 2 408
Market value property 3 813
Market Value / Area (KSEK/sqm) 25,4
Market Value / Tax value 0,58
Assumptions %
Gross Initial yield 5,29%
Gross Exit yield 5,00%
Discount rate 7,10%
Additional assets/encumberments
No Description KSEK
1
2
3
4
5
Sum 0
Price goal seeking tool
Goal transaction price 2000
Discount rate given above price 13,08%
Find discount rate
26
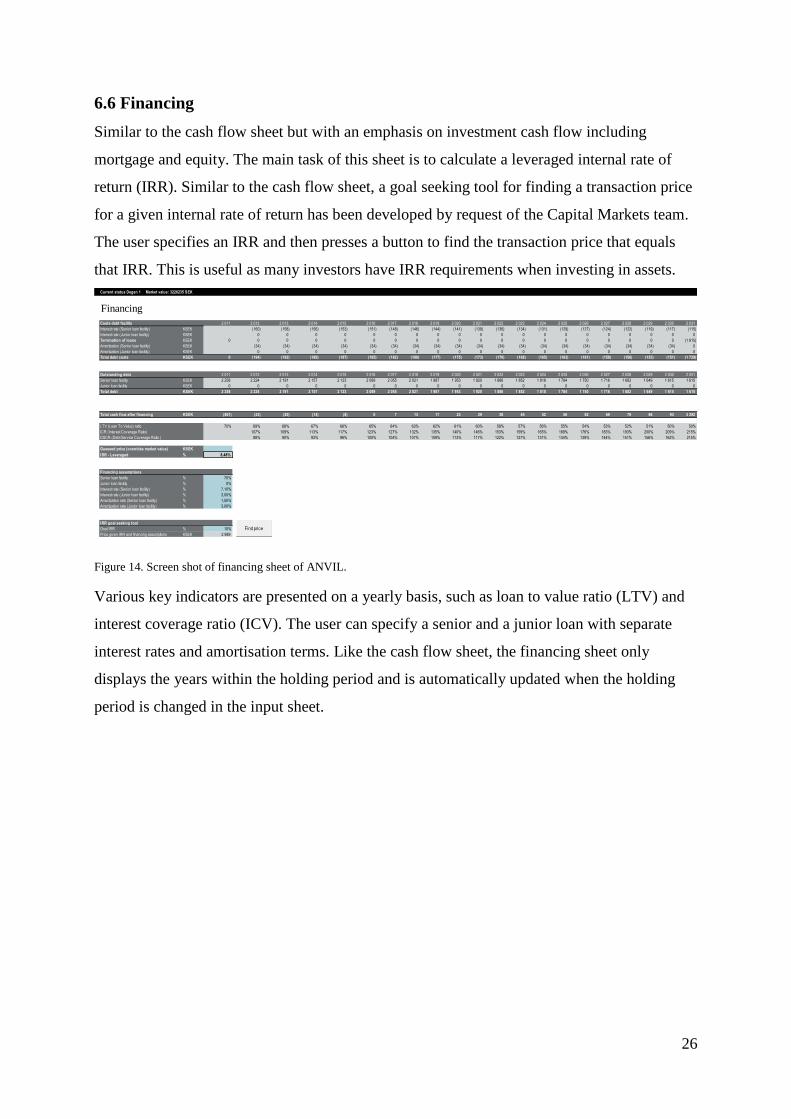
6.6 Financing
Similar to the cash flow sheet but with an emphasis on investment cash flow including
mortgage and equity. The main task of this sheet is to calculate a leveraged internal rate of
return (IRR). Similar to the cash flow sheet, a goal seeking tool for finding a transaction price
for a given internal rate of return has been developed by request of the Capital Markets team.
The user specifies an IRR and then presses a button to find the transaction price that equals
that IRR. This is useful as many investors have IRR requirements when investing in assets.
Figure 14. Screen shot of financing sheet of ANVIL.
Various key indicators are presented on a yearly basis, such as loan to value ratio (LTV) and
interest coverage ratio (ICV). The user can specify a senior and a junior loan with separate
interest rates and amortisation terms. Like the cash flow sheet, the financing sheet only
displays the years within the holding period and is automatically updated when the holding
period is changed in the input sheet.
Current status Degen 1 Market value: 3226235 SEK
Financing 1 1 1 1 1 1 1 1 1 1 1 1 1 1 1 1 1 1 1
Costs debt facility 2 011 2 012 2 013 2 014 2 015 2 016 2 017 2 018 2 019 2 020 2 021 2 022 2 023 2 024 2 025 2 026 2 027 2 028 2 029 2 030 2 031
Interest rate (Senior loan facility) KSEK (160) (158) (156) (153) (151) (148) (146) (144) (141) (139) (136) (134) (131) (129) (127) (124) (122) (119) (117) (115)
Interest rate (Junior loan facility) KSEK 0 0 0 0 0 0 0 0 0 0 0 0 0 0 0 0 0 0 0 0
Termination of loans KSEK 0 0 0 0 0 0 0 0 0 0 0 0 0 0 0 0 0 0 0 0 (1 615)
Amortization (Senior loan facility) KSEK (34) (34) (34) (34) (34) (34) (34) (34) (34) (34) (34) (34) (34) (34) (34) (34) (34) (34) (34) 0
Amortization (Junior loan facility) KSEK 0 0 0 0 0 0 0 0 0 0 0 0 0 0 0 0 0 0 0 0
Total debt costs KSEK 0 (194) (192) (189) (187) (185) (182) (180) (177) (175) (173) (170) (168) (165) (163) (161) (158) (156) (153) (151) (1 729)
Outstanding debt 2 011 2 012 2 013 2 014 2 015 2 016 2 017 2 018 2 019 2 020 2 021 2 022 2 023 2 024 2 025 2 026 2 027 2 028 2 029 2 030 2 031
Senior loan facility KSEK 2 258 2 224 2 191 2 157 2 123 2 089 2 055 2 021 1 987 1 953 1 920 1 886 1 852 1 818 1 784 1 750 1 716 1 682 1 649 1 615 1 615
Junior loan facility KSEK 0 0 0 0 0 0 0 0 0 0 0 0 0 0 0 0 0 0 0 0 0
Total debt KSEK 2 258 2 224 2 191 2 157 2 123 2 089 2 055 2 021 1 987 1 953 1 920 1 886 1 852 1 818 1 784 1 750 1 716 1 682 1 649 1 615 1 615
Total cash flow after financing KSEK (801) (23) (20) (14) (8) 0 7 13 17 23 29 38 45 52 56 62 69 79 86 93 3 292
LTV (Loan To Value) ratio 70% 69% 68% 67% 66% 65% 64% 63% 62% 61% 60% 58% 57% 56% 55% 54% 53% 52% 51% 50% 50%
ICR (Interest Coverage Ratio) 107% 109% 113% 117% 123% 127% 132% 135% 140% 146% 153% 159% 165% 169% 176% 183% 193% 200% 209% 215%
DSCR (Debt Service Coverage Ratio ) 88% 90% 93% 96% 100% 104% 107% 109% 113% 117% 122% 127% 131% 134% 139% 144% 151% 156% 162% 215%
Guessed price (overrides market value) KSEK
IRR - Leveraged % 8,48%
Financing assumptions
Senior loan facility % 70%
Junior loan facility % 0%
Interest rate (Senior loan facility) % 7,10%
Interest rate (Junior loan facility) % 3,00%
Amortization rate (Senior loan facility) % 1,50%
Amortization rate (Junior loan facility) % 3,00%
IRR goal seeking tool
Goal IRR % 10%
Price given IRR and financing assumptions KSEK 2 989
Find price
27
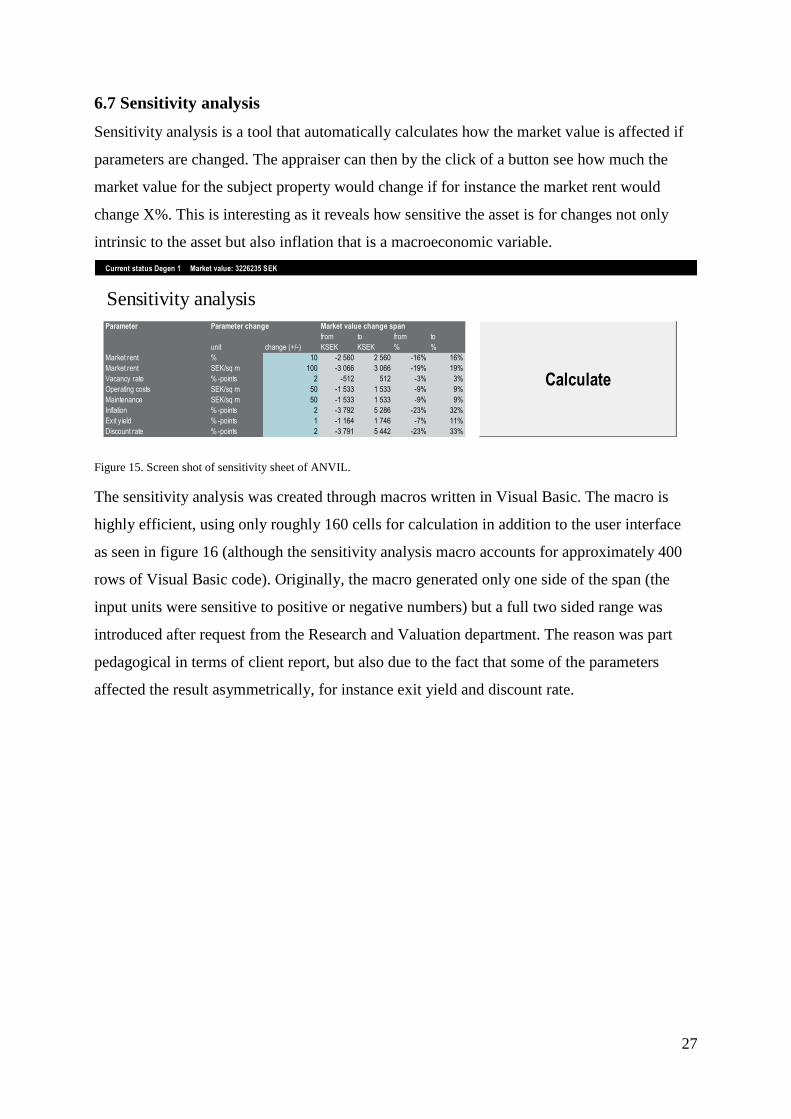
6.7 Sensitivity analysis
Sensitivity analysis is a tool that automatically calculates how the market value is affected if
parameters are changed. The appraiser can then by the click of a button see how much the
market value for the subject property would change if for instance the market rent would
change X%. This is interesting as it reveals how sensitive the asset is for changes not only
intrinsic to the asset but also inflation that is a macroeconomic variable.
Figure 15. Screen shot of sensitivity sheet of ANVIL.
The sensitivity analysis was created through macros written in Visual Basic. The macro is
highly efficient, using only roughly 160 cells for calculation in addition to the user interface
as seen in figure 16 (although the sensitivity analysis macro accounts for approximately 400
rows of Visual Basic code). Originally, the macro generated only one side of the span (the
input units were sensitive to positive or negative numbers) but a full two sided range was
introduced after request from the Research and Valuation department. The reason was part
pedagogical in terms of client report, but also due to the fact that some of the parameters
affected the result asymmetrically, for instance exit yield and discount rate.
Current status Degen 1 Market value: 3226235 SEK
Sensitivity analysis
Parameter Parameter change
from to from to
unit change (+/-) KSEK KSEK % %
Market rent % 10 -2 560 2 560 -16% 16%
Market rent SEK/sq m 100 -3 066 3 066 -19% 19%
Vacancy rate % -points 2 -512 512 -3% 3%
Operating costs SEK/sq m 50 -1 533 1 533 -9% 9%
Maintenance SEK/sq m 50 -1 533 1 533 -9% 9%
Inflation % -points 2 -3 792 5 286 -23% 32%
Exit yield % -points 1 -1 164 1 746 -7% 11%
Discount rate % -points 2 -3 791 5 442 -23% 33%
Market value change span
Calculate
28
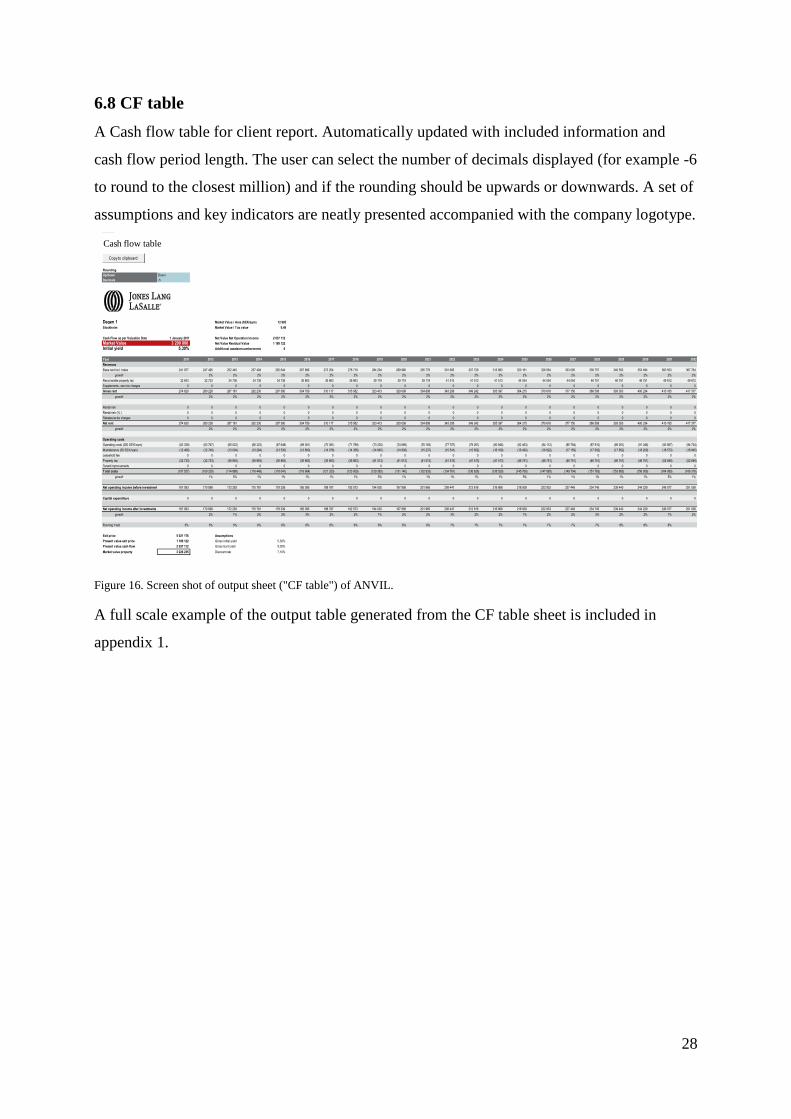
6.8 CF table
A Cash flow table for client report. Automatically updated with included information and
cash flow period length. The user can select the number of decimals displayed (for example -6
to round to the closest million) and if the rounding should be upwards or downwards. A set of
assumptions and key indicators are neatly presented accompanied with the company logotype.
Figure 16. Screen shot of output sheet ("CF table") of ANVIL.
A full scale example of the output table generated from the CF table sheet is included in
appendix 1.
Cash flow table
1 1 1 1 1 1 1 1 1 1 1 1 1 1 1 1 1 1 1
Rounding
Up/down Down
Decimals -5
Degen 1 Market Value / Area (SEK/sqm) 12 905
Stockholm Market Value / Tax value 0,49
Cash Flow as per Valuation Date 1 January 2011 Net Value Net Operation Income 2 037 112
Market Value 3 200 000 Net Value Residual Value 1 189 122
Initial yield 5,30% Additional assets/encumberments 0
Year 2011 2012 2013 2014 2015 2016 2017 2018 2019 2020 2021 2022 2023 2024 2025 2026 2027 2028 2029 2030 2031 2032
Revenues
Base rent incl. Index 241 977 247 495 252 445 257 494 262 644 267 896 273 254 278 719 284 294 289 980 295 779 301 695 307 729 313 883 320 161 326 564 333 095 339 757 346 553 353 484 360 553 367 764
growth 2% 2% 2% 2% 2% 2% 2% 2% 2% 2% 2% 2% 2% 2% 2% 2% 2% 2% 2% 2% 2%
Recoverable property tax 32 643 32 733 34 736 34 736 34 736 36 863 36 863 36 863 39 119 39 119 39 119 41 513 41 513 41 513 44 054 44 054 44 054 46 751 46 751 46 751 49 612 49 612
Supplements, serv ice charges 0 0 0 0 0 0 0 0 0 0 0 0 0 0 0 0 0 0 0 0 0 0
Gross rent 274 620 280 228 287 181 292 230 297 380 304 759 310 117 315 582 323 413 329 099 334 898 343 208 349 242 355 397 364 215 370 618 377 150 386 508 393 303 400 234 410 165 417 377
growth 2% 2% 2% 2% 2% 2% 2% 2% 2% 2% 2% 2% 2% 2% 2% 2% 2% 2% 2% 2% 2%
Rental risk 0 0 0 0 0 0 0 0 0 0 0 0 0 0 0 0 0 0 0 0 0 0
Rental risk (% ) 0 0 0 0 0 0 0 0 0 0 0 0 0 0 0 0 0 0 0 0 0 0
Rebates/extra charges 0 0 0 0 0 0 0 0 0 0 0 0 0 0 0 0 0 0 0 0 0 0
Net rent 274 620 280 228 287 181 292 230 297 380 304 759 310 117 315 582 323 413 329 099 334 898 343 208 349 242 355 397 364 215 370 618 377 150 386 508 393 303 400 234 410 165 417 377
growth 2% 2% 2% 2% 2% 2% 2% 2% 2% 2% 2% 2% 2% 2% 2% 2% 2% 2% 2% 2% 2%
Operating costs
Operating costs (250 SEK/sqm) (62 329) (63 747) (65 022) (66 322) (67 648) (69 001) (70 381) (71 789) (73 225) (74 689) (76 183) (77 707) (79 261) (80 846) (82 463) (84 112) (85 794) (87 510) (89 261) (91 046) (92 867) (94 724)
Maintainance (50 SEK/sqm) (12 466) (12 749) (13 004) (13 264) (13 530) (13 800) (14 076) (14 358) (14 645) (14 938) (15 237) (15 541) (15 852) (16 169) (16 493) (16 822) (17 159) (17 502) (17 852) (18 209) (18 573) (18 945)
Leasehold fee 0 0 0 0 0 0 0 0 0 0 0 0 0 0 0 0 0 0 0 0 0 0
Property tax (32 733) (32 733) (36 863) (36 863) (36 863) (36 863) (36 863) (36 863) (41 513) (41 513) (41 513) (41 513) (41 513) (41 513) (46 751) (46 751) (46 751) (46 751) (46 751) (46 751) (52 649) (52 649)
Tenant improvements 0 0 0 0 0 0 0 0 0 0 0 0 0 0 0 0 0 0 0 0 0 0
Total costs (107 527) (109 229) (114 888) (116 449) (118 041) (119 664) (121 320) (123 009) (129 383) (131 140) (132 933) (134 761) (136 626) (138 529) (145 706) (147 685) (149 704) (151 763) (153 863) (156 006) (164 089) (166 318)
growth 1% 5% 1% 1% 1% 1% 1% 5% 1% 1% 1% 1% 1% 5% 1% 1% 1% 1% 1% 5% 1%
Net operating income before investments 167 093 170 999 172 293 175 781 179 339 185 095 188 797 192 573 194 030 197 958 201 965 208 447 212 616 216 868 218 509 222 933 227 446 234 745 239 440 244 229 246 077 251 059
Capital expenditure 0 0 0 0 0 0 0 0 0 0 0 0 0 0 0 0 0 0 0 0 0 0
Net operating income after investments 167 093 170 999 172 293 175 781 179 339 185 095 188 797 192 573 194 030 197 958 201 965 208 447 212 616 216 868 218 509 222 933 227 446 234 745 239 440 244 229 246 077 251 059
growth 2% 1% 2% 2% 3% 2% 2% 1% 2% 2% 3% 2% 2% 1% 2% 2% 3% 2% 2% 1% 2%
Running Yield 5% 5% 5% 6% 6% 6% 6% 6% 6% 6% 6% 7% 7% 7% 7% 7% 7% 7% 8% 8% 8%
Exit price 5 021 176 Assumptions
Present value exit price 1 189 122 Gross Initial y ield 5,30%
Present value cash flow 2 037 112 Gross Exit y ield 5,00%
Market value property 3 226 235 Discount rate 7,10%
Copy to clipboard
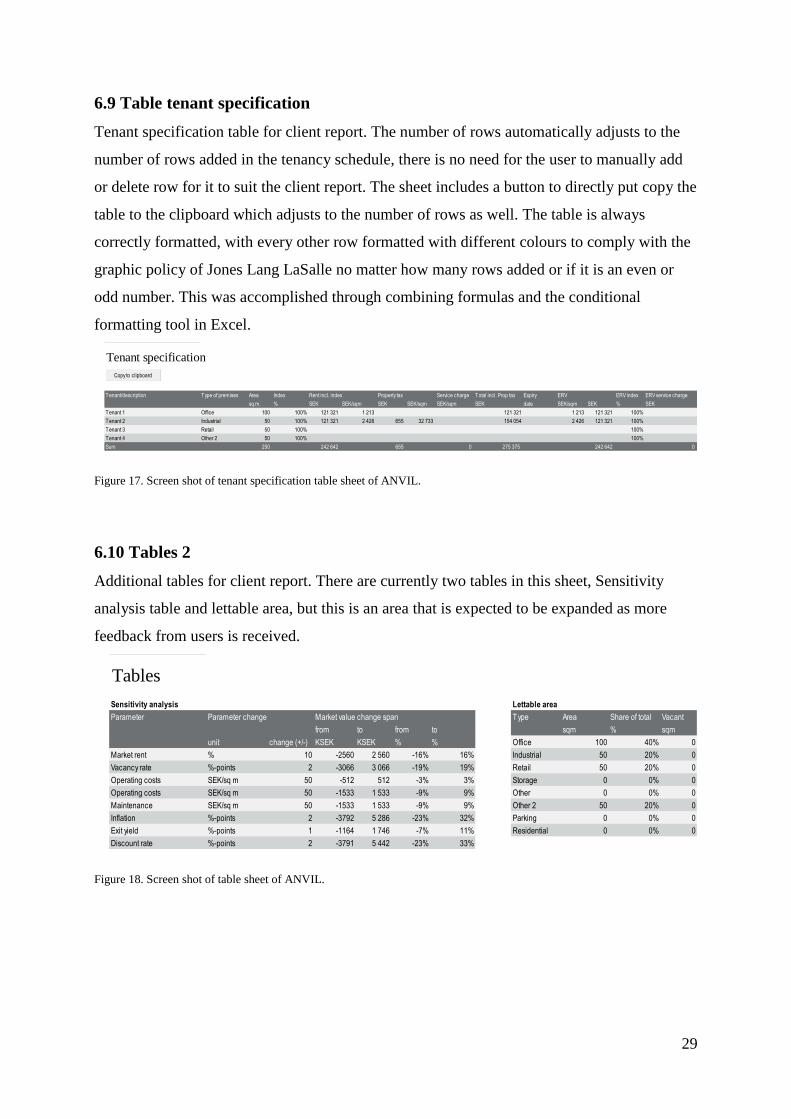
29
6.9 Table tenant specification
Tenant specification table for client report. The number of rows automatically adjusts to the
number of rows added in the tenancy schedule, there is no need for the user to manually add
or delete row for it to suit the client report. The sheet includes a button to directly put copy the
table to the clipboard which adjusts to the number of rows as well. The table is always
correctly formatted, with every other row formatted with different colours to comply with the
graphic policy of Jones Lang LaSalle no matter how many rows added or if it is an even or
odd number. This was accomplished through combining formulas and the conditional
formatting tool in Excel.
Figure 17. Screen shot of tenant specification table sheet of ANVIL.
6.10 Tables 2
Additional tables for client report. There are currently two tables in this sheet, Sensitivity
analysis table and lettable area, but this is an area that is expected to be expanded as more
feedback from users is received.
Figure 18. Screen shot of table sheet of ANVIL.
Tenant specification
Tenant/description Type of premises Area Index Rent incl. index Property tax Service charge Total incl. Prop tax Expiry ERV ERV index ERV service charge
sq.m. % SEK SEK/sqm SEK SEK/sqm SEK/sqm SEK date SEK/sqm SEK % SEK
Tenant 1 Office 100 100% 121 321 1 213 121 321 1 213 121 321 100%
Tenant 2 Industrial 50 100% 121 321 2 426 655 32 733 154 054 2 426 121 321 100%
Tenant 3 Retail 50 100% 100%
Tenant 4 Other 2 50 100% 100%
Sum 250 242 642 655 0 275 375 242 642 0
Copy to clipboard
Tables
Sensitivity analysis Lettable area
Parameter Parameter change Type Area Share of total Vacant
from to from to sqm % sqm
unit change (+/-) KSEK KSEK % % Office 100 40% 0
Market rent % 10 -2560 2 560 -16% 16% Industrial 50 20% 0
Vacancy rate %-points 2 -3066 3 066 -19% 19% Retail 50 20% 0
Operating costs SEK/sq m 50 -512 512 -3% 3% Storage 0 0% 0
Operating costs SEK/sq m 50 -1533 1 533 -9% 9% Other 0 0% 0
Maintenance SEK/sq m 50 -1533 1 533 -9% 9% Other 2 50 20% 0
Inflation %-points 2 -3792 5 286 -23% 32% Parking 0 0% 0
Exit yield %-points 1 -1164 1 746 -7% 11% Residential 0 0% 0
Discount rate %-points 2 -3791 5 442 -23% 33%
Market value change span
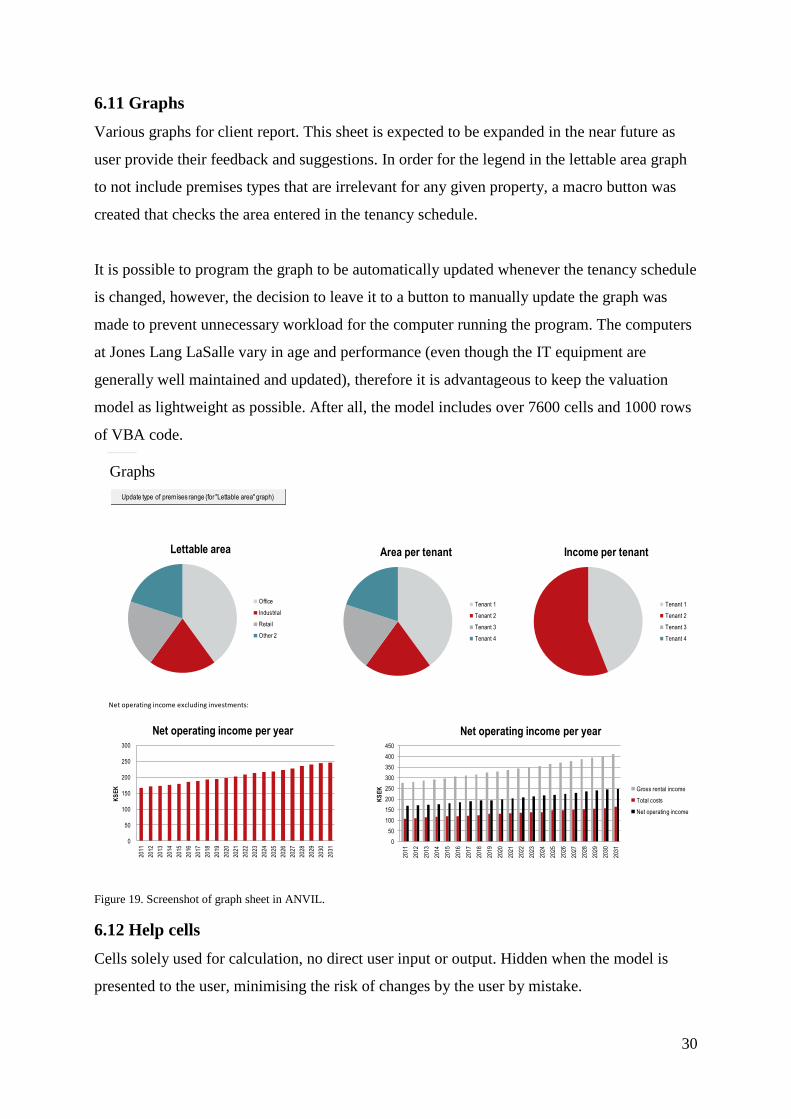
30
6.11 Graphs
Various graphs for client report. This sheet is expected to be expanded in the near future as
user provide their feedback and suggestions. In order for the legend in the lettable area graph
to not include premises types that are irrelevant for any given property, a macro button was
created that checks the area entered in the tenancy schedule.
It is possible to program the graph to be automatically updated whenever the tenancy schedule
is changed, however, the decision to leave it to a button to manually update the graph was
made to prevent unnecessary workload for the computer running the program. The computers
at Jones Lang LaSalle vary in age and performance (even though the IT equipment are
generally well maintained and updated), therefore it is advantageous to keep the valuation
model as lightweight as possible. After all, the model includes over 7600 cells and 1000 rows
of VBA code.
Figure 19. Screenshot of graph sheet in ANVIL.
6.12 Help cells
Cells solely used for calculation, no direct user input or output. Hidden when the model is
presented to the user, minimising the risk of changes by the user by mistake.
Graphs
Net operating income excluding investments:
Lettable area
Office
Industrial
Retail
Other 2
Update type of premises range (for "Lettable area" graph)
Income per tenant
Tenant 1
Tenant 2
Tenant 3
Tenant 4
Area per tenant
Tenant 1
Tenant 2
Tenant 3
Tenant 4
0
50
100
150
200
250
300
2011
2012
2013
2014
2015
2016
2017
2018
2019
2020
2021
2022
2023
2024
2025
2026
2027
2028
2029
2030
2031
KS
EK
Net operating income per year
0
50
100
150
200
250
300
350
400
450
2011
2012
2013
2014
2015
2016
2017
2018
2019
2020
2021
2022
2023
2024
2025
2026
2027
2028
2029
2030
2031
KS
EK
Net operating income per year
Gross rental income
Total costs
Net operating income
31
7. Advantages
The advantages of the resulting model called ANVIL compared to existing discounted cash
flow model available to Jones Lang LaSalle are as follows:
Streamlined and lucid interface that is easy to understand and use.
Automated features added through Visual Basic scripts that contribute to a more
efficient valuation process.
Precise time variables used in the model. Valuation date can be specified at a specific
day and holding period can be specified from one to twenty years.
Advanced calculations that eases the work of an appraiser, for instance property tax
that have complex regulations that makes them not a straight forward task if done
manually.
Readily available, automatically updated graphs and tables that can be inserted
directly into a client report without manual adjustments.
Future proof. If starting date is later than 2011 the year labels in all tables updates to
start at the earliest relevant year.
Brand specific and compliant with Jones Lang LaSalle graphic identity.
Relevant not only to the research department but to all business lines as all
departments were given the opportunity to affect the development and to make
suggestions and requests of features.
Prepared for future adjustments, few cells are directly referenced in the Visual basic
script but are referenced through the name managed making them intact in the event of
reorganisation of the layout.
Easily adapted to other Nordic countries in the Jones Lang LaSalle corporation,
potentially making the value gained compared to invested work grow severalfold.
32
8. Implementation
The implementation of ANVIL has been successive during the development to ensure that all
affected parties are involved in the project and are able to provide feedback and suggestions.
When ANVIL was ready for use, it was placed on the shared network drive and a memo was
sent to affected staff informing them about its existence. It is free for anyone at Jones Lang
LaSalle to use and change, but the development “owners” are still the original authors. The
model is continuously updated and improved as new requests or suggestions surfaces. There
are no binding policy that forces anyone to use it, it stands on its own merit.
During the annual EMEA research conference held in Barcelona in May 2011, awareness was
raised of the existence of ANVIL among the Nordic countries. The initiative was welcomed
and a lot of discussion emerged. Finland expressed an interest in the new model and is
currently testing and evaluating it.
8.1 Valuation workshop at Jones Lang LaSalle
Early on in the process of acquirement of sufficient data to start building sheets, decision was
made that a full day would be set aside for a valuation workshop. This valuation workshop
was to be held on the 26th
of May 2011, led by Mrs. Åsa Linder, National Director, Head of
Research and Valuation, Adam Nilsson, Research & Valuation Analyst and Ahmed
Fetibegovic, Capital Markets Analyst.
The range of the workshop was for all Jones Lang LaSalle staff in Sweden, approximately
120 professionals covering all Scandinavian markets except for Finland where Jones Lang
LaSalle has a separate office. The schedule of the workshop was to have Mrs. Åsa Linder,
Adam Nilsson and Ahmed Fetibegovic initially present the new valuation model ANVIL for
the full Swedish staff.
Onward, to continue on with assigning groups with members from different divisions such as
Asset Management, Corporate Solutions, Capital Markets, Leasing and Economy. Mrs. Åsa
Linder had before the workshop generated a valuation case based on a typical valuation which
Mrs. Åsa Linder found representative of everyday work of an appraiser. The data was made
available for the assigned groups, and the mission of the day was to deliver the best possible
estimate of the subject property value using the valuation model ANVIL, created by Adam
Nilsson and Ahmed Fetibegovic as a part of this thesis.
33
As the valuation model is developed with a requirement of more columns than previously
supported per sheet, users had to use newer versions of excel (versions newer than 2003) as
this is supported only in the 2007 and 2010 versions. Groups teamed up and worked all day
with analysis of the needed information to assess a full scale valuation. To the groups’ aid,
Mrs. Åsa Linder had prepared investment highlights, property facts, location and access,
planning, financial information, rent roll, information about the tenants and tenancy layout.
Throughout the day, groups sent emissaries to ask questions about technical, legal and
economic facts and requirements to perform the valuation in a correct manner. Finally, all
groups printed their cash flow tables, and handed them in to Mrs. Åsa Linder who concluded
that the spread of values on average was less than approximately 10%. The success of the new
valuation model was undeniable at this stage, as a substantial part of the “appraisers of the
day” had never valued property before. The result proved robustness, accuracy and user
friendliness which were the main targets of the valuation model ANVIL.
Needless to say, not all participants in the workshop were professional real estate appraisers.
However, the majority is involved in adding value to real estate directly or indirectly.
Consequently, the question of what drives real estate value is highly relevant to all business
lines at Jones Lang LaSalle and the valuation exercise was useful to elucidate what that might
be. The participants in the valuation workshop was able, thanks to ANVIL, to easily
experiment with the main parameters that define real estate value and instantly discover how
it changes the estimated market value.
The discussion after the valuation exercise when the output sheets were collected was also
highly valuable from an educational point of view. Questions was raised to investigate what
the differences in value stem from, and efforts were made to illuminate those differences
which shed additional light upon what drives value.
After the workshop, which was a full day event, comments were collected by a select number
of Jones Lang LaSalle employees at different divisions and positions.
“The model is looking good. People who have never seen a cash flow model were able to
appraise an accurate value with the help of only raw data, bears witness that the model is
user friendly and robust.” – Åsa Linder, National Director, Head of Research and Valuation
34
“We really need a new cash flow model. It is terrific that it has finally been developed, and it
will be thoroughly debugged and tested by the Capital Markets team.” – Bojan Ticic, Analyst,
Capital Markets
“The delivery of a new cash flow model was long overdue, it has met the expectations we had.
A welcomed surprise was the effort put into the financing part of the model which is the main
part of the cash flow model that we use. Once the appraisal is over, the investment analysis
takes place asking the question „Does this investment make sense to our investor?‟” – Norbert
Adamek, Analyst, Capital Markets
“The user friendliness was quite good. The model looks nice and professional, and made me
feel competent to appraise even though I do not engage in such questions in my everyday line
of work. That has to be a good sign!” – Stefan Regén, Project manager, Corporate Solutions
“The outcome of the work put into this is impressive. The model is unlike anything I‟ve
worked with, and I feel even more confident about it since I know that the programmers of the
model work at Jones Lang LaSalle, which means continuous updates and modifications to a
model which is satisfying already.” – Ani Chirilas, Senior Appraiser, Research and Valuation
“I had not realized the scope of work put into this model until today. I‟m curious about the
man hours put into this project, it must be many. I can assure you that the model will be used
in our everyday work at Asset Management.” – Therese Hääger, Property Manager, Asset
Management
35
9. Conclusion
In the fourth quarter of 2010, decision was made at Jones Lang LaSalle to develop a new
valuation model. The decision originated from the fact that the models in use were not
optimized for Jones Lang LaSalle, and lacked necessary quality, robustness, and design and
user friendliness. At the time, models from various Jones Lang LaSalle offices around the
EMEA were used in a combination to ensure a good float value. Naturally, this was not the
optimal solution for a company that has rigorous requirements on professionalism, accuracy
and technical leverage on the appraisals delivered to its’ clients.
The task was forwarded to the authors of this report, to construct a new valuation model for
Jones Lang LaSalle that would meet the requirements currently lacking in existing models in
use at the company. Now, when the model has been developed and delivered to Jones Lang
LaSalle, some conclusions can be made on the level of success this undertaking resulted in,
and the processes that led there.
When programming the new model, it soon became apparent what importance the model
carries to other divisions of Jones Lang LaSalle apart from Research & Valuation which was
the original client that the authors tried to satisfy. For instance, Capital Markets, the real estate
transaction and finance department of Jones Lang LaSalle instantly contacted the authors with
several requests that were of major importance for them in the model. The requests were
mainly finance oriented, with functions such as a guess-price function to see the IRR of the
investment at any given value. Another important function according to Capital Markets is the
ability for the model to search for the value representing any given IRR.
When dissecting the feedback received from Jones Lang LaSalle, it becomes obvious that
agencies work in different ways. All agencies require a certain amount of specialization in the
models used for assessment of property value; therefore much effort was put into
identification of Jones Lang LaSalle-specific factors of the mainly standardized route of
appraisal. The model does not have to be tailor made per se, although careful consideration
must be taken to the specific practices at the consultancy utilizing the model in order to
achieve efficiency.
Such factors at Jones Lang LaSalle were mainly design oriented, but also a few very specific
requirements such as the ability to specify vacancies per premises type over periods of time of
choice. Furthermore, there were requests of which key indicators to be included in the final
output sheet, which is not adjustable in corporate software suites. The design oriented requests

36
were mainly about receiving automated charts and diagrams that were formatted in the
standardized Jones Lang LaSalle color palette and font family in order to save time and
resources.
One very important conclusion made from the effort put into this task, is how central a well-
functioning valuation model is in terms of efficiency at a valuation department. Indeed, doing
what you are educated to do, and what you are passionate about, instead of putting valuable
time into side work such as designing charts, figures and cash flows, is bound to increase the
efficiency of any agency. Undeniably, as time is of the essence for a rising appraiser, so is
efficiency at the very core of profitability.
37
10. Discussion
Working on developing a new valuation model for a global real estate agency like Jones Lang
LaSalle with all of the expectations that comes along with the task, is not an easy mission.
During the course of making it come together, many setbacks have been experienced. It was
not seldom that 30 to 40 man hours went to waste due to misunderstandings or
misinterpretation of the needs of Jones Lang LaSalle. A lot of the work had to be redone, and
redone, due to false assumptions and change of minds at the agency. Therefore, the feeling of
accomplishment feels yet larger today.
In the beginning of making ANVIL come to life, examination was made of numerous
competing valuation models. When examining these, it was understood that they had many
flaws. In the worst cases, critical technical errors were found that skewed property values.
One typical example of a critical error made in “desktop” valuation models is that values
decreased if the valuation period started in the middle or late in a year, because of the first
cash flow period becoming smaller, i.e. no mathematical solution was made to offset the
entire holding period by the amount of time which had already passed in the first holding
year.
There are numerous technical flaws at previous valuation models to be discussed, and the
model which was developed for Jones Lang LaSalle is destined to have a successor, which
will likely have a few words to say about this one. However, the task of developing and
delivering a valuation model forged to the specific needs of Jones Lang LaSalle has been
completed with a result that met the high expectations not only by the authors, but the whole
Swedish office.
The main criticism pointed towards the newly developed valuation model, is the
incompatibility with older versions of Excel, which was a necessary sacrifice made to make
the model sufficiently robust with the approach chosen. The old Excel format simply does not
possess the features and range required. The authors are aware of the problem this creates
with some employees still using the old version of the Microsoft software suit, but the
decision was made to go on this path due to the main divisions who are to use this software
are the Research & Valuation, Capital Markets and Asset Management divisions who all
mostly have at least Office 2007 installed on their computers.
The software is compatible with Office 2007 and newer versions, and all staff are currently
phasing out their old hardware for new workstations. These workstations all have Office 2010
38
installed with Windows 7, which will eliminate this problem eventually. Developing and
maintaining two separate version of the model to remedy this issue would be too time
consuming and cumbersome and frankly, not feasible due to the above described situation.
Furthermore, criticism from the Capital Markets division was pointed to the fact more work
could have been put into the financial part of the valuation model. Many arguments have been
undertaken to defend the integrity of a valuation model that does not take into consideration
the scenario of a specific investor. To answer this criticism, the authors would in addition like
to quote:
“The difference between doing an investment analysis and estimating market value is that
while market value is a same-for-all number that theoretically reflect the average opinion of
buyers and a seller, an investment analysis is tailored for an individual whose objectives,
attitudes toward risk, ability to borrow, and tax situation may vary considerable from the
average. In many cases, the investment analysis begins where the market value appraisal
ends; seeking an answer to the question of whether paying at or around the market value
makes sense for a given individual.”
- Kenneth M. Lusth, Real Estate Valuation, Principle and Applications, 2002
In the later parts of development of the model, the authors added several asked for financial
functions. One of these, among the more sophisticated functions of the whole model, is a
VBA-script which finds the underlying maximum value of the property at a given required
IRR. Also, a solution was found to the problem where the running loan-to-value ratio could
turn bad if the property was likely to become vacant periodically, for instance single-tenant
properties where the appraiser has to count with a void period.
In these situations, you will have a property which will have a negative NOI for a period of
time, which will yield an unacceptable LTV-situation when using running exit price, that is
calculated through the direct capitalization approach, to calculate LTV over time. This
problem for instance, was fixed in an innovative way. Together with the appraisers, the
authors based the gathered valuation input to automate a VPV (vacant possession value),
which is then used as a threshold value for the running LTV in the financial part of the
valuation model. That means, property value will not go under the fixed VPV no matter
vacancy periods in the subject property. This is a solution which is currently unavailable in
any software available on the market today.
39
To return to the discussion about competing models, one would be surprised of the amount of
these kinds of flaws that are critically detrimental to final appraisal. Indeed, working on
developing a new valuation model was an eye opener to the occurring lack of technical skill at
most real estate agencies operating not only in Scandinavia, but across Europe. At Jones Lang
LaSalle, these flaws were efficiently discovered by management early on, and the need for a
new valuation model was established.
At the time of presentation for a possible solution for Jones Lang LaSalle, the authors of this
thesis were employed as Research Assistants at the Research and Valuation department and
final year students at the Real Estate Management programme at the Royal Institute of
Technology in Stockholm. In everyday work as a Research Assistant, a lot of work is put into
mastering the art of Excel and large quantities of data. Therefore, possession of the necessary
skills to perform such a task was met technically, practically and theoretically. The authors
were given insight into commercial valuation practices, which was fundamental in the process
of developing the new valuation model.
Initially, one of the goals with the development of a new valuation model was to have a fully
automated report creator, i.e. a VBA scripted program that with a mouse-click takes all
necessary data and results from the model, and exports it to a predefined docx or publisher file
with fixed layout, formatting, styles and structure stored on the company network hard disk
drive. A feature like this would add value as one of the most time consuming parts of the
work of an appraiser is the work on the actual client report.
Unfortunately, there was no time to build such a function. Creating such a function would be
expanding the scope of the model drastically, pushing the very limits of what is relevant for
the authors to work with. Programming at that level would be a suitable project for an
educated programmer, and it would have been interesting to have someone with that
background in the team. Simply put, it was beyond reasonable level of competence of the
authors and any employee at Jones Lang LaSalle to instruct on such an ambition. However, as
described in the main part of the thesis, the authors have put substantial amounts of work into
making the model easy for direct report interaction. All presentation data found in the model
are designed so that it may be directly inserted as a vector enhanced metafile (scalable to
ensure high quality prints) into any Microsoft Office compatible program.
40
Sources
Litterature
Andersson, J.O., Ekström, C., & Gabrielsson, A. (2004) Finansiering och kalkylering.
Stockholm: Liber AB
Appraisal Institute. (2001). The appraisal of real estate. Appraisal Institute.
Damodaran, A.(2002). Investment valuation. New York: John Wiley & Sons, Inc
Lantmäteriverket & Mäklarsamfundet. (2008), Fastighetsvärdering. Gävle Lantmäteriverket
Lusht, M. Kenneth (2002) Real Estate Valuation, Principle and Applications, Stockholm
Råckle, G,. & Waxler, R (2005). Fastighetsekonomisk analys och fastighetsrätt med.
fastighetsnomenklatur. Sverige: Fastighetsnytt Förlags AB.
Lind, H. (2003). Value concepts, value information and cycles on the real estate market.
Journal of Property Investment & Finance – vol. 23, Iss: 1 pp 141-147.
Interviews
Norbert Adamek, Capital Markets Analyst, interview, Apr 27 2011.
Ani Chirilas, Senior surveyor at Jones Lang LaSalle, interview, Apr 25 2011.
Patrik Floberg, Capital Markets Analyst at Jones Lang LaSalle, interview, Apr 27 2011.
Therese Hääger, Property Manager at Asset Management at Jones Lang LaSalle, interview,
Apr 27 2011.
Åsa Linder, National Director and Head of Research and Valuation at Jones Lang LaSalle,
interview, Apr 25 2011, May 3 2011, May 4 2011, May 5 2011, May 23 2011, May 24 2011,
May 25 2011.
Stefan Regén, Project Manager at Corporate Solutions at Jones Lang LaSalle, interview, Apr
27 2011.
Benjamin Rush, MRICS Senior surveyor at Jones Lang LaSalle, interview, Apr 25 2011.
Bojan Ticic, , Capital Markets Analyst at Jones Lang LaSalle, interview, Apr 27 2011.

41
Electronic sources
http://www.skatteverket.se/foretagorganisationer/skatter/fastighet/fastighetstaxering.4.76a43b
e412206334b89800043506.html
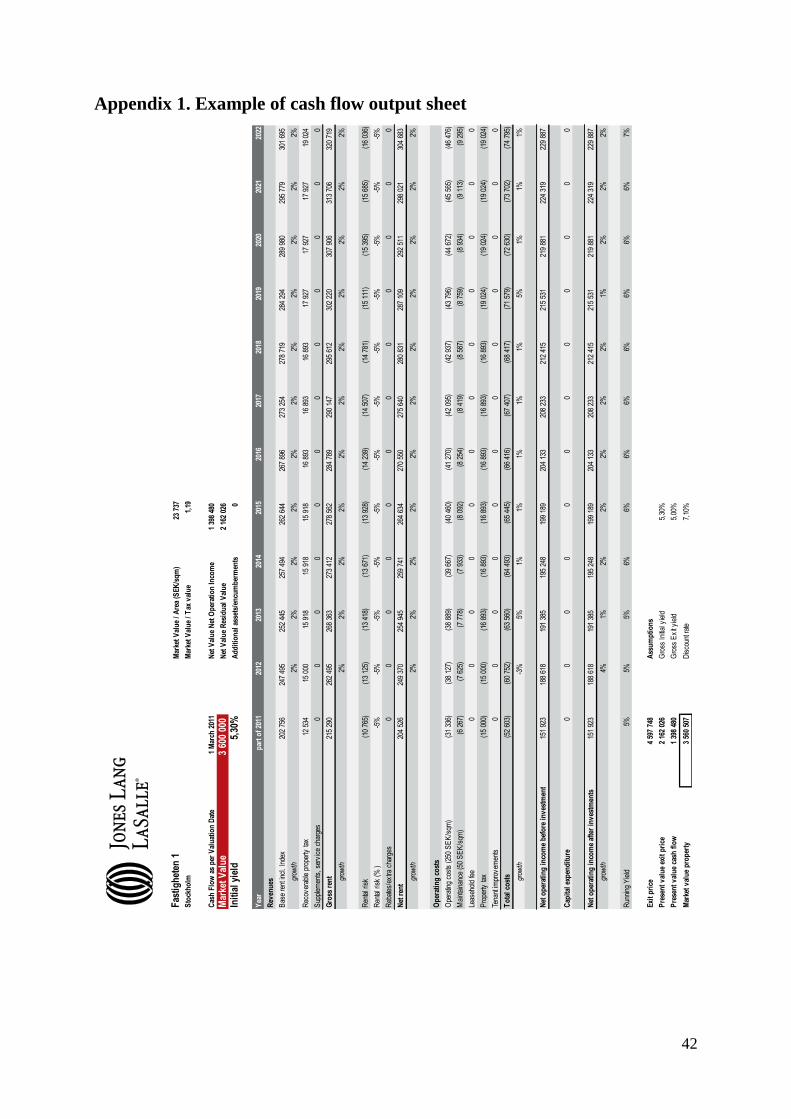
42
Appendix 1. Example of cash flow output sheet
Fas
tig
het
en 1
Mar
ket
Val
ue
/ A
rea
(SE
K/s
qm
)23
737
Sto
ckh
olm
Mar
ket
Val
ue
/ T
ax v
alu
e1,
19
Cas
h F
low
as
per
Val
uat
ion
Dat
e1
Mar
ch 2
011
Net
Val
ue
Net
Op
erat
ion
In
com
e1
398
480
Mar
ket
Val
ue
3 60
0 00
0N
et V
alu
e R
esid
ual
Val
ue
2 16
2 02
6
Init
ial
yiel
d5,
30%
Ad
dit
ion
al a
sset
s/en
cum
ber
men
ts0
Yea
rp
art
of
2011
2012
2013
2014
2015
2016
2017
2018
2019
2020
2021
2022
Rev
enu
es
Bas
e re
nt in
cl.
Inde
x20
2 75
624
7 49
525
2 44
525
7 49
426
2 64
426
7 89
627
3 25
427
8 71
928
4 29
428
9 98
029
5 77
930
1 69
5
grow
th2%
2%2%
2%2%
2%2%
2%2%
2%2%
Rec
over
able
pro
perty
tax
12 5
3415
000
15 9
1815
918
15 9
1816
893
16 8
9316
893
17 9
2717
927
17 9
2719
024
Sup
plem
ents
, se
rvic
e ch
arge
s0
00
00
00
00
00
0
Gro
ss r
ent
215
290
262
495
268
363
273
412
278
562
284
789
290
147
295
612
302
220
307
906
313
706
320
719
grow
th2%
2%2%
2%2%
2%2%
2%2%
2%2%
Ren
tal r
isk
(10
765)
(13
125)
(13
418)
(13
671)
(13
928)
(14
239)
(14
507)
(14
781)
(15
111)
(15
395)
(15
685)
(16
036)
Ren
tal r
isk
(%)
-5%
-5%
-5%
-5%
-5%
-5%
-5%
-5%
-5%
-5%
-5%
-5%
Reb
ates
/ex
tra c
harg
es0
00
00
00
00
00
0
Net
ren
t20
4 52
624
9 37
025
4 94
525
9 74
126
4 63
427
0 55
027
5 64
028
0 83
128
7 10
929
2 51
129
8 02
130
4 68
3
grow
th2%
2%2%
2%2%
2%2%
2%2%
2%2%
Op
erat
ing
co
sts
Ope
ratin
g co
sts
(250
SE
K/s
qm)
(31
336)
(38
127)
(38
889)
(39
667)
(40
460)
(41
270)
(42
095)
(42
937)
(43
796)
(44
672)
(45
565)
(46
476)
Mai
ntai
nanc
e (5
0 S
EK
/sqm
)(6
267
)(7
625
)(7
778
)(7
933
)(8
092
)(8
254
)(8
419
)(8
587
)(8
759
)(8
934
)(9
113
)(9
295
)
Leas
ehol
d fe
e0
00
00
00
00
00
0
Pro
perty
tax
(15
000)
(15
000)
(16
893)
(16
893)
(16
893)
(16
893)
(16
893)
(16
893)
(19
024)
(19
024)
(19
024)
(19
024)
Tena
nt im
prov
emen
ts0
00
00
00
00
00
0
To
tal
cost
s(5
2 60
3)(6
0 75
2)(6
3 56
0)(6
4 49
3)(6
5 44
5)(6
6 41
6)(6
7 40
7)(6
8 41
7)(7
1 57
9)(7
2 63
0)(7
3 70
2)(7
4 79
5)
grow
th-3
%5%
1%1%
1%1%
1%5%
1%1%
1%
Net
op
erat
ing
in
com
e b
efo
re i
nv
estm
ents
151
923
188
618
191
385
195
248
199
189
204
133
208
233
212
415
215
531
219
881
224
319
229
887
Cap
ital
exp
end
itu
re0
00
00
00
00
00
0
Net
op
erat
ing
in
com
e af
ter
inv
estm
ents
151
923
188
618
191
385
195
248
199
189
204
133
208
233
212
415
215
531
219
881
224
319
229
887
grow
th4%
1%2%
2%2%
2%2%
1%2%
2%2%
Run
ning
Yie
ld5%
5%5%
6%6%
6%6%
6%6%
6%6%
7%
Exi
t p
rice
4 59
7 74
8A
ssu
mp
tio
ns
Pre
sen
t v
alu
e ex
it p
rice
2 16
2 02
6G
ross
Ini
tial y
ield
5,30
%
Pre
sen
t v
alu
e ca
sh f
low
1 39
8 48
0G
ross
Ex
it y
ield
5,00
%
Mar
ket
val
ue
pro
per
ty3
560
507
Dis
coun
t rat
e7,
10%