Embed Size (px)
Citation preview
1
Finance Professional Speaker Series
February 7, 2014
REAL ESTATE INVESTMENT BANKING
SECTOR: REAL ESTATE
Real Estate Capital Markets Overview
2
TABLE OF CONTENTS
SECTION 1 | Introduction
SECTION 2 | Overview and History of REIT Industry
SECTION 3 | REIT Capital Market Conditions
SECTION 4 | Overview of Preferred Stock and Offerings
SECTION 5 | Overview of Non-Traded REITs
SECTION 6 | Real Estate Illustrative Transactions

3
Introduction
SECTION 1
4
INTRODUCTION
Introduction
Go Gators!
Matt Stein – Sr. Associate; University of Florida BSBA – Finance ‘04
Lisa Ramey – Associate; University of Florida BSBA – Finance ‘07, MSF ’08
Orlando Gutierrez – Analyst; University of Florida BSBA – Finance ‘13
5
Overview and History of REIT Industry
SECTION 2
6
SUMMARY
Overview and History of REIT Industry
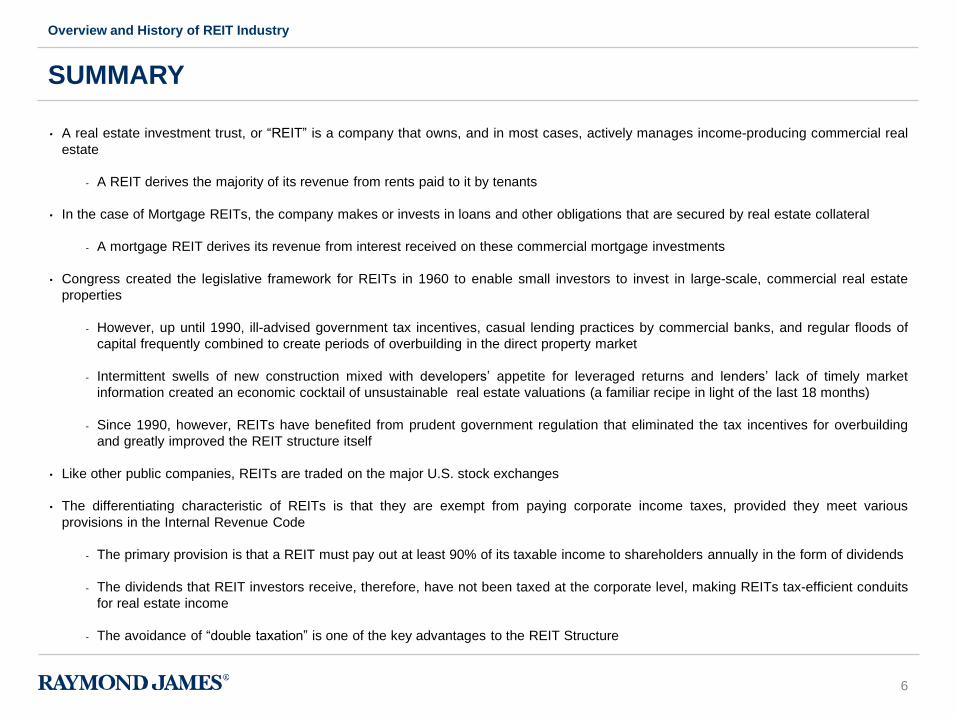
• A real estate investment trust, or “REIT” is a company that owns, and in most cases, actively manages income-producing commercial real
estate
- A REIT derives the majority of its revenue from rents paid to it by tenants
• In the case of Mortgage REITs, the company makes or invests in loans and other obligations that are secured by real estate collateral
- A mortgage REIT derives its revenue from interest received on these commercial mortgage investments
• Congress created the legislative framework for REITs in 1960 to enable small investors to invest in large-scale, commercial real estate
properties
- However, up until 1990, ill-advised government tax incentives, casual lending practices by commercial banks, and regular floods of
capital frequently combined to create periods of overbuilding in the direct property market
- Intermittent swells of new construction mixed with developers’ appetite for leveraged returns and lenders’ lack of timely market
information created an economic cocktail of unsustainable real estate valuations (a familiar recipe in light of the last 18 months)
- Since 1990, however, REITs have benefited from prudent government regulation that eliminated the tax incentives for overbuilding
and greatly improved the REIT structure itself
• Like other public companies, REITs are traded on the major U.S. stock exchanges
• The differentiating characteristic of REITs is that they are exempt from paying corporate income taxes, provided they meet various
provisions in the Internal Revenue Code
- The primary provision is that a REIT must pay out at least 90% of its taxable income to shareholders annually in the form of dividends
- The dividends that REIT investors receive, therefore, have not been taxed at the corporate level, making REITs tax-efficient conduits
for real estate income
- The avoidance of “double taxation” is one of the key advantages to the REIT Structure
7
INDUSTRY CAPITALIZATION
Overview and History of REIT Industry
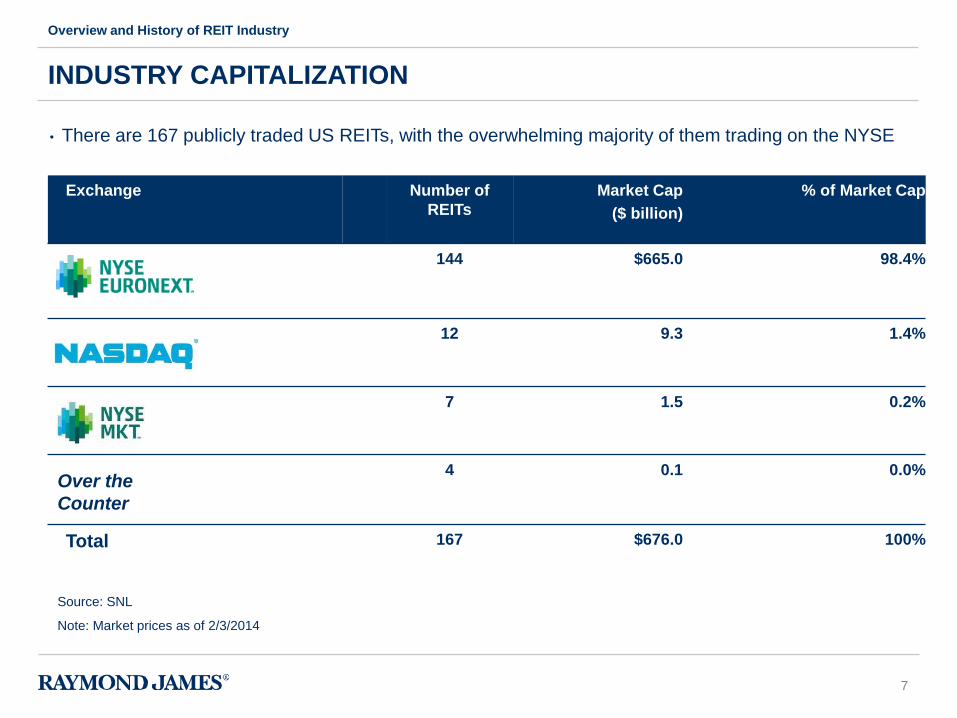
• There are 167 publicly traded US REITs, with the overwhelming majority of them trading on the NYSE
Exchange Number of
REITs
Market Cap
($ billion)
% of Market Cap
144 $665.0 98.4%
12 9.3 1.4%
7 1.5 0.2%
4 0.1 0.0%
Total 167 $676.0 100%
Over the
Counter
Source: SNL
Note: Market prices as of 2/3/2014
8
EVOLUTION OF REITS
Overview and History of REIT Industry
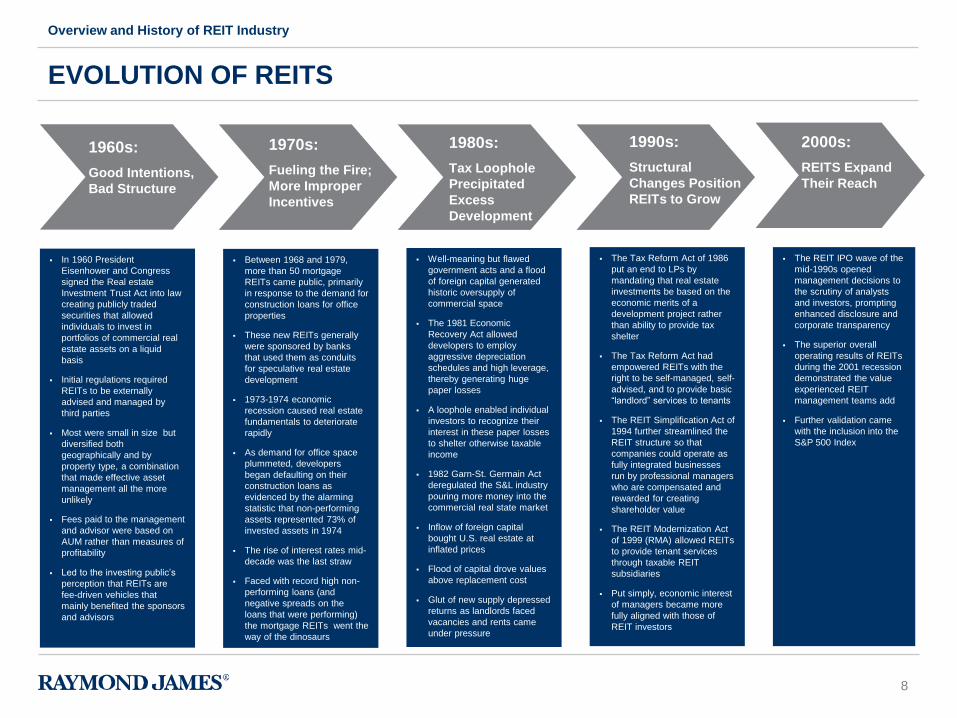
1960s:
Good Intentions,
Bad Structure
In 1960 President
Eisenhower and Congress
signed the Real estate
Investment Trust Act into law
creating publicly traded
securities that allowed
individuals to invest in
portfolios of commercial real
estate assets on a liquid
basis
Initial regulations required
REITs to be externally
advised and managed by
third parties
Most were small in size but
diversified both
geographically and by
property type, a combination
that made effective asset
management all the more
unlikely
Fees paid to the management
and advisor were based on
AUM rather than measures of
profitability
Led to the investing public’s
perception that REITs are
fee-driven vehicles that
mainly benefited the sponsors
and advisors
1970s:
Fueling the Fire;
More Improper
Incentives
Between 1968 and 1979,
more than 50 mortgage
REITs came public, primarily
in response to the demand for
construction loans for office
properties
These new REITs generally
were sponsored by banks
that used them as conduits
for speculative real estate
development
1973-1974 economic
recession caused real estate
fundamentals to deteriorate
rapidly
As demand for office space
plummeted, developers
began defaulting on their
construction loans as
evidenced by the alarming
statistic that non-performing
assets represented 73% of
invested assets in 1974
The rise of interest rates mid-
decade was the last straw
Faced with record high non-
performing loans (and
negative spreads on the
loans that were performing)
the mortgage REITs went the
way of the dinosaurs
1980s:
Tax Loophole
Precipitated
Excess
Development
Well-meaning but flawed
government acts and a flood
of foreign capital generated
historic oversupply of
commercial space
The 1981 Economic
Recovery Act allowed
developers to employ
aggressive depreciation
schedules and high leverage,
thereby generating huge
paper losses
A loophole enabled individual
investors to recognize their
interest in these paper losses
to shelter otherwise taxable
income
1982 Garn-St. Germain Act
deregulated the S&L industry
pouring more money into the
commercial real state market
Inflow of foreign capital
bought U.S. real estate at
inflated prices
Flood of capital drove values
above replacement cost
Glut of new supply depressed
returns as landlords faced
vacancies and rents came
under pressure
1990s:
Structural
Changes Position
REITs to Grow
The Tax Reform Act of 1986
put an end to LPs by
mandating that real estate
investments be based on the
economic merits of a
development project rather
than ability to provide tax
shelter
The Tax Reform Act had
empowered REITs with the
right to be self-managed, self-
advised, and to provide basic
“landlord” services to tenants
The REIT Simplification Act of
1994 further streamlined the
REIT structure so that
companies could operate as
fully integrated businesses
run by professional managers
who are compensated and
rewarded for creating
shareholder value
The REIT Modernization Act
of 1999 (RMA) allowed REITs
to provide tenant services
through taxable REIT
subsidiaries
Put simply, economic interest
of managers became more
fully aligned with those of
REIT investors
The REIT IPO wave of the
mid-1990s opened
management decisions to
the scrutiny of analysts
and investors, prompting
enhanced disclosure and
corporate transparency
The superior overall
operating results of REITs
during the 2001 recession
demonstrated the value
experienced REIT
management teams add
Further validation came
with the inclusion into the
S&P 500 Index
2000s:
REITS Expand
Their Reach
9
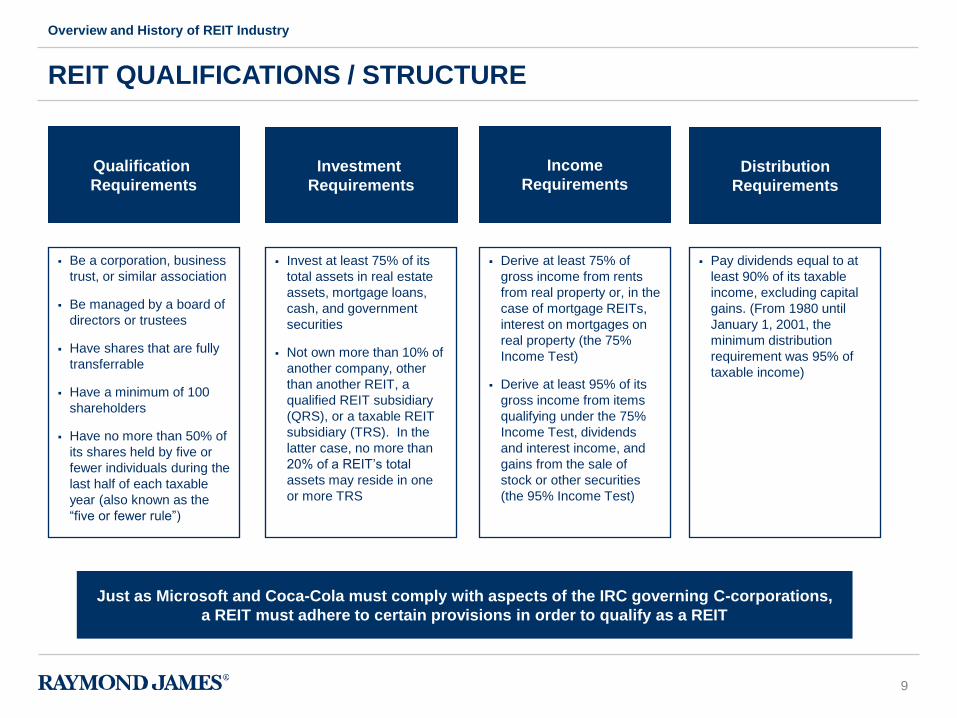
REIT QUALIFICATIONS / STRUCTURE
Overview and History of REIT Industry
Qualification
Requirements
Investment
Requirements
Income
Requirements Distribution
Requirements
Be a corporation, business
trust, or similar association
Be managed by a board of
directors or trustees
Have shares that are fully
transferrable
Have a minimum of 100
shareholders
Have no more than 50% of
its shares held by five or
fewer individuals during the
last half of each taxable
year (also known as the
“five or fewer rule”)
Derive at least 75% of
gross income from rents
from real property or, in the
case of mortgage REITs,
interest on mortgages on
real property (the 75%
Income Test)
Derive at least 95% of its
gross income from items
qualifying under the 75%
Income Test, dividends
and interest income, and
gains from the sale of
stock or other securities
(the 95% Income Test)
Pay dividends equal to at
least 90% of its taxable
income, excluding capital
gains. (From 1980 until
January 1, 2001, the
minimum distribution
requirement was 95% of
taxable income)
Invest at least 75% of its
total assets in real estate
assets, mortgage loans,
cash, and government
securities
Not own more than 10% of
another company, other
than another REIT, a
qualified REIT subsidiary
(QRS), or a taxable REIT
subsidiary (TRS). In the
latter case, no more than
20% of a REIT’s total
assets may reside in one
or more TRS
Just as Microsoft and Coca-Cola must comply with aspects of the IRC governing C-corporations,
a REIT must adhere to certain provisions in order to qualify as a REIT
10
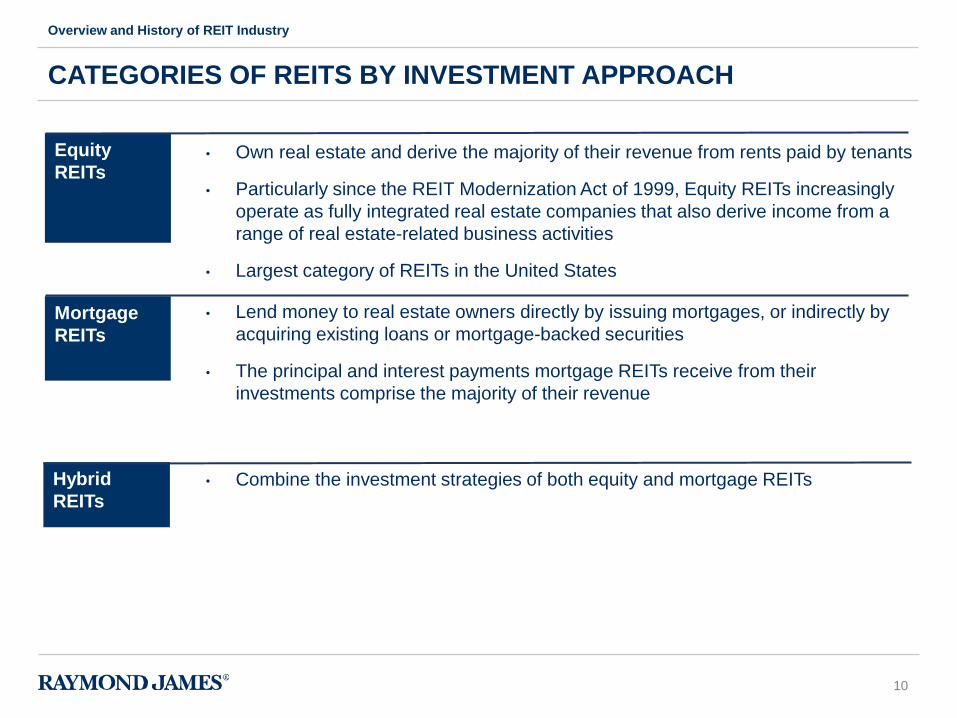
CATEGORIES OF REITS BY INVESTMENT APPROACH
Overview and History of REIT Industry
• Own real estate and derive the majority of their revenue from rents paid by tenants
• Particularly since the REIT Modernization Act of 1999, Equity REITs increasingly
operate as fully integrated real estate companies that also derive income from a
range of real estate-related business activities
• Largest category of REITs in the United States
• Lend money to real estate owners directly by issuing mortgages, or indirectly by
acquiring existing loans or mortgage-backed securities
• The principal and interest payments mortgage REITs receive from their
investments comprise the majority of their revenue
Equity
REITs
Mortgage
REITs
• Combine the investment strategies of both equity and mortgage REITs Hybrid
REITs
11
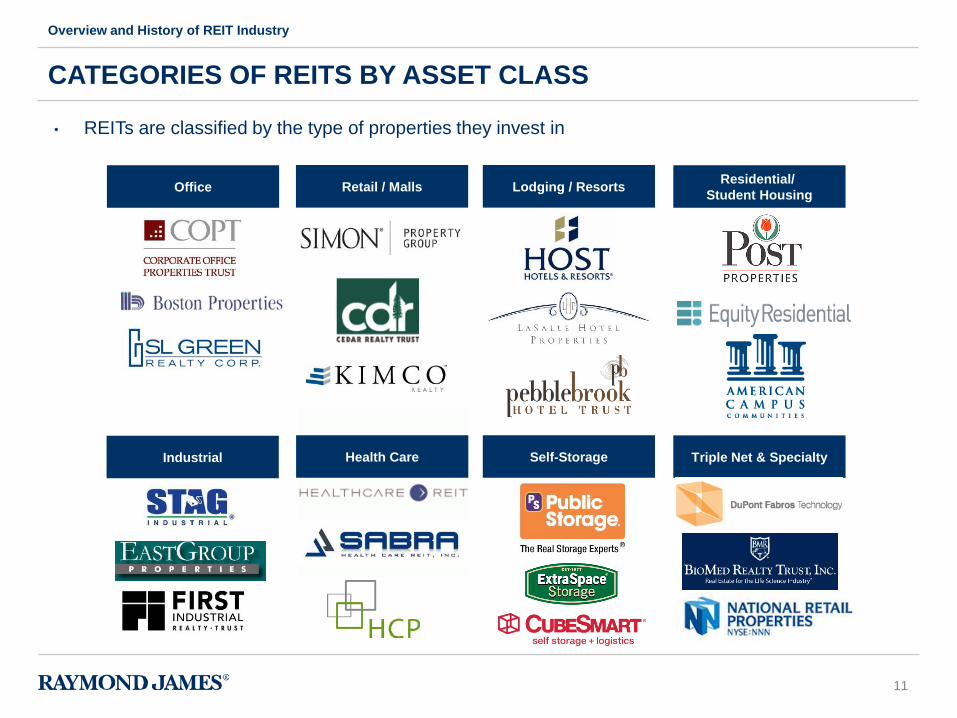
• REITs are classified by the type of properties they invest in
CATEGORIES OF REITS BY ASSET CLASS
Overview and History of REIT Industry
Office
Industrial
Retail / Malls Lodging / Resorts Residential/
Student Housing
Health Care Self-Storage Triple Net & Specialty
12
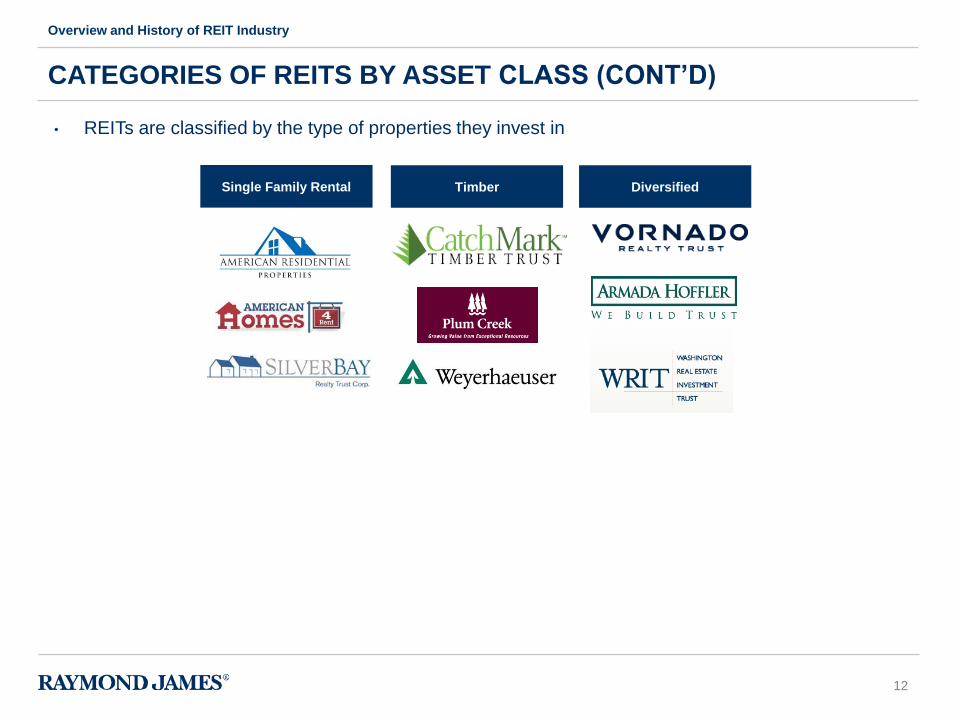
• REITs are classified by the type of properties they invest in
CATEGORIES OF REITS BY ASSET CLASS (CONT’D)
Overview and History of REIT Industry
Single Family Rental Timber Diversified

13
REIT Capital Market Conditions
SECTION 3
14
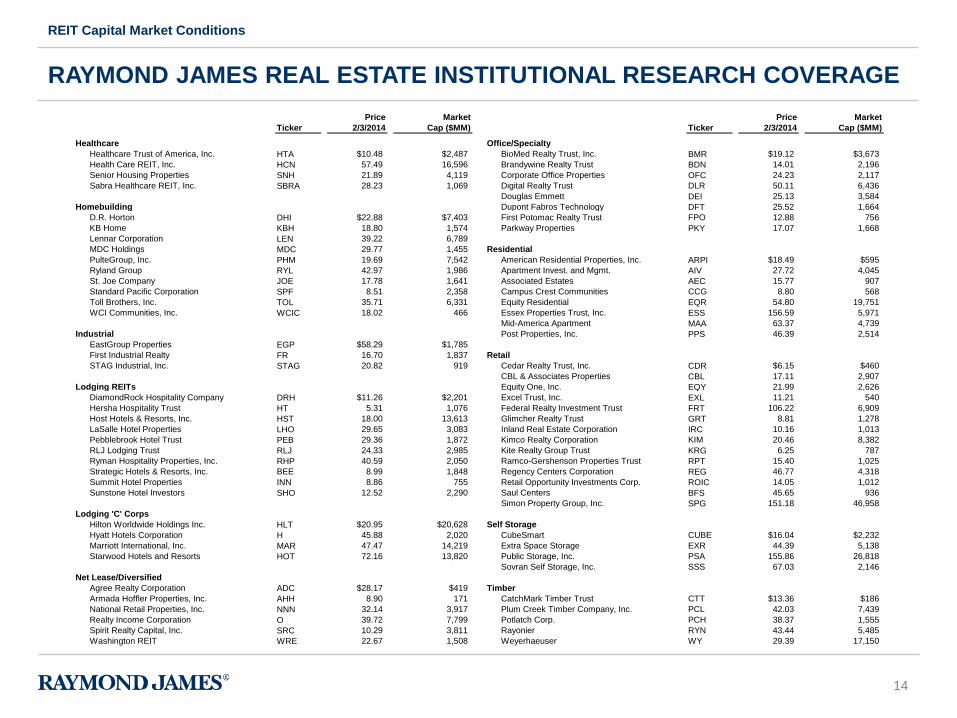
Price Market Price Market
Ticker 2/3/2014 Cap ($MM) Ticker 2/3/2014 Cap ($MM)
Healthcare Office/Specialty
Healthcare Trust of America, Inc. HTA $10.48 $2,487 BioMed Realty Trust, Inc. BMR $19.12 $3,673
Health Care REIT, Inc. HCN 57.49 16,596 Brandywine Realty Trust BDN 14.01 2,196
Senior Housing Properties SNH 21.89 4,119 Corporate Office Properties OFC 24.23 2,117
Sabra Healthcare REIT, Inc. SBRA 28.23 1,069 Digital Realty Trust DLR 50.11 6,436
Douglas Emmett DEI 25.13 3,584
Homebuilding Dupont Fabros Technology DFT 25.52 1,664
D.R. Horton DHI $22.88 $7,403 First Potomac Realty Trust FPO 12.88 756
KB Home KBH 18.80 1,574 Parkway Properties PKY 17.07 1,668
Lennar Corporation LEN 39.22 6,789
MDC Holdings MDC 29.77 1,455 Residential
PulteGroup, Inc. PHM 19.69 7,542 American Residential Properties, Inc. ARPI $18.49 $595
Ryland Group RYL 42.97 1,986 Apartment Invest. and Mgmt. AIV 27.72 4,045
St. Joe Company JOE 17.78 1,641 Associated Estates AEC 15.77 907
Standard Pacific Corporation SPF 8.51 2,358 Campus Crest Communities CCG 8.80 568
Toll Brothers, Inc. TOL 35.71 6,331 Equity Residential EQR 54.80 19,751
WCI Communities, Inc. WCIC 18.02 466 Essex Properties Trust, Inc. ESS 156.59 5,971
Mid-America Apartment MAA 63.37 4,739
Industrial Post Properties, Inc. PPS 46.39 2,514
EastGroup Properties EGP $58.29 $1,785
First Industrial Realty FR 16.70 1,837 Retail
STAG Industrial, Inc. STAG 20.82 919 Cedar Realty Trust, Inc. CDR $6.15 $460
CBL & Associates Properties CBL 17.11 2,907
Lodging REITs Equity One, Inc. EQY 21.99 2,626
DiamondRock Hospitality Company DRH $11.26 $2,201 Excel Trust, Inc. EXL 11.21 540
Hersha Hospitality Trust HT 5.31 1,076 Federal Realty Investment Trust FRT 106.22 6,909
Host Hotels & Resorts, Inc. HST 18.00 13,613 Glimcher Realty Trust GRT 8.81 1,278
LaSalle Hotel Properties LHO 29.65 3,083 Inland Real Estate Corporation IRC 10.16 1,013
Pebblebrook Hotel Trust PEB 29.36 1,872 Kimco Realty Corporation KIM 20.46 8,382
RLJ Lodging Trust RLJ 24.33 2,985 Kite Realty Group Trust KRG 6.25 787
Ryman Hospitality Properties, Inc. RHP 40.59 2,050 Ramco-Gershenson Properties Trust RPT 15.40 1,025
Strategic Hotels & Resorts, Inc. BEE 8.99 1,848 Regency Centers Corporation REG 46.77 4,318
Summit Hotel Properties INN 8.86 755 Retail Opportunity Investments Corp. ROIC 14.05 1,012
Sunstone Hotel Investors SHO 12.52 2,290 Saul Centers BFS 45.65 936
Simon Property Group, Inc. SPG 151.18 46,958
Lodging 'C' Corps
Hilton Worldwide Holdings Inc. HLT $20.95 $20,628 Self Storage
Hyatt Hotels Corporation H 45.88 2,020 CubeSmart CUBE $16.04 $2,232
Marriott International, Inc. MAR 47.47 14,219 Extra Space Storage EXR 44.39 5,138
Starwood Hotels and Resorts HOT 72.16 13,820 Public Storage, Inc. PSA 155.86 26,818
Sovran Self Storage, Inc. SSS 67.03 2,146
Net Lease/Diversified
Agree Realty Corporation ADC $28.17 $419 Timber
Armada Hoffler Properties, Inc. AHH 8.90 171 CatchMark Timber Trust CTT $13.36 $186
National Retail Properties, Inc. NNN 32.14 3,917 Plum Creek Timber Company, Inc. PCL 42.03 7,439
Realty Income Corporation O 39.72 7,799 Potlatch Corp. PCH 38.37 1,555
Spirit Realty Capital, Inc. SRC 10.29 3,811 Rayonier RYN 43.44 5,485
Washington REIT WRE 22.67 1,508 Weyerhaeuser WY 29.39 17,150
RAYMOND JAMES REAL ESTATE INSTITUTIONAL RESEARCH COVERAGE
REIT Capital Market Conditions
15
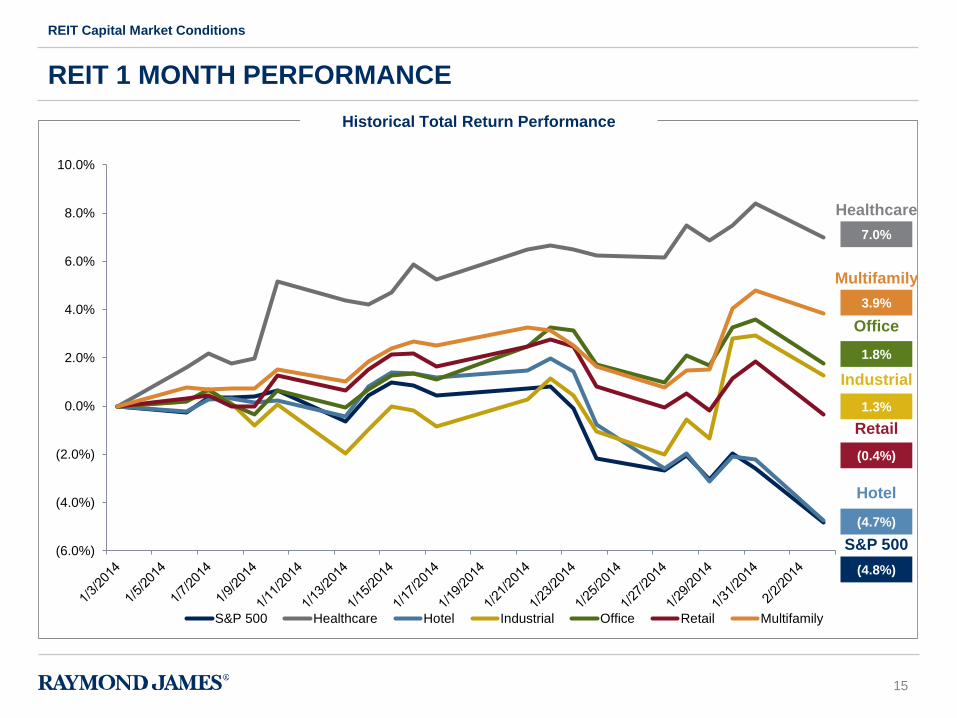
Office
(0.4%)
Retail
7.0%
Healthcare
REIT 1 MONTH PERFORMANCE
REIT Capital Market Conditions
(4.8%)
(4.7%)
Hotel
S&P 500
Historical Total Return Performance
(6.0%)
(4.0%)
(2.0%)
0.0%
2.0%
4.0%
6.0%
8.0%
10.0%
S&P 500 Healthcare Hotel Industrial Office Retail Multifamily
1.3%
Industrial
1.8%
3.9%
Multifamily
16
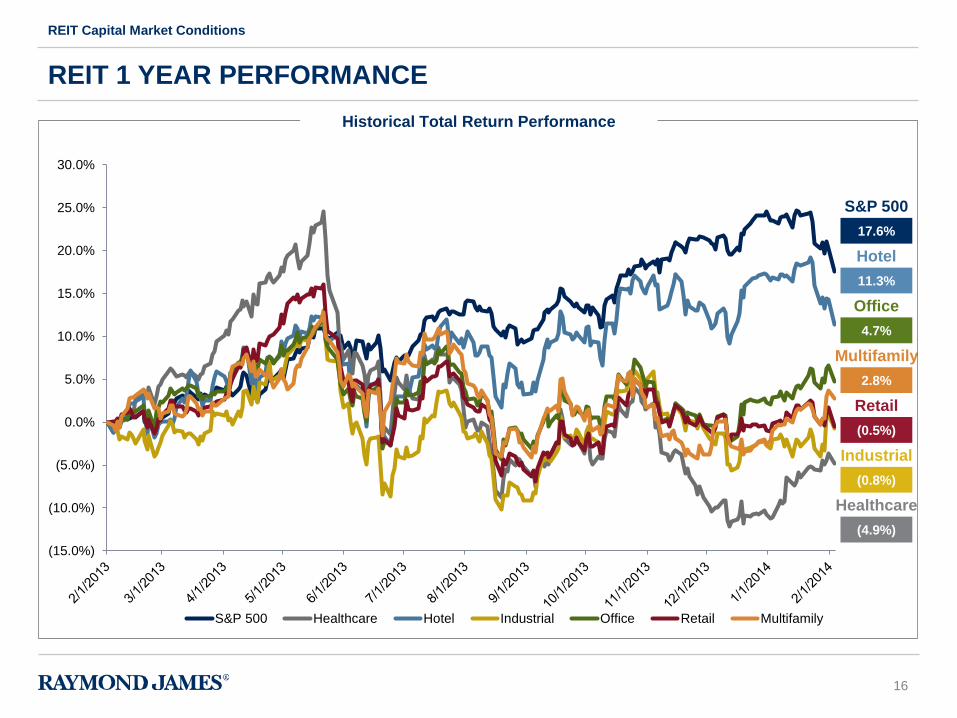
Multifamily
Office
(0.5%)
Retail
(4.9%)
Healthcare
REIT 1 YEAR PERFORMANCE
REIT Capital Market Conditions
17.6%
11.3%
Hotel
S&P 500
Historical Total Return Performance
(15.0%)
(10.0%)
(5.0%)
0.0%
5.0%
10.0%
15.0%
20.0%
25.0%
30.0%
S&P 500 Healthcare Hotel Industrial Office Retail Multifamily
(0.8%)
Industrial
4.7%
2.8%
17
Office
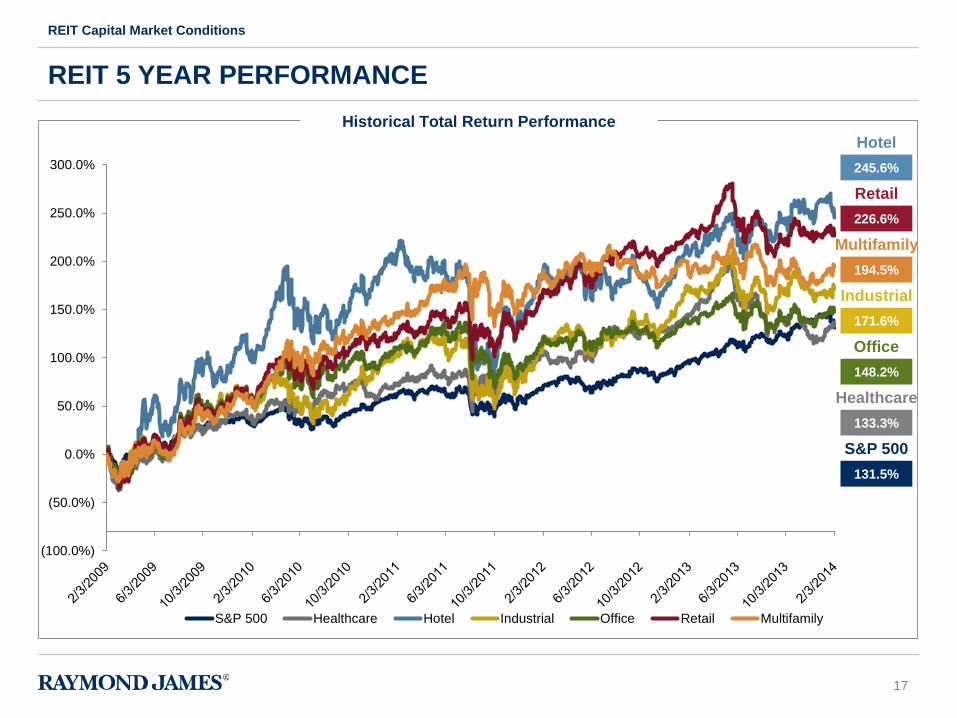
226.6%
Retail
133.3%
Healthcare
REIT 5 YEAR PERFORMANCE
REIT Capital Market Conditions
131.5%
245.6%
Hotel
S&P 500
Historical Total Return Performance
(100.0%)
(50.0%)
0.0%
50.0%
100.0%
150.0%
200.0%
250.0%
300.0%
S&P 500 Healthcare Hotel Industrial Office Retail Multifamily
171.6%
Industrial
148.2%
194.5%
Multifamily
18
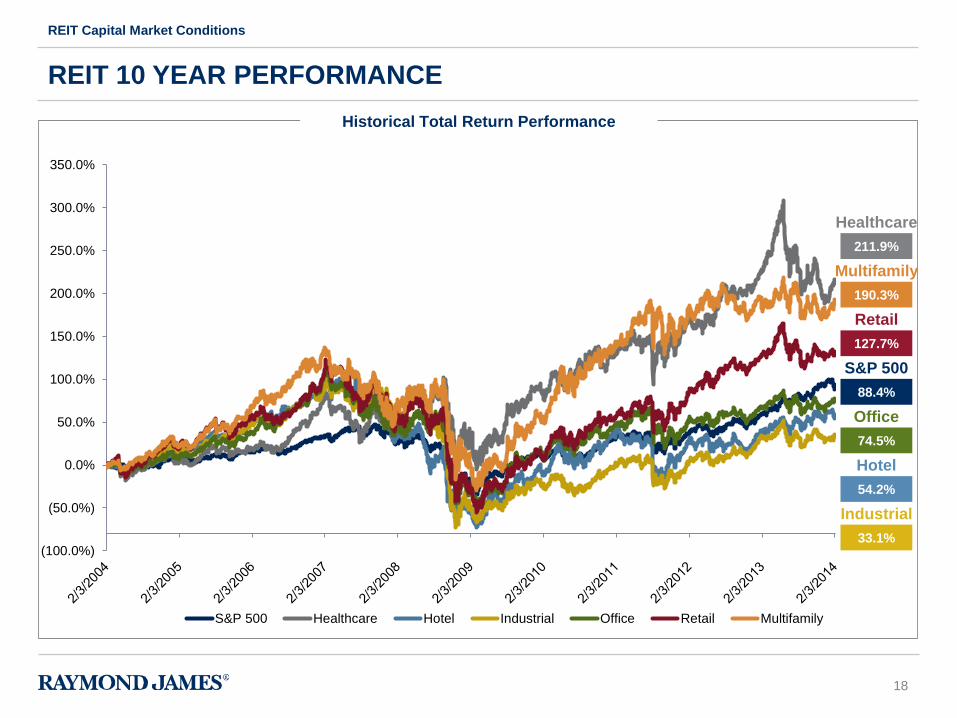
Office
127.7%
Retail
211.9%
Healthcare
REIT 10 YEAR PERFORMANCE
REIT Capital Market Conditions
88.4%
54.2%
Hotel
S&P 500
Historical Total Return Performance
(100.0%)
(50.0%)
0.0%
50.0%
100.0%
150.0%
200.0%
250.0%
300.0%
350.0%
S&P 500 Healthcare Hotel Industrial Office Retail Multifamily
33.1%
Industrial
74.5%
190.3%
Multifamily
19
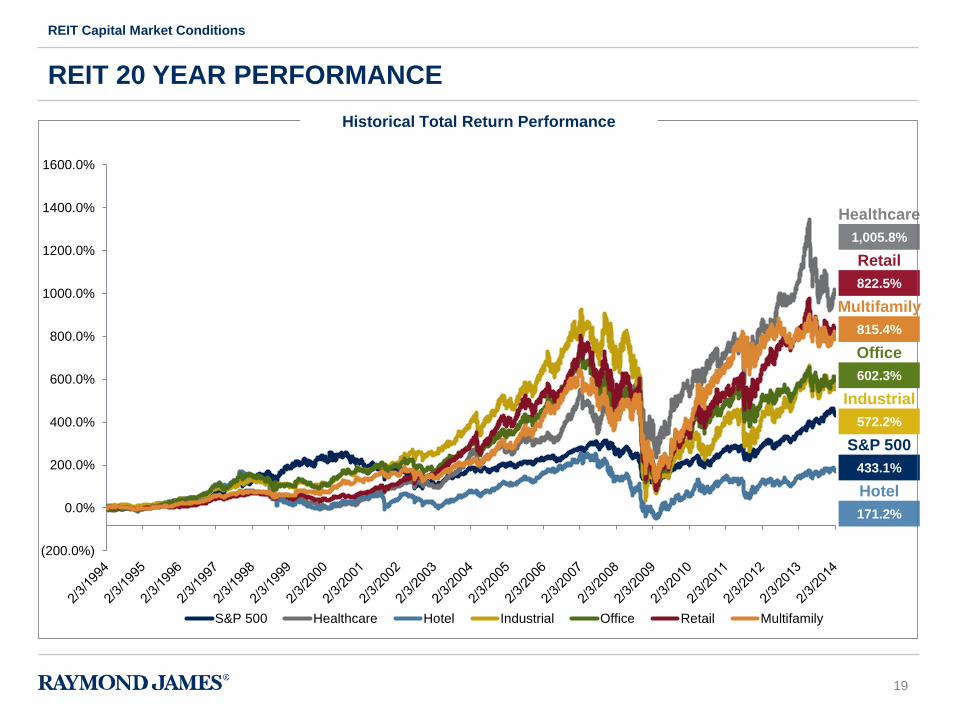
Office
822.5%
Retail
1,005.8%
Healthcare
REIT 20 YEAR PERFORMANCE
REIT Capital Market Conditions
433.1%
171.2%
Hotel
S&P 500
Historical Total Return Performance
(200.0%)
0.0%
200.0%
400.0%
600.0%
800.0%
1000.0%
1200.0%
1400.0%
1600.0%
S&P 500 Healthcare Hotel Industrial Office Retail Multifamily
572.2%
Industrial
602.3%
815.4%
Multifamily
20
CAP RATES
REIT Capital Market Conditions
• Cap rates are one of the most important metrics in the world of real estate
• A capitalization rate, more commonly referred to as a cap rate, is a rate of return on a real estate
investment property based on the expected income that the property will generate
• Just how Assets = Liabilities + Stockholder’s Equity is often considered the most basic yet important
equation in finance/accounting, one could argue that one of the most basic and important equations to
consider in real estate is the following:
• This relationship provides a basic understanding of real estate valuation, as one can take the actual net
operating income of a property and divide it by a cap rate to reach an asset value for the property
• The same principle of using any of the two variables in this equation can be used to find an implied cap
rate or NOI
• Generally speaking, a lower cap rate implies a higher valuation while a higher cap rate implies a lower
valuation
• Cap rates are often categorized into nominal and economic cap rates - nominal cap rates do not subtract
capital reserves from NOI while economic cap rates do
• Nominal cap rates are the more commonly used cap rates across most real estate sectors, with the
exceptions of lodging and student housing, where you see high capital reserves
Gross Asset Value (GAV) = Net Operating Income (NOI)
Cap Rate
21
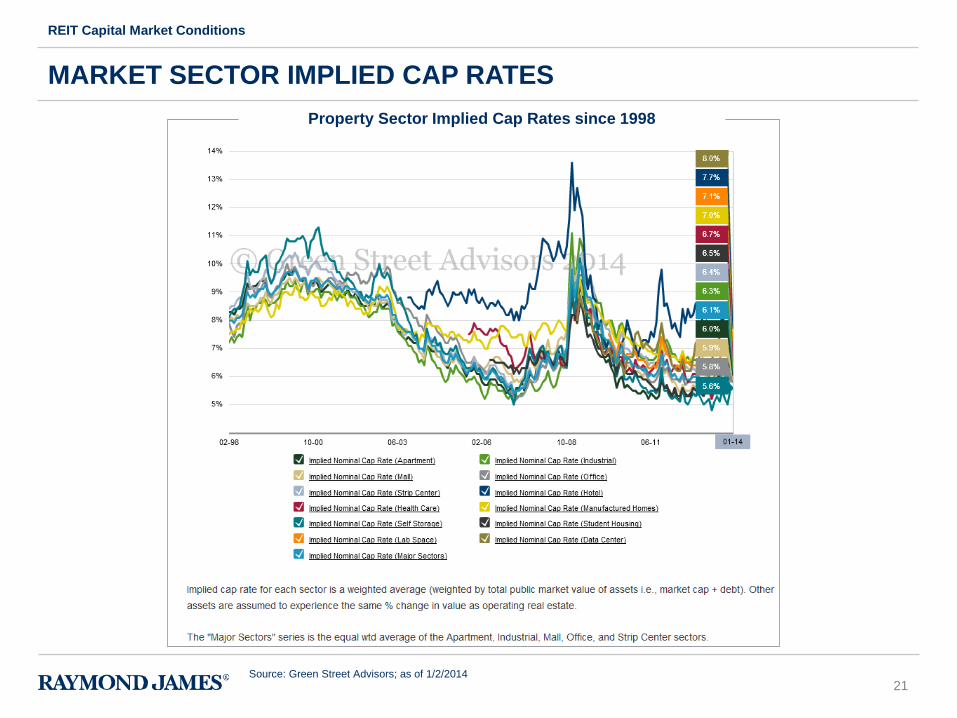
MARKET SECTOR IMPLIED CAP RATES
REIT Capital Market Conditions
Property Sector Implied Cap Rates since 1998
Source: Green Street Advisors; as of 1/2/2014
22
8.0% 7.7%
7.1% 7.0%
6.7% 6.5% 6.4% 6.3%
6.0% 5.9% 5.8% 5.6%
3.0%
4.0%
5.0%
6.0%
7.0%
8.0%
9.0%
Data Center Lodging Lab Space ManufacturedHomes
Health Care StudentHousing
Strip Center Industrial Multifamily Mall Office Self Storage
Implied Nominal Cap Rate(1)
MARKET SECTOR IMPLIED CAP RATES
REIT Capital Market Conditions
(1) Average implied nominal cap rates for each sector per Green Street Advisors as of 1/2/2014
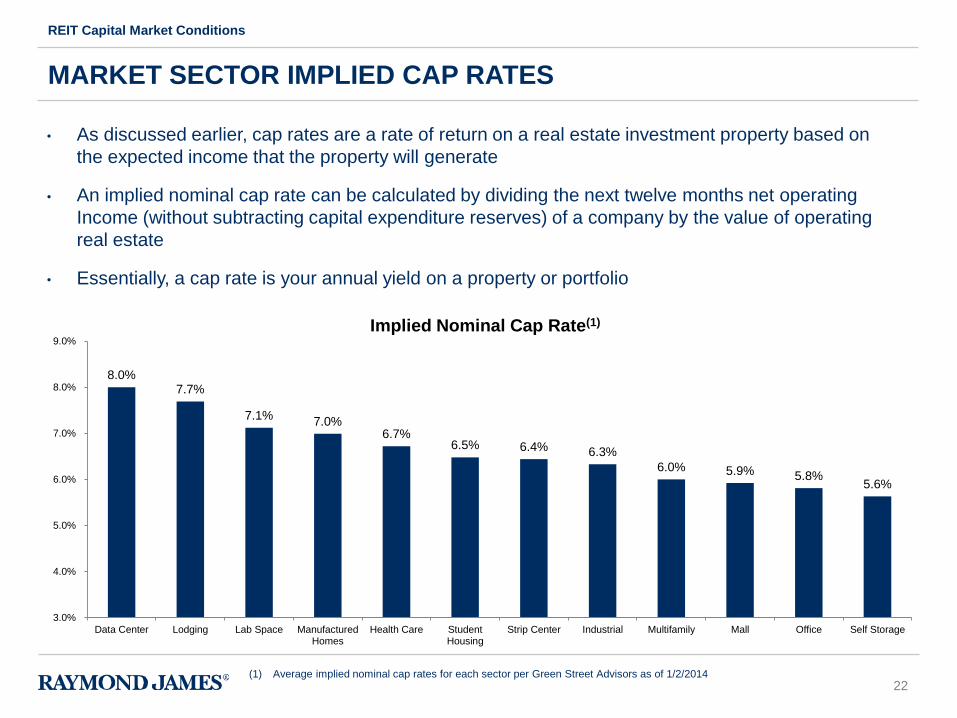
• As discussed earlier, cap rates are a rate of return on a real estate investment property based on
the expected income that the property will generate
• An implied nominal cap rate can be calculated by dividing the next twelve months net operating
Income (without subtracting capital expenditure reserves) of a company by the value of operating
real estate
• Essentially, a cap rate is your annual yield on a property or portfolio
23
Equity Residential (EQR) FY 2013
Net Income $1,901,746
Plus Depreciation 1,005,709
Gain on (Depreciable) Property Sales (2,036,512)
Other Misc. Depreciation Items & Gains 1,478
Funds From Operations (FFO) $872,421
Minus Capital Expenditures ($338,661)
Minus Other Amortizations ($22,425)
Adjusted Funds from Operations $511,335
AFFO MULTIPLES
REIT Capital Market Conditions
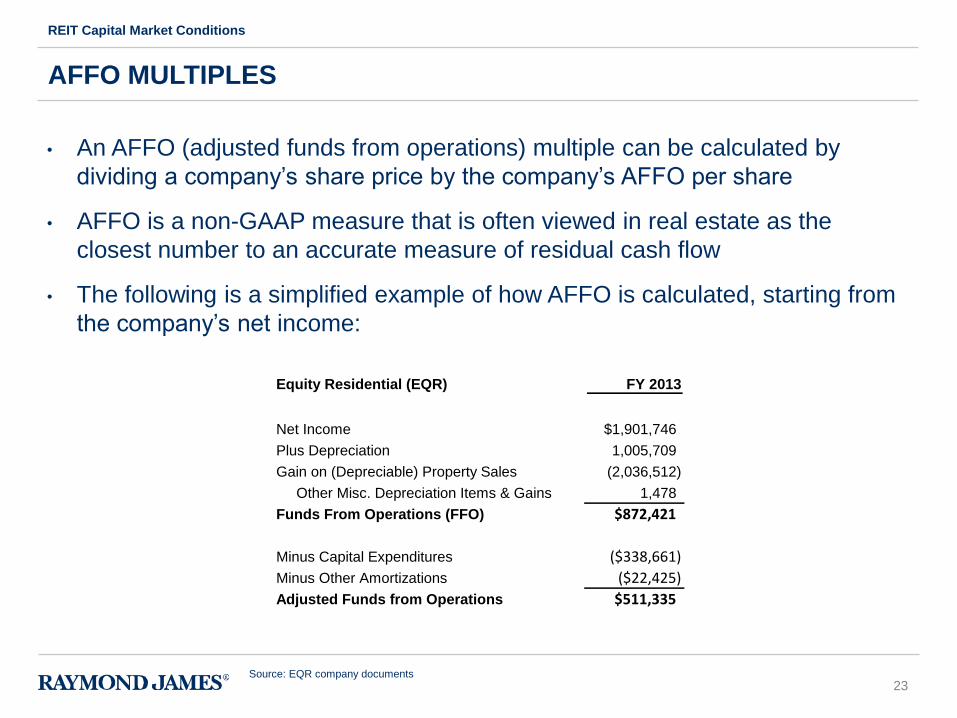
• An AFFO (adjusted funds from operations) multiple can be calculated by
dividing a company’s share price by the company’s AFFO per share
• AFFO is a non-GAAP measure that is often viewed in real estate as the
closest number to an accurate measure of residual cash flow
• The following is a simplified example of how AFFO is calculated, starting from
the company’s net income:
Source: EQR company documents
24
25.7x 24.6x
20.1x 19.5x 19.0x 18.0x
15.9x 15.4x 15.0x 14.9x
13.1x
0.0x
5.0x
10.0x
15.0x
20.0x
25.0x
30.0x
Industrial Office Self-Storage ShoppingCenter
Multifamily Mall Lab Space StudentHousing
Health Care Lodging Data Center
2014E AFFO Multiple(1)
MARKET SECTOR AFFO MULTIPLES
REIT Capital Market Conditions
(1) Based on consensus estimates as of 2/3/2014
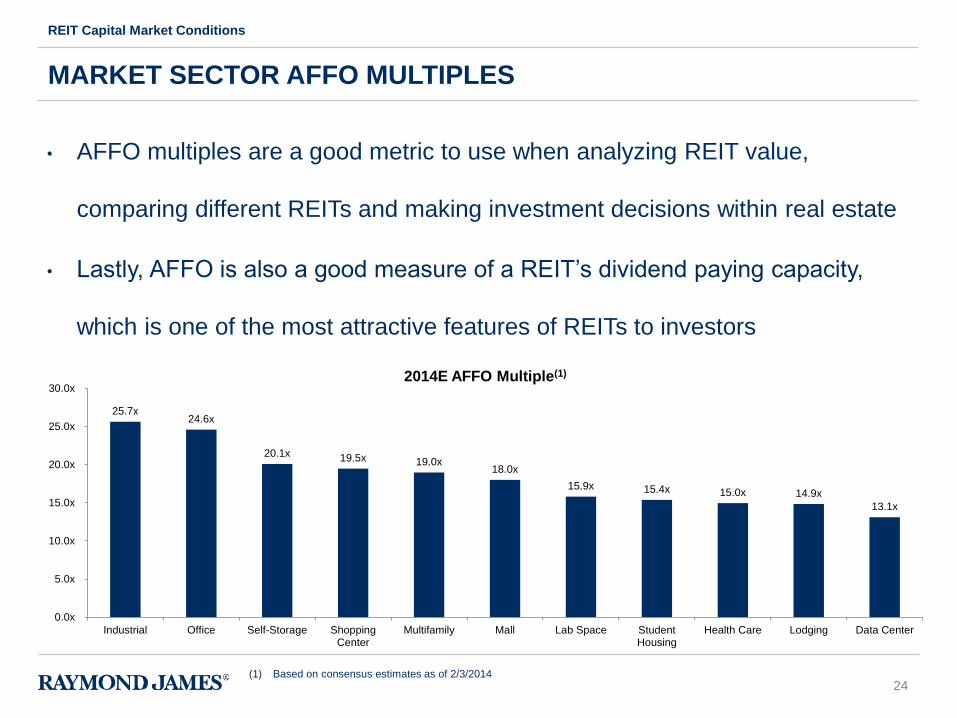
• AFFO multiples are a good metric to use when analyzing REIT value,
comparing different REITs and making investment decisions within real estate
• Lastly, AFFO is also a good measure of a REIT’s dividend paying capacity,
which is one of the most attractive features of REITs to investors
25
$11,957
$25,502
$18,261
$9,644
$20,489
$24,481
$21,749
$30,954
$38,867
$698
$0
$5,000
$10,000
$15,000
$20,000
$25,000
$30,000
$35,000
$40,000
2005 2006 2007 2008 2009 2010 2011 2012 2013 2014
$U
SD
in
mil
lio
ns
Public Real Estate Capital Raised
Initial Public Offering Follow-On Common Equity Preferred Equity Convertible Debt Convertible Preferred
HISTORICAL PUBLIC CAPITAL RAISING
REIT Capital Market Conditions
Source: Company documents
2008 2009 2010 2011
($ amounts in millions) Offerings Amount Offerings Amount Offerings Amount Offerings Amount Offerings Amount Offerings Amount Offerings Amount
Common
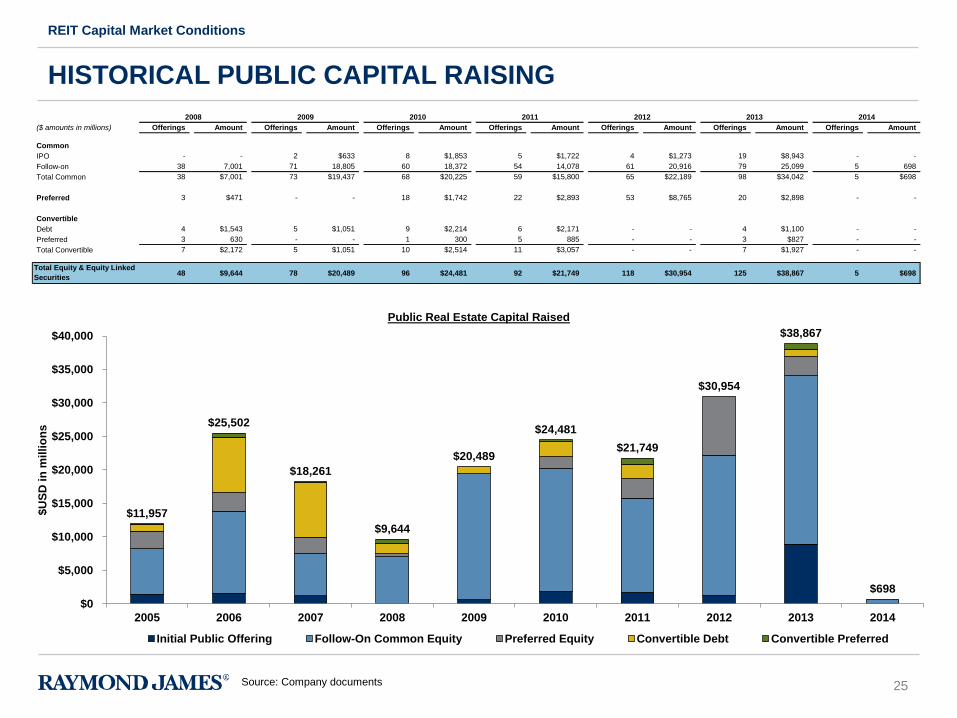
IPO - - 2 $633 8 $1,853 5 $1,722 4 $1,273 19 $8,943 - -
Follow-on 38 7,001 71 18,805 60 18,372 54 14,078 61 20,916 79 25,099 5 698
Total Common 38 $7,001 73 $19,437 68 $20,225 59 $15,800 65 $22,189 98 $34,042 5 $698
Preferred 3 $471 - - 18 $1,742 22 $2,893 53 $8,765 20 $2,898 - -
Convertible
Debt 4 $1,543 5 $1,051 9 $2,214 6 $2,171 - - 4 $1,100 - -
Preferred 3 630 - - 1 300 5 885 - - 3 $827 - -
Total Convertible 7 $2,172 5 $1,051 10 $2,514 11 $3,057 - - 7 $1,927 - -
Total Equity & Equity Linked
Securities48 $9,644 78 $20,489 96 $24,481 92 $21,749 118 $30,954 125 $38,867 5 $698
2012 2013 2014
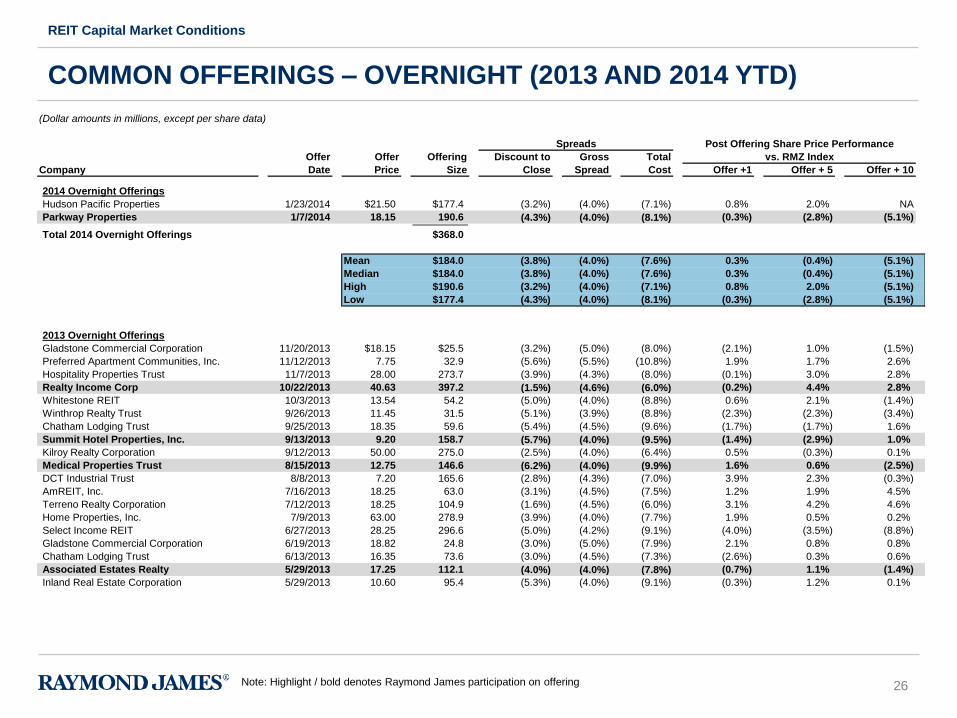
26
(Dollar amounts in millions, except per share data)
Spreads Post Offering Share Price Performance
Offer Offer Offering Discount to Gross Total vs. RMZ Index
Company Date Price Size Close Spread Cost Offer +1 Offer + 5 Offer + 10
2014 Overnight Offerings
Hudson Pacific Properties 1/23/2014 $21.50 $177.4 (3.2%) (4.0%) (7.1%) 0.8% 2.0% NA
Parkway Properties 1/7/2014 18.15 190.6 (4.3%) (4.0%) (8.1%) (0.3%) (2.8%) (5.1%)
Total 2014 Overnight Offerings $368.0
Mean $184.0 (3.8%) (4.0%) (7.6%) 0.3% (0.4%) (5.1%)
Median $184.0 (3.8%) (4.0%) (7.6%) 0.3% (0.4%) (5.1%)
High $190.6 (3.2%) (4.0%) (7.1%) 0.8% 2.0% (5.1%)
Low $177.4 (4.3%) (4.0%) (8.1%) (0.3%) (2.8%) (5.1%)
2013 Overnight Offerings
Gladstone Commercial Corporation 11/20/2013 $18.15 $25.5 (3.2%) (5.0%) (8.0%) (2.1%) 1.0% (1.5%)
Preferred Apartment Communities, Inc. 11/12/2013 7.75 32.9 (5.6%) (5.5%) (10.8%) 1.9% 1.7% 2.6%
Hospitality Properties Trust 11/7/2013 28.00 273.7 (3.9%) (4.3%) (8.0%) (0.1%) 3.0% 2.8%
Realty Income Corp 10/22/2013 40.63 397.2 (1.5%) (4.6%) (6.0%) (0.2%) 4.4% 2.8%
Whitestone REIT 10/3/2013 13.54 54.2 (5.0%) (4.0%) (8.8%) 0.6% 2.1% (1.4%)
Winthrop Realty Trust 9/26/2013 11.45 31.5 (5.1%) (3.9%) (8.8%) (2.3%) (2.3%) (3.4%)
Chatham Lodging Trust 9/25/2013 18.35 59.6 (5.4%) (4.5%) (9.6%) (1.7%) (1.7%) 1.6%
Summit Hotel Properties, Inc. 9/13/2013 9.20 158.7 (5.7%) (4.0%) (9.5%) (1.4%) (2.9%) 1.0%
Kilroy Realty Corporation 9/12/2013 50.00 275.0 (2.5%) (4.0%) (6.4%) 0.5% (0.3%) 0.1%
Medical Properties Trust 8/15/2013 12.75 146.6 (6.2%) (4.0%) (9.9%) 1.6% 0.6% (2.5%)
DCT Industrial Trust 8/8/2013 7.20 165.6 (2.8%) (4.3%) (7.0%) 3.9% 2.3% (0.3%)
AmREIT, Inc. 7/16/2013 18.25 63.0 (3.1%) (4.5%) (7.5%) 1.2% 1.9% 4.5%
Terreno Realty Corporation 7/12/2013 18.25 104.9 (1.6%) (4.5%) (6.0%) 3.1% 4.2% 4.6%
Home Properties, Inc. 7/9/2013 63.00 278.9 (3.9%) (4.0%) (7.7%) 1.9% 0.5% 0.2%
Select Income REIT 6/27/2013 28.25 296.6 (5.0%) (4.2%) (9.1%) (4.0%) (3.5%) (8.8%)
Gladstone Commercial Corporation 6/19/2013 18.82 24.8 (3.0%) (5.0%) (7.9%) 2.1% 0.8% 0.8%
Chatham Lodging Trust 6/13/2013 16.35 73.6 (3.0%) (4.5%) (7.3%) (2.6%) 0.3% 0.6%
Associated Estates Realty 5/29/2013 17.25 112.1 (4.0%) (4.0%) (7.8%) (0.7%) 1.1% (1.4%)
Inland Real Estate Corporation 5/29/2013 10.60 95.4 (5.3%) (4.0%) (9.1%) (0.3%) 1.2% 0.1%
COMMON OFFERINGS – OVERNIGHT (2013 AND 2014 YTD)
REIT Capital Market Conditions
Note: Highlight / bold denotes Raymond James participation on offering
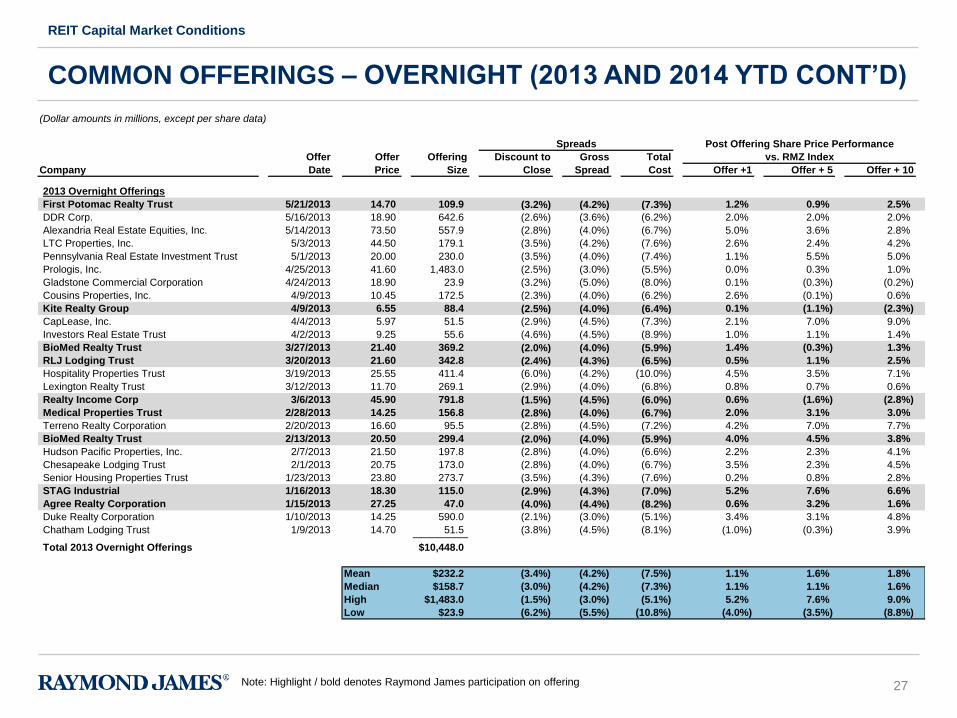
27
(Dollar amounts in millions, except per share data)
Spreads Post Offering Share Price Performance
Offer Offer Offering Discount to Gross Total vs. RMZ Index
Company Date Price Size Close Spread Cost Offer +1 Offer + 5 Offer + 10
2013 Overnight Offerings
First Potomac Realty Trust 5/21/2013 14.70 109.9 (3.2%) (4.2%) (7.3%) 1.2% 0.9% 2.5%
DDR Corp. 5/16/2013 18.90 642.6 (2.6%) (3.6%) (6.2%) 2.0% 2.0% 2.0%
Alexandria Real Estate Equities, Inc. 5/14/2013 73.50 557.9 (2.8%) (4.0%) (6.7%) 5.0% 3.6% 2.8%
LTC Properties, Inc. 5/3/2013 44.50 179.1 (3.5%) (4.2%) (7.6%) 2.6% 2.4% 4.2%
Pennsylvania Real Estate Investment Trust 5/1/2013 20.00 230.0 (3.5%) (4.0%) (7.4%) 1.1% 5.5% 5.0%
Prologis, Inc. 4/25/2013 41.60 1,483.0 (2.5%) (3.0%) (5.5%) 0.0% 0.3% 1.0%
Gladstone Commercial Corporation 4/24/2013 18.90 23.9 (3.2%) (5.0%) (8.0%) 0.1% (0.3%) (0.2%)
Cousins Properties, Inc. 4/9/2013 10.45 172.5 (2.3%) (4.0%) (6.2%) 2.6% (0.1%) 0.6%
Kite Realty Group 4/9/2013 6.55 88.4 (2.5%) (4.0%) (6.4%) 0.1% (1.1%) (2.3%)
CapLease, Inc. 4/4/2013 5.97 51.5 (2.9%) (4.5%) (7.3%) 2.1% 7.0% 9.0%
Investors Real Estate Trust 4/2/2013 9.25 55.6 (4.6%) (4.5%) (8.9%) 1.0% 1.1% 1.4%
BioMed Realty Trust 3/27/2013 21.40 369.2 (2.0%) (4.0%) (5.9%) 1.4% (0.3%) 1.3%
RLJ Lodging Trust 3/20/2013 21.60 342.8 (2.4%) (4.3%) (6.5%) 0.5% 1.1% 2.5%
Hospitality Properties Trust 3/19/2013 25.55 411.4 (6.0%) (4.2%) (10.0%) 4.5% 3.5% 7.1%
Lexington Realty Trust 3/12/2013 11.70 269.1 (2.9%) (4.0%) (6.8%) 0.8% 0.7% 0.6%
Realty Income Corp 3/6/2013 45.90 791.8 (1.5%) (4.5%) (6.0%) 0.6% (1.6%) (2.8%)
Medical Properties Trust 2/28/2013 14.25 156.8 (2.8%) (4.0%) (6.7%) 2.0% 3.1% 3.0%
Terreno Realty Corporation 2/20/2013 16.60 95.5 (2.8%) (4.5%) (7.2%) 4.2% 7.0% 7.7%
BioMed Realty Trust 2/13/2013 20.50 299.4 (2.0%) (4.0%) (5.9%) 4.0% 4.5% 3.8%
Hudson Pacific Properties, Inc. 2/7/2013 21.50 197.8 (2.8%) (4.0%) (6.6%) 2.2% 2.3% 4.1%
Chesapeake Lodging Trust 2/1/2013 20.75 173.0 (2.8%) (4.0%) (6.7%) 3.5% 2.3% 4.5%
Senior Housing Properties Trust 1/23/2013 23.80 273.7 (3.5%) (4.3%) (7.6%) 0.2% 0.8% 2.8%
STAG Industrial 1/16/2013 18.30 115.0 (2.9%) (4.3%) (7.0%) 5.2% 7.6% 6.6%
Agree Realty Corporation 1/15/2013 27.25 47.0 (4.0%) (4.4%) (8.2%) 0.6% 3.2% 1.6%
Duke Realty Corporation 1/10/2013 14.25 590.0 (2.1%) (3.0%) (5.1%) 3.4% 3.1% 4.8%
Chatham Lodging Trust 1/9/2013 14.70 51.5 (3.8%) (4.5%) (8.1%) (1.0%) (0.3%) 3.9%
Total 2013 Overnight Offerings $10,448.0
Mean $232.2 (3.4%) (4.2%) (7.5%) 1.1% 1.6% 1.8%
Median $158.7 (3.0%) (4.2%) (7.3%) 1.1% 1.1% 1.6%
High $1,483.0 (1.5%) (3.0%) (5.1%) 5.2% 7.6% 9.0%
Low $23.9 (6.2%) (5.5%) (10.8%) (4.0%) (3.5%) (8.8%)
COMMON OFFERINGS – OVERNIGHT (2013 AND 2014 YTD CONT’D)
REIT Capital Market Conditions
Note: Highlight / bold denotes Raymond James participation on offering
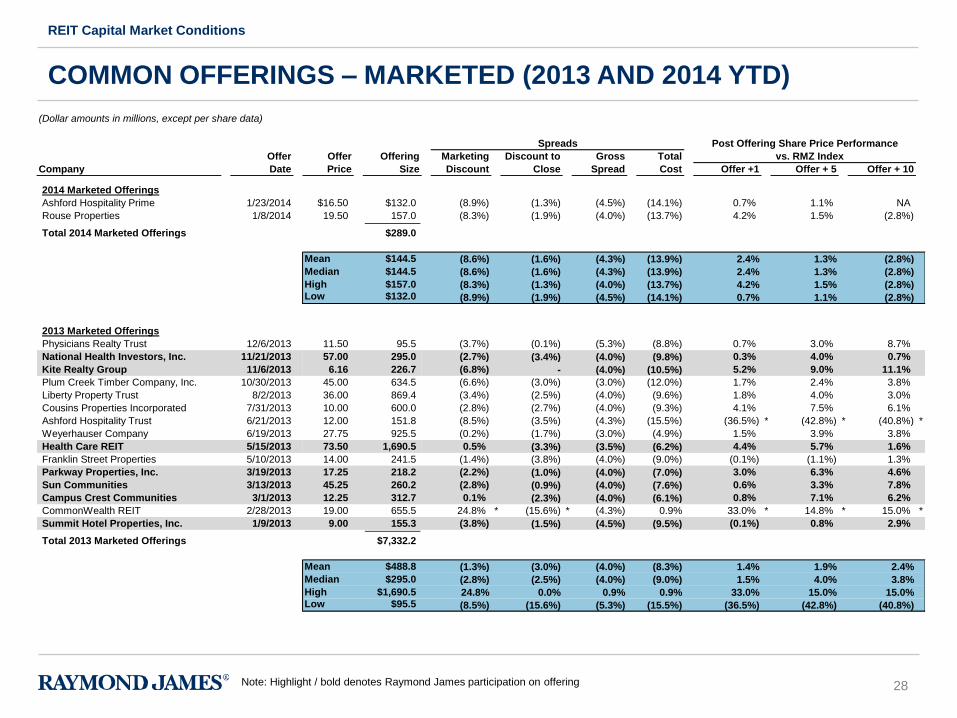
28
(Dollar amounts in millions, except per share data)
Spreads Post Offering Share Price Performance
Offer Offer Offering Marketing Discount to Gross Total vs. RMZ Index
Company Date Price Size Discount Close Spread Cost Offer +1 Offer + 5 Offer + 10
2014 Marketed Offerings
Ashford Hospitality Prime 1/23/2014 $16.50 $132.0 (8.9%) (1.3%) (4.5%) (14.1%) 0.7% 1.1% NA
Rouse Properties 1/8/2014 19.50 157.0 (8.3%) (1.9%) (4.0%) (13.7%) 4.2% 1.5% (2.8%)
Total 2014 Marketed Offerings $289.0
Mean $144.5 (8.6%) (1.6%) (4.3%) (13.9%) 2.4% 1.3% (2.8%)
Median $144.5 (8.6%) (1.6%) (4.3%) (13.9%) 2.4% 1.3% (2.8%)
High $157.0 (8.3%) (1.3%) (4.0%) (13.7%) 4.2% 1.5% (2.8%)Low $132.0 (8.9%) (1.9%) (4.5%) (14.1%) 0.7% 1.1% (2.8%)
2013 Marketed Offerings
Physicians Realty Trust 12/6/2013 11.50 95.5 (3.7%) (0.1%) (5.3%) (8.8%) 0.7% 3.0% 8.7%
National Health Investors, Inc. 11/21/2013 57.00 295.0 (2.7%) (3.4%) (4.0%) (9.8%) 0.3% 4.0% 0.7%
Kite Realty Group 11/6/2013 6.16 226.7 (6.8%) - (4.0%) (10.5%) 5.2% 9.0% 11.1%
Plum Creek Timber Company, Inc. 10/30/2013 45.00 634.5 (6.6%) (3.0%) (3.0%) (12.0%) 1.7% 2.4% 3.8%
Liberty Property Trust 8/2/2013 36.00 869.4 (3.4%) (2.5%) (4.0%) (9.6%) 1.8% 4.0% 3.0%
Cousins Properties Incorporated 7/31/2013 10.00 600.0 (2.8%) (2.7%) (4.0%) (9.3%) 4.1% 7.5% 6.1%
Ashford Hospitality Trust 6/21/2013 12.00 151.8 (8.5%) (3.5%) (4.3%) (15.5%) (36.5%) * (42.8%) * (40.8%) *
Weyerhauser Company 6/19/2013 27.75 925.5 (0.2%) (1.7%) (3.0%) (4.9%) 1.5% 3.9% 3.8%
Health Care REIT 5/15/2013 73.50 1,690.5 0.5% (3.3%) (3.5%) (6.2%) 4.4% 5.7% 1.6%
Franklin Street Properties 5/10/2013 14.00 241.5 (1.4%) (3.8%) (4.0%) (9.0%) (0.1%) (1.1%) 1.3%
Parkway Properties, Inc. 3/19/2013 17.25 218.2 (2.2%) (1.0%) (4.0%) (7.0%) 3.0% 6.3% 4.6%
Sun Communities 3/13/2013 45.25 260.2 (2.8%) (0.9%) (4.0%) (7.6%) 0.6% 3.3% 7.8%
Campus Crest Communities 3/1/2013 12.25 312.7 0.1% (2.3%) (4.0%) (6.1%) 0.8% 7.1% 6.2%
CommonWealth REIT 2/28/2013 19.00 655.5 24.8% * (15.6%) * (4.3%) 0.9% 33.0% * 14.8% * 15.0% *
Summit Hotel Properties, Inc. 1/9/2013 9.00 155.3 (3.8%) (1.5%) (4.5%) (9.5%) (0.1%) 0.8% 2.9%
Total 2013 Marketed Offerings $7,332.2
Mean $488.8 (1.3%) (3.0%) (4.0%) (8.3%) 1.4% 1.9% 2.4%
Median $295.0 (2.8%) (2.5%) (4.0%) (9.0%) 1.5% 4.0% 3.8%
High $1,690.5 24.8% 0.0% 0.9% 0.9% 33.0% 15.0% 15.0% Low $95.5 (8.5%) (15.6%) (5.3%) (15.5%) (36.5%) (42.8%) (40.8%)
COMMON OFFERINGS – MARKETED (2013 AND 2014 YTD)
REIT Capital Market Conditions
Note: Highlight / bold denotes Raymond James participation on offering
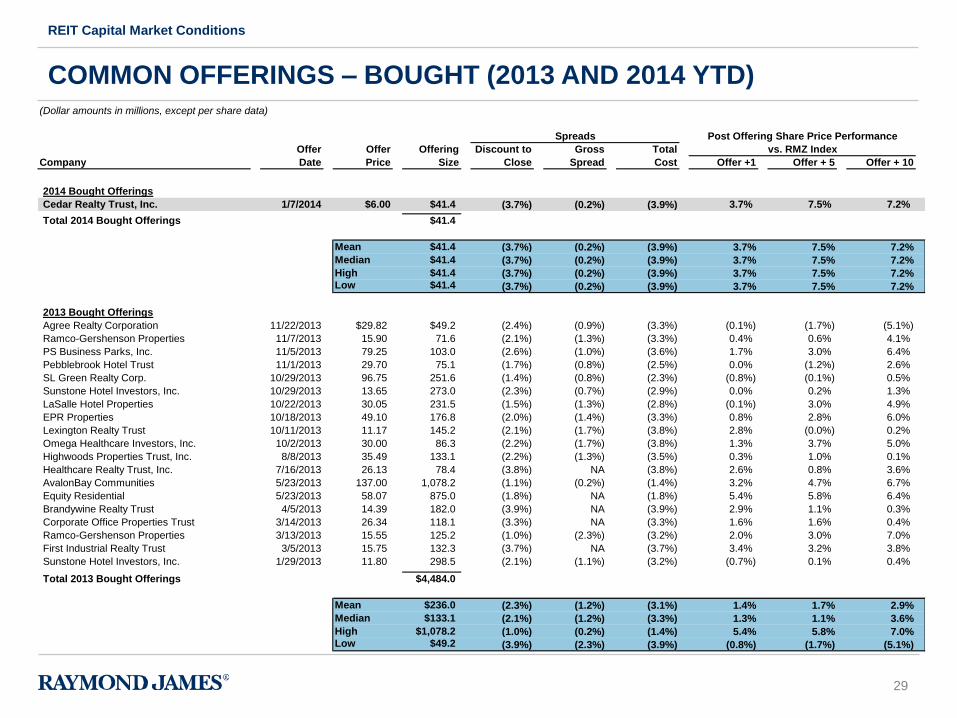
29
(Dollar amounts in millions, except per share data)
Spreads Post Offering Share Price Performance
Offer Offer Offering Discount to Gross Total vs. RMZ Index
Company Date Price Size Close Spread Cost Offer +1 Offer + 5 Offer + 10
2014 Bought Offerings
Cedar Realty Trust, Inc. 1/7/2014 $6.00 $41.4 (3.7%) (0.2%) (3.9%) 3.7% 7.5% 7.2%
Total 2014 Bought Offerings $41.4
Mean $41.4 (3.7%) (0.2%) (3.9%) 3.7% 7.5% 7.2%
Median $41.4 (3.7%) (0.2%) (3.9%) 3.7% 7.5% 7.2%
High $41.4 (3.7%) (0.2%) (3.9%) 3.7% 7.5% 7.2% Low $41.4 (3.7%) (0.2%) (3.9%) 3.7% 7.5% 7.2%
2013 Bought Offerings
Agree Realty Corporation 11/22/2013 $29.82 $49.2 (2.4%) (0.9%) (3.3%) (0.1%) (1.7%) (5.1%)
Ramco-Gershenson Properties 11/7/2013 15.90 71.6 (2.1%) (1.3%) (3.3%) 0.4% 0.6% 4.1%
PS Business Parks, Inc. 11/5/2013 79.25 103.0 (2.6%) (1.0%) (3.6%) 1.7% 3.0% 6.4%
Pebblebrook Hotel Trust 11/1/2013 29.70 75.1 (1.7%) (0.8%) (2.5%) 0.0% (1.2%) 2.6%
SL Green Realty Corp. 10/29/2013 96.75 251.6 (1.4%) (0.8%) (2.3%) (0.8%) (0.1%) 0.5%
Sunstone Hotel Investors, Inc. 10/29/2013 13.65 273.0 (2.3%) (0.7%) (2.9%) 0.0% 0.2% 1.3%
LaSalle Hotel Properties 10/22/2013 30.05 231.5 (1.5%) (1.3%) (2.8%) (0.1%) 3.0% 4.9%
EPR Properties 10/18/2013 49.10 176.8 (2.0%) (1.4%) (3.3%) 0.8% 2.8% 6.0%
Lexington Realty Trust 10/11/2013 11.17 145.2 (2.1%) (1.7%) (3.8%) 2.8% (0.0%) 0.2%
Omega Healthcare Investors, Inc. 10/2/2013 30.00 86.3 (2.2%) (1.7%) (3.8%) 1.3% 3.7% 5.0%
Highwoods Properties Trust, Inc. 8/8/2013 35.49 133.1 (2.2%) (1.3%) (3.5%) 0.3% 1.0% 0.1%
Healthcare Realty Trust, Inc. 7/16/2013 26.13 78.4 (3.8%) NA (3.8%) 2.6% 0.8% 3.6%
AvalonBay Communities 5/23/2013 137.00 1,078.2 (1.1%) (0.2%) (1.4%) 3.2% 4.7% 6.7%
Equity Residential 5/23/2013 58.07 875.0 (1.8%) NA (1.8%) 5.4% 5.8% 6.4%
Brandywine Realty Trust 4/5/2013 14.39 182.0 (3.9%) NA (3.9%) 2.9% 1.1% 0.3%
Corporate Office Properties Trust 3/14/2013 26.34 118.1 (3.3%) NA (3.3%) 1.6% 1.6% 0.4%
Ramco-Gershenson Properties 3/13/2013 15.55 125.2 (1.0%) (2.3%) (3.2%) 2.0% 3.0% 7.0%
First Industrial Realty Trust 3/5/2013 15.75 132.3 (3.7%) NA (3.7%) 3.4% 3.2% 3.8%
Sunstone Hotel Investors, Inc. 1/29/2013 11.80 298.5 (2.1%) (1.1%) (3.2%) (0.7%) 0.1% 0.4%
Total 2013 Bought Offerings $4,484.0
Mean $236.0 (2.3%) (1.2%) (3.1%) 1.4% 1.7% 2.9%
Median $133.1 (2.1%) (1.2%) (3.3%) 1.3% 1.1% 3.6%
High $1,078.2 (1.0%) (0.2%) (1.4%) 5.4% 5.8% 7.0% Low $49.2 (3.9%) (2.3%) (3.9%) (0.8%) (1.7%) (5.1%)
COMMON OFFERINGS – BOUGHT (2013 AND 2014 YTD)
REIT Capital Market Conditions
30
Overview of Preferred Stock and Offerings
SECTION 4
31
PREFERRED STOCK
Overview of Preferred Stock and Offerings
• Some of the features of preferred stock include:
- A class of ownership in a corporation that has a higher claim on the
assets and earnings than common stock
- Generally has a dividend that must be paid out before dividends to
common stockholders and typically accrues if the company doesn’t
pay it
- The value of preferred stock, similar to a bond, is sensitive to interest
rates
- While preferred stock has no maturity date, the shares may be called
by the issuer after a certain date
o The motivation for the redemption is generally the same as for
bonds; a company calls securities that pay higher rates than what
the market is currently offering
32
PREFERRED STOCK (CONT’D)
Overview of Preferred Stock and Offerings
• Preferred stock is attractive to investors because:
- Preferred shareholders have priority over common stockholders on
earnings and assets in the event of liquidation
- Preferred stock, similar to a bond, has a fixed periodic cash payment in
the form of a dividend (paid before common stockholders)
• Some of the negatives of preferred stock in comparison to common stock
are:
- Preferred shareholders often have no voting rights
- There is less potential for price appreciation
33
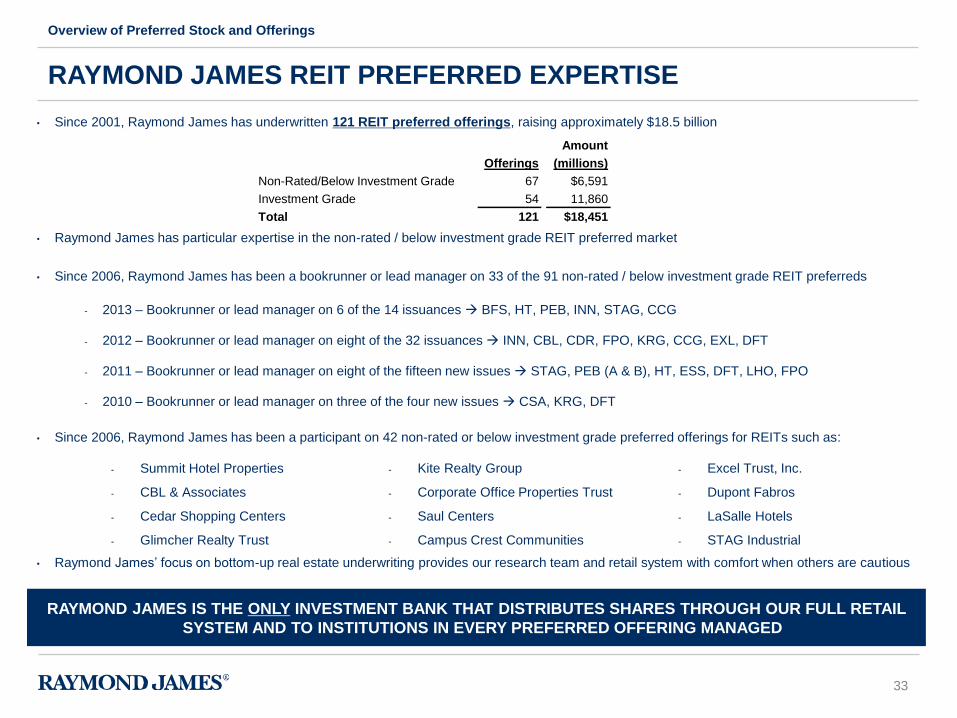
• Since 2001, Raymond James has underwritten 121 REIT preferred offerings, raising approximately $18.5 billion
• Raymond James has particular expertise in the non-rated / below investment grade REIT preferred market
• Since 2006, Raymond James has been a bookrunner or lead manager on 33 of the 91 non-rated / below investment grade REIT preferreds
- 2013 – Bookrunner or lead manager on 6 of the 14 issuances BFS, HT, PEB, INN, STAG, CCG
- 2012 – Bookrunner or lead manager on eight of the 32 issuances INN, CBL, CDR, FPO, KRG, CCG, EXL, DFT
- 2011 – Bookrunner or lead manager on eight of the fifteen new issues STAG, PEB (A & B), HT, ESS, DFT, LHO, FPO
- 2010 – Bookrunner or lead manager on three of the four new issues CSA, KRG, DFT
• Since 2006, Raymond James has been a participant on 42 non-rated or below investment grade preferred offerings for REITs such as:
• Raymond James’ focus on bottom-up real estate underwriting provides our research team and retail system with comfort when others are cautious
RAYMOND JAMES REIT PREFERRED EXPERTISE
Overview of Preferred Stock and Offerings
- Summit Hotel Properties
- CBL & Associates
- Cedar Shopping Centers
- Glimcher Realty Trust
- Kite Realty Group
- Corporate Office Properties Trust
- Saul Centers
- Campus Crest Communities
- Excel Trust, Inc.
- Dupont Fabros
- LaSalle Hotels
- STAG Industrial
RAYMOND JAMES IS THE ONLY INVESTMENT BANK THAT DISTRIBUTES SHARES THROUGH OUR FULL RETAIL
SYSTEM AND TO INSTITUTIONS IN EVERY PREFERRED OFFERING MANAGED
Amount
Offerings (millions)
Non-Rated/Below Investment Grade 67 $6,591
Investment Grade 54 11,860
Total 121 $18,451
34
EXECUTION KEYS – PREFERRED OFFERING
Overview of Preferred Stock and Offerings
• Best pricing and execution requires the ability to distribute both institutionally and through the full retail system without restrictions
Why is retail distribution important?
- Retail will provide the best pricing execution
- Retail can be the largest block order and will be an “at-the-market” order
- The marginal order prices the entire offering
• Strong research support and understanding
- Sub-investment grade rated preferred securities require an understanding of the story and credit to sell effectively
- Many investment banks require research to sell sub-investment grade / non-rated product to the retail system
- Much easier to generate retail demand when Company is known throughout a firm’s retail system (achieved through research coverage)
• Significant offering experience with this type of security
- REIT preferreds are a niche investment product and prior offering experience is key to an effective execution
- Knowledge of and relationships with the five to ten core institutional buyers
RETAIL DISTRIBUTION AND RESEARCH ARE EXTREMELY IMPORTANT WHEN ISSUING NON-RATED / BELOW
INVESTMENT GRADE REIT OFFERINGS
35
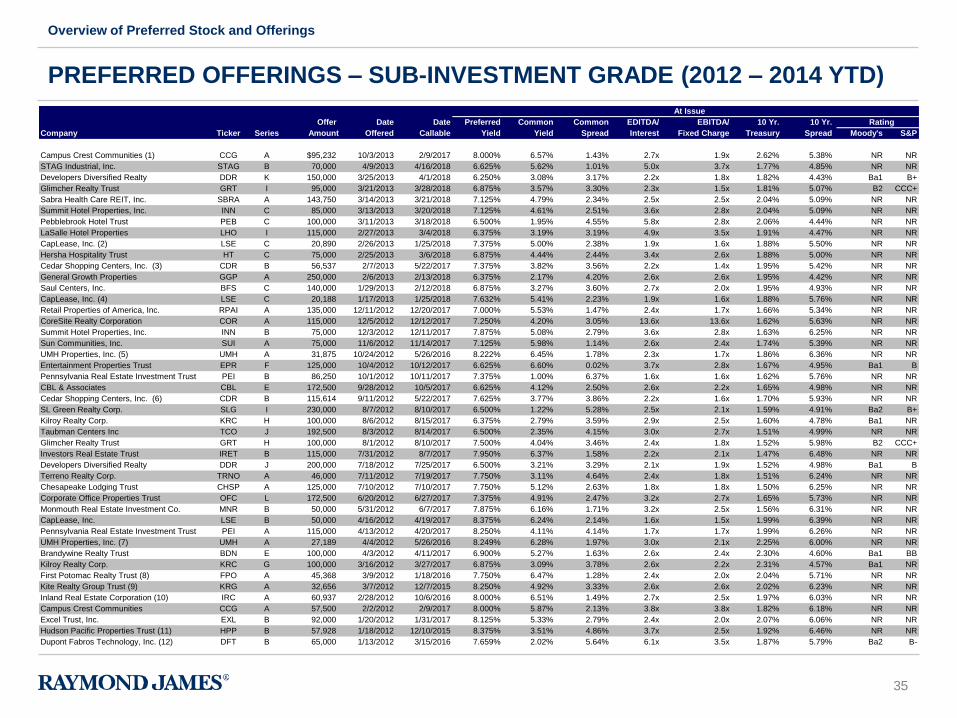
PREFERRED OFFERINGS – SUB-INVESTMENT GRADE (2012 – 2014 YTD)
Overview of Preferred Stock and Offerings
At Issue Current
Offer Date Date Preferred Common Common EDITDA/ EBITDA/ 10 Yr. 10 Yr. Rating
Company Ticker Series Amount Offered Callable Yield Yield Spread Interest Fixed Charge Treasury Spread Moody's S&P
Campus Crest Communities (1) CCG A $95,232 10/3/2013 2/9/2017 8.000% 6.57% 1.43% 2.7x 1.9x 2.62% 5.38% NR NR
STAG Industrial, Inc. STAG B 70,000 4/9/2013 4/16/2018 6.625% 5.62% 1.01% 5.0x 3.7x 1.77% 4.85% NR NR
Developers Diversified Realty DDR K 150,000 3/25/2013 4/1/2018 6.250% 3.08% 3.17% 2.2x 1.8x 1.82% 4.43% Ba1 B+
Glimcher Realty Trust GRT I 95,000 3/21/2013 3/28/2018 6.875% 3.57% 3.30% 2.3x 1.5x 1.81% 5.07% B2 CCC+
Sabra Health Care REIT, Inc. SBRA A 143,750 3/14/2013 3/21/2018 7.125% 4.79% 2.34% 2.5x 2.5x 2.04% 5.09% NR NR
Summit Hotel Properties, Inc. INN C 85,000 3/13/2013 3/20/2018 7.125% 4.61% 2.51% 3.6x 2.8x 2.04% 5.09% NR NR
Pebblebrook Hotel Trust PEB C 100,000 3/11/2013 3/18/2018 6.500% 1.95% 4.55% 5.8x 2.8x 2.06% 4.44% NR NR
LaSalle Hotel Properties LHO I 115,000 2/27/2013 3/4/2018 6.375% 3.19% 3.19% 4.9x 3.5x 1.91% 4.47% NR NR
CapLease, Inc. (2) LSE C 20,890 2/26/2013 1/25/2018 7.375% 5.00% 2.38% 1.9x 1.6x 1.88% 5.50% NR NR
Hersha Hospitality Trust HT C 75,000 2/25/2013 3/6/2018 6.875% 4.44% 2.44% 3.4x 2.6x 1.88% 5.00% NR NR
Cedar Shopping Centers, Inc. (3) CDR B 56,537 2/7/2013 5/22/2017 7.375% 3.82% 3.56% 2.2x 1.4x 1.95% 5.42% NR NR
General Growth Properties GGP A 250,000 2/6/2013 2/13/2018 6.375% 2.17% 4.20% 2.6x 2.6x 1.95% 4.42% NR NR
Saul Centers, Inc. BFS C 140,000 1/29/2013 2/12/2018 6.875% 3.27% 3.60% 2.7x 2.0x 1.95% 4.93% NR NR
CapLease, Inc. (4) LSE C 20,188 1/17/2013 1/25/2018 7.632% 5.41% 2.23% 1.9x 1.6x 1.88% 5.76% NR NR
Retail Properties of America, Inc. RPAI A 135,000 12/11/2012 12/20/2017 7.000% 5.53% 1.47% 2.4x 1.7x 1.66% 5.34% NR NR
CoreSite Realty Corporation COR A 115,000 12/5/2012 12/12/2017 7.250% 4.20% 3.05% 13.6x 13.6x 1.62% 5.63% NR NR
Summit Hotel Properties, Inc. INN B 75,000 12/3/2012 12/11/2017 7.875% 5.08% 2.79% 3.6x 2.8x 1.63% 6.25% NR NR
Sun Communities, Inc. SUI A 75,000 11/6/2012 11/14/2017 7.125% 5.98% 1.14% 2.6x 2.4x 1.74% 5.39% NR NR
UMH Properties, Inc. (5) UMH A 31,875 10/24/2012 5/26/2016 8.222% 6.45% 1.78% 2.3x 1.7x 1.86% 6.36% NR NR
Entertainment Properties Trust EPR F 125,000 10/4/2012 10/12/2017 6.625% 6.60% 0.02% 3.7x 2.8x 1.67% 4.95% Ba1 B
Pennsylvania Real Estate Investment Trust PEI B 86,250 10/1/2012 10/11/2017 7.375% 1.00% 6.37% 1.6x 1.6x 1.62% 5.76% NR NR
CBL & Associates CBL E 172,500 9/28/2012 10/5/2017 6.625% 4.12% 2.50% 2.6x 2.2x 1.65% 4.98% NR NR
Cedar Shopping Centers, Inc. (6) CDR B 115,614 9/11/2012 5/22/2017 7.625% 3.77% 3.86% 2.2x 1.6x 1.70% 5.93% NR NR
SL Green Realty Corp. SLG I 230,000 8/7/2012 8/10/2017 6.500% 1.22% 5.28% 2.5x 2.1x 1.59% 4.91% Ba2 B+
Kilroy Realty Corp. KRC H 100,000 8/6/2012 8/15/2017 6.375% 2.79% 3.59% 2.9x 2.5x 1.60% 4.78% Ba1 NR
Taubman Centers Inc TCO J 192,500 8/3/2012 8/14/2017 6.500% 2.35% 4.15% 3.0x 2.7x 1.51% 4.99% NR NR
Glimcher Realty Trust GRT H 100,000 8/1/2012 8/10/2017 7.500% 4.04% 3.46% 2.4x 1.8x 1.52% 5.98% B2 CCC+
Investors Real Estate Trust IRET B 115,000 7/31/2012 8/7/2017 7.950% 6.37% 1.58% 2.2x 2.1x 1.47% 6.48% NR NR
Developers Diversified Realty DDR J 200,000 7/18/2012 7/25/2017 6.500% 3.21% 3.29% 2.1x 1.9x 1.52% 4.98% Ba1 B
Terreno Realty Corp. TRNO A 46,000 7/11/2012 7/19/2017 7.750% 3.11% 4.64% 2.4x 1.8x 1.51% 6.24% NR NR
Chesapeake Lodging Trust CHSP A 125,000 7/10/2012 7/10/2017 7.750% 5.12% 2.63% 1.8x 1.8x 1.50% 6.25% NR NR
Corporate Office Properties Trust OFC L 172,500 6/20/2012 6/27/2017 7.375% 4.91% 2.47% 3.2x 2.7x 1.65% 5.73% NR NR
Monmouth Real Estate Investment Co. MNR B 50,000 5/31/2012 6/7/2017 7.875% 6.16% 1.71% 3.2x 2.5x 1.56% 6.31% NR NR
CapLease, Inc. LSE B 50,000 4/16/2012 4/19/2017 8.375% 6.24% 2.14% 1.6x 1.5x 1.99% 6.39% NR NR
Pennsylvania Real Estate Investment Trust PEI A 115,000 4/13/2012 4/20/2017 8.250% 4.11% 4.14% 1.7x 1.7x 1.99% 6.26% NR NR
UMH Properties, Inc. (7) UMH A 27,189 4/4/2012 5/26/2016 8.249% 6.28% 1.97% 3.0x 2.1x 2.25% 6.00% NR NR
Brandywine Realty Trust BDN E 100,000 4/3/2012 4/11/2017 6.900% 5.27% 1.63% 2.6x 2.4x 2.30% 4.60% Ba1 BB
Kilroy Realty Corp. KRC G 100,000 3/16/2012 3/27/2017 6.875% 3.09% 3.78% 2.6x 2.2x 2.31% 4.57% Ba1 NR
First Potomac Realty Trust (8) FPO A 45,368 3/9/2012 1/18/2016 7.750% 6.47% 1.28% 2.4x 2.0x 2.04% 5.71% NR NR
Kite Realty Group Trust (9) KRG A 32,656 3/7/2012 12/7/2015 8.250% 4.92% 3.33% 2.6x 2.6x 2.02% 6.23% NR NR
Inland Real Estate Corporation (10) IRC A 60,937 2/28/2012 10/6/2016 8.000% 6.51% 1.49% 2.7x 2.5x 1.97% 6.03% NR NR
Campus Crest Communities CCG A 57,500 2/2/2012 2/9/2017 8.000% 5.87% 2.13% 3.8x 3.8x 1.82% 6.18% NR NR
Excel Trust, Inc. EXL B 92,000 1/20/2012 1/31/2017 8.125% 5.33% 2.79% 2.4x 2.0x 2.07% 6.06% NR NR
Hudson Pacific Properties Trust (11) HPP B 57,928 1/18/2012 12/10/2015 8.375% 3.51% 4.86% 3.7x 2.5x 1.92% 6.46% NR NR
Dupont Fabros Technology, Inc. (12) DFT B 65,000 1/13/2012 3/15/2016 7.659% 2.02% 5.64% 6.1x 3.5x 1.87% 5.79% Ba2 B-
36
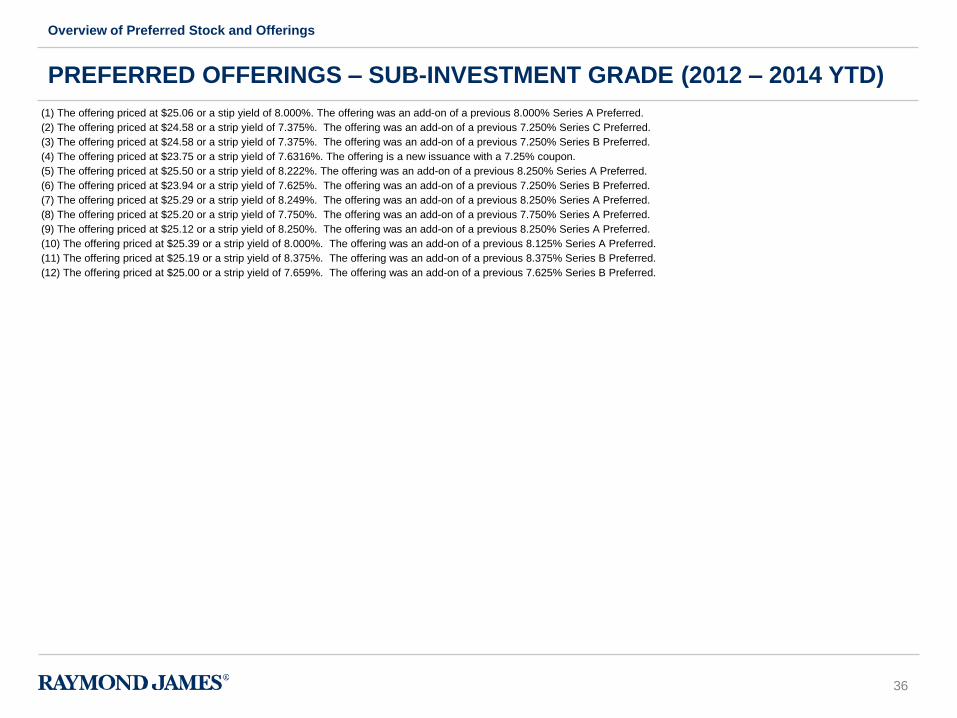
PREFERRED OFFERINGS – SUB-INVESTMENT GRADE (2012 – 2014 YTD)
Overview of Preferred Stock and Offerings
(1) The offering priced at $25.06 or a stip yield of 8.000%. The offering was an add-on of a previous 8.000% Series A Preferred.
(2) The offering priced at $24.58 or a strip yield of 7.375%. The offering was an add-on of a previous 7.250% Series C Preferred.
(3) The offering priced at $24.58 or a strip yield of 7.375%. The offering was an add-on of a previous 7.250% Series B Preferred.
(4) The offering priced at $23.75 or a strip yield of 7.6316%. The offering is a new issuance with a 7.25% coupon.
(5) The offering priced at $25.50 or a strip yield of 8.222%. The offering was an add-on of a previous 8.250% Series A Preferred.
(6) The offering priced at $23.94 or a strip yield of 7.625%. The offering was an add-on of a previous 7.250% Series B Preferred.
(7) The offering priced at $25.29 or a strip yield of 8.249%. The offering was an add-on of a previous 8.250% Series A Preferred.
(8) The offering priced at $25.20 or a strip yield of 7.750%. The offering was an add-on of a previous 7.750% Series A Preferred.
(9) The offering priced at $25.12 or a strip yield of 8.250%. The offering was an add-on of a previous 8.250% Series A Preferred.
(10) The offering priced at $25.39 or a strip yield of 8.000%. The offering was an add-on of a previous 8.125% Series A Preferred.
(11) The offering priced at $25.19 or a strip yield of 8.375%. The offering was an add-on of a previous 8.375% Series B Preferred.
(12) The offering priced at $25.00 or a strip yield of 7.659%. The offering was an add-on of a previous 7.625% Series B Preferred.

37
PREFERRED OFFERINGS – INVESTMENT GRADE (2012 – 2014 YTD)
Overview of Preferred Stock and Offerings
At Issue Current
Offer Date Date Preferred Common Common 10 Yr. 10 Yr. Rating
Company Ticker Series Amount Offered Callable Yield Yield Spread Treasury Spread Moody's S&P
National Retail Properties NNN E $287,500 5/22/2013 5/30/2018 5.700% 3.90% 1.80% 2.03% 3.67% Baa3 BB+
Digital Realty Trust, Inc. DLR G 250,000 4/2/2013 8/9/2018 5.875% 4.40% 1.48% 1.86% 4.02% Baa3 BB+
PS Business Parks, Inc. PSB V 110,000 3/5/2013 3/14/2018 5.700% 2.32% 3.38% 1.90% 3.80% Baa3 BBB-
Public Storage, Inc. PSA X 225,000 3/4/2013 3/13/2018 5.200% 3.27% 1.93% 1.88% 3.32% A3 BBB+
Vornado Realty Trust VNO L 300,000 1/17/2013 1/25/2018 5.400% 3.31% 2.09% 1.88% 3.53% Baa3 BBB-
Public Storage, Inc. PSA W 450,000 1/7/2013 1/16/2018 5.200% 3.01% 2.19% 1.92% 3.28% A3 BBB+
Kimco Realty Corp. KIM K 175,000 11/28/2012 12/7/2017 5.625% 4.46% 1.17% 1.62% 4.01% Baa2 BBB-
Public Storage, Inc. PSA V 495,000 9/11/2012 9/20/2017 5.375% 3.05% 2.32% 1.70% 3.68% Baa1 BBB+
PS Business Parks, Inc. PSB U 230,000 9/5/2012 9/14/2017 5.750% 2.54% 3.21% 1.60% 4.16% Baa3 BBB-
Regency Centers Corp. REG G 75,000 8/14/2012 8/23/2017 6.000% 3.87% 2.13% 1.81% 4.19% Baa3 BB+
Kimco Realty Corp. KIM J 225,000 7/16/2012 7/25/2017 5.500% 3.90% 1.60% 1.47% 4.03% Baa2 BBB-
Vornado Realty Trust VNO K 300,000 7/11/2012 7/18/2017 5.700% 3.28% 2.42% 1.50% 4.20% Baa3 BBB-
Public Storage, Inc. PSA U 250,000 6/6/2012 6/15/2017 5.625% 3.22% 2.40% 1.66% 3.97% Baa1 BBB+
PS Business Parks, Inc. PSB T 350,000 5/3/2012 5/14/2017 6.000% 2.56% 3.44% 1.93% 4.07% Baa3 BBB-
Realty Income Corp. ^ O F 35,401 4/12/2012 2/15/2017 6.532% 4.64% 1.90% 2.06% 4.48% Baa2 BB+
Digital Realty Trust, Inc. DLR F 182,500 3/29/2012 8/5/2017 6.625% 4.00% 2.62% 2.18% 4.45% Baa3 BB+
Kimco Realty Corp. KIM I 400,000 3/9/2012 3/20/2017 6.000% 4.18% 1.82% 2.01% 3.99% Baa2 BBB-
Alexandria Real Estate Equities, Inc. ARE E 130,000 3/8/2012 3/15/2017 6.450% 2.78% 3.67% 2.00% 4.45% Baa3 BB
Public Storage, Inc. PSA T 462,500 3/6/2012 3/13/2017 5.750% 3.35% 2.40% 1.94% 3.81% Baa1 BBB+
Health Care REIT HCN J 287,500 2/29/2012 3/7/2017 6.500% 5.44% 1.06% 1.98% 4.52% Baa3 BB
National Retail Properties NNN D 287,500 2/15/2012 2/23/2017 6.625% 5.84% 0.79% 1.99% 4.64% Baa3 BB+
Regency Centers Corp. REG F 250,000 2/7/2012 2/16/2017 6.625% 4.48% 2.15% 1.98% 4.65% Baa3 BB+
Realty Income Corp. O F 373,750 1/31/2012 2/15/2017 6.625% 4.82% 1.81% 1.79% 4.83% Baa2 BB+
Hospitality Properties Trust HPT D 290,000 1/13/2012 1/15/2017 7.125% 7.33% (0.20%) 1.87% 5.26% Baa3 BB
PS Business Parks, Inc. PSB S 230,000 1/10/2012 1/18/2017 6.450% 3.06% 3.39% 1.93% 4.52% Baa3 BBB-
Public Storage, Inc. PSA S 460,000 1/5/2012 1/12/2017 5.900% 2.86% 3.04% 2.02% 3.88% Baa1 BBB+
* This issuance is rated BBB- by Fitch.

38
Overview of Non-Traded REITs
SECTION 5
39
NON-TRADED REITS
Overview of Non-Traded REITs
• While the majority of REITs are publicly traded, there are REITs that are known as
non-traded (or non-listed) REITs
• Non-traded REITs are asset vehicles with no employees of their own, but rather they
are managed by an external advisor/sponsor
• There are currently 71 non-traded REITs in the US
• The external advisor may manage multiple non-traded REITs at the same time, in
exchange for a series of fees
• Because they are not publicly traded, non-traded REITs raise capital through one
time investors who have access to the investment through a broker, who receives a
commission for the sale of this illiquid investment
• Once the non-traded REIT has either reached the maximum of capital that it may
raise or has decided to no longer raise more capital, the non-traded REIT is “closed”
and no further investments are accepted
• Non-traded REITs end with a liquidity event – the most common liquidity events are
initial public offerings (IPOs) and direct acquisitions by other corporations or private
equity firms.
40
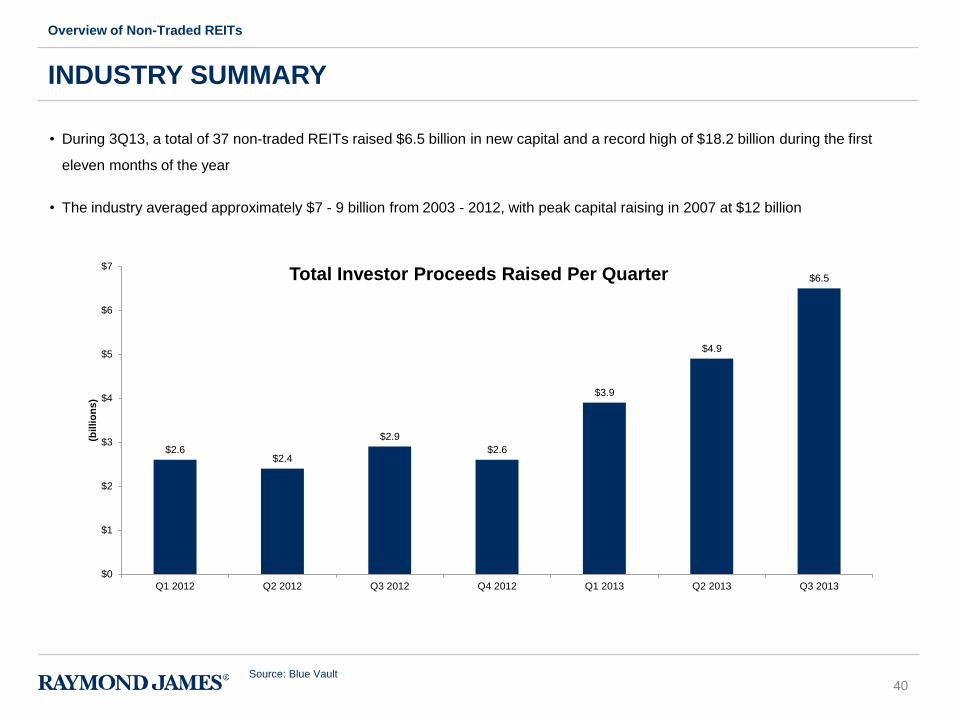
• During 3Q13, a total of 37 non-traded REITs raised $6.5 billion in new capital and a record high of $18.2 billion during the first
eleven months of the year
• The industry averaged approximately $7 - 9 billion from 2003 - 2012, with peak capital raising in 2007 at $12 billion
INDUSTRY SUMMARY
Overview of Non-Traded REITs
$2.6$2.4
$2.9
$2.6
$3.9
$4.9
$6.5
$0
$1
$2
$3
$4
$5
$6
$7
Q1 2012 Q2 2012 Q3 2012 Q4 2012 Q1 2013 Q2 2013 Q3 2013
(bil
lio
ns
)
Total Investor Proceeds Raised Per Quarter
Source: Blue Vault
41
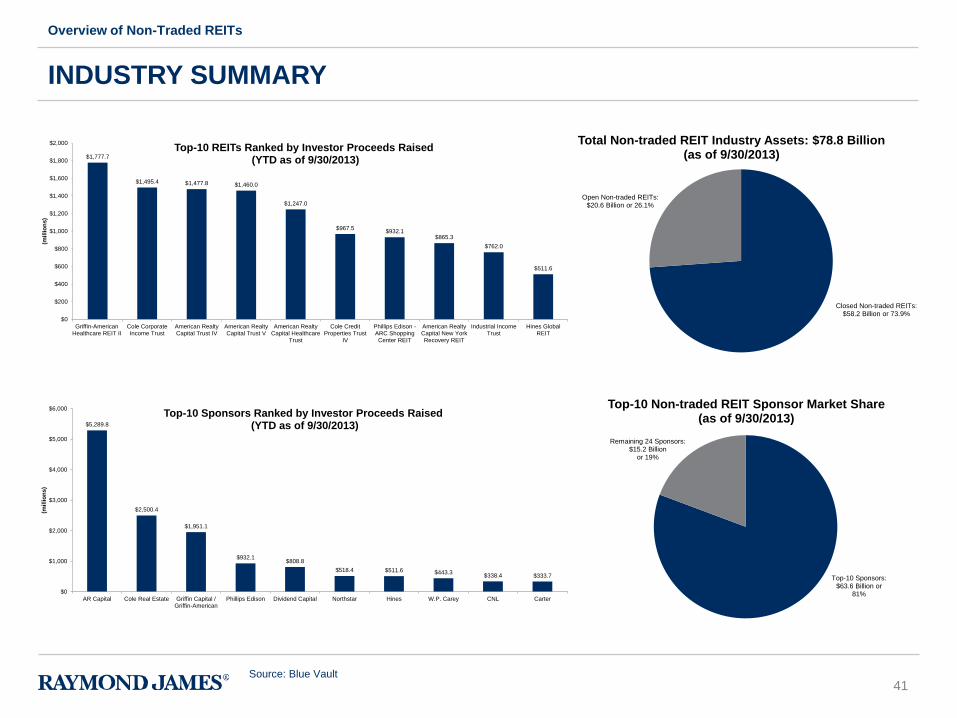
Top-10 Sponsors:$63.6 Billion or
81%
Remaining 24 Sponsors:$15.2 Billion
or 19%
Top-10 Non-traded REIT Sponsor Market Share (as of 9/30/2013)
$1,777.7
$1,495.4 $1,477.8 $1,460.0
$1,247.0
$967.5$932.1
$865.3
$762.0
$511.6
$0
$200
$400
$600
$800
$1,000
$1,200
$1,400
$1,600
$1,800
$2,000
Griffin-AmericanHealthcare REIT II
Cole CorporateIncome Trust
American RealtyCapital Trust IV
American RealtyCapital Trust V
American RealtyCapital Healthcare
Trust
Cole CreditProperties Trust
IV
Phillips Edison -ARC ShoppingCenter REIT
American RealtyCapital New YorkRecovery REIT
Industrial IncomeTrust
Hines GlobalREIT
(millio
ns)
Top-10 REITs Ranked by Investor Proceeds Raised(YTD as of 9/30/2013)
Closed Non-traded REITs: $58.2 Billion or 73.9%
Open Non-traded REITs: $20.6 Billion or 26.1%
Total Non-traded REIT Industry Assets: $78.8 Billion (as of 9/30/2013)
$5,289.8
$2,500.4
$1,951.1
$932.1$808.8
$518.4 $511.6 $443.3$338.4 $333.7
$0
$1,000
$2,000
$3,000
$4,000
$5,000
$6,000
AR Capital Cole Real Estate Griffin Capital /Griffin-American
Phillips Edison Dividend Capital Northstar Hines W.P. Carey CNL Carter
(millio
ns)
Top-10 Sponsors Ranked by Investor Proceeds Raised(YTD as of 9/30/2013)
INDUSTRY SUMMARY
Overview of Non-Traded REITs
Source: Blue Vault
42
American Realty Cole Corporate Griffin-American Phillips Edison - ARC
Key Terms / Features Capital Trust V Income Trust Cole Credit IV Healthcare REIT II Hines Global REIT Shopping Center REIT
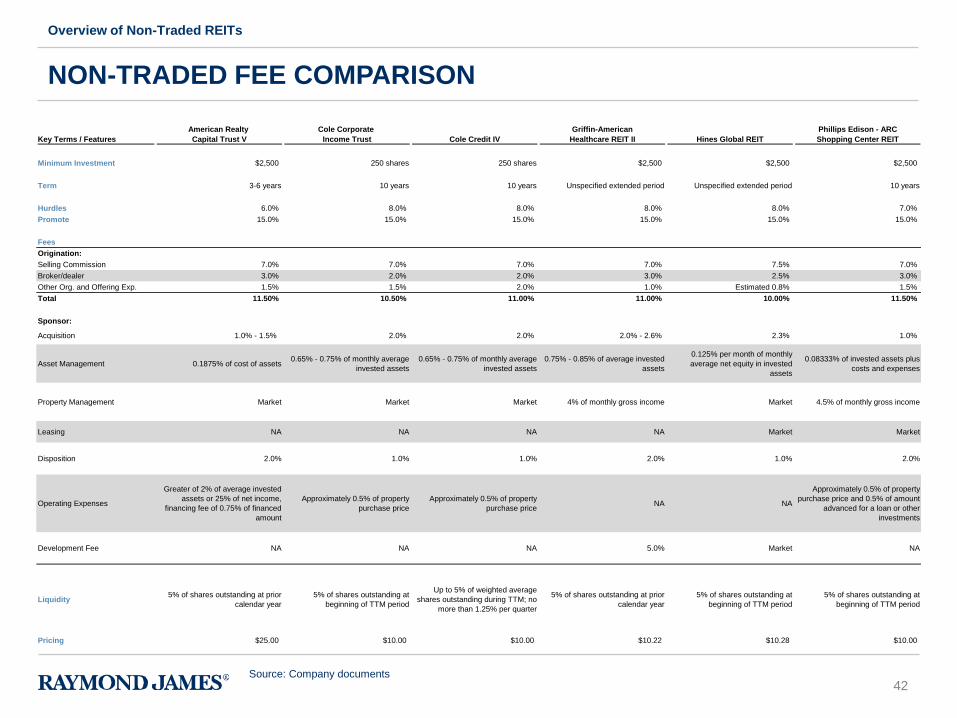
Minimum Investment $2,500 250 shares 250 shares $2,500 $2,500 $2,500
Term 3-6 years 10 years 10 years Unspecified extended period Unspecified extended period 10 years
Hurdles 6.0% 8.0% 8.0% 8.0% 8.0% 7.0%
Promote 15.0% 15.0% 15.0% 15.0% 15.0% 15.0%
Fees
Origination:
Selling Commission 7.0% 7.0% 7.0% 7.0% 7.5% 7.0%
Broker/dealer 3.0% 2.0% 2.0% 3.0% 2.5% 3.0%
Other Org. and Offering Exp. 1.5% 1.5% 2.0% 1.0% Estimated 0.8% 1.5%
Total 11.50% 10.50% 11.00% 11.00% 10.00% 11.50%
Sponsor:
Acquisition 1.0% - 1.5% 2.0% 2.0% 2.0% - 2.6% 2.3% 1.0%
Asset Management 0.1875% of cost of assets0.65% - 0.75% of monthly average
invested assets
0.65% - 0.75% of monthly average
invested assets
0.75% - 0.85% of average invested
assets
0.125% per month of monthly
average net equity in invested
assets
0.08333% of invested assets plus
costs and expenses
Property Management Market Market Market 4% of monthly gross income Market 4.5% of monthly gross income
Leasing NA NA NA NA Market Market
Disposition 2.0% 1.0% 1.0% 2.0% 1.0% 2.0%
Operating Expenses
Greater of 2% of average invested
assets or 25% of net income,
financing fee of 0.75% of financed
amount
Approximately 0.5% of property
purchase price
Approximately 0.5% of property
purchase priceNA NA
Approximately 0.5% of property
purchase price and 0.5% of amount
advanced for a loan or other
investments
Development Fee NA NA NA 5.0% Market NA
Liquidity5% of shares outstanding at prior
calendar year
5% of shares outstanding at
beginning of TTM period
Up to 5% of weighted average
shares outstanding during TTM; no
more than 1.25% per quarter
5% of shares outstanding at prior
calendar year
5% of shares outstanding at
beginning of TTM period
5% of shares outstanding at
beginning of TTM period
Pricing $25.00 $10.00 $10.00 $10.22 $10.28 $10.00
NON-TRADED FEE COMPARISON
Overview of Non-Traded REITs
Source: Company documents

43
Real Estate Illustrative Transactions
SECTION 6
44
ILLUSTRATIVE TRANSACTIONS
Real Estate Illustrative Transactions
• Raymond James has substantial experience in partnering with real estate companies to successfully grow their business
• Unequivocal success in advisory and capital raising roles in variety of strategies, products, and markets
• High level of repeat business from several clients over extended period of time is evidence of successful and valued partnership
• Transactions with the following companies showcase the client-centric business model and broad capabilities of the Raymond James Real
Estate Group
• LaSalle Hotel Properties
• Hersha Hospitality Trust
• American Homes 4 Rent
• Encore Enterprises Inc.
• Kaplan Development Group
• Woolbright Development
• BioMed Realty Trust
• Pebblebrook Hotel Trust
• Campus Crest Communities, Inc.
45
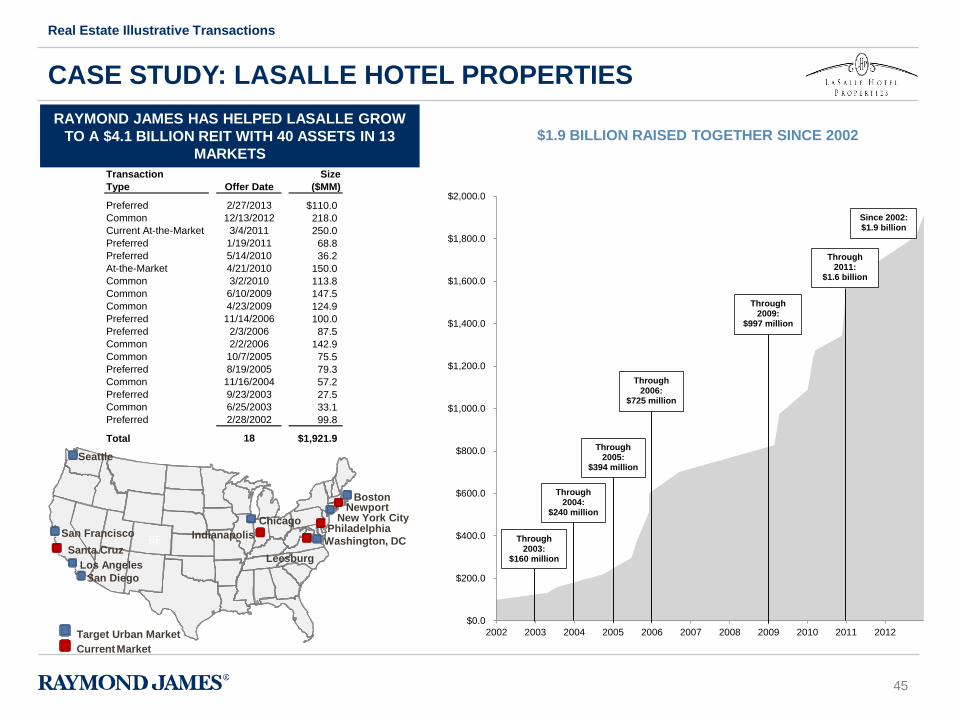
Transaction Size
Type Offer Date ($MM)
Preferred 2/27/2013 $110.0
Common 12/13/2012 218.0
Current At-the-Market 3/4/2011 250.0
Preferred 1/19/2011 68.8
Preferred 5/14/2010 36.2
At-the-Market 4/21/2010 150.0
Common 3/2/2010 113.8
Common 6/10/2009 147.5
Common 4/23/2009 124.9
Preferred 11/14/2006 100.0
Preferred 2/3/2006 87.5
Common 2/2/2006 142.9
Common 10/7/2005 75.5
Preferred 8/19/2005 79.3
Common 11/16/2004 57.2
Preferred 9/23/2003 27.5
Common 6/25/2003 33.1
Preferred 2/28/2002 99.8
Total 18 $1,921.9
CASE STUDY: LASALLE HOTEL PROPERTIES
Real Estate Illustrative Transactions
$1.9 BILLION RAISED TOGETHER SINCE 2002
RAYMOND JAMES HAS HELPED LASALLE GROW
TO A $4.1 BILLION REIT WITH 40 ASSETS IN 13
MARKETS
$0.0
$200.0
$400.0
$600.0
$800.0
$1,000.0
$1,200.0
$1,400.0
$1,600.0
$1,800.0
$2,000.0
2002 2003 2004 2005 2006 2007 2008 2009 2010 2011 2012
Through 2003:
$160 million
Through 2009:
$997 million
Through 2005:
$394 million
Through 2004:
$240 million
Through 2006:
$725 million
Through 2011:
$1.6 billion
Since 2002: $1.9 billion
San Francisco Washington, DC
Newport
San Diego
Los Angeles
Santa Cruz
Seattle
Indianapolis
Chicago Philadelphia
New York City
Boston
Leesburg
Target Urban Market
Current Market
46
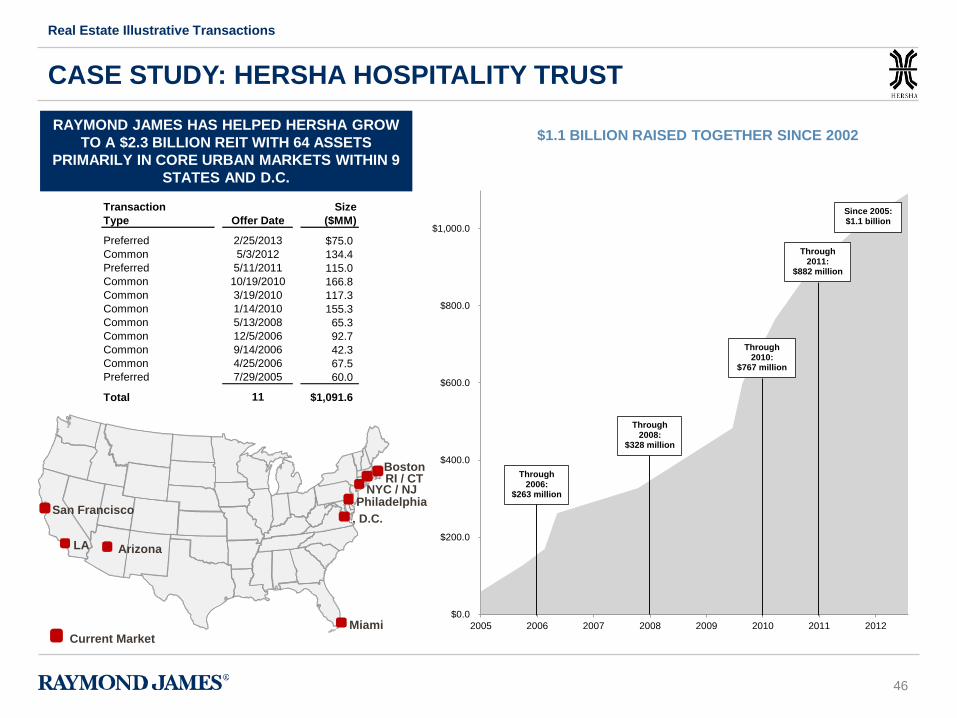
CASE STUDY: HERSHA HOSPITALITY TRUST
Real Estate Illustrative Transactions
$1.1 BILLION RAISED TOGETHER SINCE 2002
RAYMOND JAMES HAS HELPED HERSHA GROW
TO A $2.3 BILLION REIT WITH 64 ASSETS
PRIMARILY IN CORE URBAN MARKETS WITHIN 9
STATES AND D.C.
, D.C.
LA
Miami
Philadelphia NYC / NJ
Boston
San Francisco
Current Market
Arizona
RI / CT
Transaction Size
Type Offer Date ($MM)
Preferred 2/25/2013 $75.0
Common 5/3/2012 134.4
Preferred 5/11/2011 115.0
Common 10/19/2010 166.8
Common 3/19/2010 117.3
Common 1/14/2010 155.3
Common 5/13/2008 65.3
Common 12/5/2006 92.7
Common 9/14/2006 42.3
Common 4/25/2006 67.5
Preferred 7/29/2005 60.0
Total 11 $1,091.6
$0.0
$200.0
$400.0
$600.0
$800.0
$1,000.0
2005 2006 2007 2008 2009 2010 2011 2012
Through 2010:
$767 million
Through 2008:
$328 million
Through 2006:
$263 million
Through 2011:
$882 million
Since 2005: $1.1 billion
47
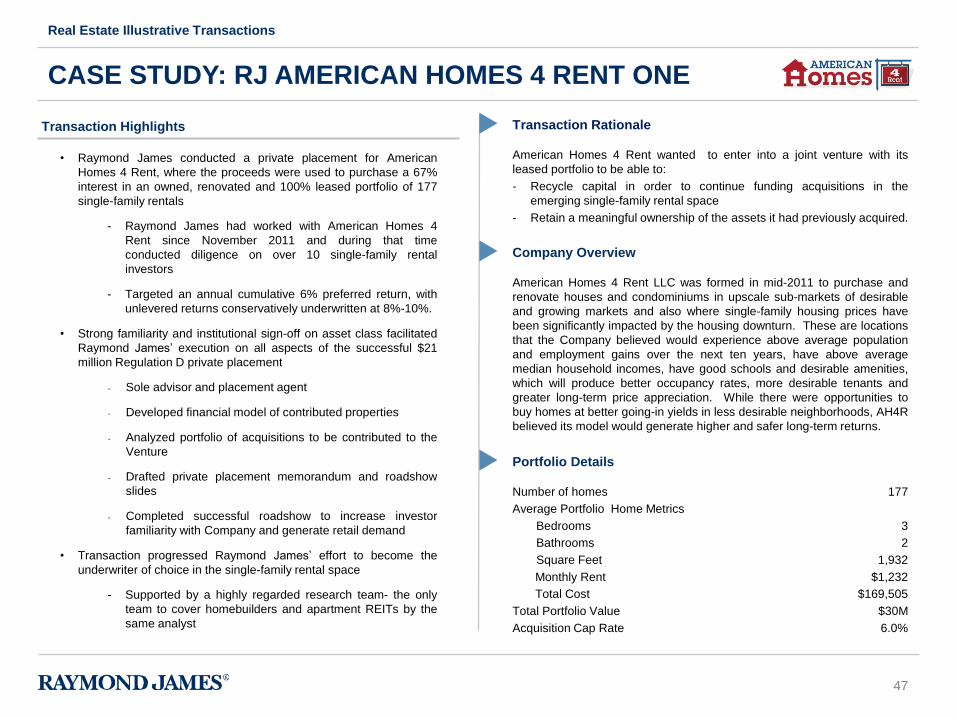
Transaction Highlights
• Raymond James conducted a private placement for American
Homes 4 Rent, where the proceeds were used to purchase a 67%
interest in an owned, renovated and 100% leased portfolio of 177
single-family rentals
- Raymond James had worked with American Homes 4
Rent since November 2011 and during that time
conducted diligence on over 10 single-family rental
investors
- Targeted an annual cumulative 6% preferred return, with
unlevered returns conservatively underwritten at 8%-10%.
• Strong familiarity and institutional sign-off on asset class facilitated
Raymond James’ execution on all aspects of the successful $21
million Regulation D private placement
- Sole advisor and placement agent
- Developed financial model of contributed properties
- Analyzed portfolio of acquisitions to be contributed to the
Venture
- Drafted private placement memorandum and roadshow
slides
- Completed successful roadshow to increase investor
familiarity with Company and generate retail demand
• Transaction progressed Raymond James’ effort to become the
underwriter of choice in the single-family rental space
- Supported by a highly regarded research team- the only
team to cover homebuilders and apartment REITs by the
same analyst
CASE STUDY: RJ AMERICAN HOMES 4 RENT ONE
Real Estate Illustrative Transactions
Company Overview
American Homes 4 Rent LLC was formed in mid-2011 to purchase and
renovate houses and condominiums in upscale sub-markets of desirable
and growing markets and also where single-family housing prices have
been significantly impacted by the housing downturn. These are locations
that the Company believed would experience above average population
and employment gains over the next ten years, have above average
median household incomes, have good schools and desirable amenities,
which will produce better occupancy rates, more desirable tenants and
greater long-term price appreciation. While there were opportunities to
buy homes at better going-in yields in less desirable neighborhoods, AH4R
believed its model would generate higher and safer long-term returns.
177
3
2
1,932
$1,232
$169,505
$30M
6.0%
Portfolio Details
Number of homes
Average Portfolio Home Metrics
Bedrooms
Bathrooms
Square Feet
Monthly Rent
Total Cost
Total Portfolio Value
Acquisition Cap Rate
Transaction Rationale
American Homes 4 Rent wanted to enter into a joint venture with its
leased portfolio to be able to:
- Recycle capital in order to continue funding acquisitions in the
emerging single-family rental space
- Retain a meaningful ownership of the assets it had previously acquired.
48
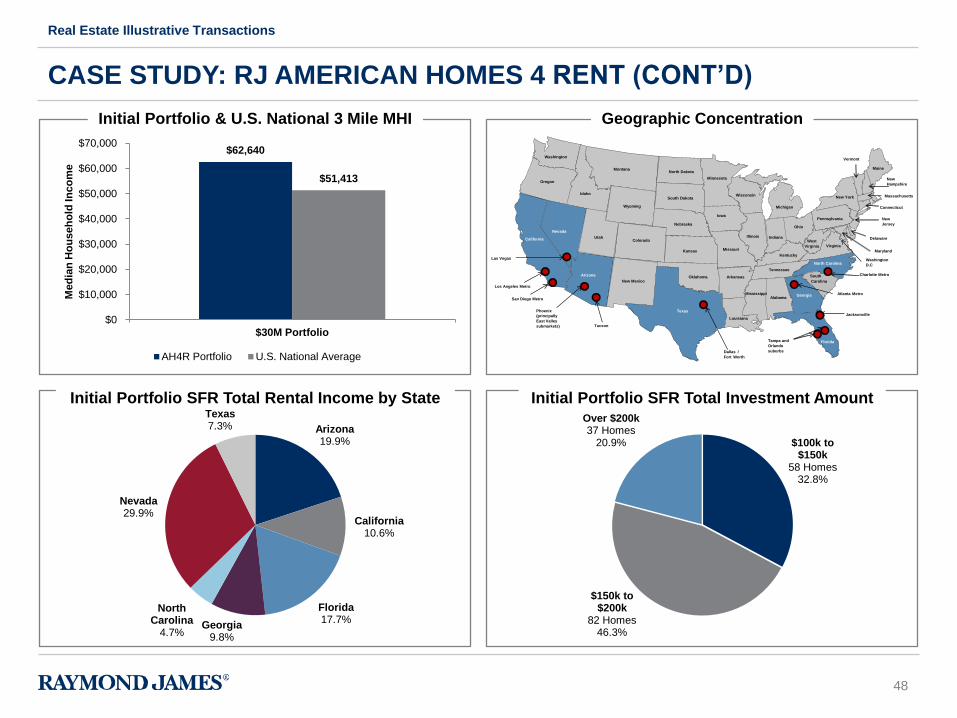
CASE STUDY: RJ AMERICAN HOMES 4 RENT (CONT’D)
Initial Portfolio & U.S. National 3 Mile MHI Geographic Concentration
Initial Portfolio SFR Total Rental Income by State Initial Portfolio SFR Total Investment Amount
Arizona 19.9%
California 10.6%
Florida 17.7%
Georgia 9.8%
North Carolina
4.7%
Nevada 29.9%
Texas 7.3%
$62,640
$51,413
$0
$10,000
$20,000
$30,000
$40,000
$50,000
$60,000
$70,000
$30M Portfolio
Med
ian
Ho
us
eh
old
In
co
me
AH4R Portfolio U.S. National Average
$100k to $150k
58 Homes 32.8%
$150k to $200k
82 Homes 46.3%
Over $200k 37 Homes
20.9%
Real Estate Illustrative Transactions
Washington
Oregon
California
Idaho
Montana
Wyoming
Nevada
Arizona
Colorado
New Mexico
North Dakota
South Dakota
Nebraska
Kansas
Oklahoma
Texas
Minnesota
Iowa
Missouri
Louisiana
Wisconsin
Illinois
Michigan
Indiana
Kentucky
Tennessee
Alabama
Ohio
New York
Pennsylvania
Virginia
North Carolina
South
Carolina
Georgia
Maine
Arkansas
Utah
Los Angeles Metro
San Diego Metro
Phoenix
(principally
East Valley
submarkets) Tucson
Dallas /
Fort Worth
Tampa and
Orlando
suburbs
Jacksonville
Atlanta Metro
Charlotte Metro
Las Vegas
Vermont
New
Hampshire
Massachusetts
Connecticut
New
Jersey
Washington
D.C
Maryland
Delaware
Mississippi
West
Virginia
Florida
49
CASE STUDY: ENCORE ENTERPRISES INC.
Real Estate Illustrative Transactions
Transaction Rationale
• Company raised capital to leverage its management team and
operating infrastructure into larger asset base
• Aggressively grew asset base while secondary market assets
were out of favor
• Capitalized on secondary market compression and strong
operating performance to monetize large portfolio
• Use proceeds to provide dry powder for more attractive
investment environment, which has been effectively deployed
into multiple other profitable investments
Transaction Highlights
• Evaluated the Company and its growth capital alternatives,
including asset vs. entity and pari passu vs. senior equity capital
• Performed valuation analysis, developed budgets, financial
model and offering materials, and identified appropriate partners
based cultural fit
• Successfully executed highly structured $85 million entity
investment by respected investor, Rothschild Realty
• Encore used the capital to increase its room count from 1,880 to
3,371 in 18 months
• Evaluated asset and capital market conditions to determine if the
Company should monetize its holding in 2007
• Advised the Company on its $400 million portfolio sale in August
2007 to a Goldman Sachs sponsored fund
• Achieved aggressive pricing (14x pro forma year 1 EBITDA) and
closing despite market turmoil by establishing stalking horse bid
• Round trip transactions resulted in a $100 million+ profit to
Encore in approximately two years
• Raymond James continues to act as Encore’s advisor for its
hospitality, multifamily, retail and office vehicles
Company Overview
Encore Enterprises, Inc. (“Encore”) is a private real estate acquisition,
development and management company investing in branded limited
service hotels located in primary, secondary and tertiary markets
primarily focused in the Southeast. The Company’s strategy is to
capitalize on management’s sophisticated management information
systems and communications network to acquire and improve the
performance of underperforming, independently managed Marriott,
Hilton and InterContinental branded limited service hotels. Following the
transaction, the Company owned or had an ownership interest in and
managed 17 limited service hotels with 1,482 rooms.
Transaction Overview (Capital Raise)
Transaction size
Investment structure
Governance
Fees
Portfolio size
Locations
June 2005
$85 million
9.0% convertible debenture
Equal representation
Property management and acquisition
21 hotels (1,880 rooms)
Southeastern United States
Encore Hospitality and
Private Capital Raise – Entity Investment
50
CASE STUDY: KAPLAN DEVELOPMENT GROUP
Real Estate Illustrative Transactions
Transaction Highlights
• Provided extensive financial analysis on its portfolio of properties
and operating business and advised Kaplan Development on
available strategic alternatives
• Negotiated the buyout of Kaplan’s multiple partners at an
attractive valuation
• Ultimately structured a programmatic joint venture:
• generating liquidity for Kaplan’s principals to pull out of
the Company via the majority sale of 6 properties
• commitment of equity to fund growth
• high margin development and management fees
Transaction Rationale
• Provided liquidity for principals
• Capital to pursue growth strategy
• Like-minded equity partner
Transaction Background
Having previously worked with the head of Raymond James Real Estate
Investment Banking to take Kapson Senior Quarters public, a senior housing
company controlled by the principals of Kaplan, and to subsequently sell the
company to Lazard Freres for a significant profit, Kaplan approached Raymond
James to once again find a financial partner to help the Company grow.
Transaction Overview
Transaction size
Portfolio size
Locations
Initial Property Valuation
$350 million ($74.3 million of equity)
6 properties (560 Units)
New Jersey, Pennsylvania,
Delaware & Georgia
$78.5 million
joint-venture with
51
CASE STUDY: WOOLBRIGHT DEVELOPMENT
Real Estate Illustrative Transactions
Transaction Highlights
• Evaluated asset and capital market conditions to determine if the
Company should be a net investor or seller
• Evaluated monetization alternatives including raising a fund,
recapitalizing existing joint-ventures, going public via an IPO or
an outright sale
• Advised the Company on identifying a portfolio for sale based on
project status, homogeneity and joint-venture partner goals
• Executed parallel bulk and individual asset sales to maximize
value, ultimately resulting three separate transactions, including
with some public companies
• Achieved aggressive pricing (6.1% implied cap rate on pro forma
year 1 NOI, inclusive of master lease income)
• Opined as to transaction fairness to 5 institutional partners
Transaction Rationale
• Capitalize on current market conditions to monetize large portfolio,
benefitting limited partners and capturing large promotes
• Sell assets that had been substantially redeveloped or where full
value could be harvested
• Use proceeds to repay debt and provide dry powder for more
attractive investment environment
Company Overview
Woolbright Development Inc. is a private real estate company focused on value
add shopping center opportunities in the six major metros of Florida. The
Company has successfully partnered with sophisticated investors such as Heitman,
Principal, Black Rock, Morgan Stanley and Lone Star to acquire, redevelop,
develop and sell several billion dollars of assets over the past ten years.
Woolbright's success is driven by its focus on the key areas of research,
technology, acquisitions, leasing, and customer-focused property management.
The Company’s current portfolio includes more than 30 projects totaling nearly 5
million square feet of retail and mixed-use real estate.
portfolio sale to
Transaction Overview
Transaction size
Portfolio size
Locations
Implied cap rate
Price per square foot
Bidders
$425 million
10 centers (1.7 million sq. ft)
Miami, Palm Beach, Orlando, Tampa
6.1%
$250
35
52
Transaction Highlights
• Evaluated strategic alternatives and developed strategic plan for 3
person Company with $120 million of assets
• Executed all aspects of the successful $465 million IPO as
structuring advisor and lead bookrunner 18 months later
- Refined marketing identity
- Selected board members and underwriters
- Developed budgets and financial model
- Analyzed acquisitions
- Negotiated line of credit
- Drafted prospectus and roadshow slides
• Partnered with Company on all major transactions, executed or not,
over the next nine years
- Raised $4.5 billion in capital in common stock, preferred
stock, joint-venture, convertible bonds and bond offerings
- Effectuated conservative KISS capital markets strategy
leading to strong performance through 2008-09 credit
crisis, culminating in investment grade bond rating in April
2010
- Evaluated several large acquisitions, successfully
acquiring and financing several and most importantly
passing on most
• Company has successfully grown into 175 person, 14.4 million
square foot, $6.2 billion public REIT with 100.6% cumulative total
return since its IPO
CASE STUDY: BIOMED REALTY TRUST
Real Estate Illustrative Transactions
Transaction Rationale
• BioMed accessed the public markets due to a financing arbitrage
that existed between the public and private markets
• 2004-06: The Company aggressively invested and match funded its
capital requirements to capitalize on this arbitrage
• 2007-09: Slowed its acquisition pace and re-equitized the company
via public and private JV capital in advance of credit crunch
• 2010-current: BioMed was awarded an investment grade rating and
accelerated investment armed with this new, lower cost of capital
Company Overview
BioMed Realty Trust is a $6.2 billion enterprise value REIT focused on
Providing Real Estate to the Life Science Industry®. The Company's
tenants primarily include biotechnology and pharmaceutical companies,
scientific research institutions, government agencies and other entities
involved in the life science industry. BioMed has interests in properties
comprising approximately 14.4 million rentable square feet located
predominantly in all major U.S. life science markets that have well-
established reputations as centers for scientific research.
$6.2 billion
40.6%
59.4%
0.0%
Baa3 / BBB-
173
14.4 million sq. ft.
Company Statistics (as of 9/30/2013)
Total Enterprise Value
Capitalization
Debt
Equity
Preferred
Credit Rating (Moody’s / S&P)
Buildings
Square Feet
53
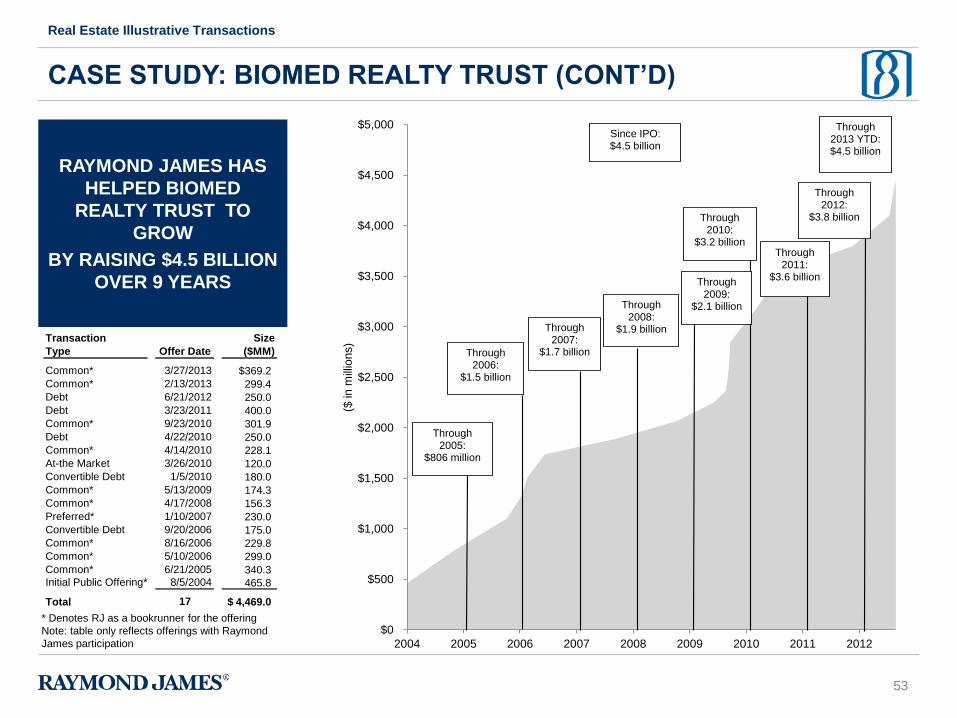
$0
$500
$1,000
$1,500
$2,000
$2,500
$3,000
$3,500
$4,000
$4,500
$5,000
2004 2005 2006 2007 2008 2009 2010 2011 2012
($ in m
illio
ns)
Through 2005:
$806 million
Through 2006:
$1.5 billion
Through 2007:
$1.7 billion
Through 2008:
$1.9 billion
Since IPO:$4.5 billion
Through 2009:
$2.1 billion
Through 2010:
$3.2 billionThrough
2011: $3.6 billion
Through 2012:
$3.8 billion
Through 2013 YTD: $4.5 billion
Transaction Size
Type Offer Date ($MM)
Common* 3/27/2013 $369.2
Common* 2/13/2013 299.4
Debt 6/21/2012 250.0
Debt 3/23/2011 400.0
Common* 9/23/2010 301.9
Debt 4/22/2010 250.0
Common* 4/14/2010 228.1
At-the Market 3/26/2010 120.0
Convertible Debt 1/5/2010 180.0
Common* 5/13/2009 174.3
Common* 4/17/2008 156.3
Preferred* 1/10/2007 230.0
Convertible Debt 9/20/2006 175.0
Common* 8/16/2006 229.8
Common* 5/10/2006 299.0
Common* 6/21/2005 340.3Initial Public Offering* 8/5/2004 465.8
Total 17 4,469.0$
CASE STUDY: BIOMED REALTY TRUST (CONT’D)
Real Estate Illustrative Transactions
RAYMOND JAMES HAS
HELPED BIOMED
REALTY TRUST TO
GROW
BY RAISING $4.5 BILLION
OVER 9 YEARS
* Denotes RJ as a bookrunner for the offering
Note: table only reflects offerings with Raymond
James participation
54
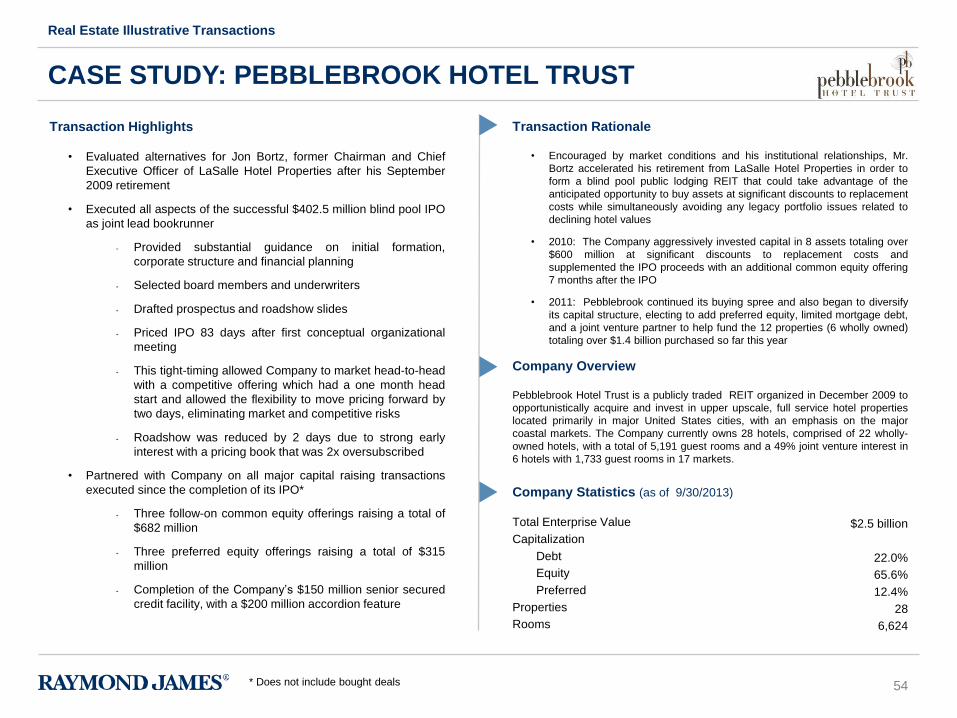
Transaction Highlights
• Evaluated alternatives for Jon Bortz, former Chairman and Chief
Executive Officer of LaSalle Hotel Properties after his September
2009 retirement
• Executed all aspects of the successful $402.5 million blind pool IPO
as joint lead bookrunner
- Provided substantial guidance on initial formation,
corporate structure and financial planning
- Selected board members and underwriters
- Drafted prospectus and roadshow slides
- Priced IPO 83 days after first conceptual organizational
meeting
- This tight-timing allowed Company to market head-to-head
with a competitive offering which had a one month head
start and allowed the flexibility to move pricing forward by
two days, eliminating market and competitive risks
- Roadshow was reduced by 2 days due to strong early
interest with a pricing book that was 2x oversubscribed
• Partnered with Company on all major capital raising transactions
executed since the completion of its IPO*
- Three follow-on common equity offerings raising a total of
$682 million
- Three preferred equity offerings raising a total of $315
million
- Completion of the Company’s $150 million senior secured
credit facility, with a $200 million accordion feature
CASE STUDY: PEBBLEBROOK HOTEL TRUST
Real Estate Illustrative Transactions
Transaction Rationale
• Encouraged by market conditions and his institutional relationships, Mr.
Bortz accelerated his retirement from LaSalle Hotel Properties in order to
form a blind pool public lodging REIT that could take advantage of the
anticipated opportunity to buy assets at significant discounts to replacement
costs while simultaneously avoiding any legacy portfolio issues related to
declining hotel values
• 2010: The Company aggressively invested capital in 8 assets totaling over
$600 million at significant discounts to replacement costs and
supplemented the IPO proceeds with an additional common equity offering
7 months after the IPO
• 2011: Pebblebrook continued its buying spree and also began to diversify
its capital structure, electing to add preferred equity, limited mortgage debt,
and a joint venture partner to help fund the 12 properties (6 wholly owned)
totaling over $1.4 billion purchased so far this year
Company Overview
Pebblebrook Hotel Trust is a publicly traded REIT organized in December 2009 to
opportunistically acquire and invest in upper upscale, full service hotel properties
located primarily in major United States cities, with an emphasis on the major
coastal markets. The Company currently owns 28 hotels, comprised of 22 wholly-
owned hotels, with a total of 5,191 guest rooms and a 49% joint venture interest in
6 hotels with 1,733 guest rooms in 17 markets.
$2.5 billion
22.0%
65.6%
12.4%
28
6,624
Company Statistics (as of 9/30/2013)
Total Enterprise Value
Capitalization
Debt
Equity
Preferred
Properties
Rooms
* Does not include bought deals
55
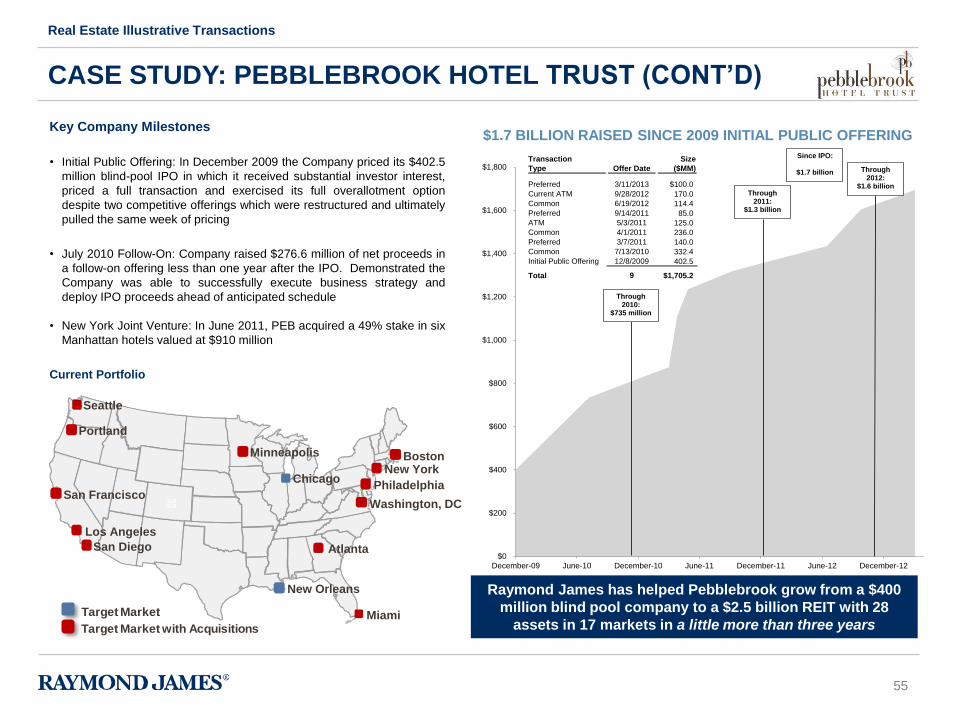
$0
$200
$400
$600
$800
$1,000
$1,200
$1,400
$1,600
$1,800
December-09 June-10 December-10 June-11 December-11 June-12 December-12
Through 2010:
$735 million
Through 2011:
$1.3 billion
Since IPO:
$1.7 billion Through 2012:
$1.6 billion
CASE STUDY: PEBBLEBROOK HOTEL TRUST (CONT’D)
Real Estate Illustrative Transactions
$1.7 BILLION RAISED SINCE 2009 INITIAL PUBLIC OFFERING
Raymond James has helped Pebblebrook grow from a $400
million blind pool company to a $2.5 billion REIT with 28
assets in 17 markets in a little more than three years Target Market
Target Market with Acquisitions
Key Company Milestones
• Initial Public Offering: In December 2009 the Company priced its $402.5
million blind-pool IPO in which it received substantial investor interest,
priced a full transaction and exercised its full overallotment option
despite two competitive offerings which were restructured and ultimately
pulled the same week of pricing
• July 2010 Follow-On: Company raised $276.6 million of net proceeds in
a follow-on offering less than one year after the IPO. Demonstrated the
Company was able to successfully execute business strategy and
deploy IPO proceeds ahead of anticipated schedule
• New York Joint Venture: In June 2011, PEB acquired a 49% stake in six
Manhattan hotels valued at $910 million
Current Portfolio
San Francisco Washington, DC
Atlanta San Diego
Los Angeles
Portland
Seattle
Minneapolis
Miami
Philadelphia
New York Boston
New Orleans
Chicago
Transaction Size
Type Offer Date ($MM)
Preferred 3/11/2013 $100.0
Current ATM 9/28/2012 170.0
Common 6/19/2012 114.4
Preferred 9/14/2011 85.0
ATM 5/3/2011 125.0
Common 4/1/2011 236.0
Preferred 3/7/2011 140.0
Common 7/13/2010 332.4
Initial Public Offering 12/8/2009 402.5
Total 9 $1,705.2
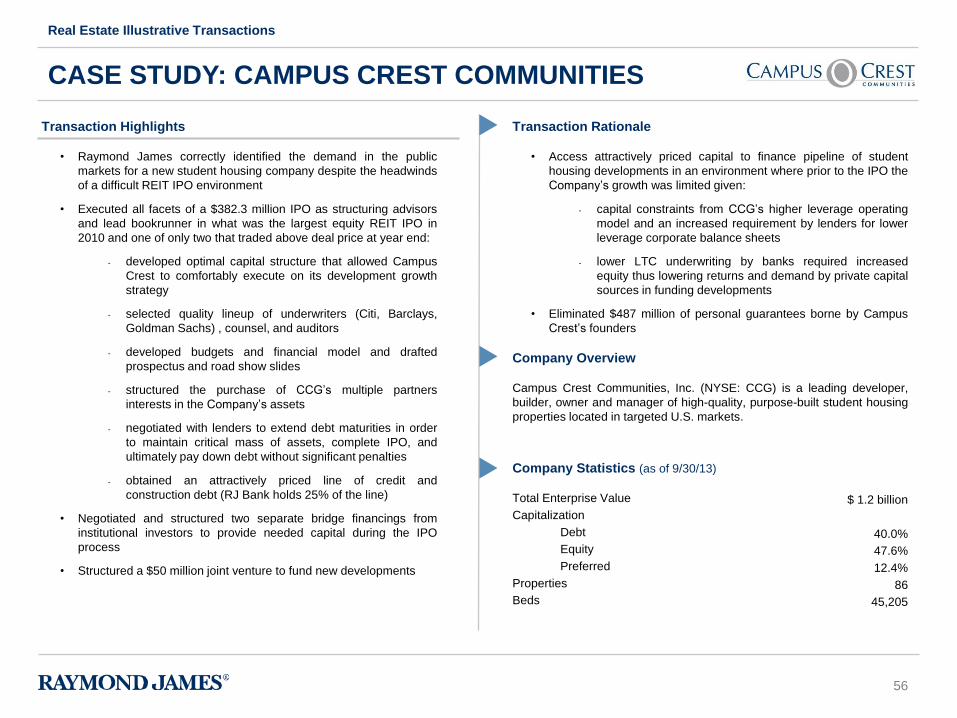
56
Transaction Highlights
• Raymond James correctly identified the demand in the public
markets for a new student housing company despite the headwinds
of a difficult REIT IPO environment
• Executed all facets of a $382.3 million IPO as structuring advisors
and lead bookrunner in what was the largest equity REIT IPO in
2010 and one of only two that traded above deal price at year end:
- developed optimal capital structure that allowed Campus
Crest to comfortably execute on its development growth
strategy
- selected quality lineup of underwriters (Citi, Barclays,
Goldman Sachs) , counsel, and auditors
- developed budgets and financial model and drafted
prospectus and road show slides
- structured the purchase of CCG’s multiple partners
interests in the Company’s assets
- negotiated with lenders to extend debt maturities in order
to maintain critical mass of assets, complete IPO, and
ultimately pay down debt without significant penalties
- obtained an attractively priced line of credit and
construction debt (RJ Bank holds 25% of the line)
• Negotiated and structured two separate bridge financings from
institutional investors to provide needed capital during the IPO
process
• Structured a $50 million joint venture to fund new developments
CASE STUDY: CAMPUS CREST COMMUNITIES
Real Estate Illustrative Transactions
Transaction Rationale
• Access attractively priced capital to finance pipeline of student
housing developments in an environment where prior to the IPO the
Company’s growth was limited given:
- capital constraints from CCG’s higher leverage operating
model and an increased requirement by lenders for lower
leverage corporate balance sheets
- lower LTC underwriting by banks required increased
equity thus lowering returns and demand by private capital
sources in funding developments
• Eliminated $487 million of personal guarantees borne by Campus
Crest’s founders
Company Overview
Campus Crest Communities, Inc. (NYSE: CCG) is a leading developer,
builder, owner and manager of high-quality, purpose-built student housing
properties located in targeted U.S. markets.
$ 1.2 billion
40.0%
47.6%
12.4%
86
45,205
Company Statistics (as of 9/30/13)
Total Enterprise Value
Capitalization
Debt
Equity
Preferred
Properties
Beds
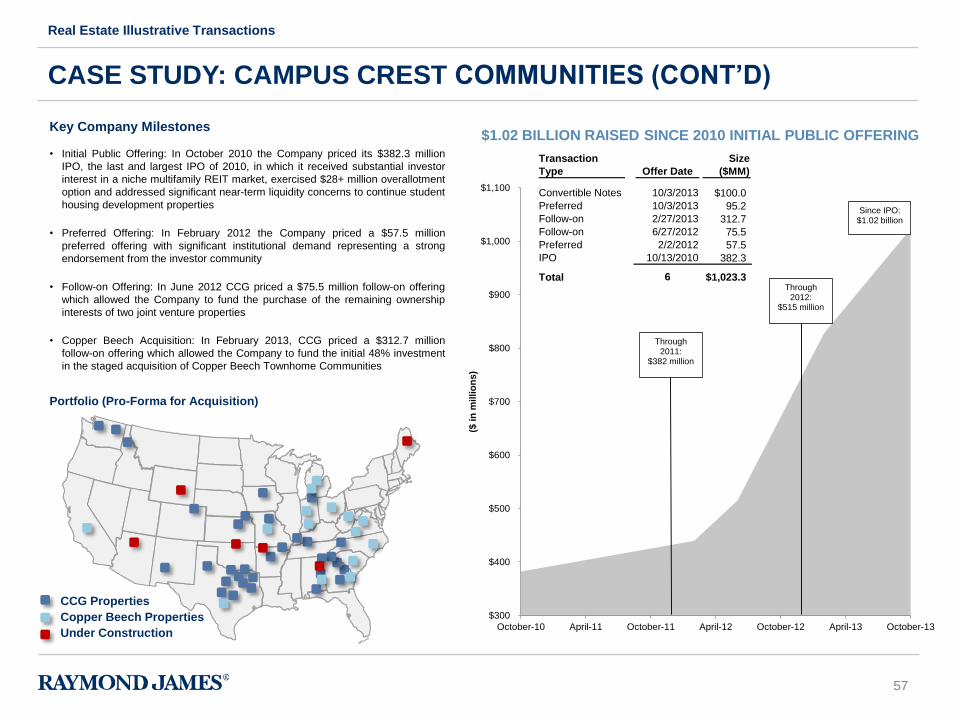
57
$300
$400
$500
$600
$700
$800
$900
$1,000
$1,100
October-10 April-11 October-11 April-12 October-12 April-13 October-13
($ in
mil
lio
ns
)
Through 2011:
$382 million
Since IPO:$1.02 billion
Through 2012:
$515 million
Transaction Size
Type Offer Date ($MM)
Convertible Notes 10/3/2013 $100.0
Preferred 10/3/2013 95.2
Follow-on 2/27/2013 312.7
Follow-on 6/27/2012 75.5
Preferred 2/2/2012 57.5
IPO 10/13/2010 382.3
Total 6 $1,023.3
$1.02 BILLION RAISED SINCE 2010 INITIAL PUBLIC OFFERING
CASE STUDY: CAMPUS CREST COMMUNITIES (CONT’D)
Real Estate Illustrative Transactions
CCG Properties
Under Construction
Key Company Milestones
• Initial Public Offering: In October 2010 the Company priced its $382.3 million
IPO, the last and largest IPO of 2010, in which it received substantial investor
interest in a niche multifamily REIT market, exercised $28+ million overallotment
option and addressed significant near-term liquidity concerns to continue student
housing development properties
• Preferred Offering: In February 2012 the Company priced a $57.5 million
preferred offering with significant institutional demand representing a strong
endorsement from the investor community
• Follow-on Offering: In June 2012 CCG priced a $75.5 million follow-on offering
which allowed the Company to fund the purchase of the remaining ownership
interests of two joint venture properties
• Copper Beech Acquisition: In February 2013, CCG priced a $312.7 million
follow-on offering which allowed the Company to fund the initial 48% investment
in the staged acquisition of Copper Beech Townhome Communities
Portfolio (Pro-Forma for Acquisition)
Copper Beech Properties