Embed Size (px)
Citation preview

REAL ESTATE BENCHMARKING SURVEY
PRO
FESSIO
NA
LSTA
ND
AR
DS

EXECUTIVE SUMMARYPwC and ANREV are delighted to publish the results of our real estate fund managers’ benchmarking survey, which was designed to gather, analyse, and share information about key industry operational trends and metrics of real estate fund managers with significant operations in Asia Pacific. We gathered data covering industry practices relating to organisational information, governance, risk management, administration, valuation, technology and operations, regulatory information and reporting. This report represents the summary of the data and includes key takeaways, by section, to assist you with your review.
Given the data is collected from various fund managers with different business models and structures, the same operational arrangement does not apply to all the fund managers. Naturally the scale of investment mandates, the number, location and diversity of investments, reporting and governance needs of investors, together with the institutionalisation of the wider business, are factors which will impact the operational structures needing to be put in place. Thus, we have explored how the practices may vary depending on the geographical locations and the size of the managers.
PwC conducted this survey to explore trends that would help real estate fund executives and management teams benchmark their practices against their industry peers. We have extracted some key takeaways on the next page. We hope that you find our results and analysis helpful.

Headcount expected to increase up to 20% in the coming year, clearly indicating that industry players still retain a positive outlook for Asia-Pacific business in 2018 and beyond.
Market risk is seen as the top risk priority for all respondents. Other risks such as liquidity and regulatory risks come close, and are also high on the radar of managers.
Headcount Risk priorities
Accounting services are mostly outsourced whilst investor reporting and treasury functions are mainly performed in-house. Those who do not outsource indicate they have no plans to do so in the near term.
Administrators
100% of managers use external valuers at least annually. Most respondents use global valuation firms and over 60% of managers engage more than one valuer. Furthermore, most managers conduct quarterly valuations in efforts to provide regular reporting and more insightful investor reports.
Independentvaluation
The majority of our respondents are regulated. At least 38% of the managers have been reviewed by relevant regulatory bodies in last 12 months. Regulatory risk remains a key risk priority to the managers.
Regulation
The majority of respondents received investors’ queries relating to historical performance and future outlook; while half of them got queries about environmental information, indicating that ESG is a key focus to LPs.
Investor reporting

AustraliaAvg. AUM — US$ 13.28bn Avg. FTE – 136No. of respondents — 6
Europe and North Americas
Avg. AUM — US$ 3.03bnAvg. FTE – 62No. of respondents — 7
Hong Kong, China and Singapore
Avg. AUM — US$ 2.54bn Avg. FTE – 45No. of respondents — 7
0%
10%
20%
30%
40%
50%
HQ of respondents by geographical location
AustraliaAsiaEurope and
North Americas
RESPONDENTS’ PROFILE
Number of respondents: 20
Below shows the average AUM and average number of full time employees (FTEs) operating in the region, based on the location of respondents’ head quarters.
The overview of respondents’ profiles indicate there is a low correlation between assets under management (AUM) and headcount.

TAbLE OF CONTENTS
SECTIONS
1 ORgANISATIONAL INFORMATION 01
2 gOVERNANCE & RISk MANAgEMENT 07
3 ADMINISTRATION 13
4 VALUATION 17
5 TEChNOLOgY AND OPERATIONS 21
6 REgULATORY INFORMATION 24
7 REPORTINg 28

PwC ANREV REAl EsTATE BENChMARkiNG sURVEy NoVEMBER 2017
01
Section 1OrganiSatiOnal infOrmatiOn

PwC ANREV REAl EsTATE BENChMARkiNG sURVEy NoVEMBER 2017
02
FTE* number by role
by location of head office
key takeaways:
•Majorfocusremainswithinfrontoffice,i.e.assetmanagement,portfoliomanagementandacquisition.
•Brokendownbygeographicallocation,Europe,NorthAmericaheadquarteredmanagershaveagreater emphasis on front office, while Australian managers have a relatively bigger team in back/middle office and corporate/management functions comparing to their peers.
•Cross-checkingtodatainSection3,Australianmanagerstendtoperformmostoftheadministrationfunctionsin-house,explainingthehigherpercentageintheirmiddle/backofficeandcorporate/management functions.
4%3%
20% 20%
53%
ExecutiveCorporate/ManagementFront OfficeOthersBack/Middle Office
3%
16%
6%
14%
61%
Europe and North Americas
ExecutiveCorporate/ManagementFront OfficeOthersBack/Middle Office
7managers
7%
21%
5%
14%
53%
Asia
ExecutiveCorporate/ManagementFront OfficeOthersBack/Middle Office
8managers
4%
23%
0%
24%
49%
Australia
ExecutiveCorporate/ManagementFront OfficeOthersBack/Middle Office
5managers
* Full Time Employee

PwC ANREV REAl EsTATE BENChMARkiNG sURVEy NoVEMBER 2017
03
The median FTE number of our respondents is 60, we compared the split by functional area between the respondents with more or less FTEs than the median:
8%4%
61%
7%
20%
Under 60 FTEs
ExecutiveCorporate/ManagementBack/Middle OfficeFront OfficeOthers
9managers
Average AUM: USD 1.67 bnAverage FTE: 33
ExecutiveCorporate/ManagementBack/Middle OfficeFront OfficeOthers
3% 3%
51%
22%
21%
Over 60 FTEs
11managers
Average AUM: USD 9.4 bnAverage FTE: 114
key takeaways:
•Keyimpactoflargerheadcountseemstobetakingfrontofficestaffintoanewtierofmiddlemanagement.
•Back/middleofficepercentageisquiteconsistentforbothlargerandsmallermanagers.
•Absolutenumberofexecutivesaresimilarforbothlargerandsmallermanagers,thusthereisamuchlowerpercentageinproportionforthelargermanagers.
•Smallermanagersusuallyhavelesspeoplededicatedforcorporate/managementfunctions,i.e.themajorityofthemonlyhavededicatedheadcountforlegaland investor relations.
by size

PwC ANREV REAl EsTATE BENChMARkiNG sURVEy NoVEMBER 2017
04
staff composition for each functional area:
Fund Accounting/AdministrationCompliance, Internal Auditand RegulatoryTaxEnvironmental, Social and GovernanceValuationPerformance Measurement and Attribution
4% 5%
1%1%
11%
78%
Back/Middle office
Human ResourcesInvestor Services/RelationsInformation TechnologyCorporate Finance FunctionLegalSales and Marketing
17%
16%
17%
16%
18%16%
Corporate/Management
Asset ManagersPortfolio ManagersResearchAcquisitionInvestment Management
41%
25%
11%
19%
4%
Front office
key takeaways:
•Veryfewfundmanagershavededicatedpersonnelforvaluation.Internalvaluationsareusuallycarriedoutbyfrontofficestaff.
•Fundaccounting/administrationpercentageremainsveryhigh.ThisisconsistentwiththefindingsinSection3,wherethemajorityofadministrationworkisstillperformedin-house.
•Thepercentageofenvironmental,socialandgovernance(‘ESG’)andtaxaresimilar.However,mostmanagershadasinglededicatedheadcountfortaxwhilstEsG was much more polarised for Australian managers who had one or more dedicated personnel for EsG. This is consistent with our prior year’s Review ofInvestorReportingTrendsAsia-Pacific2016survey,whichfoundthatAustralianmanagersputmorefocusonESGimplementationandreportingduetoregulatory requirement and investors’ expectations.
•Researchpercentageappearsverylow.Similartovaluation,researchworkmaybecarriedoutbyinvestmentmanagementoracquisitionteams.

PwC ANREV REAl EsTATE BENChMARkiNG sURVEy NoVEMBER 2017
05
headcount information
other options of “increase by over 20%” and “decrease” both had nil responses.
No Change
Executives
Corporate / management
Back / middle office
Front office
Expected headcount movement within the next year:
Increase 0-20%
0 2 4 6 8 10 12 14 16 18
Employer drivenLosing staff to market
50%50%
Turnover is largely due to:key takeaways:
No fund managers expect a decrease in headcount and the majorityexpectanincreaseinheadcount in front office, showing that industry players still retain a positiveoutlookforAsia-Pacificbusiness in 2018.
key takeaways:
•Thereappearstobeastrongappetitefor hiring accounting staff – two thirds of respondents are actively hiring in this area.
• Itisrelativelychallengingtohiretherightvaluation specialist.
Compliance
Accounting
Risk Management
Valuation specialist
Information technology
How challenging is it for the respondent's organisation to find the rightresources in the following areas?
Very challenging Somewhat challenging Not challenging Not hiring
0 3 6 9 12 15 18

PwC ANREV REAl EsTATE BENChMARkiNG sURVEy NoVEMBER 2017
06
Consideration on fund domicile
Investor marketing
Cost of doing business
Regulatory
Costs Benefits
What are the key costs / benefits influencing the choice to use a fund “offshore” domicile compared to “onshore”, i.e. where the fund is subject to regulation?
0% 20% 40% 60% 80% 100%
BEPSAbility to market to investorsMIT (or similar non-Australian regimes)
21%
54%
25%
What would make you consider different domicile for a new product/re-domiciliation of current products?, or to use multi-jurisdiction structure?
key takeaways:
Clearly onshore funds are very much driven by the ability to market the product. The additional costs of an onshore product are unsurprisingly indicated as the key downside.
key takeaways:
Marketing again is shown as the clear priority forthoseconsideringre-domiciliation.

PwC ANREV REAl EsTATE BENChMARkiNG sURVEy NoVEMBER 2017
07
Section 2gOvernance & riSk management

PwC ANREV REAl EsTATE BENChMARkiNG sURVEy NoVEMBER 2017
08
Relative frequency of committee meetings
key takeaways:
•Unlikeothercommitteemeetingsconductedonafixedcycle,investmentcommitteeswillbecalledasand when investment opportunities arise.
•Seniormanagement/executivecommitteemeetingsareconductedmorefrequentlythanothers.
•Managersarealsofocusedonvaluationandcompliance/riskmanagement,thesemeetingsareusuallyconducted quarterly.
0% 10% 20% 30% 40% 50% 60% 70% 80% 90% 100%
Investment committee
Shareholder/Investor committee
Compliance/Risk management committee
Senior management/Executive committee
Valuation committee
Audit committee
Corporate governance committee
Remuneration committee
Appointment committee
For the following committees in place, how frequently do they meet?
Monthly Quarterly Semi Annually Annually Ad-hoc No committee
55%
50%
75%
60%
35%25%

PwC ANREV REAl EsTATE BENChMARkiNG sURVEy NoVEMBER 2017
09
board of Directors (boD) composition
key takeaways:
Higherinvestorandindependentdirectorparticipationontheboardsofcorefundswhichisunsurprisinggiventhatmorecorefundsbeingsubjecttoregulatoryrequirements.Anyopen-endedfund,whicharenormallyCoreproducts,wewouldexpecttohaveveryrobustgovernanceduetoinvestorstransactingatthe subscription/redemption NAVs. Core fund investors would seem to expect lower portfolio risk, coupled with a higher level of corporate governance and transparency.
All investorsLarger investors or rotation of investorsNo investorsMajority of executive directorsMinority of executive directors
11%
52%
5%
21%
11%
Core funds
All investorsLarger investors or rotation of investorsNo investorsMajority of executive directorsMinority of executive directors
25%
63%
6%
0%
6%
Non-core funds
YesNo
71%
29%
Independent directors on the core funds’ BoD
YesNo
55%
45%
Independent directors on the core funds’ BoD

PwC ANREV REAl EsTATE BENChMARkiNG sURVEy NoVEMBER 2017
10
Investment committee
Less than 30 minutesBetween 30 minutes and 1 hourBetween 1 hour and 2 hoursMore than 2 hours
17%
33%
50%
The length of time spent discussing each investment opportunity
Less than 2 weeksBetween 2 weeks and 1 monthBetween 1 month and 2 monthsMore than 2 months
25%
32%
32%
11%
For majority of cases, how much time passes after a positive decision is made on an investment to closing the investment?
By local committeeOne global committeeBoth, it depends on thenature of the deal(e.g. location, size, complexity)
Where is investment decision made?
33% 33%
33%
UnanimousSimple majoritySuper-majority
13%
47%
40%
How is investment decision made?

PwC ANREV REAl EsTATE BENChMARkiNG sURVEy NoVEMBER 2017
11
Risk management priorities
Top 5 risk priorities
1 Market
2 liquidity
3 Regulatory
4 operational
5 Tax
key takeaways:
•Marketriskisthetoppriorityforallregions.
•Theoverallriskprioritiesarequiteconsistentin all regions; overall top 5 remain the top 5 in both Asia and Europe/North America.
•Surprisingly,taxriskisnotviewedasanykind of priority in Australia. Ranked ninth compared to third in Europe and North America. A possible reason is that Australian managers mainly invest in Australia only, they are familiar with the local tax rules and exposures and therefore it is no longer a key risk.
Model risk
Cyber Security
Fraud
Regulatory
Operational
Credit / counterparty
Tax
Liquidity
Market
European and North American HQ managers' priority
Tax
Fraud
Model risk
Credit / counterparty
Cyber Security
Regulatory
Liquidity
Operational
Market
Australian HQ managers' priority
Model risk
Cyber Security
Fraud
Credit / counterparty
Tax
Operational
Liquidity
Regulatory
Market
Asian HQ managers' priority
0 3 6 9 12 15
0 3 6 9 12 15
0 5 10 15 20
18 21 24 27

PwC ANREV REAl EsTATE BENChMARkiNG sURVEy NoVEMBER 2017
12
Foreign currency and interest rate risks
key takeaways:
•93%oftherespondentshedgetheirinterestraterisk,comparedto84%hedgingforeigncurrencyrisk.
•Basedontheinterviewresultofourprioryears’ReviewofInvestorReportingTrendsAsia-Pacificsurvey,someparticipantscommentedthatthehedgingcostofcertain Asian currencies is very high. This is a possible reason for no foreign currency hedging being implemented.
International financial institutions
Local financial institutions
Boutique firms/specialists (eg. Chatham Financial)
No hedging is implemented
No risk exposure
What kind of organisations do you work with to hedge your foreign currency/interest rate exposure?
Interest rate risk Foreign currency risk
0% 10% 20% 30% 40% 50% 60%

PwC ANREV REAl EsTATE BENChMARkiNG sURVEy NoVEMBER 2017
13
Section 3adminiStratiOn

PwC ANREV REAl EsTATE BENChMARkiNG sURVEy NoVEMBER 2017
14
Administration Scope of the primary administrator’s services
key takeaways:
•Thereappearstobenomarketleaderin either the fund or sPV administration business. The respondents are using 14 differentadministratorsforfundsand9administrators for sPV administration.
•24%oftherespondentsusemultipleadministrators. Managers may use different administrators for different funds and also may split administration between fund level and sPVs.
Other observations:
•Forthosewhocurrentlydonotoutsource,allhave indicated that there are no plans or they are unlikely to outsource in the coming year.
•Asfortranslationofinternal/externalreports,40% of participants used independent translationagencieswhilstothersreliedonin-house capabilities.
•Dependingonanyregulatoryrequirements,the depth of outsourcing needs, and geographic coverage needs, different administrators maybe more or less suitable for any particular scenario.
key takeaways:
Accounting-relatedwork(i.e.accounting,financialstatementspreparation,taxfilings)aremorelikelytobeoutsourced.In-housestafffocusmoreonanalyticalandgovernancerelatedworksuchasBoard/GPreporting, treasury and internal audit.
None usedOneTwoThreeFour or more
17%
59%
21%
21%
How many administrators does the fund manager presently use?
0% 10% 20% 30% 40% 50% 60% 70% 80% 90% 100%
Fund Accounting
SPV Accounting
Property Accounting
Fund Performance
Cash Management/Treasury
Bank Reconciliations (Cash, investments)
Tax Filing/Returns Preparation
Financial Statement Preparation/Consolidation
Management/GP Reporting
Assistance with Board Reporting
Internal audit
Fund/Property Accounting and administration
Full third party Partial third party In-house

PwC ANREV REAl EsTATE BENChMARkiNG sURVEy NoVEMBER 2017
15
Scope of the primary administrator’s services
key takeaways:
Themajorityofinvestorservicesfunctionsareperformedin-houseasfundmanagersprefertokeep interaction and relationships with investors at close quarters.
key takeaways:
VeryhighoutsourcingrateinFATCA/AIFMDtype of compliance work, which is unsurprising, due to the high complexity and changing requirements, naturally external supports are needed.
0% 20% 40% 60% 80% 100%
Subscriptions/Redemptions
Capital Calls/Distributions
Promote Waterfall/IRR calculation
Investor Reporting
Investor Risk Reporting
Assistance with Investor Reporting Guidelines(ANREV, ARES, specific reporting, etc)
Other Investor Services
Investor services
Full third party Partial third party In-house
U.S. SEC Form PF
AIFMD Depositary
AIFMD – AIF Reporting
FATCA and CRS reporting
AML/KYC
Local country specific periodic filings
Regulatory
Full third party Partial third party In-house
Manager’s regulatory reporting (i.e. the fundmanager’s corporate reporting obligations)
0% 20% 40% 60% 80% 100%

PwC ANREV REAl EsTATE BENChMARkiNG sURVEy NoVEMBER 2017
16
Administrator service assessment and fees
50% 50%
Are key performance indicators (KPIs) usedto evaluate the administrator’s performance?
YesNo
11%
25%
3%
11%
11%7%
11%
If the answer to the above question is yes, indicate which KPIs are used:
Aged open itemsNumber of audit adjustmentsTimeliness of annual and interim financial reportsPrior period correctionsPercent of NAV produced on timeNumber of NAV errorsOthersN/A as answered no above
21%
5%6%
24%
6%
12%
How does the administrator currently price its services?
Fixed chargeBasis-point model using net assets/partners’ capitalBased on number of entitiesBased on number of transactions/investmentsBased on number of investorsOthersBasis-point model using committed capital
47%

PwC ANREV REAl EsTATE BENChMARkiNG sURVEy NoVEMBER 2017
17
Section 4valuatiOn

PwC ANREV REAl EsTATE BENChMARkiNG sURVEy NoVEMBER 2017
18
Property valuation firms
key takeaways:
•Mostmanagersusemultiplevaluersvaryingbylocations/typeofproperties.Somemanagersengagedifferentvaluersbyrotation.
•Mostrespondentsusereputablevaluers.Thereisnoclearmarketleader.
Number of valuers used
13%
33%
41%12-34-5>6
13%89%
74%
63%
63%
63%
58%
32%
21%
CBRE
Savills
DTZ Cushman & Wakefield
Jones Lang Lasalle
Knight Frank
Colliers
Other (please specify)
Big 4 financial services firms
Valuers used
0% 10% 20% 30% 40% 50% 60% 70% 80% 90% 100%

PwC ANREV REAl EsTATE BENChMARkiNG sURVEy NoVEMBER 2017
19
The frequency of third party appraisal
Other observation:
•82%ofrespondentsindicatedthatallinvestmentsaresubjecttoexternalvaluations.The remaining respondents may determine the use of external valuation by nature or size of investments.
key takeaways:
•100%ofassetsaresubjecttoexternalvaluation, of which 12% do not have fixed frequencies.
•Mostmanagersconductinternalvaluationsat least quarterly to meet investor reporting requirements, updates typically being distributed quarterly.
•Managersthatrequirequarterlyexternalvaluations usually pursue a core strategy.
47%
41%
12%
17%
66%
17%
External valuations Internal valuations
As needed Quarterly Annually
External and internal valuation frequency

PwC ANREV REAl EsTATE BENChMARkiNG sURVEy NoVEMBER 2017
20
Management override of external valuations
key takeaways:
•Themajorityofmanagersarenotpermittedtooverrideexternalvaluations.Evenforthosebeinggrantedtheauthoritytooverrideexternalvaluations,notsurprisinglytheyseldomadjustexternalvaluationasitmayattractalotofqueriesfrominvestorsandexternalauditors.
•FrompreviousPwCANREVsurveys,managersstatedthattheywouldonlyoverridevaluationswhichtheybelievedweretooaggressive,theywouldnotoverride external values to increase the market value.
56% 44%
Can management override external valuations if management disagrees?
YesNo
57% 43%
If yes, what would management use for financial reporting?
Internal valuation modelUse external valuation as base, but make specific amendments to model
33%
67%
If yes, how often does management make adjustments to external valuer’sfigures if they disagree?
SeldomNever

PwC ANREV REAl EsTATE BENChMARkiNG sURVEy NoVEMBER 2017
21
Section 5technOlOgy and OperatiOnS

PwC ANREV REAl EsTATE BENChMARkiNG sURVEy NoVEMBER 2017
22
Outsourced technology functions
•Othersincludeemailsecurityenhancement. •Othersincludeperformanceenhancement.
Data Management – externally managed data (Data Center/ Cloud)
Data Management – internally managed data
Disaster Recovery
IT/Cyber Security
Technical support
Risk Management
Other (please specify)
Which of the following functions are outsourced by the investment manager?
Full Partial Parallel In-house
0% 20% 40% 60% 80% 100%
16%
10%
16%
16%
23%
6%
If it is likely for the respondent's organisation to make technology investments in the next 12 months, what are the likely areas where spending goes to?
Enhancing big data capabilitiesRisk managementGeneral ledger/fund or SPV accountingPortfolio managementHuman resources systemOthersNot applicable
13%
PwC ANREV REAl EsTATE BENChMARkiNG sURVEy NoVEMBER 2017
23
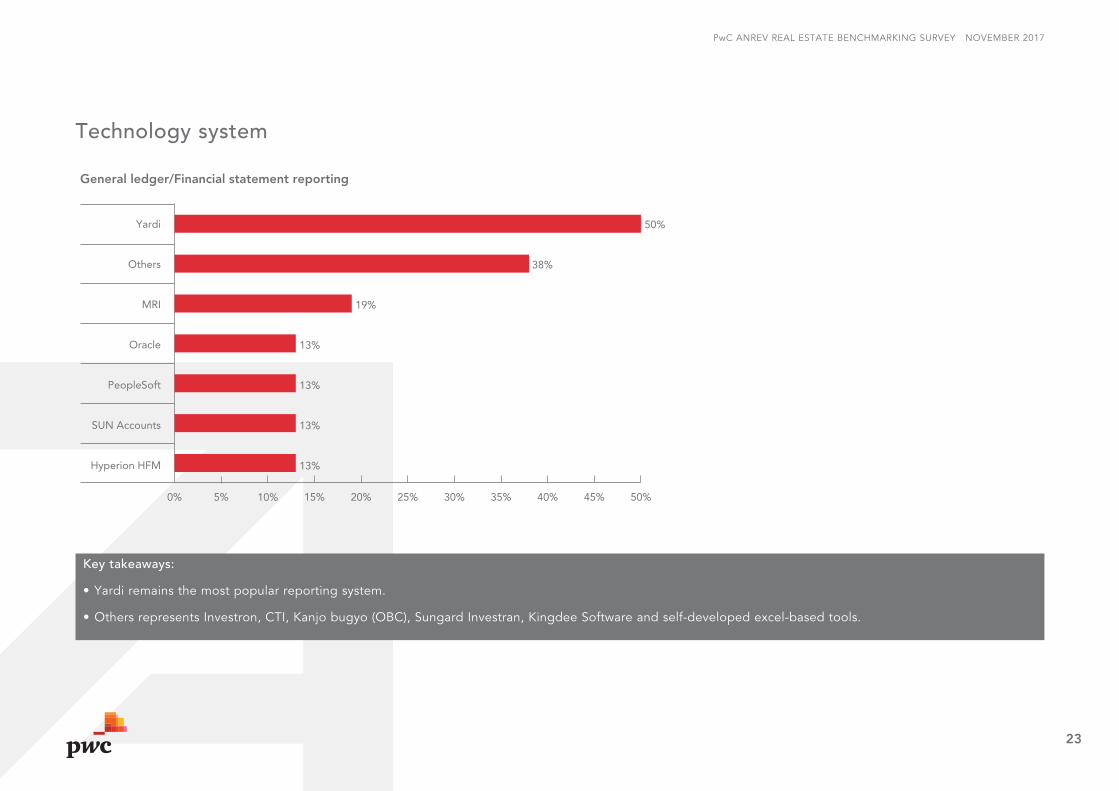
Technology system
key takeaways:
•Yardiremainsthemostpopularreportingsystem.
•OthersrepresentsInvestron,CTI,Kanjobugyo(OBC),SungardInvestran,KingdeeSoftwareandself-developedexcel-basedtools.
50%
38%
19%
13%
13%
13%
13%
Yardi
Others
MRI
Oracle
PeopleSoft
SUN Accounts
Hyperion HFM
General ledger/Financial statement reporting
0% 5% 10% 15% 20% 25% 30% 35% 40% 45% 50%

PwC ANREV REAl EsTATE BENChMARkiNG sURVEy NoVEMBER 2017
24
Section 6regulatOry infOrmatiOn

PwC ANREV REAl EsTATE BENChMARkiNG sURVEy NoVEMBER 2017
25
Regulatory information
key takeaways:
•Majorityofthefundmanagersarenowregulated.Movetoonshorefundsor access to preferential tax treatment may drive regulation in addition to regulators expending their remit.
•Atleast38%oftherespondentshavebeenreviewedbyatleastoneregulatory body in last 12 months!
11%
61%28%
Regulatory supervision – fund manager
Regulated – Asian fund managerRegulated – non-Asian fund managersNot regulated
13%
25%
0%
0%
19%
43%
Within last 6 months
7-12 months ago
13-24 months ago
25-60 months ago
More than 60 months ago
Have not been reviewed
When was the last time the fund manager was reviewed by the relevant securities commission or other regulatory (non-tax) bodies?
0% 10% 20% 30% 40% 50%
37%
37%
16%
10%
Chief Financial Officer
Chief Compliance Officer
General Counsel
Others
Who is primarily responsible for overseeing the regulatory reporting process
0% 10% 20% 30% 40%

PwC ANREV REAl EsTATE BENChMARkiNG sURVEy NoVEMBER 2017
26
Tax audit
key takeaways:
•Majorityofthemanagershavenotbeenauditedbyataxauthoritywithinthelast5years.
•ConsistentwithSection2riskpriorities,sincelessmanagerswerereviewedbytaxauthoritiesinlast2years,theyviewregulatoryriskasahigherpriorityovertax risk.
6%
94%
7%
93%
7-12 months ago
How recently has the fund manager been audited by a government/local or foreign tax authority?
Government/local jurisdiction audit
Foreign jurisdiction audit
N/A or not within 5 years
0%
20%
40%
60%
80%
100%
67%
22%17% 17%
11%
None Payroll Sales Tax CorporateTax
Transferpricing
What types of tax audits are currently in progress?
0%
20%
40%
60%
80%
100%
19%
81%
Has the fund manager engaged an outside firmto perform a mock tax (or other jurisdiction) audit?
YesNo

PwC ANREV REAl EsTATE BENChMARkiNG sURVEy NoVEMBER 2017
27
Regulatory risks
key takeaways:
•Thereisahighappreciationofmacroglobal risks, recognising the responsibility of marketing to global investors and the increasing regulations impacting business.
•HighleveloffocusonBEPSwouldsuggestmany organisations updating their tax planning which may have been designed in a “different age”.
0% 20% 40% 60% 80% 100%
47%
47%
40%
33%
27%
33%
20%
13%
33%
40%
20%
27%
40%
27%
27%
6%
7%
7%
6%
Anti-Money Laundering(“AML”)
Base erosion and profit shifting (“BEPS”)
Foreign Corrupt Practices Act(“FCPA”)
Foreign Account Tax Compliance Act(“FATCA“)
Common reporting standard(“CRS“)
How important are the below risks to your organisation?
Very important Important Somewhat important Not important

PwC ANREV REAl EsTATE BENChMARkiNG sURVEy NoVEMBER 2017
28
Section 7repOrting

PwC ANREV REAl EsTATE BENChMARkiNG sURVEy NoVEMBER 2017
29
Investor reporting
key takeaways:
•Historicperformanceandfutureoutlookrelated information remain the most interested areas of investors.
•Halfofthemanagersreceiverequestsinrelation to environmental information, which is consistent with our prior year’s Review of InvestorReportingTrendsAsia-Pacific2016survey results, which reported that many western investors pay close attention to EsG reporting. investor reporting usually lacks detailed EsG information, so investors request additional EsG information from managers.
25%
75%
For reporting and/or disclosures toLimited Partners, what is the level of information provided?
Specific LP level only informationFund level information
75%
69%
56%
50%
50%
50%
31%
31%
6%
Historic performance related
Future outlook
Use of reporting templates (ie. SDDS vs. bespoke templates)
Asset quality
Environmental
Compliance or fraud related
Regulatory
Internal control assessment of the fund manager
Others
For reporting and/or disclosures to Limited Partners, what type of additional reportingor further information do LPs typically request?
0% 20% 40% 60% 80% 100%

PwC ANREV REAl EsTATE BENChMARkiNG sURVEy NoVEMBER 2017
30
Investor reporting
key takeaways:
•Theresultisconsistentwiththefrequencyofconductinginternalvaluations.
•FrompreviousPwCANREVsurveys,managersstatedthatifprincipallyUSinvestorstheymayfollowUSmarketpracticeratherthanINREVindustryguidelines.AsthestandardizationprojectwiththeUStradeassociationcompletes,weexpectcompliancewouldbemuchstronger.
5%
11%
16%
68%
Frequency of financial statement reporting releasedto investors
QuarterlySemi-annuallyAnnuallyMonthly
47%
29%
12%
ANREV / INREV
Guidelines per offering documents
If ANREV / INREV is applicable, dothe entities comply with SDDS?
In terms of investor reporting, what trade association guidelines do the entities comply with?
0% 10% 20% 30% 40% 50%

PwC ANREV REAl EsTATE BENChMARkiNG sURVEy NoVEMBER 2017
31
Investor reporting
Other observation:
Core fund investors usually expect earlier reporting of preliminary NAV. Based on the interview result of our prior years’ Review of investor Reporting Trends Asia-Pacificsurvey,someparticipantscommentedthattheyneedtoreportpreliminaryNAVbeforetheyearenddate.
44%
28% 28%
0%
22%
28%
44%
6%
Less than2 weeks
Over 2 weeksto 1 month
Over 1 month3 months
More than 3 months
Average number of business daysto issue NAV? (Core fund)
Core fund − Preliminary NAV
Core fund − Final NAV
0%
10%
20%
30%
40%
50%
29%
42%
0%
14%
29% 29%
50%
7%
Average number of business days toissue NAV? (Non-Core Fund)
Non-Core fund − Preliminary NAV
Non-Core fund − Final NAV
0%
10%
20%
30%
40%
50%
Less than2 weeks
Over 2 weeksto 1 month
Over 1 month3 months
More than 3 months
6%
11%
17%
39%
21%
Who is responsible for Fund performance measurement?
Controller/Internal finance teamOthersInvestment teamExternal fund administratorInvestor relations teamHead office (for MNCs not based in Asia)
6%

PwC ANREV REAl EsTATE BENChMARkiNG sURVEy NoVEMBER 2017
32
This benchmarking survey was primarily carried out between June and october 2017 and comprised the following steps:
SURVEY APPROACh AND METhODOLOgY
Survey approach•TheprofessionalstandardscommitteeofANREV
together with PwC have determined a set of 57 questionstocoveroperationsinthenon-listedreal estate industry. The questions are based on PwC/ANREV real estate industry experience and by looking at similar surveys covering asset management organisations, then tailoring for real estate funds where applicable.
•67realestatefundmanagerswereinvitedbyANREV to participate in the survey. survey was conducted between July and August 2017 on a secure online platform (“Qualtrics”).
Report methodology•20realestatefundmanagersparticipatedin
the survey. PwC extracted and analysed the responses, looking for results which could provide insights for readers.
•Whereapplicable,furthercomparisonsweremade to similar surveys in order to search formeaningfulanalysisortrends.Datawasstratified where results differed by categories of organization (e.g. headcount, AUM, location of head office).
•ThesteeringcommitteefromANREVwereinvited to review the overall results and assess which were meaningful to include within the report.

PwC ANREV REAl EsTATE BENChMARkiNG sURVEy NoVEMBER 2017
33
PwC’s Real Estate practice assists real estate investment advisers, investment trusts, public and private investors, corporations, and management funds in developing strategies, evaluating acquisitions and dispositions; and appraising and valuing real estate. its global network of dedicated real estate professionals enables it to assemble for its clients the most qualified and appropriate team of specialists in the areas of capital markets, systems analysis and implementation, research, accounting, and tax.
PwC has offices in 157 countries and more than 208,000 people globally, and is among the leading professional services networks in the world.
SPONSORINg ORgANISATIONS
Global and Regional Real Estate Contacts:
Craig hughesGlobal Real Estate leaderlondon, United [email protected]
Paul WaltersAsia-PacificRealEstateAssuranceleaderhong kong, [email protected]
k.k. SoAsia-PacificRealEstateLeaderhong kong, [email protected]
PwC hong kongPaul Waltersstanley TamAlisonIp,JonathanKimandDaisyIp
ANREV is the Asian Association for investors in Non-listedRealEstateVehiclesLimited.ANREVisanot-for-profitorganisationdrivenbyinstitutionalinvestorsinAsiannon-listedpropertyfunds.our aim is to serve as a platform for investors who guide the association’s strategy. ANREV’s agenda is driven by its members, in particular institutional investors, and is focused on improving transparency and accessibility through market information, professionalism and best practice. Fund managers, investment banks and advisors provide support in addressing key issues facing theAsiannon-listedrealestatefundmarkets.ANREV now has 200 member companies from 18 countries.
ANREV Contributors:
AmélieDelaunay,Director,ResearchandProfessionalstandards, ANREV
ANREV Survey Sub-Committee:Justin Armstrong, Randy Caenen, Charmaine Cheuk, Eric lechat and Andrew Read

AsiAN AssoCiATioN FoR iNVEsToRs INNON-LISTEDREALESTATEVEHICLES
602,6/FDinaHouse,RuttonjeeCentre,11DuddellStreet,Central,hong kong
T +852 3108 2723E [email protected]