Embed Size (px)
Citation preview

Copyright 2000-2015 Richard Hagar, SRA 1
Copyright © 2007- 2015 Kinja LLC / Hagar Institute
Determining Appraisal Adjustments
Opinion really doesn’t count.7 hour web based CE class for appraisers.
by Richard Hagar SRA
2016
Copyright © 2007- 2015 Kinja LLC / Hagar Institute
Richard Hagar, SRA• Real Estate Agent,• Real Estate Appraiser,• SRA with the Appraisal Institute,• Fraud Profiler for Law Enforcement,• Bank and Mortgage Broker Compliance Instructor.
• Co-authored:– Washington’s Mortgage Brokers Practices Act (RCW 19.146)
• This law became the basis for the Federal SAFE Act– AMC Licensing laws (multiple States)(RCW 18.235)
• Sections were incorporated into the Federal “Dodd/Frank” Act– Foreclosure and Distressed Home Owners Act
• Foreclosure notification requirements and anti-fraud statutes• Washington’s Administrative Code
• Contact the instructor: [email protected]
2
Copyright © 2007- 2015 Kinja LLC / Hagar Institute
Before We Go Further…
• Different people reading the same regulation, often come away with different opinions about its meaning.
• Often the differences come because they:– don’t comprehend the sentence structure (due to
“government speak”) or,
– fail to pay attention to small but….very importantwords.
• Here’s an example…
Copyright © 2007- 2015 Kinja LLC / Hagar Institute
Definitions - Small Words Big Impact!Based upon the law, the terms:
• “Must” “Shall” and “Should” = A positive requirement, similar to law.
• “May” = An optional obligation.
Example:
The lender may review an appraisal = optional, your choice.
The lender must review an appraisal = requirement
The lender shall review all appraisals = requirement.
The lender should review all appraisals = requirement.
If you should do it you must do it!
STATUTE LAW COMMITTEE - Office of the Code Reviser(ii) "Shall" should only be used to mean "has a duty to." That is, to require the performance of an act. For example, "the governor shall appoint a director . . ."
Copyright © 2007- 2015 Kinja LLC / Hagar Institute
“Whatchu” Talking About?
First thing’s first.
• There is no law, regulation or, Standard that requires an appraiser to make an adjustment.
• However…. if you are going to make an adjustment there are laws, regulations, guidelines, and court rulings that must be followed…
… and that’s what this class is about.
Copyright © 2007- 2015 Kinja LLC / Hagar Institute
Qualitative vs. Quantitative
Qualitative Terms• More than• Less than• Better than• Inferior• Superior• Average• Good
• AKA. Subjective terms• Your opinion
Objective Terms
• 2,000sf
• 3 bedrooms
• Price per SF
• Adjustment per SF
• Quality Definitions 1-6
• Condition Definitions 1-6
• Definitions, facts, proof
• Not opinion based

Copyright 2000-2015 Richard Hagar, SRA 2
Copyright © 2007- 2015 Kinja LLC / Hagar Institute
Qualitative: adjective
• Qualities that are descriptive, subjective or difficult to measure.
• When qualitative terms and descriptions are used, no specific adjustments are required.– Obviously very opinion based.
• Specific adjustments, like $100 per sf., would be impractical.– Comparable X is superior so the subject’s value would be less.
– Comparable Y is inferior, so the subject’s value would be higher.
• A weak method, but at least readers would understand that the conclusions are very opinion based.
Copyright © 2007- 2015 Kinja LLC / Hagar Institute
Quantitative
Quantitative: adjective
• a type of information or data that is based on quantities obtained using a quantifiable measurement process.
– Price per SF– Adjustment per SF– Quality Definitions 1-6– Condition Definitions 1-6
• Measurable facts, proof
Copyright © 2007- 2015 Kinja LLC / Hagar Institute
The Wrong Way
Supplied by a very stupid, if not
dangerous, instructor
Copyright © 2007- 2015 Kinja LLC / Hagar Institute
Advantages and
Disadvantages
Copyright © 2007- 2015 Kinja LLC / Hagar Institute
Advantage - Agents
Experienced agents are good at “feeling” what the adjustment should be. Why?
• They meet buyers and sellers every week.
• They get to listen to how buyers think or make decisions.
• Most decisions for residential purchases are emotional and agents are good at measuring emotions.
Copyright © 2007- 2015 Kinja LLC / Hagar Institute
Disadvantage - Appraisers
Appraisers:
• don’t talk to buyers and sellers every week;
• don’t get to listen to what buyer’s are thinking or what influenced the decision;
• don’t walk through dozens of homes with the buyer.
• Appraisers are not allowed to be emotional about their decisions or adjustments.
• Requires us to find and use the facts.
Copyright 2000-2015 Richard Hagar, SRA 3
Copyright © 2007- 2015 Kinja LLC / Hagar Institute
Problems - AppraisersAppraisers
By law:
• Are not allowed to make adjustments based on emotions.
• Appraisers must prove value and adjustments.
• Adjustments must be what the majority of people want not a minority or individual person.– Hence the term “Market Value”
(support)
There are always oddball sales and individual ideas of value.
Copyright © 2007- 2015 Kinja LLC / Hagar Institute
But ..But..Richard…!You don’t understand!
• “I’ve been in this business for 30 years. I know what the adjustment is supposed to be.”
• “Since I’m an appraiser, adjustments can be based on my opinion.”
• “The adjustment’s I’m making are the same the other appraisers are making.”
• “The adjustments are supported by my knowledge.”
• “In my area things are different. There are insufficient sales to prove an adjustment.”
Copyright © 2007- 2015 Kinja LLC / Hagar Institute
It’s My Opinion
• Many of us have heard:
An appraisal is my opinion of value.
• That statement is only half right.
• The truth is, an appraisal is an opinion of value …supported by facts.
• Unfortunately, many appraisers miss the important part of the statement “supported by facts”
• Every part of the appraisal must be based upon facts.
Copyright © 2007- 2015 Kinja LLC / Hagar Institute
Rational Evidence – The Wrong Way
• “Rational evidence - Reason or reflection alone used to determine the truth or falsity of some propositions.”
• Appraisers often use:– “rational evidence,”
– their “feelings” or,
– their “experience” to determine an adjustment.
• This is absolutely, without doubt, the wrong way to determine adjustments.
Copyright © 2007- 2015 Kinja LLC / Hagar Institute
Empirical Evidence
• Empirical evidence - A source of knowledge acquired by means of observation or experimentation.
• Empirical evidence is information that justifies a belief in a claim or theory.– In the empiricist view, a person can only have knowledge when
they have a true belief based on evidence.
• The term empirical refers to the gathering of data using only evidence that is observable.– Empirical = superior, best, top of the food chain.
• Testing of a theory. Testing, using evidence, to determine the accuracy of a theory.– Adjustment per square foot.
Copyright © 2007- 2015 Kinja LLC / Hagar Institute
Failure To Understand The Difference
• Failure to understand the difference between “Rational Evidence” and “Empirical Evidence” is one of the leading reasons for appraisers to lose their certificates and pay fines.
• Agents can use their “feelings” appraiser cannot.
• Examples of failures…
Copyright 2000-2015 Richard Hagar, SRA 4
Copyright © 2007- 2015 Kinja LLC / Hagar Institute
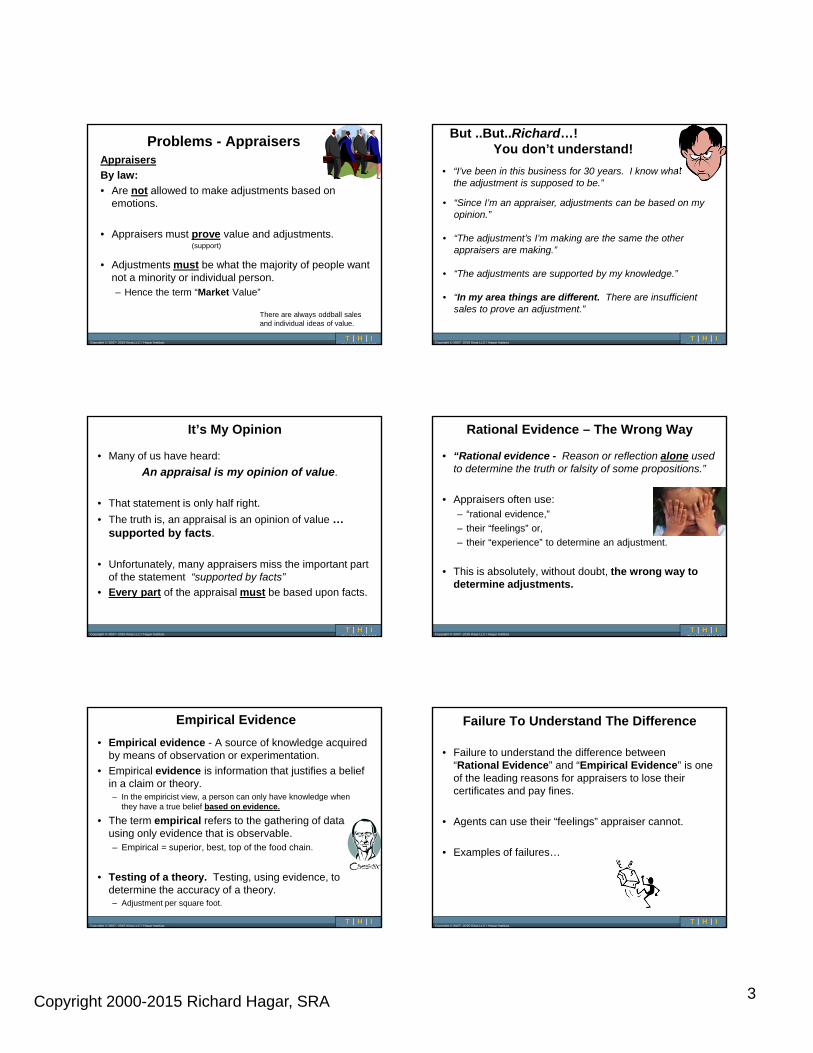
Appraisal Licensed RevokedFindings:a) Failed to provide proof of analysis and supporting data in
the workfile.
b) Made adjustments in the appraisal report that contradictdata contained in the workfile.
c) Failed to make accurate and/or consistent adjustmentsregarding comparable sales.
d) Used inappropriate comparables.
e) Failed to accurately describe subject property site conditions.
• Action: Revoked for 3 years.
• Patricia P.
Copyright © 2007- 2015 Kinja LLC / Hagar Institute
Jeanette C.
Findings:
1. Failed to disclose methodologies used to arrive at adjustments made for comparables.
2. Failed to make adjustments for views and fireplaces of the comparables.
3. Signed an appraisal report without inspecting the property or the comparables.
4. Failed to report the listing history.
• Actions: License suspended 1 year.
Copyright © 2007- 2015 Kinja LLC / Hagar Institute
“Workfile was Incomplete As It Contained No Data To Support The Dollar Adjustments”
• These are some of the Government’s numerous charges.
• Does the existence of additional charges somehow eliminate the failure to “support” adjustments??
But that’s what the blogs say…
Copyright © 2007- 2015 Kinja LLC / Hagar Institute
FNMA and State Licensing Agency
From the State of Washington disciplinary action against an appraiser:
Failure to support an adjustment will get you in trouble with Fannie Mae, the state, and in trial.
Copyright © 2007- 2015 Kinja LLC / Hagar Institute
“I Support My Adjustments”
Common statements:• “The appraiser must have support for the adjustment.”
• “I have support for my adjustments.”
Copyright © 2007- 2015 Kinja LLC / Hagar Institute
Define “Support”
• Let’s talk about it.
• What does the word “support” mean to you?
• How should we define “support?”
• If you get a moment, please email your definition of “support” to the instructor. [email protected]
Copyright 2000-2015 Richard Hagar, SRA 5
Copyright © 2007- 2015 Kinja LLC / Hagar Institute
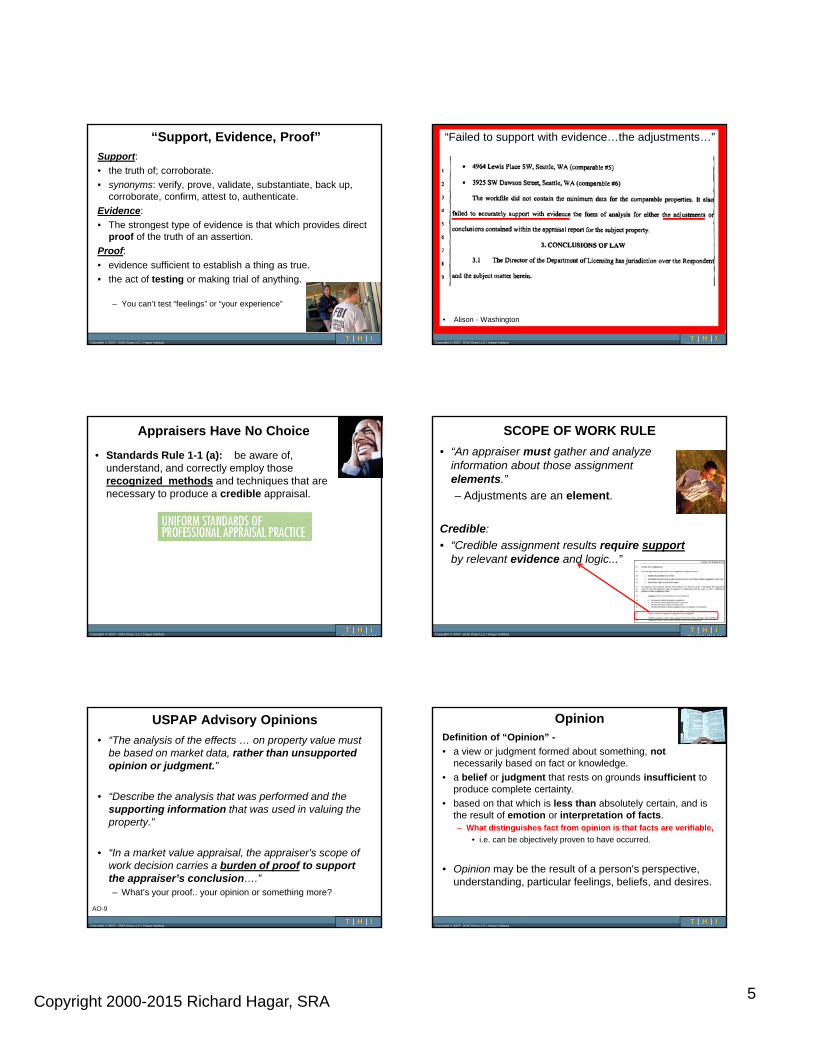
“Support, Evidence, Proof”
Support:
• the truth of; corroborate.
• synonyms: verify, prove, validate, substantiate, back up, corroborate, confirm, attest to, authenticate.
Evidence:
• The strongest type of evidence is that which provides direct proof of the truth of an assertion.
Proof:
• evidence sufficient to establish a thing as true.
• the act of testing or making trial of anything.
– You can’t test “feelings” or “your experience”
Copyright © 2007- 2015 Kinja LLC / Hagar Institute
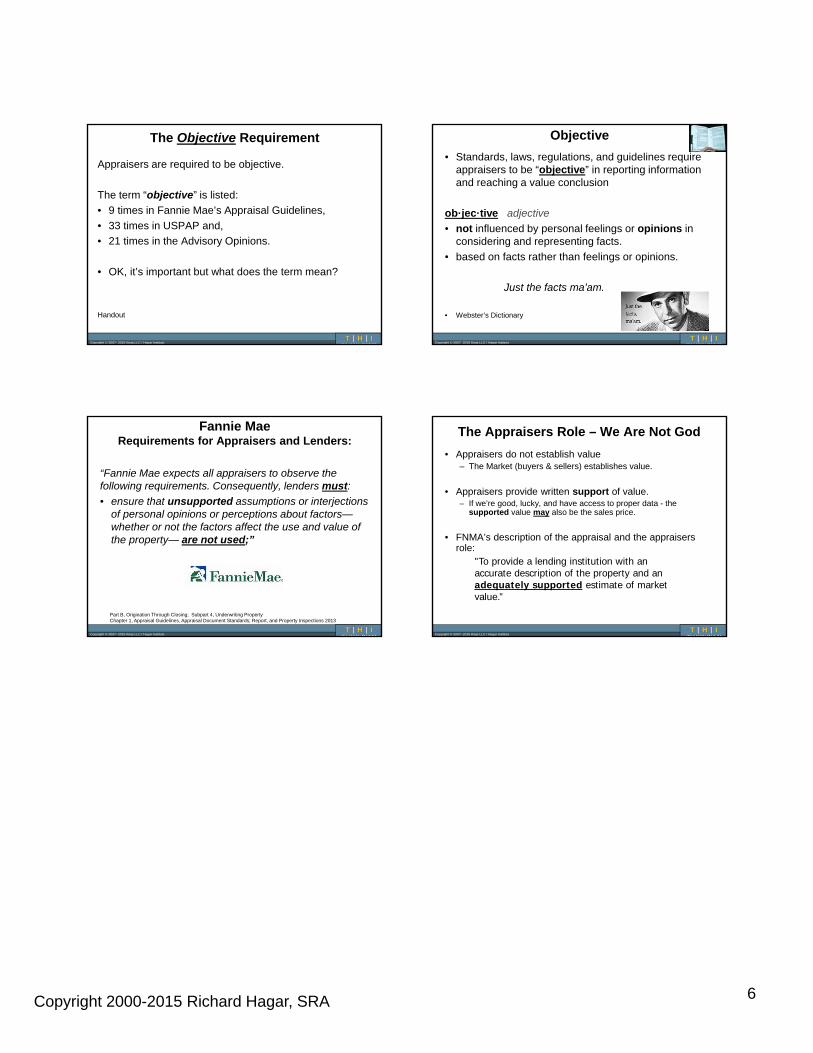
• Alison - Washington
“Failed to support with evidence…the adjustments…”
Copyright © 2007- 2015 Kinja LLC / Hagar Institute
Appraisers Have No Choice
• Standards Rule 1-1 (a): be aware of, understand, and correctly employ those recognized methods and techniques that are necessary to produce a credible appraisal.
Copyright © 2007- 2015 Kinja LLC / Hagar Institute
SCOPE OF WORK RULE
• “An appraiser must gather and analyze information about those assignment elements.”
– Adjustments are an element.
Credible:
• “Credible assignment results require supportby relevant evidence and logic...”
Copyright © 2007- 2015 Kinja LLC / Hagar Institute
USPAP Advisory Opinions
• “The analysis of the effects … on property value must be based on market data, rather than unsupported opinion or judgment.”
• “Describe the analysis that was performed and the supporting information that was used in valuing the property.”
• “In a market value appraisal, the appraiser’s scope of work decision carries a burden of proof to support the appraiser’s conclusion….”– What’s your proof.. your opinion or something more?
AO-9
Copyright © 2007- 2015 Kinja LLC / Hagar Institute
OpinionDefinition of “Opinion” -
• a view or judgment formed about something, notnecessarily based on fact or knowledge.
• a belief or judgment that rests on grounds insufficient to produce complete certainty.
• based on that which is less than absolutely certain, and is the result of emotion or interpretation of facts. – What distinguishes fact from opinion is that facts are verifiable,
• i.e. can be objectively proven to have occurred.
• Opinion may be the result of a person's perspective, understanding, particular feelings, beliefs, and desires.
Copyright 2000-2015 Richard Hagar, SRA 6
Copyright © 2007- 2015 Kinja LLC / Hagar Institute
The Objective Requirement
Appraisers are required to be objective.
The term “objective” is listed:
• 9 times in Fannie Mae’s Appraisal Guidelines,
• 33 times in USPAP and,
• 21 times in the Advisory Opinions.
• OK, it’s important but what does the term mean?
Handout
Copyright © 2007- 2015 Kinja LLC / Hagar Institute
Objective
• Standards, laws, regulations, and guidelines require appraisers to be “objective” in reporting information and reaching a value conclusion
ob·jec·tive adjective
• not influenced by personal feelings or opinions in considering and representing facts.
• based on facts rather than feelings or opinions.
Just the facts ma’am.
• Webster’s Dictionary
Copyright © 2007- 2015 Kinja LLC / Hagar Institute
Fannie MaeRequirements for Appraisers and Lenders:
“Fannie Mae expects all appraisers to observe the following requirements. Consequently, lenders must:
• ensure that unsupported assumptions or interjections of personal opinions or perceptions about factors—whether or not the factors affect the use and value of the property— are not used;”
Part B, Origination Through Closing; Subpart 4, Underwriting PropertyChapter 1, Appraisal Guidelines, Appraisal Document Standards; Report, and Property Inspections 2013
Copyright © 2007- 2015 Kinja LLC / Hagar Institute
The Appraisers Role – We Are Not God
• Appraisers do not establish value– The Market (buyers & sellers) establishes value.
• Appraisers provide written support of value. – If we’re good, lucky, and have access to proper data - the
supported value may also be the sales price.
• FNMA’s description of the appraisal and the appraisers role:
"To provide a lending institution with an accurate description of the property and an adequately supported estimate of market value.”
Copyright 2000-2015 Richard Hagar, SRA 1
Copyright © 2007- 2015 Kinja LLC / Hagar Institute
MethodsAdjustments
andCommon Sense Rules
Copyright © 2007- 2015 Kinja LLC / Hagar Institute
Out of Balance
• Things that are foreign are often rejected (at first).
• Some of what you’ve learned so far today has created an imbalance between what you believe and the legal reality.– You’re going to feel uncomfortable and combative for a
while.
• It will take time, but you should reach an equilibrium (what was/what is), and once you do, things will get better.
• Taking notes will help insert the new information into your head and make future appraisals quicker to write.
Copyright © 2007- 2015 Kinja LLC / Hagar Institute
Adjustment: ad·just·ment
noun
• a small alteration or modification made to achieve a desired result.
Appraisal Adjustment:
• Displaying market reaction through an objective mathematical process.
• Mathematical changes demonstrating differences between the subject and a comparable.
• Changes made to a comparable’s selling price quantifying the market’s reaction for differences.
• Adjustments can be made as a percentage or dollar amount.
Copyright © 2007- 2015 Kinja LLC / Hagar Institute
Rules Of Evidence
Deciding what is evidence, support, proof.
“The appraiser’s opinion
is not persuasive to the court”
Supreme Court the “Daubert Ruling”
Copyright © 2007- 2015 Kinja LLC / Hagar Institute
Non Reliable Method
Supreme Court:
• “We conclude that the appraisal report is not admissible because the author [appraiser] did not apply reliable principles and methods.”
Copyright © 2007- 2015 Kinja LLC / Hagar Institute
According to the courts (Daubert Ruling)
• “Support” can not be biased.– Appraiser problem? Opinions are biased.
• “Support” must be reliable.– It happens again and again.– It can be repeated by others.
• Expert’s methods must be based upon a recognized or identifiable technique.– Opinions are not a recognized or identified technique.– Opinions are not a technique that’s described in any
appraisal text.
Copyright 2000-2015 Richard Hagar, SRA 2
Copyright © 2007- 2015 Kinja LLC / Hagar Institute
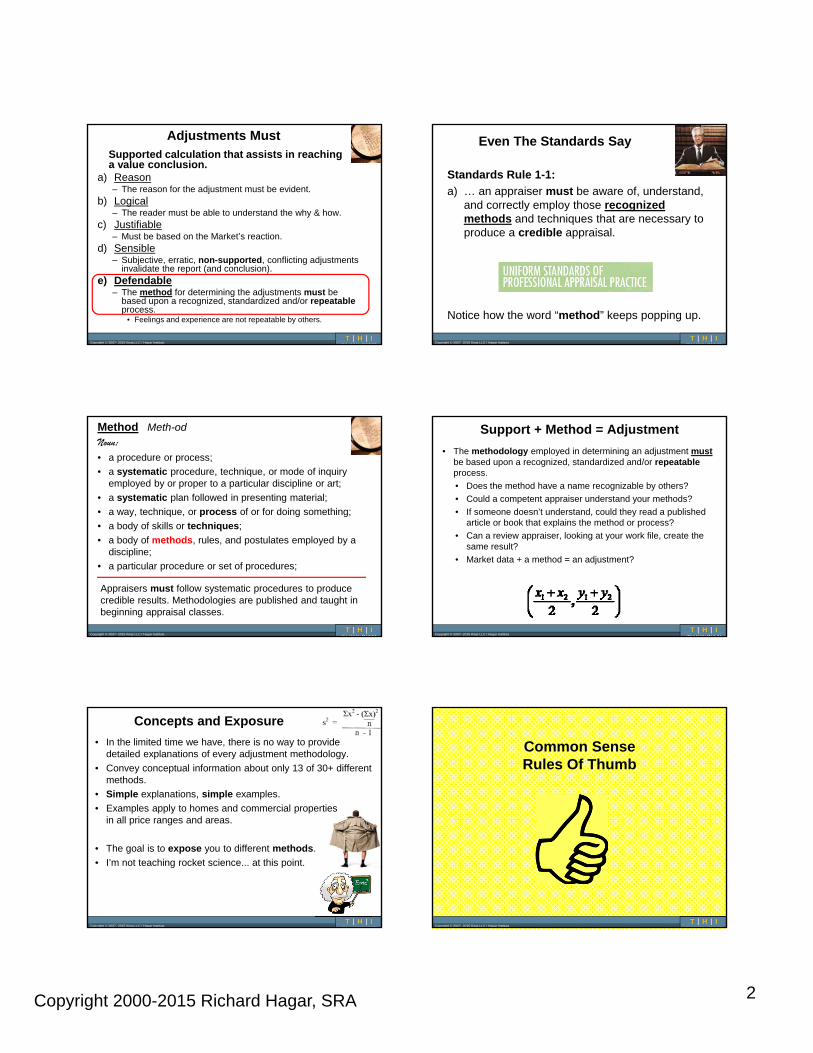
Adjustments MustSupported calculation that assists in reaching a value conclusion.
a) Reason– The reason for the adjustment must be evident.
b) Logical– The reader must be able to understand the why & how.
c) Justifiable– Must be based on the Market’s reaction.
d) Sensible– Subjective, erratic, non-supported, conflicting adjustments
invalidate the report (and conclusion).e) Defendable
– The method for determining the adjustments must be based upon a recognized, standardized and/or repeatableprocess.
• Feelings and experience are not repeatable by others.
Copyright © 2007- 2015 Kinja LLC / Hagar Institute
Even The Standards Say
Standards Rule 1-1:
a) … an appraiser must be aware of, understand, and correctly employ those recognized methods and techniques that are necessary to produce a credible appraisal.
Notice how the word “method” keeps popping up.
Copyright © 2007- 2015 Kinja LLC / Hagar Institute
Method Meth-odNoun:• a procedure or process;
• a systematic procedure, technique, or mode of inquiry employed by or proper to a particular discipline or art;
• a systematic plan followed in presenting material;
• a way, technique, or process of or for doing something;
• a body of skills or techniques;
• a body of methods, rules, and postulates employed by a discipline;
• a particular procedure or set of procedures;
Appraisers must follow systematic procedures to produce credible results. Methodologies are published and taught in beginning appraisal classes.
Copyright © 2007- 2015 Kinja LLC / Hagar Institute
Support + Method = Adjustment
• The methodology employed in determining an adjustment mustbe based upon a recognized, standardized and/or repeatableprocess.
• Does the method have a name recognizable by others?
• Could a competent appraiser understand your methods?
• If someone doesn’t understand, could they read a published article or book that explains the method or process?
• Can a review appraiser, looking at your work file, create the same result?
• Market data + a method = an adjustment?
Copyright © 2007- 2015 Kinja LLC / Hagar Institute
Concepts and Exposure
• In the limited time we have, there is no way to provide detailed explanations of every adjustment methodology.
• Convey conceptual information about only 13 of 30+ different methods.
• Simple explanations, simple examples.
• Examples apply to homes and commercial properties in all price ranges and areas.
• The goal is to expose you to different methods.
• I’m not teaching rocket science... at this point.
Copyright © 2007- 2015 Kinja LLC / Hagar Institute
Common Sense Rules Of Thumb

Copyright 2000-2015 Richard Hagar, SRA 3
Copyright © 2007- 2015 Kinja LLC / Hagar Institute
From A Scientific Point Of View
• Observations lead to forming a Hypothesis.
• The hypothesis is tested by various methods.
• Validation of a Hypothesis leads to a conclusion.
From the appraiser’s point of view:
• Observation leads the appraiser to believe one neighborhood is superior to another.
• The appraiser tests the hypothesis by the use a methodcalled a matched-pair analysis to determine if, and by how much, one neighborhood is superior to another.
• The method’s output is the adjustment in the appraisal.
Copyright © 2007- 2015 Kinja LLC / Hagar Institute
Rule #1 - No Single Method
• There are at least 30 different methods for determining adjustments.
• Because markets vary and have different levels of information, no single method works every time or every place.
• Not every appraiser will understand some of the more complex methods.
• This class will demonstrate several different ways to attack the problem.
• Sometimes you’ll have to attempt or test different methods until something makes sense.– Visually, yellow colored slides will break up the different
methods.
Copyright © 2007- 2015 Kinja LLC / Hagar Institute
Rule – Not By Price• No matter which method or process you use, try not to
search by sales price.
• Searching by sales price indicates a bias toward a certain value conclusion.– Only searching for sales between $200,000 and $250,000
indicates you didn’t consider sales below $200,000 or over $250,000.
• If price restricted, you will likely miss similar homes.
– What if they were physically the most similar to the sub?
– Looks really bad to state auditors.
– The CU doesn’t search by price,
– neither should you.
Copyright © 2007- 2015 Kinja LLC / Hagar Institute
• Can not use information from the newspaper, or what someone else said, as an adjustment, unless the foundation for the article is studied and included.– Where did they get the data?– What was their search criteria?– What was excluded? Included?– Was their data reliable or a column filler?
Rule - Do Not Rely Upon….
Copyright © 2007- 2015 Kinja LLC / Hagar Institute
• Appraisers can not use someone else’s appraisal for support an adjustment. – Did they use the right methods?– What if they made a mistake? – Using their report would multiply the problem by
using it again.– If there’s an issue with your report, are you going to
blame the other appraiser???
Rule - Can Not Use
Copyright © 2007- 2015 Kinja LLC / Hagar Institute
Rule - Best Support
• Best if data is based upon CLOSED sales.– Proof of the market’s actions.
Second best indicators of the market’s actions:A. Listings
– Indicates future possibility/actions– Competing alternatives
B. Expired– Great at showing what something is not worth.

Copyright 2000-2015 Richard Hagar, SRA 4
Copyright © 2007- 2015 Kinja LLC / Hagar Institute
Rule - More Than Just Comment
Examples of appraisal failures:“An adjustment for location has been made to comparable #1.”“Adjustments were made for sites superior and inferior to the subject.”
Fannie Mae’s Selling Guide:• The appraiser must provide appropriate comment(s) reflecting
the logic and reasoning for the adjustments provided,…
• A statement only recognizing that an adjustment has been made is not acceptable.
• Selling Guide: B4-1.3-09, Adjustments to Comparable Sales
Copyright © 2007- 2015 Kinja LLC / Hagar Institute
Rules - Facts Not Opinion
• Support for your adjustments must be in…:a) the report,b) the workfile,c) another location referenced in the workfile or,d) all three of the above. (best option)
• Review appraisers, or government agencies, looking at your appraisal and/or workfile, must be able to replicate data conclusions.– Ask yourself: If someone reads your file (State or lawsuit) is it in there?
Copyright © 2007- 2015 Kinja LLC / Hagar Institute
• Adjustments must be based on facts, not the appraiser’s opinion.– Facts are everything.
• No facts….no data = no support.
• No data, support, proof….. then no adjustmentshould be made on the appraisal.
A Guess / Experience Is Not Good Enough
• If there’s no support, what would your adjustment be based upon?
• Experience is insufficient.• Opinion is not an objective fact.
Copyright © 2007- 2015 Kinja LLC / Hagar Institute
No Adjustment!?
• What do you mean if there is no support we should not make an adjustment??
• Stop and lets talk!
• How do you define the word “support?”If you have an opinion,
Email your definition to the instructor:
Copyright © 2007- 2015 Kinja LLC / Hagar Institute
Charges Against An Appraiser
• No support,• Inaccurate adjustments,
• When charges are filed, what will the government say about your files?
AF - Found guilty.
Copyright © 2007- 2015 Kinja LLC / Hagar Institute
Statement of Charges

Copyright 2000-2015 Richard Hagar, SRA 5
Copyright © 2007- 2015 Kinja LLC / Hagar Institute
Next 5 Rules
Common Sense Rules:
1. You don’t have to make adjustments for every component that’s different.
2. Only adjust the components that the market is adjusting.
3. Adjustments can not be based upon the actions of a single person.
4. Adjustments must be based upon the actions taken by a majority of the market segment.
• Hence the term: “Market Adjustments”
5. Adjustments must be for items that you can support with market evidence.
Copyright © 2007- 2015 Kinja LLC / Hagar Institute
RuleNo Matter Which Method - Keep Notes
• I have a page filled with calculations;
• Every major adjustment is on my note page;
– Location,
– Site,
– Square footage,
– Bed/Bath,
– Etc..
Copyright © 2007- 2015 Kinja LLC / Hagar Institute
Rule - Practice
• Practice one or two methods at a time.– Practice on an easy property with numerous sales.
– Practice until you understand and become comfortable with a method.
– Increase your skills by adding several more methods to your “tool kit.”
– You will become a better appraiser by understanding more methods.
• More complex assignments
• Higher fees.
Copyright © 2007- 2015 Kinja LLC / Hagar Institute
Mistakes And Communication
Fannie Mae’s System
Copyright © 2007- 2015 Kinja LLC / Hagar Institute
Who Has Heard…?
• Fannie Mae does not allow single line adjustments to be more than 15-20%
Or
• Total adjustments to a comparable must be less than X%
Copyright © 2007- 2015 Kinja LLC / Hagar Institute
A Fannie Mae Myth
• Fannie Mae and Freddie Mac do not have limits regarding how big, or small adjustments can be.
• They do not have limits regarding the total number of adjustments.
Who ever told you there was a limit, was wrong. It was a guideline that required a comment, nothing more.
Copyright 2000-2015 Richard Hagar, SRA 6
Copyright © 2007- 2015 Kinja LLC / Hagar Institute
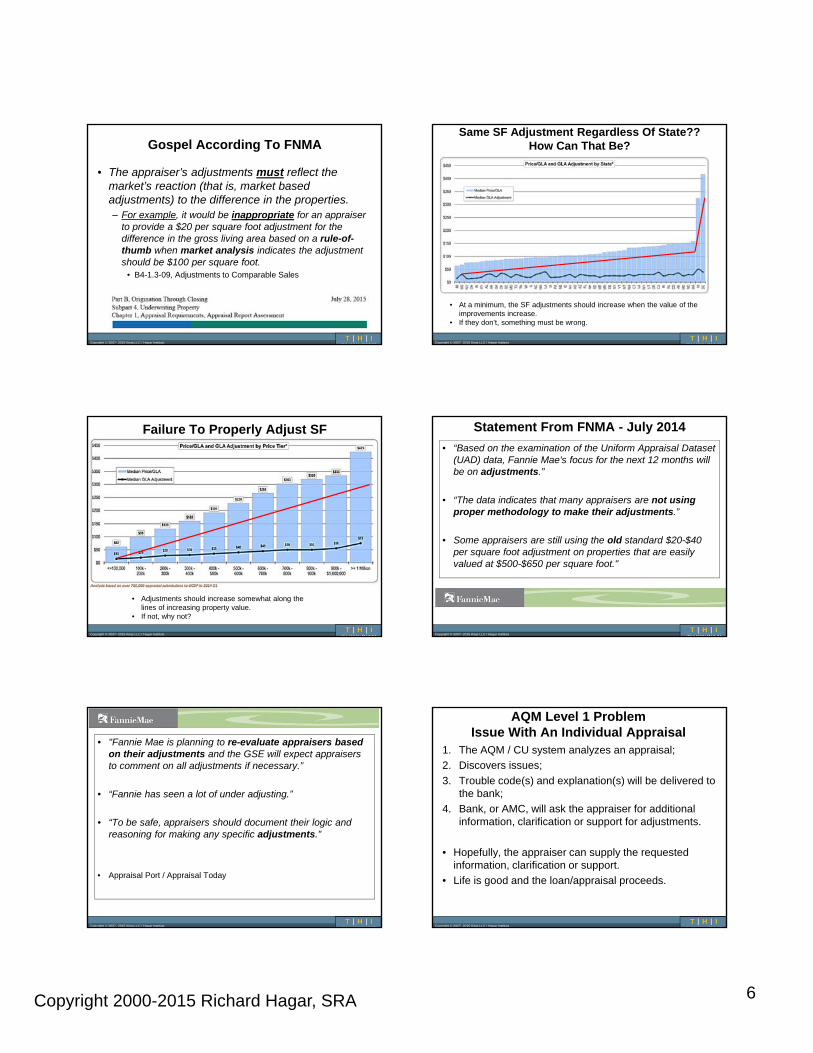
Gospel According To FNMA
• The appraiser’s adjustments must reflect the market’s reaction (that is, market based adjustments) to the difference in the properties. – For example, it would be inappropriate for an appraiser
to provide a $20 per square foot adjustment for the difference in the gross living area based on a rule-of-thumb when market analysis indicates the adjustment should be $100 per square foot.
• B4-1.3-09, Adjustments to Comparable Sales
Copyright © 2007- 2015 Kinja LLC / Hagar Institute
Same SF Adjustment Regardless Of State??How Can That Be?
• At a minimum, the SF adjustments should increase when the value of the improvements increase.
• If they don’t, something must be wrong.
Copyright © 2007- 2015 Kinja LLC / Hagar Institute
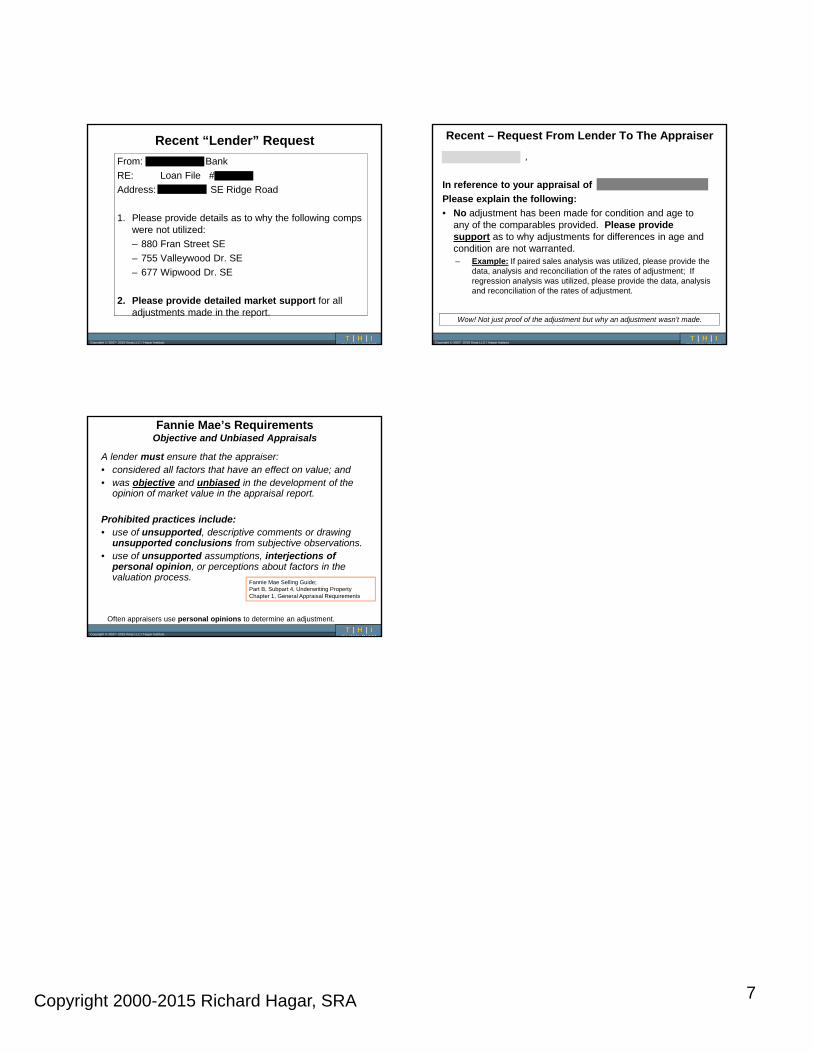
Failure To Properly Adjust SF
• Adjustments should increase somewhat along the lines of increasing property value.
• If not, why not?
Copyright © 2007- 2015 Kinja LLC / Hagar Institute
Statement From FNMA - July 2014
• “Based on the examination of the Uniform Appraisal Dataset (UAD) data, Fannie Mae's focus for the next 12 months will be on adjustments.”
• “The data indicates that many appraisers are not using proper methodology to make their adjustments.”
• Some appraisers are still using the old standard $20-$40 per square foot adjustment on properties that are easily valued at $500-$650 per square foot."
Copyright © 2007- 2015 Kinja LLC / Hagar Institute
• "Fannie Mae is planning to re-evaluate appraisers based on their adjustments and the GSE will expect appraisers to comment on all adjustments if necessary.”
• “Fannie has seen a lot of under adjusting.”
• “To be safe, appraisers should document their logic and reasoning for making any specific adjustments.”
• Appraisal Port / Appraisal Today
Copyright © 2007- 2015 Kinja LLC / Hagar Institute
AQM Level 1 ProblemIssue With An Individual Appraisal
1. The AQM / CU system analyzes an appraisal;
2. Discovers issues;
3. Trouble code(s) and explanation(s) will be delivered to the bank;
4. Bank, or AMC, will ask the appraiser for additional information, clarification or support for adjustments.
• Hopefully, the appraiser can supply the requested information, clarification or support.
• Life is good and the loan/appraisal proceeds.
Copyright 2000-2015 Richard Hagar, SRA 7
Copyright © 2007- 2015 Kinja LLC / Hagar Institute
Recent “Lender” Request
From: Bank
RE: Loan File #
Address: SE Ridge Road
1. Please provide details as to why the following comps were not utilized:
– 880 Fran Street SE
– 755 Valleywood Dr. SE
– 677 Wipwood Dr. SE
2. Please provide detailed market support for all adjustments made in the report.
Copyright © 2007- 2015 Kinja LLC / Hagar Institute
Recent – Request From Lender To The Appraiser
[Appraiser] ,
In reference to your appraisal of
Please explain the following:
• No adjustment has been made for condition and age to any of the comparables provided. Please provide support as to why adjustments for differences in age and condition are not warranted. – Example: If paired sales analysis was utilized, please provide the
data, analysis and reconciliation of the rates of adjustment; If regression analysis was utilized, please provide the data, analysis and reconciliation of the rates of adjustment.
Wow! Not just proof of the adjustment but why an adjustment wasn’t made.
Copyright © 2007- 2015 Kinja LLC / Hagar Institute
Fannie Mae’s RequirementsObjective and Unbiased Appraisals
A lender must ensure that the appraiser:• considered all factors that have an effect on value; and• was objective and unbiased in the development of the
opinion of market value in the appraisal report.
Prohibited practices include:• use of unsupported, descriptive comments or drawing
unsupported conclusions from subjective observations. • use of unsupported assumptions, interjections of
personal opinion, or perceptions about factors in the valuation process.
Fannie Mae Selling Guide;Part B, Subpart 4, Underwriting PropertyChapter 1, General Appraisal Requirements
Often appraisers use personal opinions to determine an adjustment.
Copyright 2000-2015 Richard Hagar, SRA 1
Copyright © 2007- 2015 Kinja LLC / Hagar Institute
Cost Approach
Copyright © 2007- 2015 Kinja LLC / Hagar Institute
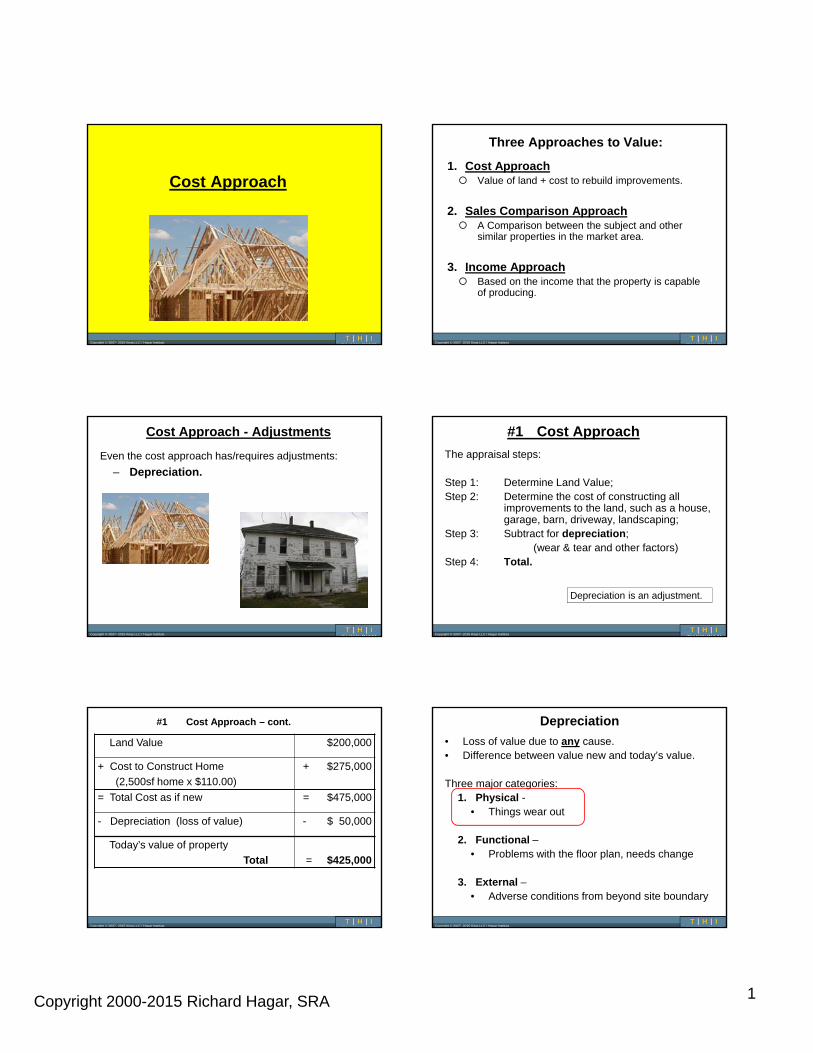
Three Approaches to Value:
1. Cost Approach Value of land + cost to rebuild improvements.
2. Sales Comparison Approach A Comparison between the subject and other
similar properties in the market area.
3. Income Approach Based on the income that the property is capable
of producing.
Copyright © 2007- 2015 Kinja LLC / Hagar Institute
Cost Approach - Adjustments
Even the cost approach has/requires adjustments:
– Depreciation.
Copyright © 2007- 2015 Kinja LLC / Hagar Institute
#1 Cost Approach
The appraisal steps:
Step 1: Determine Land Value;Step 2: Determine the cost of constructing all
improvements to the land, such as a house, garage, barn, driveway, landscaping;
Step 3: Subtract for depreciation; (wear & tear and other factors)
Step 4: Total.
Depreciation is an adjustment.
Copyright © 2007- 2015 Kinja LLC / Hagar Institute
#1 Cost Approach – cont.
Land Value $200,000
+ Cost to Construct Home
(2,500sf home x $110.00)
+ $275,000
= Total Cost as if new = $475,000
- Depreciation (loss of value) - $ 50,000
Today’s value of property
Total = $425,000
Copyright © 2007- 2015 Kinja LLC / Hagar Institute
Depreciation
• Loss of value due to any cause.• Difference between value new and today’s value.
Three major categories:1. Physical -
• Things wear out
2. Functional –• Problems with the floor plan, needs change
3. External –• Adverse conditions from beyond site boundary
Copyright 2000-2015 Richard Hagar, SRA 2
Copyright © 2007- 2015 Kinja LLC / Hagar Institute
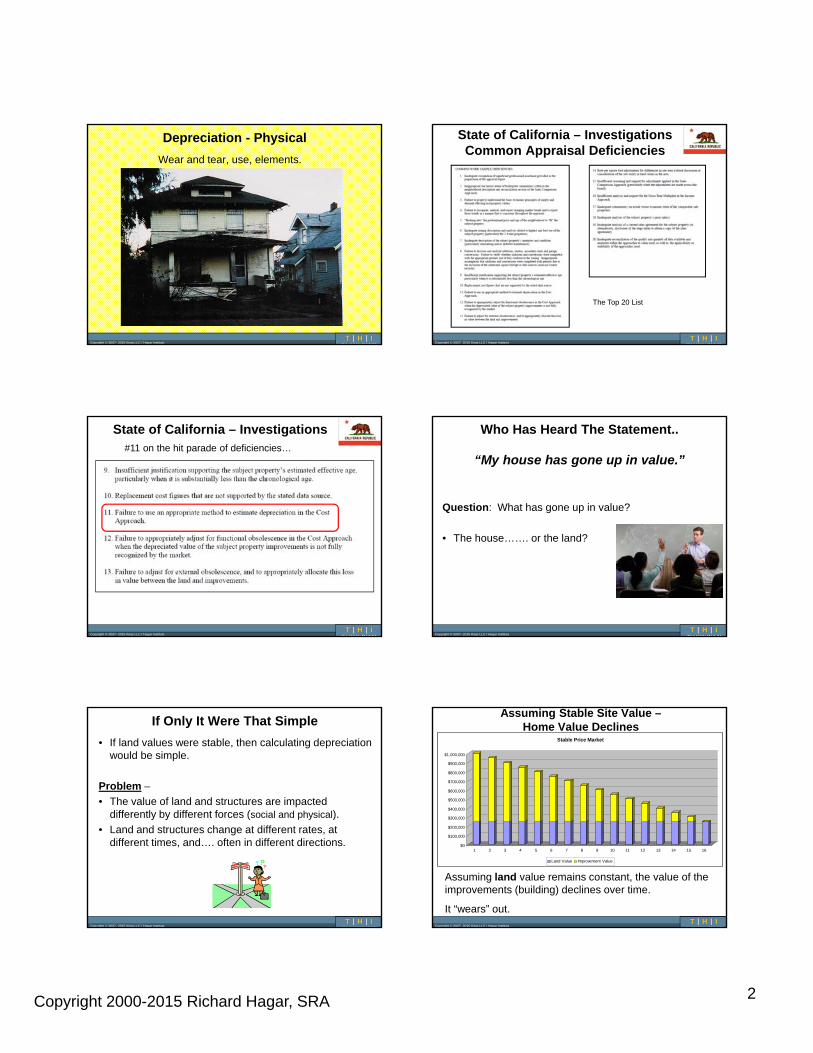
Depreciation - Physical
Wear and tear, use, elements.
Copyright © 2007- 2015 Kinja LLC / Hagar Institute
State of California – InvestigationsCommon Appraisal Deficiencies
The Top 20 List
Copyright © 2007- 2015 Kinja LLC / Hagar Institute
State of California – Investigations#11 on the hit parade of deficiencies…
Copyright © 2007- 2015 Kinja LLC / Hagar Institute
Who Has Heard The Statement..
“My house has gone up in value.”
Question: What has gone up in value?
• The house……. or the land?
Copyright © 2007- 2015 Kinja LLC / Hagar Institute
If Only It Were That Simple
• If land values were stable, then calculating depreciation would be simple.
Problem –
• The value of land and structures are impacted differently by different forces (social and physical).
• Land and structures change at different rates, at different times, and…. often in different directions.
Copyright © 2007- 2015 Kinja LLC / Hagar Institute
Assuming Stable Site Value –Home Value Declines
$0
$100,000
$200,000
$300,000
$400,000
$500,000
$600,000
$700,000
$800,000
$900,000
$1,000,000
1 2 3 4 5 6 7 8 9 10 11 12 13 14 15 16
Stable Price Market
Land Value Improvement Value
Assuming land value remains constant, the value of the improvements (building) declines over time.
It “wears” out.
Copyright 2000-2015 Richard Hagar, SRA 3
Copyright © 2007- 2015 Kinja LLC / Hagar Institute
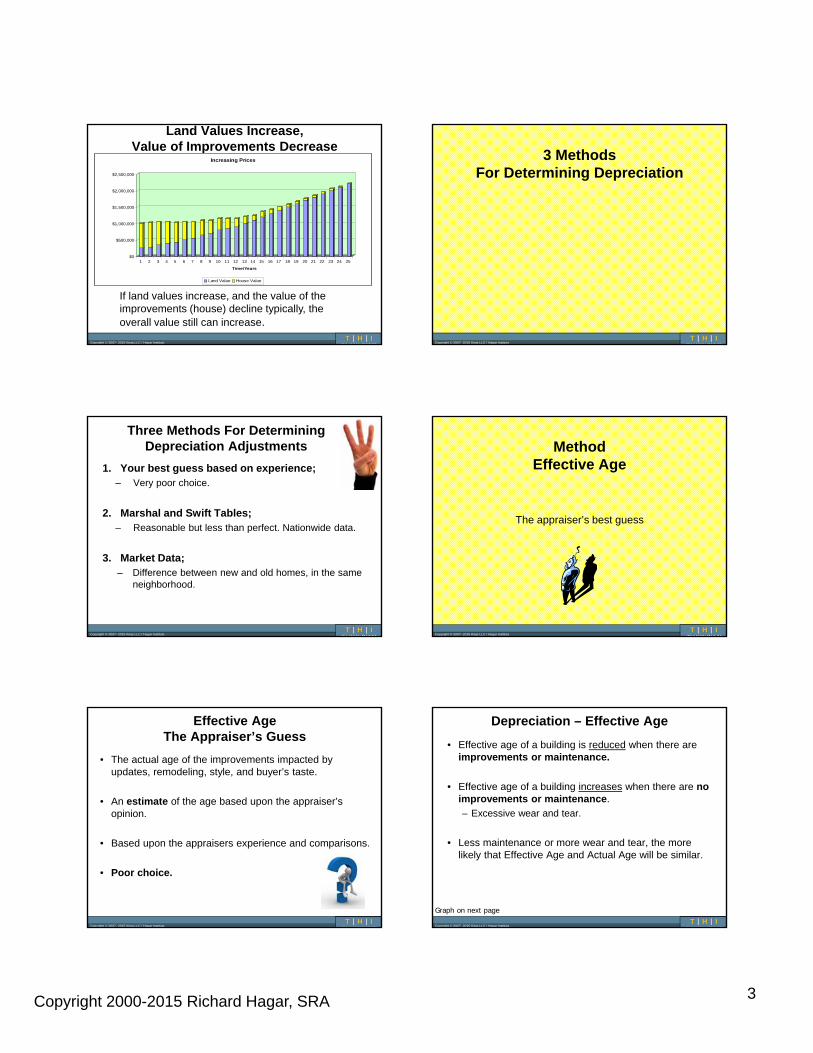
Land Values Increase, Value of Improvements Decrease
If land values increase, and the value of the improvements (house) decline typically, the overall value still can increase.
$0
$500,000
$1,000,000
$1,500,000
$2,000,000
$2,500,000
1 2 3 4 5 6 7 8 9 10 11 12 13 14 15 16 17 18 19 20 21 22 23 24 25
Time/Years
Increasing Prices
Land Value House Value
Copyright © 2007- 2015 Kinja LLC / Hagar Institute
3 MethodsFor Determining Depreciation
Copyright © 2007- 2015 Kinja LLC / Hagar Institute
Three Methods For DeterminingDepreciation Adjustments
1. Your best guess based on experience; – Very poor choice.
2. Marshal and Swift Tables;– Reasonable but less than perfect. Nationwide data.
3. Market Data;– Difference between new and old homes, in the same
neighborhood.
Copyright © 2007- 2015 Kinja LLC / Hagar Institute
MethodEffective Age
The appraiser’s best guess
Copyright © 2007- 2015 Kinja LLC / Hagar Institute
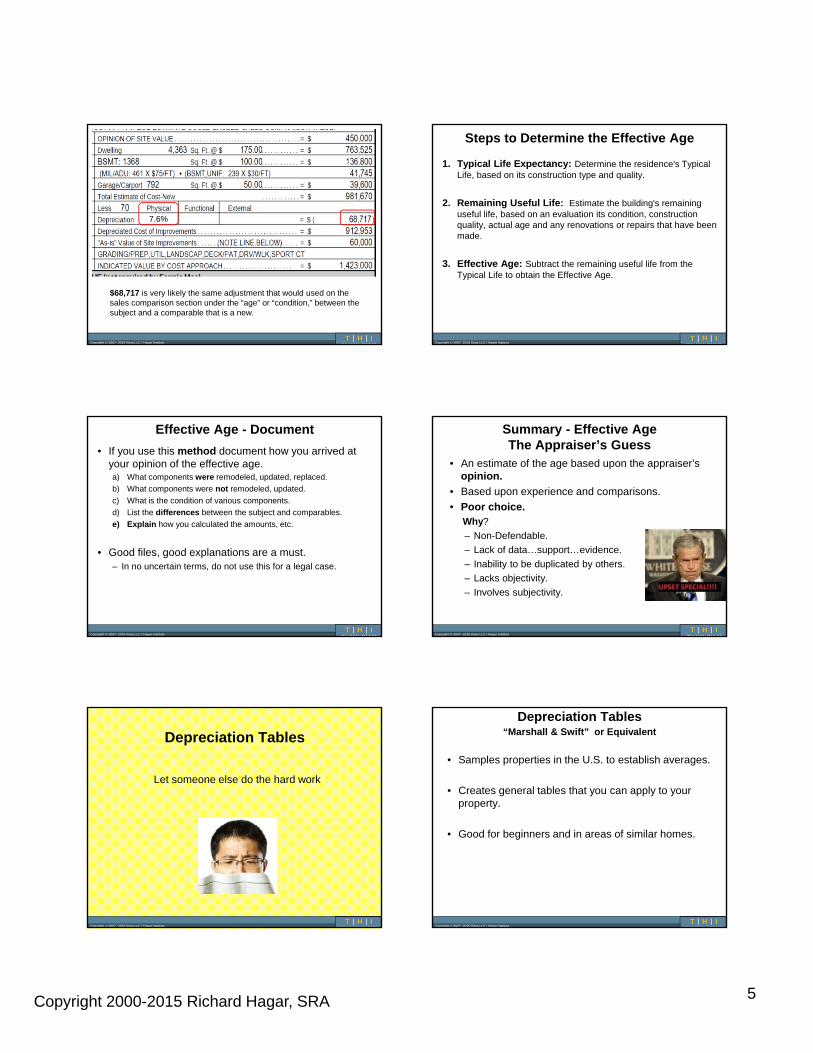
Effective AgeThe Appraiser’s Guess
• The actual age of the improvements impacted by updates, remodeling, style, and buyer’s taste.
• An estimate of the age based upon the appraiser’s opinion.
• Based upon the appraisers experience and comparisons.
• Poor choice.
Copyright © 2007- 2015 Kinja LLC / Hagar Institute
Depreciation – Effective Age
• Effective age of a building is reduced when there are improvements or maintenance.
• Effective age of a building increases when there are no improvements or maintenance.
– Excessive wear and tear.
• Less maintenance or more wear and tear, the more likely that Effective Age and Actual Age will be similar.
Graph on next page
Copyright 2000-2015 Richard Hagar, SRA 4
Copyright © 2007- 2015 Kinja LLC / Hagar Institute
Depreciation
Higher Effective Age
Lower Effective Age
No Maintenance
Extensive Maintenance
25 yrs
15 yrs
5 yrs
To a pointStyle and needs change
Copyright © 2007- 2015 Kinja LLC / Hagar Institute
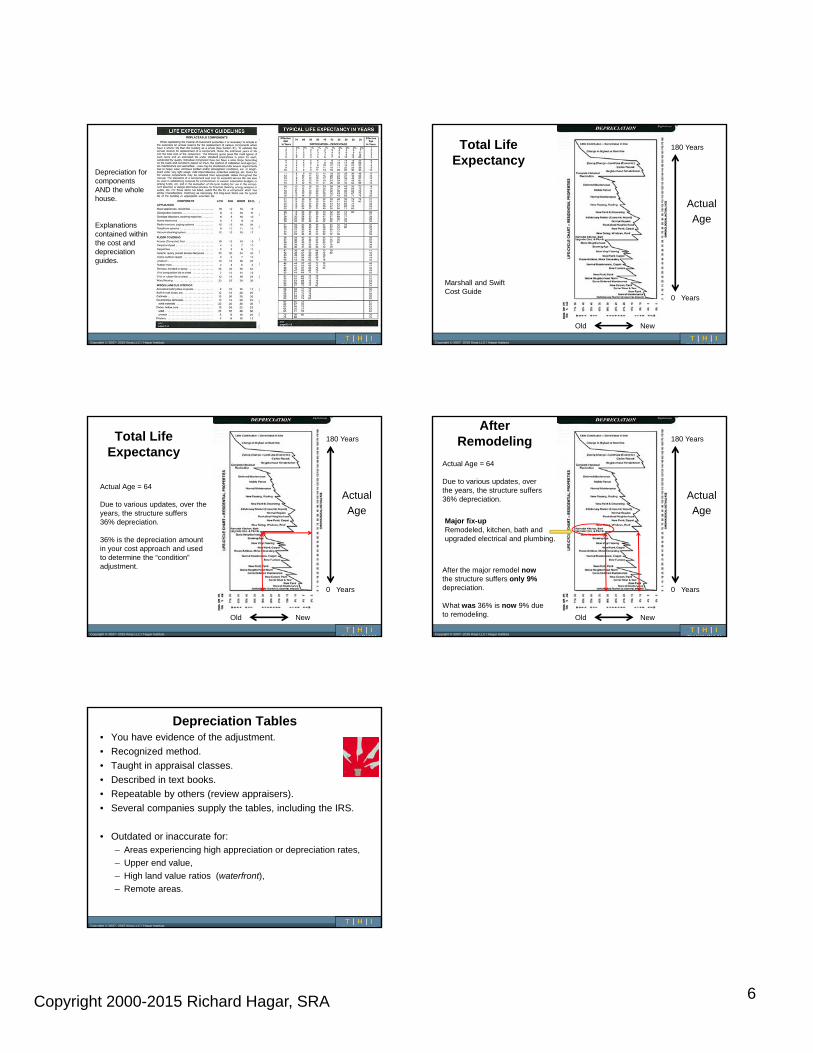
Life Expectancy Chart
Quality “Q” Site BuiltFrame / Masonry
Manufactured Home
Log Homes
Excellent 1 60 – 65 Years 40 / 45
Very Good 2 55 – 60 Years 35 / 40
Good 3 55 – 60 Years 30 / 35
Average 4 55 – 60 Years 25 / 30
Fair 5 50 – 50 Years 20 / 25
Low 6 45 – 50 Years 20 / 25
Copyright © 2007- 2015 Kinja LLC / Hagar Institute
Depreciation –Physical Straight Line Depreciation
0
20,000
40,000
60,000
80,000
100,000
120,000
Yea
r1
Year 65
$0 value
Value of the improvements
Copyright © 2007- 2015 Kinja LLC / Hagar Institute
Depreciation –Physical With Improvements
0
20,000
40,000
60,000
80,000
100,000
120,000Y
ear1
Year 65
$0 value
Year 100
Yea
r 7
Yea
r 20
Copyright © 2007- 2015 Kinja LLC / Hagar Institute
Depreciation
• Improvements to a building reduces the building’s effective age.
– Actual building age is 20 years old;
– However, due to improvements the “Effective Age” is estimated at 5 years.
• Both ages can be placed on the Report:
– Actual age = 20 years
– Effective age = 5 years
Copyright © 2007- 2015 Kinja LLC / Hagar Institute
Calculating Total Physical Depreciation (Adjustment)
• Average construction is expected to last 65 years.• Assume a property has an Effective Age of 5 years:
Effective age ÷ Anticipated age = Amount of Depreciation
5 ÷ 65 = 7.6% (1.52% yr.)
7.6% of the total construction cost must be subtracted due to depreciation.
7.6% is the adjustment for depreciation.
Copyright 2000-2015 Richard Hagar, SRA 5
Copyright © 2007- 2015 Kinja LLC / Hagar Institute
$68,717 is very likely the same adjustment that would used on the sales comparison section under the “age” or “condition,” between the subject and a comparable that is a new.
7.6%
Copyright © 2007- 2015 Kinja LLC / Hagar Institute
Steps to Determine the Effective Age
1. Typical Life Expectancy: Determine the residence's Typical Life, based on its construction type and quality.
2. Remaining Useful Life: Estimate the building's remaining useful life, based on an evaluation its condition, construction quality, actual age and any renovations or repairs that have been made.
3. Effective Age: Subtract the remaining useful life from the Typical Life to obtain the Effective Age.
Copyright © 2007- 2015 Kinja LLC / Hagar Institute
Effective Age - Document
• If you use this method document how you arrived at your opinion of the effective age.a) What components were remodeled, updated, replaced.
b) What components were not remodeled, updated.
c) What is the condition of various components.
d) List the differences between the subject and comparables.
e) Explain how you calculated the amounts, etc.
• Good files, good explanations are a must.– In no uncertain terms, do not use this for a legal case.
Copyright © 2007- 2015 Kinja LLC / Hagar Institute
Summary - Effective AgeThe Appraiser’s Guess
• An estimate of the age based upon the appraiser’s opinion.
• Based upon experience and comparisons.
• Poor choice.Why?
– Non-Defendable.
– Lack of data…support…evidence.
– Inability to be duplicated by others.
– Lacks objectivity.
– Involves subjectivity.
Copyright © 2007- 2015 Kinja LLC / Hagar Institute
Depreciation Tables
Let someone else do the hard work
Copyright © 2007- 2015 Kinja LLC / Hagar Institute
Depreciation Tables“Marshall & Swift” or Equivalent
• Samples properties in the U.S. to establish averages.
• Creates general tables that you can apply to your property.
• Good for beginners and in areas of similar homes.
Copyright 2000-2015 Richard Hagar, SRA 6
Copyright © 2007- 2015 Kinja LLC / Hagar Institute
Depreciation for components AND the whole house.
Explanations contained within the cost and depreciation guides.
Copyright © 2007- 2015 Kinja LLC / Hagar Institute
180 Years
0 Years
Total Life Expectancy
Actual
Age
Old New
Marshall and Swift Cost Guide
Copyright © 2007- 2015 Kinja LLC / Hagar Institute
180 Years
0 Years
Total Life Expectancy
Actual
Age
Old New
Actual Age = 64
Due to various updates, over the years, the structure suffers 36% depreciation.
36% is the depreciation amount in your cost approach and used to determine the “condition” adjustment.
Copyright © 2007- 2015 Kinja LLC / Hagar Institute
180 Years
0 Years
After Remodeling
Actual
Age
Old New
Major fix-upRemodeled, kitchen, bath and upgraded electrical and plumbing.
Actual Age = 64
Due to various updates, over the years, the structure suffers 36% depreciation.
After the major remodel nowthe structure suffers only 9% depreciation.
What was 36% is now 9% due to remodeling.
Copyright © 2007- 2015 Kinja LLC / Hagar Institute
Depreciation Tables• You have evidence of the adjustment.
• Recognized method.
• Taught in appraisal classes.
• Described in text books.
• Repeatable by others (review appraisers).
• Several companies supply the tables, including the IRS.
• Outdated or inaccurate for:– Areas experiencing high appreciation or depreciation rates,
– Upper end value,
– High land value ratios (waterfront),
– Remote areas.
Copyright 2000-2015 Richard Hagar, SRA 1
Copyright © 2007- 2015 Kinja LLC / Hagar Institute
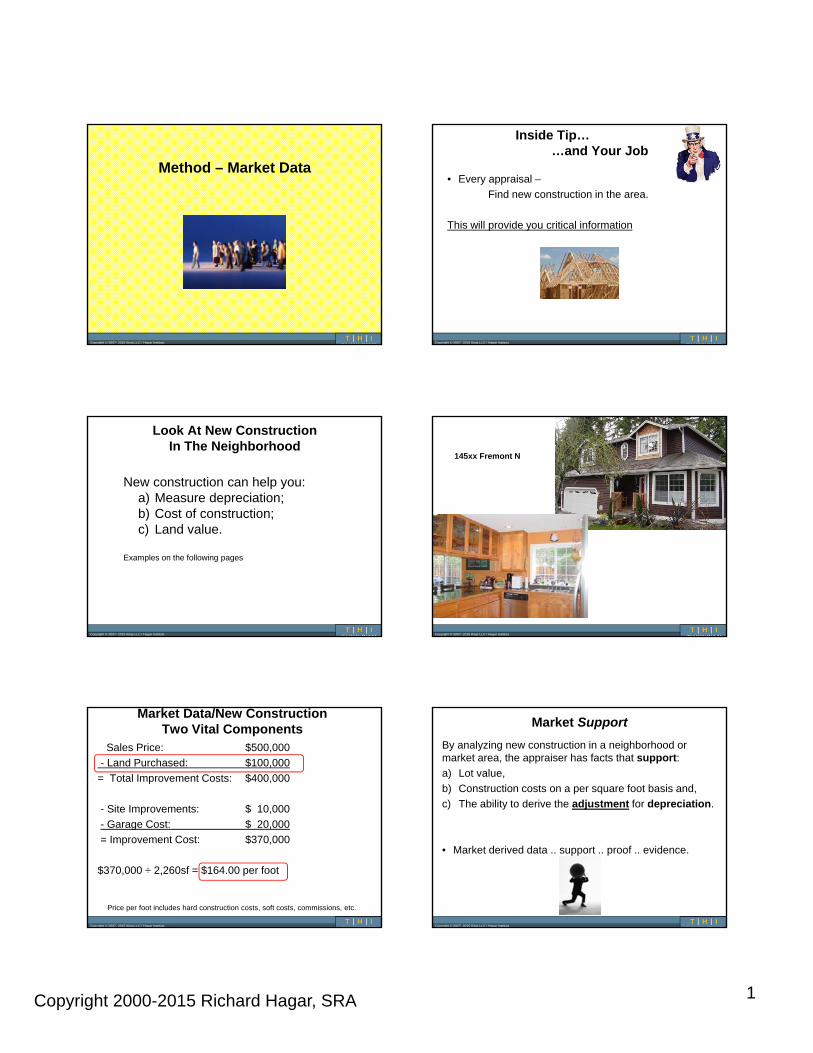
Method – Market Data
Copyright © 2007- 2015 Kinja LLC / Hagar Institute
Inside Tip……and Your Job
• Every appraisal –
Find new construction in the area.
This will provide you critical information
Copyright © 2007- 2015 Kinja LLC / Hagar Institute
Look At New Construction In The Neighborhood
New construction can help you:a) Measure depreciation;b) Cost of construction;c) Land value.
Examples on the following pages
Copyright © 2007- 2015 Kinja LLC / Hagar Institute
145xx Fremont N
Copyright © 2007- 2015 Kinja LLC / Hagar Institute
Market Data/New ConstructionTwo Vital Components
Sales Price: $500,000
- Land Purchased: $100,000
= Total Improvement Costs: $400,000
- Site Improvements: $ 10,000
- Garage Cost: $ 20,000
= Improvement Cost: $370,000
$370,000 ÷ 2,260sf = $164.00 per foot
Price per foot includes hard construction costs, soft costs, commissions, etc.
Copyright © 2007- 2015 Kinja LLC / Hagar Institute
Market Support
By analyzing new construction in a neighborhood or market area, the appraiser has facts that support:
a) Lot value,
b) Construction costs on a per square foot basis and,
c) The ability to derive the adjustment for depreciation.
• Market derived data .. support .. proof .. evidence.
Copyright 2000-2015 Richard Hagar, SRA 2
Copyright © 2007- 2015 Kinja LLC / Hagar Institute
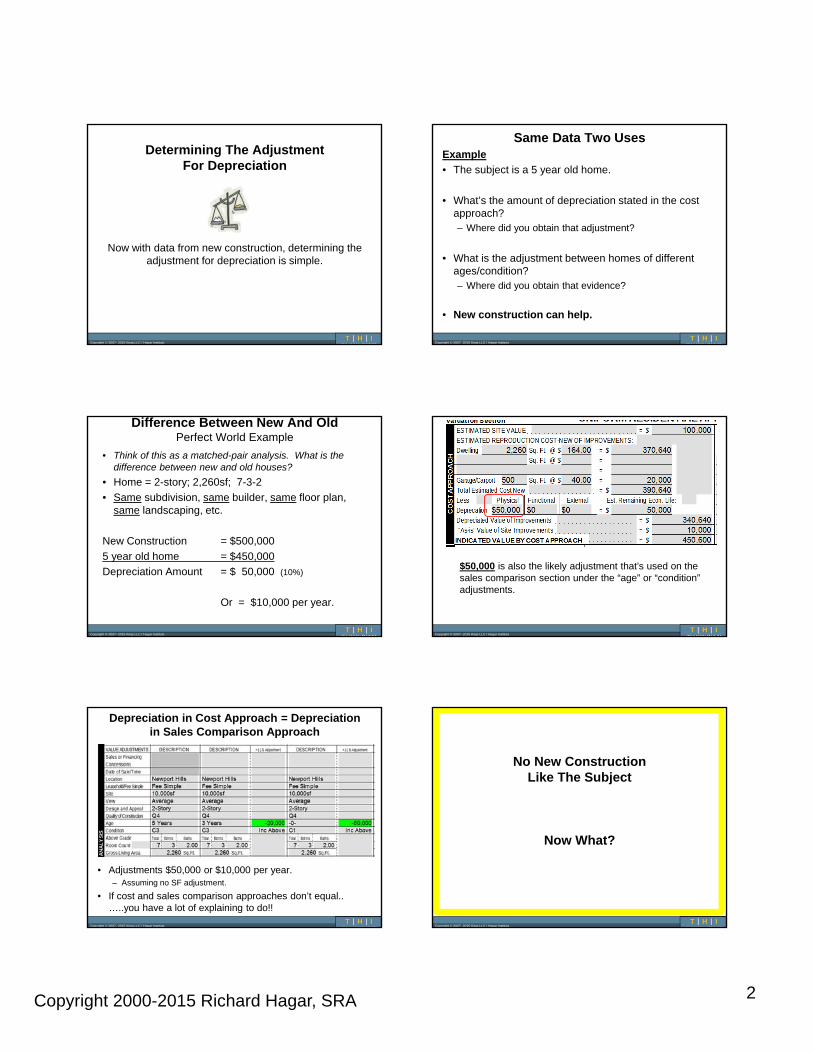
Determining The AdjustmentFor Depreciation
Now with data from new construction, determining the adjustment for depreciation is simple.
Copyright © 2007- 2015 Kinja LLC / Hagar Institute
Same Data Two UsesExample
• The subject is a 5 year old home.
• What’s the amount of depreciation stated in the cost approach?– Where did you obtain that adjustment?
• What is the adjustment between homes of different ages/condition?– Where did you obtain that evidence?
• New construction can help.
Copyright © 2007- 2015 Kinja LLC / Hagar Institute
Difference Between New And OldPerfect World Example
• Think of this as a matched-pair analysis. What is the difference between new and old houses?
• Home = 2-story; 2,260sf; 7-3-2
• Same subdivision, same builder, same floor plan, same landscaping, etc.
New Construction = $500,000
5 year old home = $450,000
Depreciation Amount = $ 50,000 (10%)
Or = $10,000 per year.
Copyright © 2007- 2015 Kinja LLC / Hagar Institute
$50,000 is also the likely adjustment that’s used on the sales comparison section under the “age” or “condition” adjustments.
Copyright © 2007- 2015 Kinja LLC / Hagar Institute
Depreciation in Cost Approach = Depreciation in Sales Comparison Approach
• Adjustments $50,000 or $10,000 per year.– Assuming no SF adjustment.
• If cost and sales comparison approaches don’t equal.. …..you have a lot of explaining to do!!
Copyright © 2007- 2015 Kinja LLC / Hagar Institute
No New ConstructionLike The Subject
Now What?
Copyright 2000-2015 Richard Hagar, SRA 3
Copyright © 2007- 2015 Kinja LLC / Hagar Institute
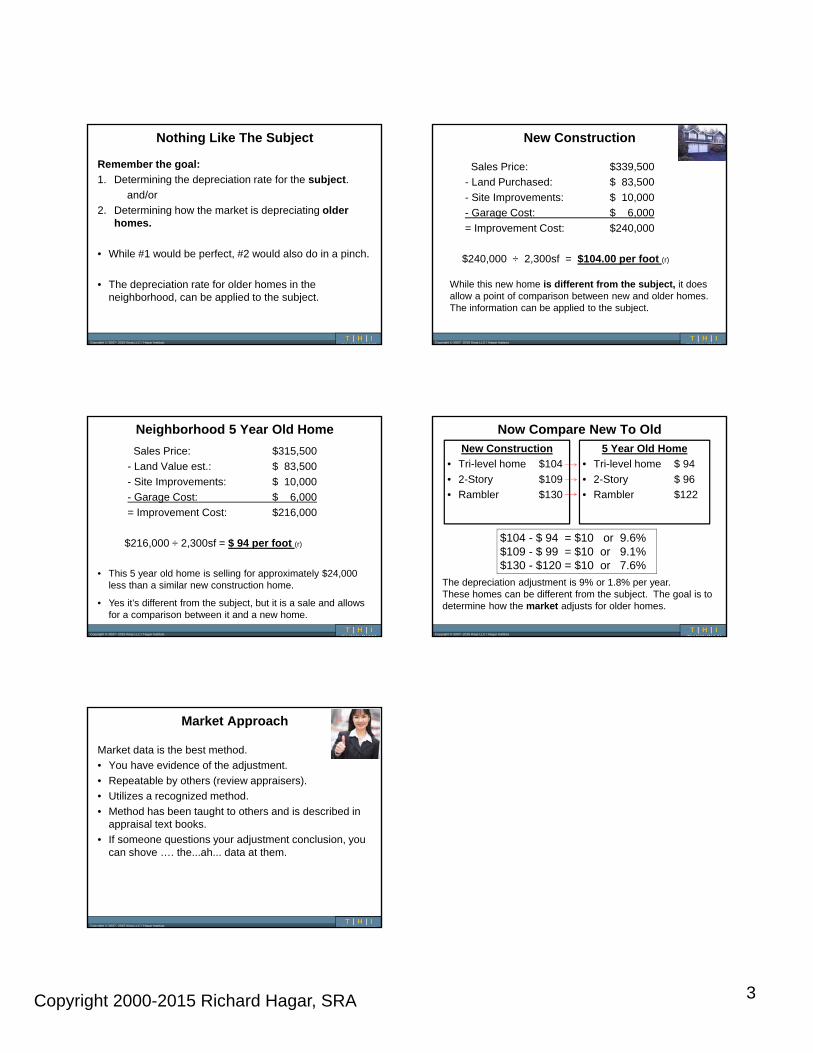
Nothing Like The Subject
Remember the goal:
1. Determining the depreciation rate for the subject.
and/or
2. Determining how the market is depreciating older homes.
• While #1 would be perfect, #2 would also do in a pinch.
• The depreciation rate for older homes in the neighborhood, can be applied to the subject.
Copyright © 2007- 2015 Kinja LLC / Hagar Institute
New Construction
Sales Price: $339,500
- Land Purchased: $ 83,500
- Site Improvements: $ 10,000
- Garage Cost: $ 6,000
= Improvement Cost: $240,000
$240,000 ÷ 2,300sf = $104.00 per foot (r)
While this new home is different from the subject, it does allow a point of comparison between new and older homes. The information can be applied to the subject.
Copyright © 2007- 2015 Kinja LLC / Hagar Institute
Neighborhood 5 Year Old Home
Sales Price: $315,500
- Land Value est.: $ 83,500
- Site Improvements: $ 10,000
- Garage Cost: $ 6,000
= Improvement Cost: $216,000
$216,000 ÷ 2,300sf = $ 94 per foot (r)
• This 5 year old home is selling for approximately $24,000 less than a similar new construction home.
• Yes it’s different from the subject, but it is a sale and allows for a comparison between it and a new home.
Copyright © 2007- 2015 Kinja LLC / Hagar Institute
Now Compare New To Old
New Construction
• Tri-level home $104
• 2-Story $109
• Rambler $130
5 Year Old Home
• Tri-level home $ 94
• 2-Story $ 96
• Rambler $122
$104 - $ 94 = $10 or 9.6%$109 - $ 99 = $10 or 9.1%$130 - $120 = $10 or 7.6%
The depreciation adjustment is 9% or 1.8% per year.These homes can be different from the subject. The goal is to determine how the market adjusts for older homes.
Copyright © 2007- 2015 Kinja LLC / Hagar Institute
Market Approach
Market data is the best method.
• You have evidence of the adjustment.
• Repeatable by others (review appraisers).
• Utilizes a recognized method.
• Method has been taught to others and is described in appraisal text books.
• If someone questions your adjustment conclusion, you can shove …. the...ah... data at them.
Copyright 2000-2015 Richard Hagar, SRA 1
Copyright © 2007- 2015 Kinja LLC / Hagar Institute
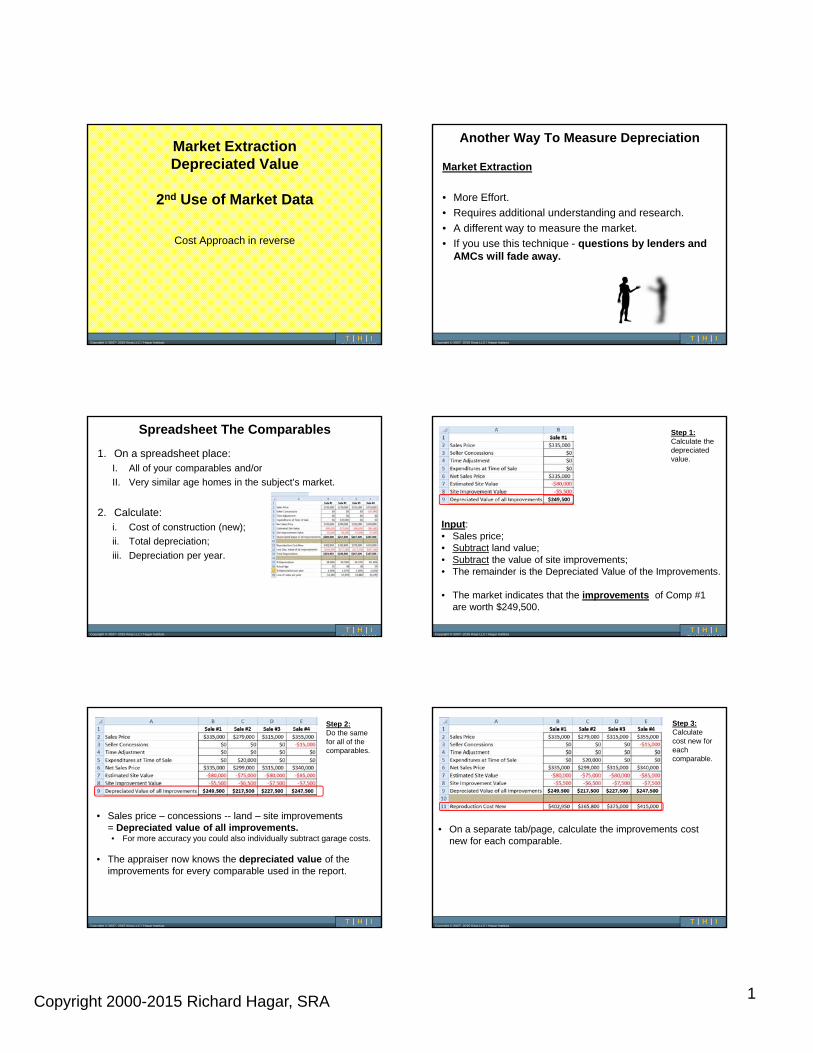
Market ExtractionDepreciated Value
2nd Use of Market Data
Cost Approach in reverse
Copyright © 2007- 2015 Kinja LLC / Hagar Institute
Another Way To Measure Depreciation
Market Extraction
• More Effort.
• Requires additional understanding and research.
• A different way to measure the market.
• If you use this technique - questions by lenders and AMCs will fade away.
Copyright © 2007- 2015 Kinja LLC / Hagar Institute
Spreadsheet The Comparables
1. On a spreadsheet place:I. All of your comparables and/or
II. Very similar age homes in the subject’s market.
2. Calculate:i. Cost of construction (new);
ii. Total depreciation;
iii. Depreciation per year.
Copyright © 2007- 2015 Kinja LLC / Hagar Institute
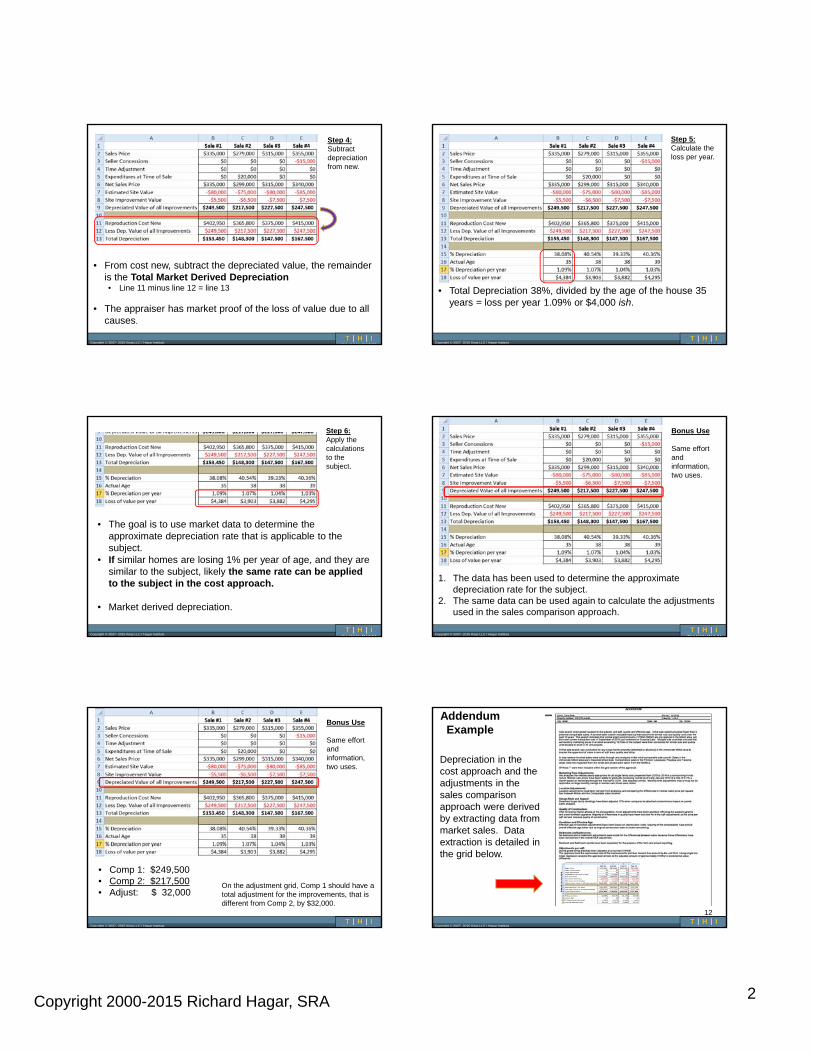
Input:• Sales price;• Subtract land value;• Subtract the value of site improvements;• The remainder is the Depreciated Value of the Improvements.
• The market indicates that the improvements of Comp #1 are worth $249,500.
Step 1:Calculate the depreciated value.
Copyright © 2007- 2015 Kinja LLC / Hagar Institute
• Sales price – concessions -- land – site improvements = Depreciated value of all improvements.• For more accuracy you could also individually subtract garage costs.
• The appraiser now knows the depreciated value of the improvements for every comparable used in the report.
Step 2:Do the same for all of the comparables.
Copyright © 2007- 2015 Kinja LLC / Hagar Institute
• On a separate tab/page, calculate the improvements cost new for each comparable.
Step 3:Calculate cost new for each comparable.
Copyright 2000-2015 Richard Hagar, SRA 2
Copyright © 2007- 2015 Kinja LLC / Hagar Institute
• From cost new, subtract the depreciated value, the remainder is the Total Market Derived Depreciation• Line 11 minus line 12 = line 13
• The appraiser has market proof of the loss of value due to all causes.
Step 4:Subtract depreciation from new.
Copyright © 2007- 2015 Kinja LLC / Hagar Institute
• Total Depreciation 38%, divided by the age of the house 35 years = loss per year 1.09% or $4,000 ish.
Step 5:Calculate the loss per year.
Copyright © 2007- 2015 Kinja LLC / Hagar Institute
• The goal is to use market data to determine the approximate depreciation rate that is applicable to the subject.
• If similar homes are losing 1% per year of age, and they are similar to the subject, likely the same rate can be applied to the subject in the cost approach.
• Market derived depreciation.
Step 6:Apply the calculations to the subject.
Copyright © 2007- 2015 Kinja LLC / Hagar Institute
1. The data has been used to determine the approximate depreciation rate for the subject.
2. The same data can be used again to calculate the adjustments used in the sales comparison approach.
Bonus Use
Same effort and information, two uses.
Copyright © 2007- 2015 Kinja LLC / Hagar Institute
• Comp 1: $249,500• Comp 2: $217,500• Adjust: $ 32,000
Bonus Use
Same effort and information, two uses.
On the adjustment grid, Comp 1 should have a total adjustment for the improvements, that is different from Comp 2, by $32,000.
Copyright © 2007- 2015 Kinja LLC / Hagar Institute
Addendum Example
12
Depreciation in the cost approach and the adjustments in the sales comparison approach were derived by extracting data from market sales. Data extraction is detailed in the grid below.
Copyright 2000-2015 Richard Hagar, SRA 3
Copyright © 2007- 2015 Kinja LLC / Hagar Institute
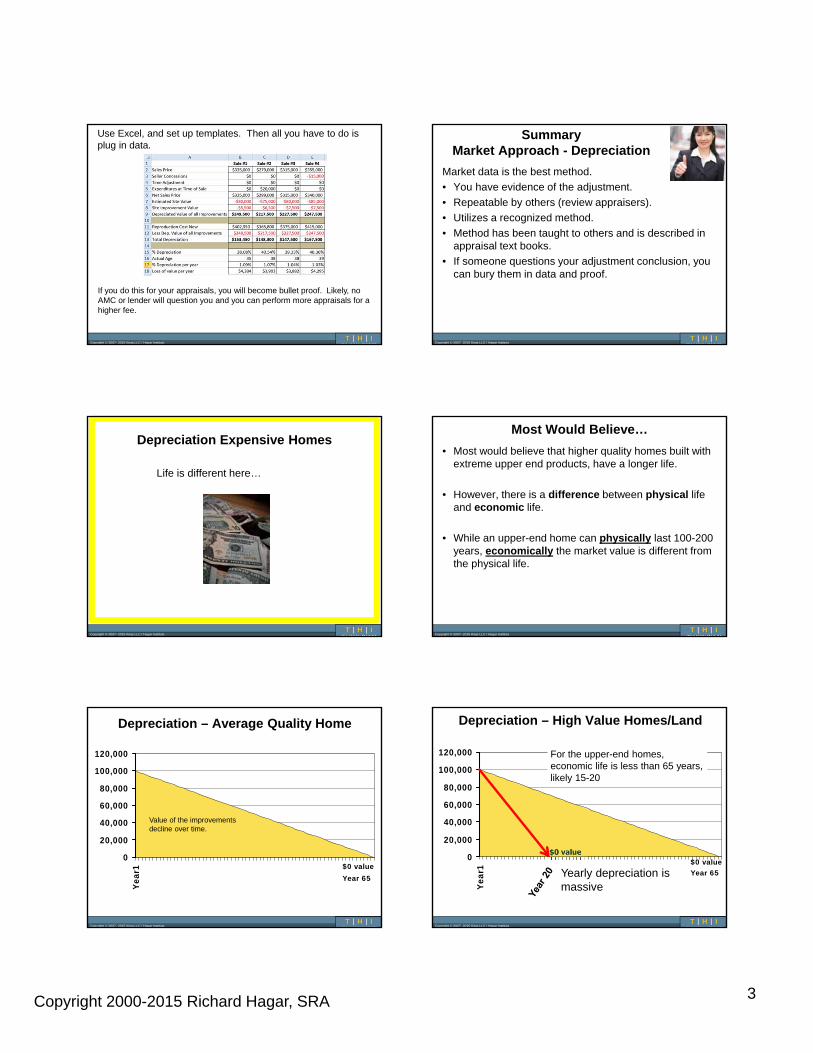
Use Excel, and set up templates. Then all you have to do is plug in data.
If you do this for your appraisals, you will become bullet proof. Likely, no AMC or lender will question you and you can perform more appraisals for a higher fee.
Copyright © 2007- 2015 Kinja LLC / Hagar Institute
SummaryMarket Approach - Depreciation
Market data is the best method.
• You have evidence of the adjustment.
• Repeatable by others (review appraisers).
• Utilizes a recognized method.
• Method has been taught to others and is described in appraisal text books.
• If someone questions your adjustment conclusion, you can bury them in data and proof.
Copyright © 2007- 2015 Kinja LLC / Hagar Institute
Depreciation Expensive Homes
Life is different here…
Copyright © 2007- 2015 Kinja LLC / Hagar Institute
Most Would Believe…
• Most would believe that higher quality homes built with extreme upper end products, have a longer life.
• However, there is a difference between physical life and economic life.
• While an upper-end home can physically last 100-200 years, economically the market value is different from the physical life.
Copyright © 2007- 2015 Kinja LLC / Hagar Institute
Depreciation – Average Quality Home
0
20,000
40,000
60,000
80,000
100,000
120,000
Yea
r1
Year 65
$0 value
Value of the improvementsdecline over time.
Copyright © 2007- 2015 Kinja LLC / Hagar Institute
Depreciation – High Value Homes/Land
0
20,000
40,000
60,000
80,000
100,000
120,000
Yea
r1 Year 65$0 value
For the upper-end homes, economic life is less than 65 years, likely 15-20
Yearly depreciation is massive

Copyright 2000-2015 Richard Hagar, SRA 4
Copyright © 2007- 2015 Kinja LLC / Hagar Institute
Nice House - Long Physical Life
• Dodge Mansion / Grosse Pointe (Detroit);• Rose Terrace;• Considered to be one of the grandest most
expensive homes built in America;• Built in 1910;• $4 million;• 100+ years of physical life.
Copyright © 2007- 2015 Kinja LLC / Hagar Institute
Rose Terrace I
Copyright © 2007- 2015 Kinja LLC / Hagar Institute
Long Physical - Short Economic Life
• Dodge Mansion / Grosse Pointe (Detroit);• Rose Terrace;• Considered to be one of the grandest most
expensive homes built in America;• $4 million;• 100+ years of physical life;• Built in 1910;• Torn down 1931;
• 21 years of economic life.Then…
Copyright © 2007- 2015 Kinja LLC / Hagar Institute
Copyright © 2007- 2015 Kinja LLC / Hagar Institute
Short Economic Life
• Rose Terrace II
• Built in 1931/34;
• $7.5 million / $186 per foot;
• One of the grandest most expensive homes built in America, again;
• 40,313sf (tax records)
• Torn down 1976 (42 yrs. old);
• Cost today $5,000 per sf.
Car cost:
1915 $ 800
2005 $25,000
3125% increase
----------------------------------
$7 mill x 3125% = $224 million
Copyright © 2007- 2015 Kinja LLC / Hagar Institute
Groat Point – Bellevue WA

Copyright 2000-2015 Richard Hagar, SRA 5
Copyright © 2007- 2015 Kinja LLC / Hagar Institute
Groat Point
Features:
• 2 acres;
• Built 1986;
• 15,160+ sf.;
• Massive multi-million dollar remodel 1996/97;
• Added SF in 2000;
• + Attached garage;
• + Room over the garage;
• 26 years old.
Sales History
• 1995 $ 8,500,000 +
• 2011 $15,250,000
• 2012 Torn down
Copyright © 2007- 2015 Kinja LLC / Hagar Institute
My Point
• Don’t allow my expensive home example throw you.
• Different price range…
• Different areas…
• Different rates of depreciation and condition adjustments.
• And appraisers have to measure the difference no matter what the value.
Copyright © 2007- 2015 Kinja LLC / Hagar Institute
• 40 years old;
• New roof, new paint, average (C4) condition;
• So was it purchased as a “home” or land?
• It was purchased and torn down.
• If you appraised it, what depreciation figure would you have used?
• If you used it as a house comp….the house had no value.– It’s a land sale.
Copyright © 2007- 2015 Kinja LLC / Hagar Institute
Reviewing Adjustments
How you can spot bad adjustments
and failed appraisals.
Copyright © 2007- 2015 Kinja LLC / Hagar Institute
In Our Reviews
1. First we look at is the amount of depreciation noted in the cost approach.
2. Second, we look at the condition adjustments in the sales comparison approach, if they are different….
3. Then we look for explanations in the narrative section.
• If the figures are different and there is no explanation, we burrow in and rip the appraisal apart.
Computer programs can do the same thing.
Copyright © 2007- 2015 Kinja LLC / Hagar Institute
How To Spot A Bad Appraisal
• Components of the Cost Approach are directly related to the Sales Comparison Approach.
• Failure to cross check the two leads to failed appraisals, upset review appraisers, bad loans, and a bad economy.
Copyright 2000-2015 Richard Hagar, SRA 6
Copyright © 2007- 2015 Kinja LLC / Hagar Institute
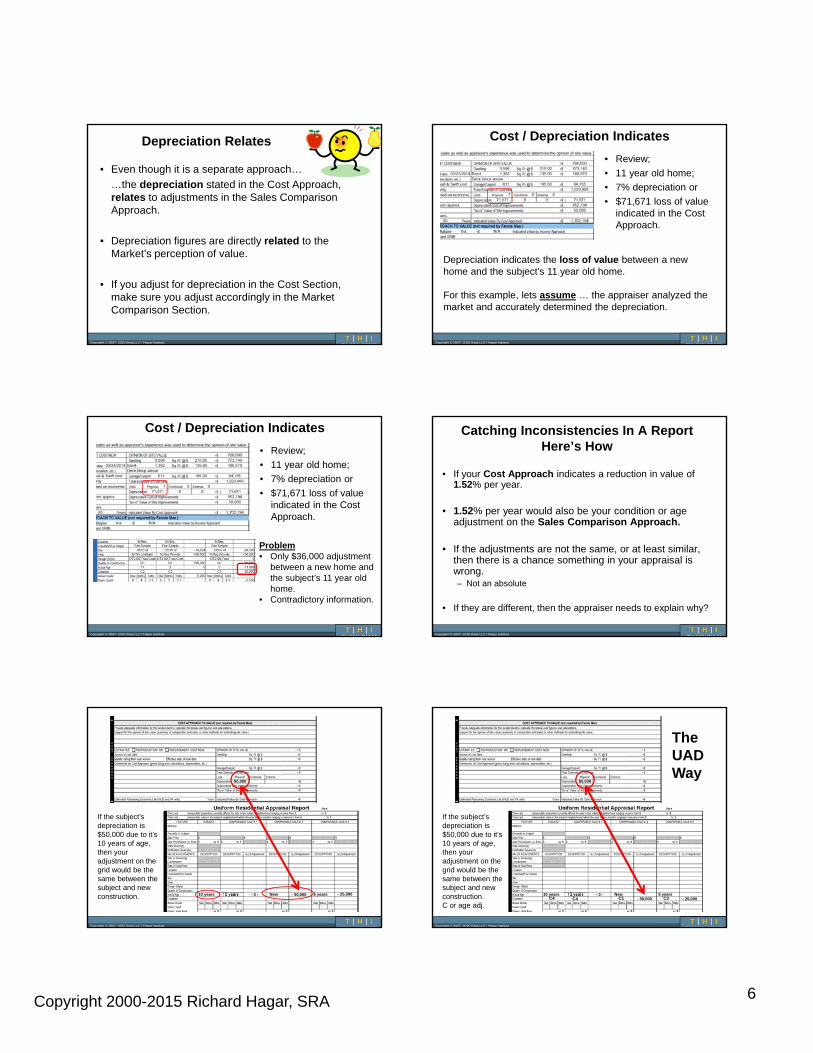
Depreciation Relates
• Even though it is a separate approach…
…the depreciation stated in the Cost Approach, relates to adjustments in the Sales Comparison Approach.
• Depreciation figures are directly related to the Market’s perception of value.
• If you adjust for depreciation in the Cost Section, make sure you adjust accordingly in the Market Comparison Section.
Copyright © 2007- 2015 Kinja LLC / Hagar Institute
Cost / Depreciation Indicates
• Review;
• 11 year old home;
• 7% depreciation or
• $71,671 loss of value indicated in the Cost Approach.
Depreciation indicates the loss of value between a new home and the subject’s 11 year old home.
For this example, lets assume … the appraiser analyzed the market and accurately determined the depreciation.
Copyright © 2007- 2015 Kinja LLC / Hagar Institute
Cost / Depreciation Indicates
• Review;
• 11 year old home;
• 7% depreciation or
• $71,671 loss of value indicated in the Cost Approach.
Problem• Only $36,000 adjustment
between a new home and the subject’s 11 year old home.
• Contradictory information.
Copyright © 2007- 2015 Kinja LLC / Hagar Institute
Catching Inconsistencies In A ReportHere’s How
• If your Cost Approach indicates a reduction in value of 1.52% per year.
• 1.52% per year would also be your condition or age adjustment on the Sales Comparison Approach.
• If the adjustments are not the same, or at least similar, then there is a chance something in your appraisal is wrong.– Not an absolute
• If they are different, then the appraiser needs to explain why?
Copyright © 2007- 2015 Kinja LLC / Hagar Institute
10 years New 5 years
50,000
- 50,000 - 25,000- 0 -
If the subject’s depreciation is $50,000 due to it’s 10 years of age, then your adjustment on the grid would be the same between the subject and new construction.
Copyright © 2007- 2015 Kinja LLC / Hagar Institute
10 years New 5 years
50,000
- 50,000 - 25,000- 0 -
If the subject’s depreciation is $50,000 due to it’s 10 years of age, then your adjustment on the grid would be the same between the subject and new construction.C or age adj.
C4 C4 C1 C3
The UAD Way
Copyright 2000-2015 Richard Hagar, SRA 7
Copyright © 2007- 2015 Kinja LLC / Hagar Institute
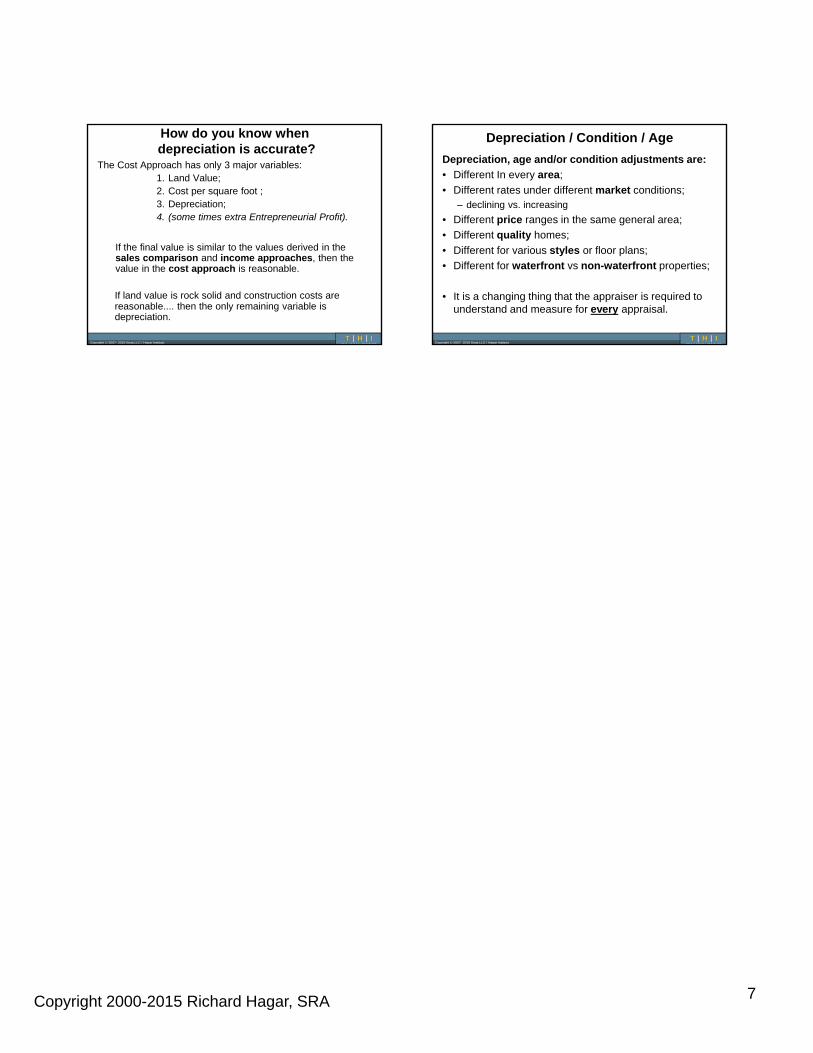
How do you know whendepreciation is accurate?
The Cost Approach has only 3 major variables:1. Land Value;2. Cost per square foot ;3. Depreciation;4. (some times extra Entrepreneurial Profit).
If the final value is similar to the values derived in the sales comparison and income approaches, then the value in the cost approach is reasonable.
If land value is rock solid and construction costs are reasonable.... then the only remaining variable is depreciation.
Copyright © 2007- 2015 Kinja LLC / Hagar Institute
Depreciation / Condition / Age
Depreciation, age and/or condition adjustments are:
• Different In every area;
• Different rates under different market conditions;– declining vs. increasing
• Different price ranges in the same general area;
• Different quality homes;
• Different for various styles or floor plans;
• Different for waterfront vs non-waterfront properties;
• It is a changing thing that the appraiser is required to understand and measure for every appraisal.
Copyright 2000-2015 Richard Hagar, SRA 1
Copyright © 2007- 2015 Kinja LLC / Hagar Institute
Sales Comparison Approach
Copyright © 2007- 2015 Kinja LLC / Hagar Institute
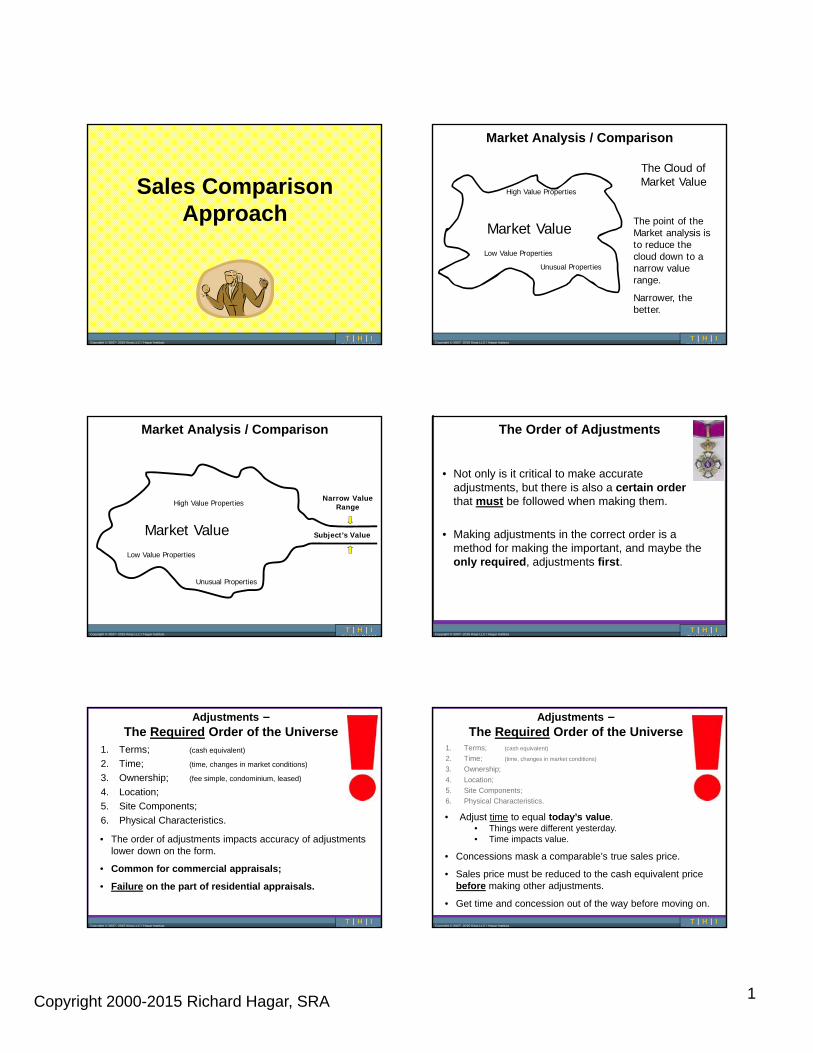
Market Analysis / Comparison
Market Value
High Value Properties
Unusual Properties
Low Value Properties
The Cloud of Market Value
The point of the Market analysis is to reduce the cloud down to a narrow value range.
Narrower, the better.
Copyright © 2007- 2015 Kinja LLC / Hagar Institute
Market Analysis / Comparison
Market Value
High Value Properties
Unusual Properties
Low Value Properties
Narrow Value Range
Subject’s Value
Copyright © 2007- 2015 Kinja LLC / Hagar Institute
The Order of Adjustments
• Not only is it critical to make accurate adjustments, but there is also a certain order that must be followed when making them.
• Making adjustments in the correct order is a method for making the important, and maybe the only required, adjustments first.
Copyright © 2007- 2015 Kinja LLC / Hagar Institute
Adjustments –The Required Order of the Universe
1. Terms; (cash equivalent)
2. Time; (time, changes in market conditions)
3. Ownership; (fee simple, condominium, leased)
4. Location;
5. Site Components;
6. Physical Characteristics.
• The order of adjustments impacts accuracy of adjustments lower down on the form.
• Common for commercial appraisals;
• Failure on the part of residential appraisals.
Copyright © 2007- 2015 Kinja LLC / Hagar Institute
Adjustments –The Required Order of the Universe
1. Terms; (cash equivalent)
2. Time; (time, changes in market conditions)
3. Ownership;
4. Location;
5. Site Components;
6. Physical Characteristics.
• Adjust time to equal today’s value.• Things were different yesterday.• Time impacts value.
• Concessions mask a comparable’s true sales price.
• Sales price must be reduced to the cash equivalent price before making other adjustments.
• Get time and concession out of the way before moving on.
Copyright 2000-2015 Richard Hagar, SRA 2
Copyright © 2007- 2015 Kinja LLC / Hagar Institute
Terms
Time
Ownership
Location
Other stuff
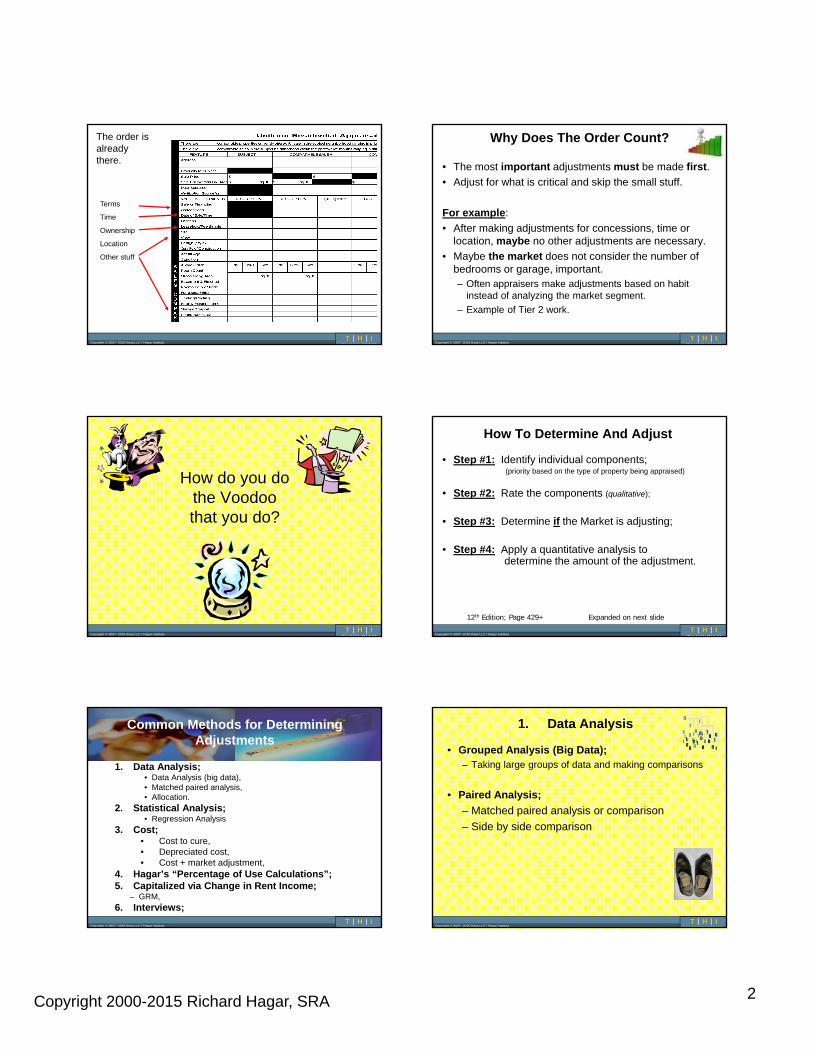
The order is already there.
Copyright © 2007- 2015 Kinja LLC / Hagar Institute
Why Does The Order Count?
• The most important adjustments must be made first.
• Adjust for what is critical and skip the small stuff.
For example:
• After making adjustments for concessions, time or location, maybe no other adjustments are necessary.
• Maybe the market does not consider the number of bedrooms or garage, important.– Often appraisers make adjustments based on habit
instead of analyzing the market segment.
– Example of Tier 2 work.
Copyright © 2007- 2015 Kinja LLC / Hagar Institute
How do you do the Voodoo that you do?
Copyright © 2007- 2015 Kinja LLC / Hagar Institute
How To Determine And Adjust
• Step #1: Identify individual components;(priority based on the type of property being appraised)
• Step #2: Rate the components (qualitative);
• Step #3: Determine if the Market is adjusting;
• Step #4: Apply a quantitative analysis to determine the amount of the adjustment.
12th Edition; Page 429+ Expanded on next slide
Copyright © 2007- 2015 Kinja LLC / Hagar Institute
Common Methods for Determining Adjustments
1. Data Analysis;• Data Analysis (big data),• Matched paired analysis,• Allocation.
2. Statistical Analysis;• Regression Analysis
3. Cost;• Cost to cure,• Depreciated cost,• Cost + market adjustment,
4. Hagar’s “Percentage of Use Calculations”;5. Capitalized via Change in Rent Income;
– GRM,6. Interviews;
Copyright © 2007- 2015 Kinja LLC / Hagar Institute
1. Data Analysis
• Grouped Analysis (Big Data);– Taking large groups of data and making comparisons
• Paired Analysis;
– Matched paired analysis or comparison
– Side by side comparison
Copyright 2000-2015 Richard Hagar, SRA 3
Copyright © 2007- 2015 Kinja LLC / Hagar Institute
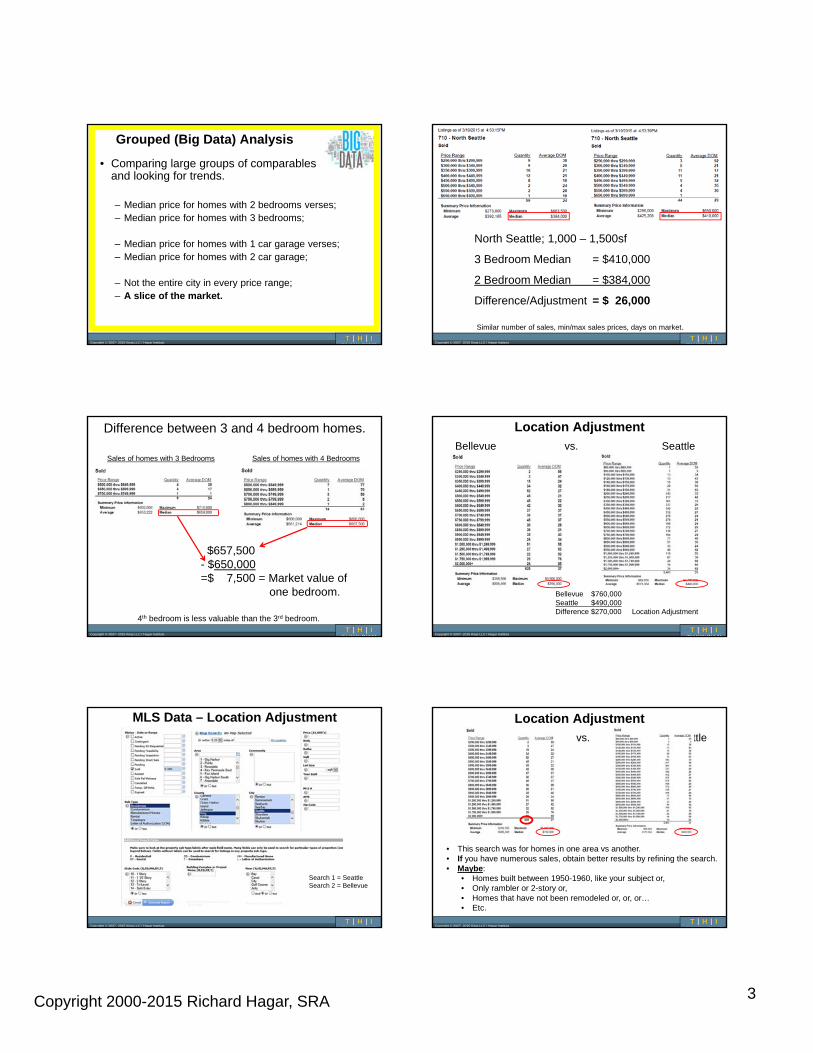
Grouped (Big Data) Analysis
• Comparing large groups of comparables and looking for trends.
– Median price for homes with 2 bedrooms verses;– Median price for homes with 3 bedrooms;
– Median price for homes with 1 car garage verses;– Median price for homes with 2 car garage;
– Not the entire city in every price range;– A slice of the market.
Copyright © 2007- 2015 Kinja LLC / Hagar Institute
North Seattle; 1,000 – 1,500sf
3 Bedroom Median = $410,000
2 Bedroom Median = $384,000
Difference/Adjustment = $ 26,000
Similar number of sales, min/max sales prices, days on market.
Copyright © 2007- 2015 Kinja LLC / Hagar Institute
Difference between 3 and 4 bedroom homes.
Sales of homes with 4 BedroomsSales of homes with 3 Bedrooms
$657,500- $650,000=$ 7,500 = Market value of
one bedroom.
4th bedroom is less valuable than the 3rd bedroom.
Copyright © 2007- 2015 Kinja LLC / Hagar Institute
Location Adjustment
Bellevue vs. Seattle
Bellevue $760,000Seattle $490,000Difference $270,000 Location Adjustment
Copyright © 2007- 2015 Kinja LLC / Hagar Institute
MLS Data – Location Adjustment
Search 1 = SeattleSearch 2 = Bellevue
Copyright © 2007- 2015 Kinja LLC / Hagar Institute
Location Adjustment
Bellevue vs. Seattle
• This search was for homes in one area vs another.• If you have numerous sales, obtain better results by refining the search.• Maybe:
• Homes built between 1950-1960, like your subject or,• Only rambler or 2-story or,• Homes that have not been remodeled or, or, or…• Etc.
Copyright 2000-2015 Richard Hagar, SRA 4
Copyright © 2007- 2015 Kinja LLC / Hagar Institute
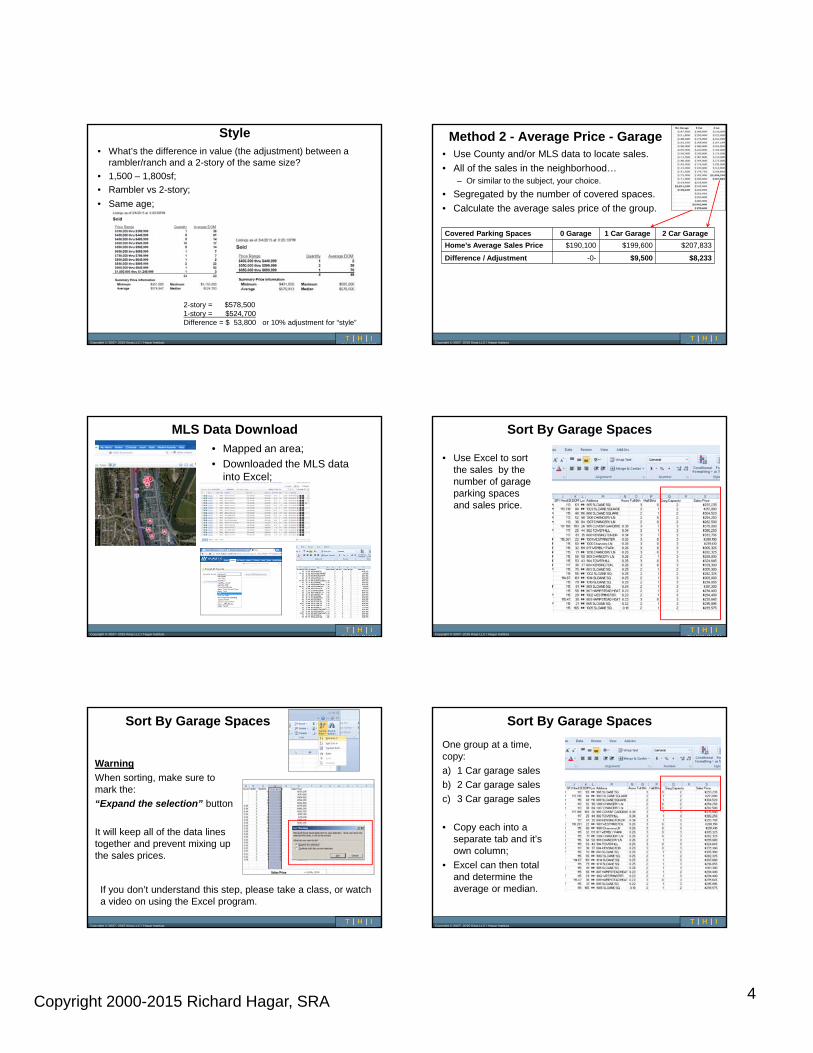
Style• What’s the difference in value (the adjustment) between a
rambler/ranch and a 2-story of the same size?
• 1,500 – 1,800sf;
• Rambler vs 2-story;
• Same age;
2-story = $578,5001-story = $524,700Difference = $ 53,800 or 10% adjustment for “style”
Copyright © 2007- 2015 Kinja LLC / Hagar Institute
Method 2 - Average Price - Garage• Use County and/or MLS data to locate sales.
• All of the sales in the neighborhood…– Or similar to the subject, your choice.
• Segregated by the number of covered spaces.
• Calculate the average sales price of the group.
Covered Parking Spaces 0 Garage 1 Car Garage 2 Car Garage
Home’s Average Sales Price $190,100 $199,600 $207,833
Difference / Adjustment -0- $9,500 $8,233
Copyright © 2007- 2015 Kinja LLC / Hagar Institute
MLS Data Download
• Mapped an area;
• Downloaded the MLS data into Excel;
Copyright © 2007- 2015 Kinja LLC / Hagar Institute
Sort By Garage Spaces
• Use Excel to sort the sales by the number of garage parking spaces and sales price.
Copyright © 2007- 2015 Kinja LLC / Hagar Institute
Sort By Garage Spaces
Warning
When sorting, make sure to mark the:
“Expand the selection” button
It will keep all of the data lines together and prevent mixing up the sales prices.
If you don’t understand this step, please take a class, or watch a video on using the Excel program.
Copyright © 2007- 2015 Kinja LLC / Hagar Institute
Sort By Garage Spaces
One group at a time, copy:
a) 1 Car garage sales
b) 2 Car garage sales
c) 3 Car garage sales
• Copy each into a separate tab and it’s own column;
• Excel can then total and determine the average or median.
Copyright 2000-2015 Richard Hagar, SRA 5
Copyright © 2007- 2015 Kinja LLC / Hagar Institute
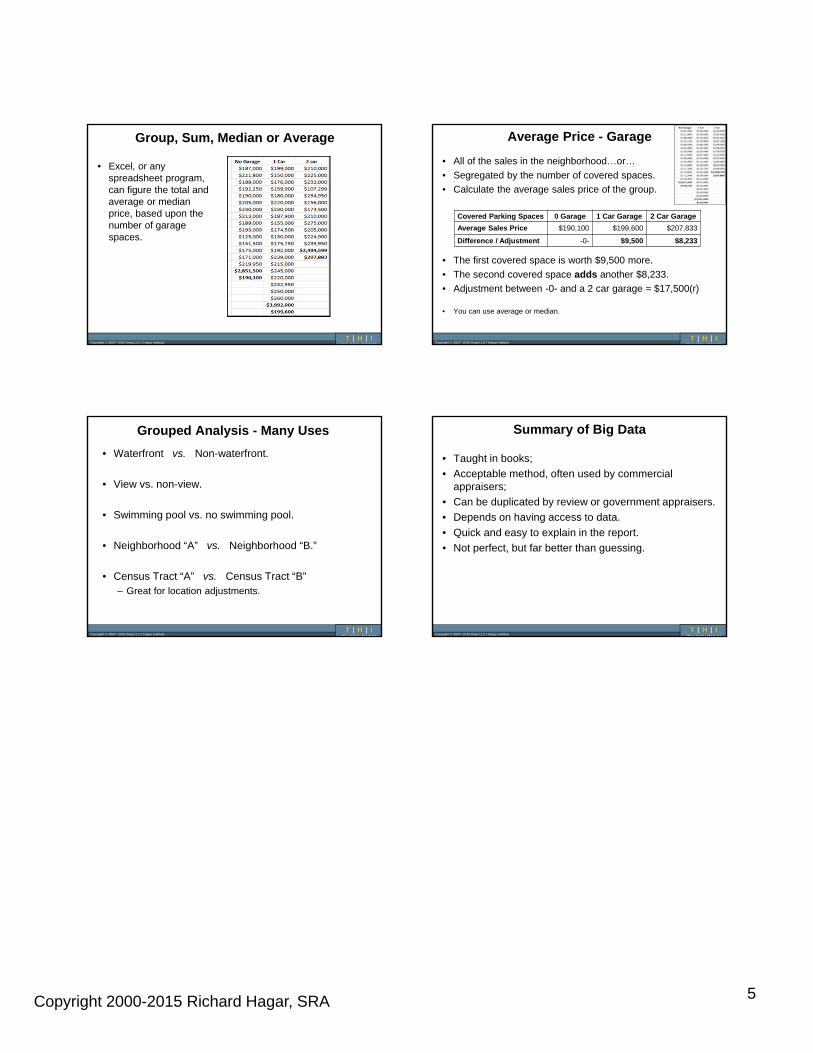
Group, Sum, Median or Average
• Excel, or any spreadsheet program, can figure the total and average or median price, based upon the number of garage spaces.
Copyright © 2007- 2015 Kinja LLC / Hagar Institute
Average Price - Garage
• All of the sales in the neighborhood…or…
• Segregated by the number of covered spaces.
• Calculate the average sales price of the group.
• The first covered space is worth $9,500 more.
• The second covered space adds another $8,233.
• Adjustment between -0- and a 2 car garage = $17,500(r)
• You can use average or median.
Covered Parking Spaces 0 Garage 1 Car Garage 2 Car Garage
Average Sales Price $190,100 $199,600 $207,833
Difference / Adjustment -0- $9,500 $8,233
Copyright © 2007- 2015 Kinja LLC / Hagar Institute
Grouped Analysis - Many Uses
• Waterfront vs. Non-waterfront.
• View vs. non-view.
• Swimming pool vs. no swimming pool.
• Neighborhood “A” vs. Neighborhood “B.”
• Census Tract “A” vs. Census Tract “B”– Great for location adjustments.
Copyright © 2007- 2015 Kinja LLC / Hagar Institute
Summary of Big Data
• Taught in books;
• Acceptable method, often used by commercial appraisers;
• Can be duplicated by review or government appraisers.
• Depends on having access to data.
• Quick and easy to explain in the report.
• Not perfect, but far better than guessing.
Copyright 2000-2015 Richard Hagar, SRA 1
Copyright © 2007- 2015 Kinja LLC / Hagar Institute
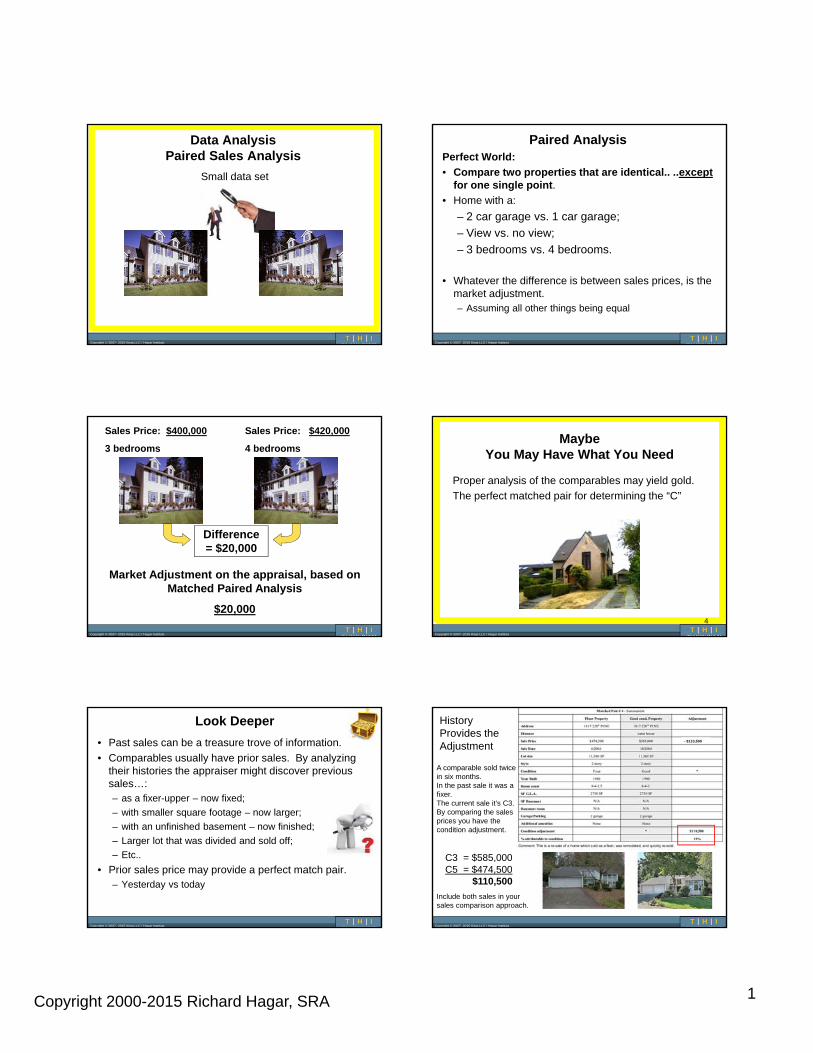
Data AnalysisPaired Sales Analysis
Small data set
Copyright © 2007- 2015 Kinja LLC / Hagar Institute
Paired AnalysisPerfect World:
• Compare two properties that are identical.. ..exceptfor one single point.
• Home with a:
– 2 car garage vs. 1 car garage;
– View vs. no view;
– 3 bedrooms vs. 4 bedrooms.
• Whatever the difference is between sales prices, is the market adjustment.– Assuming all other things being equal
Copyright © 2007- 2015 Kinja LLC / Hagar Institute
Sales Price: $400,000
3 bedrooms
Sales Price: $420,000
4 bedrooms
Difference = $20,000
Market Adjustment on the appraisal, based on Matched Paired Analysis
$20,000
Copyright © 2007- 2015 Kinja LLC / Hagar Institute
MaybeYou May Have What You Need
Proper analysis of the comparables may yield gold.
The perfect matched pair for determining the “C”
4
Copyright © 2007- 2015 Kinja LLC / Hagar Institute
Look Deeper
• Past sales can be a treasure trove of information.
• Comparables usually have prior sales. By analyzing their histories the appraiser might discover previous sales…:– as a fixer-upper – now fixed;
– with smaller square footage – now larger;
– with an unfinished basement – now finished;
– Larger lot that was divided and sold off;
– Etc..
• Prior sales price may provide a perfect match pair.– Yesterday vs today
Copyright © 2007- 2015 Kinja LLC / Hagar Institute
History Provides the Adjustment
C3 = $585,000C5 = $474,500
$110,500
- $110,500
A comparable sold twice in six months.In the past sale it was a fixer.The current sale it’s C3.By comparing the sales prices you have the condition adjustment.
Include both sales in your sales comparison approach.
Copyright 2000-2015 Richard Hagar, SRA 2
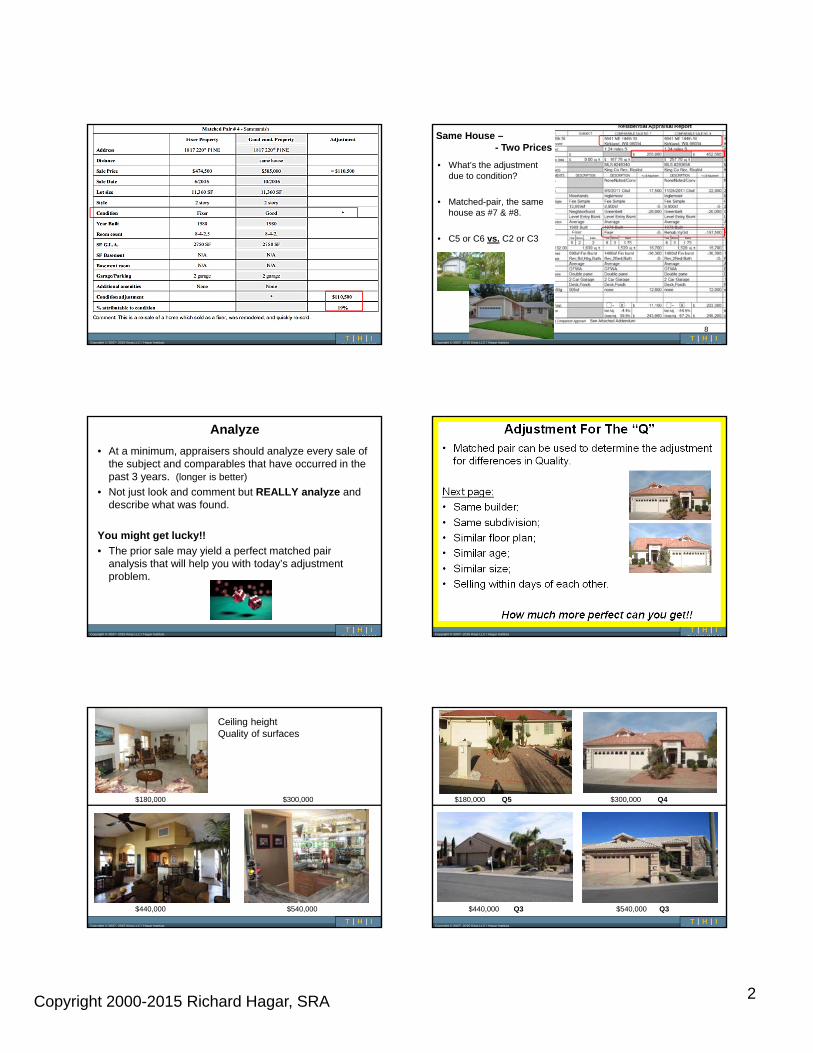
Copyright © 2007- 2015 Kinja LLC / Hagar Institute Copyright © 2007- 2015 Kinja LLC / Hagar Institute
• What’s the adjustment due to condition?
• Matched-pair, the same house as #7 & #8.
• C5 or C6 vs. C2 or C3
Same House –- Two Prices
Fixer
8
Copyright © 2007- 2015 Kinja LLC / Hagar Institute
Analyze
• At a minimum, appraisers should analyze every sale of the subject and comparables that have occurred in the past 3 years. (longer is better)
• Not just look and comment but REALLY analyze and describe what was found.
You might get lucky!!
• The prior sale may yield a perfect matched pair analysis that will help you with today’s adjustment problem.
Copyright © 2007- 2015 Kinja LLC / Hagar Institute
Adjustment For The “Q”
• Matched pair can be used to determine the adjustment for differences in Quality.
Next page:
• Same builder;
• Same subdivision;
• Similar floor plan;
• Similar age;
• Similar size;
• Selling within days of each other.
How much more perfect can you get!!
Copyright © 2007- 2015 Kinja LLC / Hagar Institute
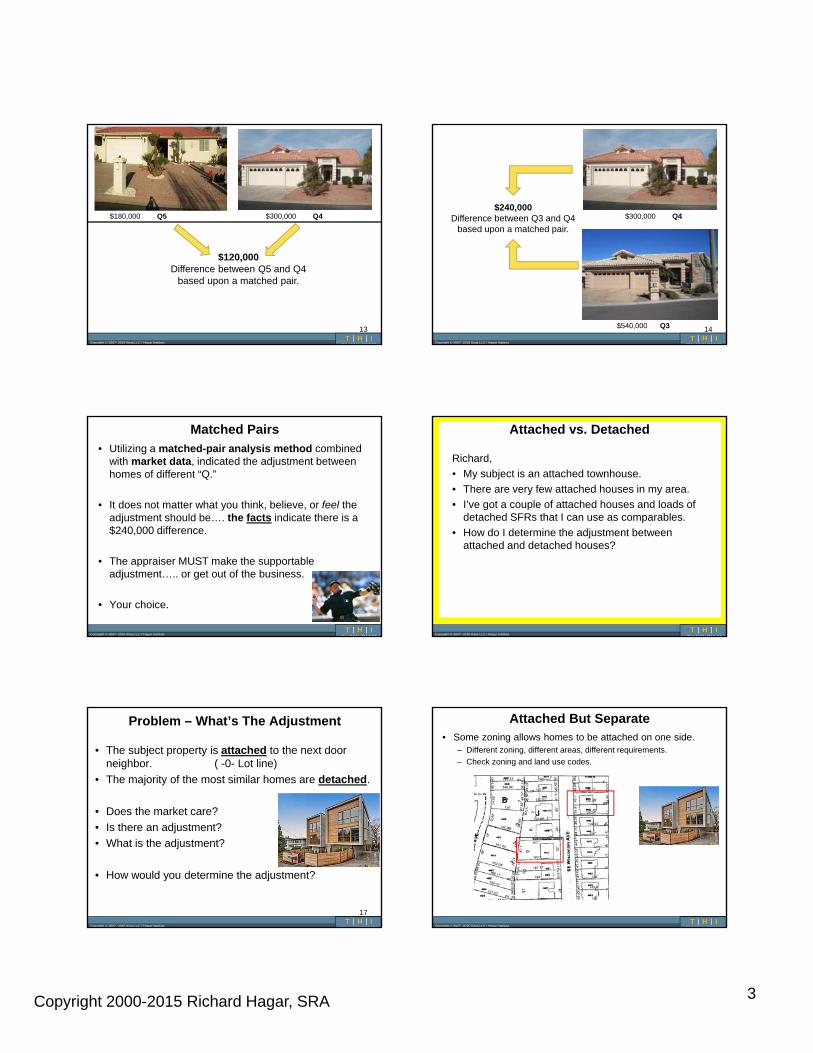
$180,000 $300,000
$440,000 $540,000
Ceiling heightQuality of surfaces
Copyright © 2007- 2015 Kinja LLC / Hagar Institute
$180,000 Q5 $300,000 Q4
$440,000 Q3 $540,000 Q3
Copyright 2000-2015 Richard Hagar, SRA 3
Copyright © 2007- 2015 Kinja LLC / Hagar Institute
$180,000 Q5 $300,000 Q4
$120,000Difference between Q5 and Q4
based upon a matched pair.
13
Copyright © 2007- 2015 Kinja LLC / Hagar Institute
$300,000 Q4
$540,000 Q3 14
$240,000Difference between Q3 and Q4
based upon a matched pair.
Copyright © 2007- 2015 Kinja LLC / Hagar Institute
Matched Pairs
• Utilizing a matched-pair analysis method combined with market data, indicated the adjustment between homes of different “Q.”
• It does not matter what you think, believe, or feel theadjustment should be…. the facts indicate there is a $240,000 difference.
• The appraiser MUST make the supportable adjustment….. or get out of the business.
• Your choice.
Copyright © 2007- 2015 Kinja LLC / Hagar Institute
Attached vs. Detached
Richard,
• My subject is an attached townhouse.
• There are very few attached houses in my area.
• I’ve got a couple of attached houses and loads of detached SFRs that I can use as comparables.
• How do I determine the adjustment between attached and detached houses?
Copyright © 2007- 2015 Kinja LLC / Hagar Institute
Problem – What’s The Adjustment
• The subject property is attached to the next door neighbor. ( -0- Lot line)
• The majority of the most similar homes are detached.
• Does the market care?
• Is there an adjustment?
• What is the adjustment?
• How would you determine the adjustment?
17
Copyright © 2007- 2015 Kinja LLC / Hagar Institute
Attached But Separate• Some zoning allows homes to be attached on one side.
– Different zoning, different areas, different requirements.
– Check zoning and land use codes.

Copyright 2000-2015 Richard Hagar, SRA 4
Copyright © 2007- 2015 Kinja LLC / Hagar Institute
Other than attachment:• Similar site size;• Same general design;• Same materials;• Same interior look, feel, materials, Q rating;• Similar selling date;• What is the adjustment between attached & detached?
Comparable #1Detached
SubjectAttached
Two side by side unitsEach on their own SFR site
Copyright © 2007- 2015 Kinja LLC / Hagar Institute
One Way – Matched Pair – Land Value
• Check the purchase price of the land, no matter how far back in time (assuming both sites sold at about the same time).
• What is the difference between the two?
• Site for the detached home = $375,000• Site for the attached townhouse = $315,000 (per site)
Difference = $ 60,000 (20%)
• The adjustment on the appraisal between an attached and detached house is $60,000 or 20%.
• $2,000,000 price range
20
Ignore the house. Look at the lowest common dominator….the land.
Copyright © 2007- 2015 Kinja LLC / Hagar Institute
What If Land Sales Are Not Available?
• What if the land sales were at different times and one was part of a subdivision and the other an individual site sale?
• Tough to make a direct comparison.
Now what? Well….
• Look for matched pair home sales in the same area.
• But what if there are no attached homes in town or, there are no recent sales of attached homes.
Again, now what?
• Look for a matched pair somewhere else.
• Different subdivision, neighborhood, market area, town, price range, age…. Something, somewhere but don’t guess.
• We got lucky. In a different town, in a different price range, we found a matched pair.
Copyright © 2007- 2015 Kinja LLC / Hagar Institute
Detached vs. Attached
Matched pair analysis
• Same builder (different LLC);• Same plat;• Similar floor plan;• Same SF;• Similar selling date;
• $489,950 vs. $519,950
= $ 30,000 Or 6% (r)
The appraiser searched for other homes built by the same builder as the subject, and found them in a different city.
Copyright © 2007- 2015 Kinja LLC / Hagar Institute
Matched Pairs
• Comparing one property against another is A method for proving adjustments (not the only).
• It’s not perfect and can be influenced by the appraiser.
• Can be use to calculate almost any adjustment.
• It’s better than guessing and if performed correctly:– It is a standardized method;
– Taught in appraisal classes;
– Repeatable by others with the same data;
– You can use it to defend yourself.
Copyright © 2007- 2015 Kinja LLC / Hagar Institute
Matched Pair
View Example
Copyright 2000-2015 Richard Hagar, SRA 5
Copyright © 2007- 2015 Kinja LLC / Hagar Institute
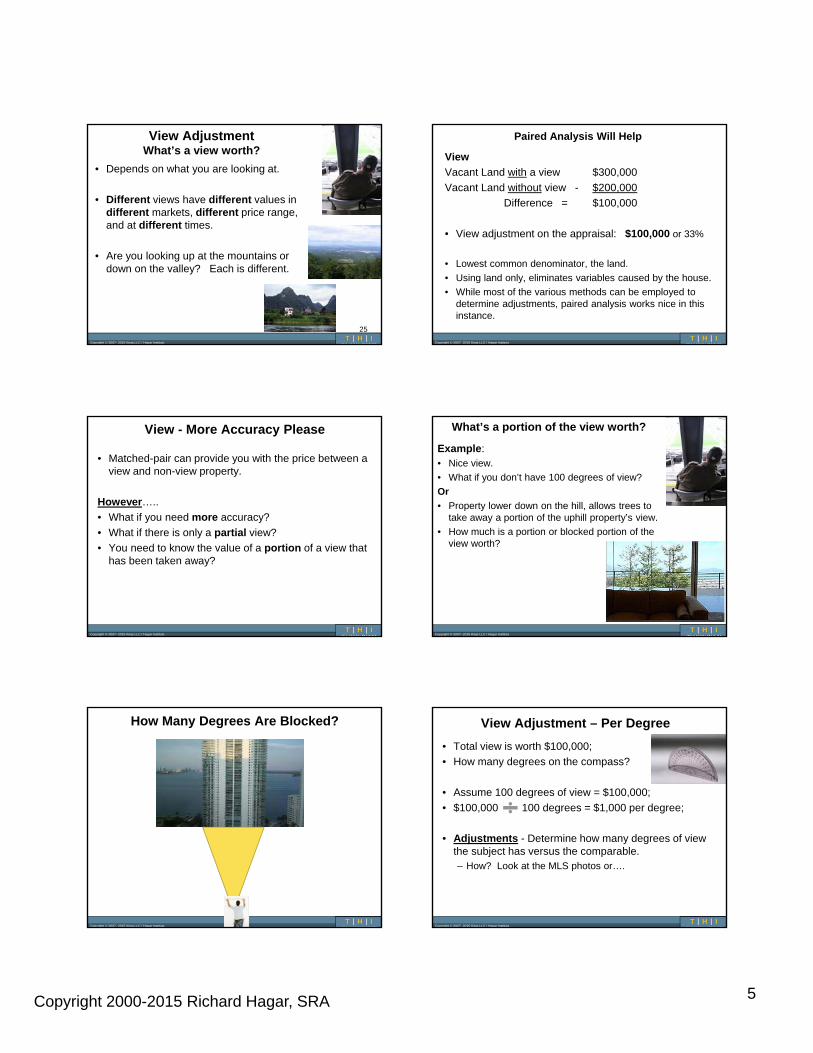
View AdjustmentWhat’s a view worth?
• Depends on what you are looking at.
• Different views have different values in different markets, different price range, and at different times.
• Are you looking up at the mountains or down on the valley? Each is different.
25
Copyright © 2007- 2015 Kinja LLC / Hagar Institute
Paired Analysis Will Help
View
Vacant Land with a view $300,000
Vacant Land without view - $200,000
Difference = $100,000
• View adjustment on the appraisal: $100,000 or 33%
• Lowest common denominator, the land.
• Using land only, eliminates variables caused by the house.
• While most of the various methods can be employed to determine adjustments, paired analysis works nice in this instance.
Copyright © 2007- 2015 Kinja LLC / Hagar Institute
View - More Accuracy Please
• Matched-pair can provide you with the price between a view and non-view property.
However…..
• What if you need more accuracy?
• What if there is only a partial view?
• You need to know the value of a portion of a view that has been taken away?
Copyright © 2007- 2015 Kinja LLC / Hagar Institute
What’s a portion of the view worth?
Example:• Nice view.
• What if you don’t have 100 degrees of view?
Or
• Property lower down on the hill, allows trees to take away a portion of the uphill property’s view.
• How much is a portion or blocked portion of the view worth?
Copyright © 2007- 2015 Kinja LLC / Hagar Institute
How Many Degrees Are Blocked?
Copyright © 2007- 2015 Kinja LLC / Hagar Institute
View Adjustment – Per Degree
• Total view is worth $100,000;
• How many degrees on the compass?
• Assume 100 degrees of view = $100,000;
• $100,000 100 degrees = $1,000 per degree;
• Adjustments - Determine how many degrees of view the subject has versus the comparable.– How? Look at the MLS photos or….
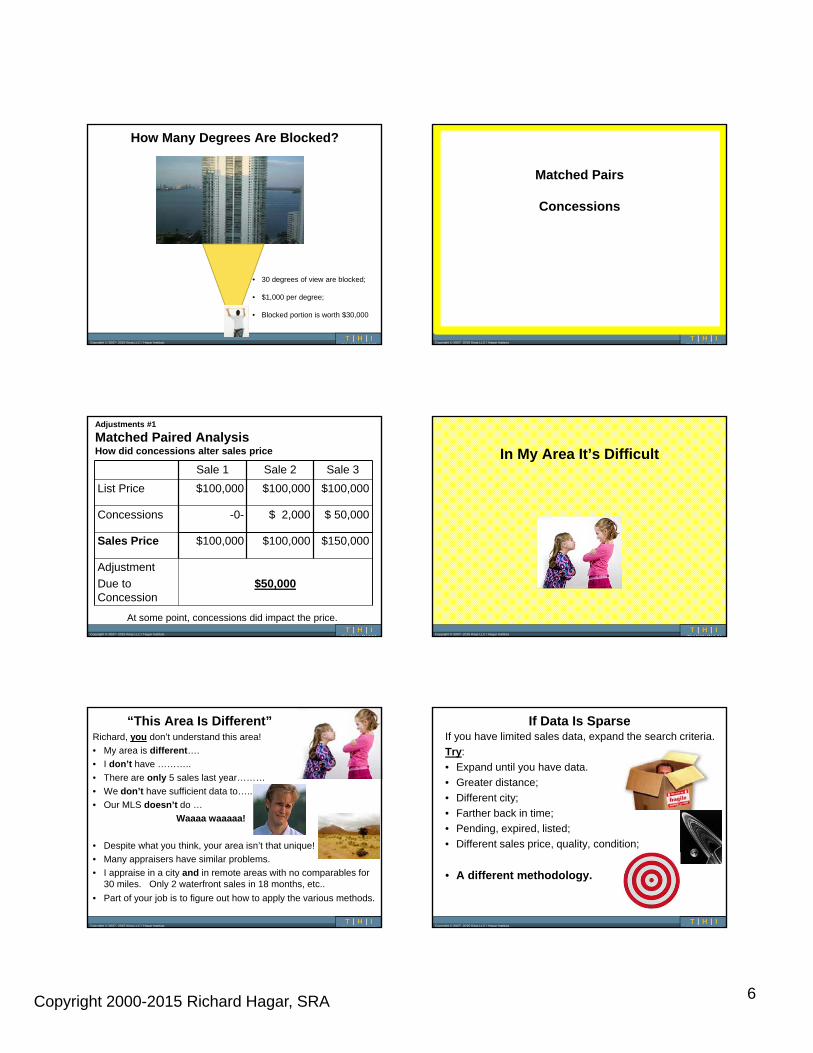
Copyright 2000-2015 Richard Hagar, SRA 6
Copyright © 2007- 2015 Kinja LLC / Hagar Institute
How Many Degrees Are Blocked?
• 30 degrees of view are blocked;
• $1,000 per degree;
• Blocked portion is worth $30,000
Copyright © 2007- 2015 Kinja LLC / Hagar Institute
Matched Pairs
Concessions
Copyright © 2007- 2015 Kinja LLC / Hagar Institute
Adjustments #1
Matched Paired AnalysisHow did concessions alter sales price
Sale 1 Sale 2 Sale 3
List Price $100,000 $100,000 $100,000
Concessions -0- $ 2,000 $ 50,000
Sales Price $100,000 $100,000 $150,000
Adjustment
Due to Concession
$50,000
At some point, concessions did impact the price.
Copyright © 2007- 2015 Kinja LLC / Hagar Institute
In My Area It’s Difficult
Copyright © 2007- 2015 Kinja LLC / Hagar Institute
“This Area Is Different”Richard, you don’t understand this area!
• My area is different….
• I don’t have ………..
• There are only 5 sales last year………
• We don’t have sufficient data to…..
• Our MLS doesn’t do …
Waaaa waaaaa!
• Despite what you think, your area isn’t that unique!
• Many appraisers have similar problems.
• I appraise in a city and in remote areas with no comparables for 30 miles. Only 2 waterfront sales in 18 months, etc..
• Part of your job is to figure out how to apply the various methods.
Copyright © 2007- 2015 Kinja LLC / Hagar Institute
If Data Is SparseIf you have limited sales data, expand the search criteria.
Try:
• Expand until you have data.
• Greater distance;
• Different city;
• Farther back in time;
• Pending, expired, listed;
• Different sales price, quality, condition;
• A different methodology.
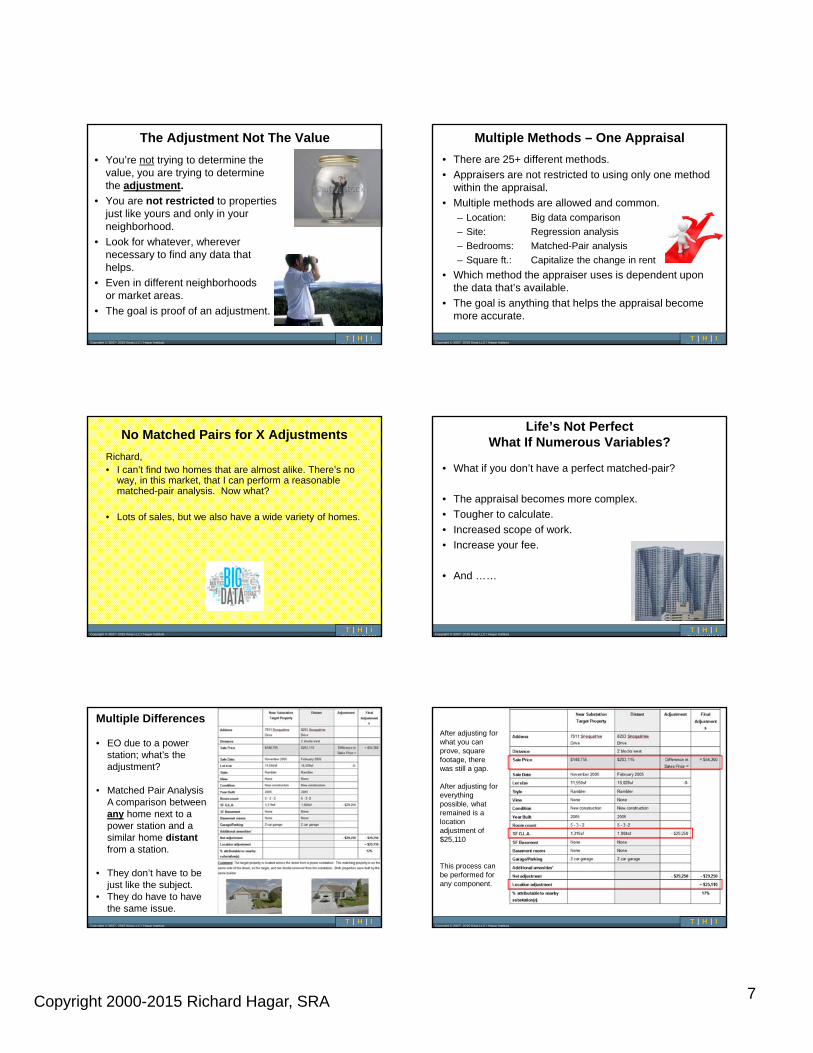
Copyright 2000-2015 Richard Hagar, SRA 7
Copyright © 2007- 2015 Kinja LLC / Hagar Institute
The Adjustment Not The Value
• You’re not trying to determine the value, you are trying to determine the adjustment.
• You are not restricted to properties just like yours and only in your neighborhood.
• Look for whatever, wherever necessary to find any data that helps.
• Even in different neighborhoods or market areas.
• The goal is proof of an adjustment.
Copyright © 2007- 2015 Kinja LLC / Hagar Institute
Multiple Methods – One Appraisal
• There are 25+ different methods.
• Appraisers are not restricted to using only one method within the appraisal.
• Multiple methods are allowed and common.– Location: Big data comparison
– Site: Regression analysis
– Bedrooms: Matched-Pair analysis
– Square ft.: Capitalize the change in rent
• Which method the appraiser uses is dependent upon the data that’s available.
• The goal is anything that helps the appraisal become more accurate.
Copyright © 2007- 2015 Kinja LLC / Hagar Institute
No Matched Pairs for X Adjustments
Richard, • I can’t find two homes that are almost alike. There’s no
way, in this market, that I can perform a reasonable matched-pair analysis. Now what?
• Lots of sales, but we also have a wide variety of homes.
Copyright © 2007- 2015 Kinja LLC / Hagar Institute
Life’s Not PerfectWhat If Numerous Variables?
• What if you don’t have a perfect matched-pair?
• The appraisal becomes more complex.
• Tougher to calculate.
• Increased scope of work.
• Increase your fee.
• And ……
Copyright © 2007- 2015 Kinja LLC / Hagar Institute
Multiple Differences
• EO due to a power station; what’s the adjustment?
• Matched Pair Analysis A comparison between any home next to a power station and a similar home distantfrom a station.
• They don’t have to be just like the subject.
• They do have to have the same issue.
Copyright © 2007- 2015 Kinja LLC / Hagar Institute
After adjusting for what you can prove, square footage, there was still a gap.
After adjusting for everything possible, what remained is a location adjustment of $25,110
This process can be performed for any component.
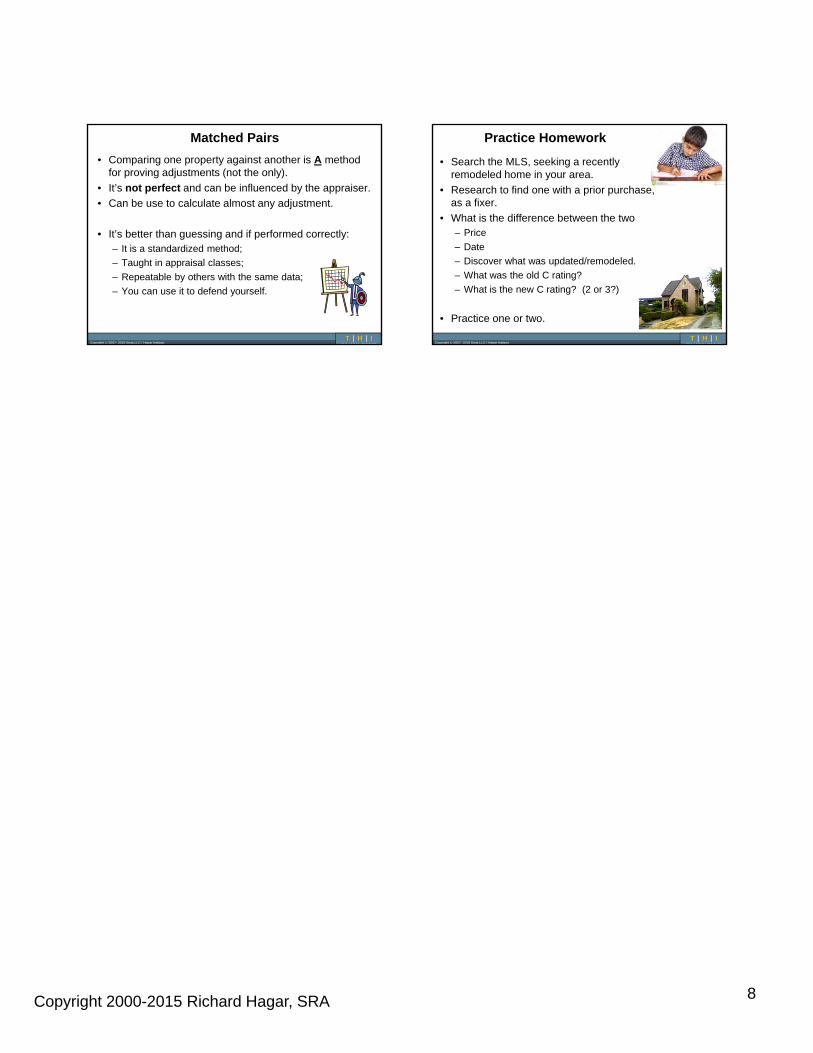
Copyright 2000-2015 Richard Hagar, SRA 8
Copyright © 2007- 2015 Kinja LLC / Hagar Institute
Matched Pairs
• Comparing one property against another is A method for proving adjustments (not the only).
• It’s not perfect and can be influenced by the appraiser.
• Can be use to calculate almost any adjustment.
• It’s better than guessing and if performed correctly:– It is a standardized method;
– Taught in appraisal classes;
– Repeatable by others with the same data;
– You can use it to defend yourself.
Copyright © 2007- 2015 Kinja LLC / Hagar Institute
Practice Homework
• Search the MLS, seeking a recently remodeled home in your area.
• Research to find one with a prior purchase, as a fixer.
• What is the difference between the two– Price
– Date
– Discover what was updated/remodeled.
– What was the old C rating?
– What is the new C rating? (2 or 3?)
• Practice one or two.
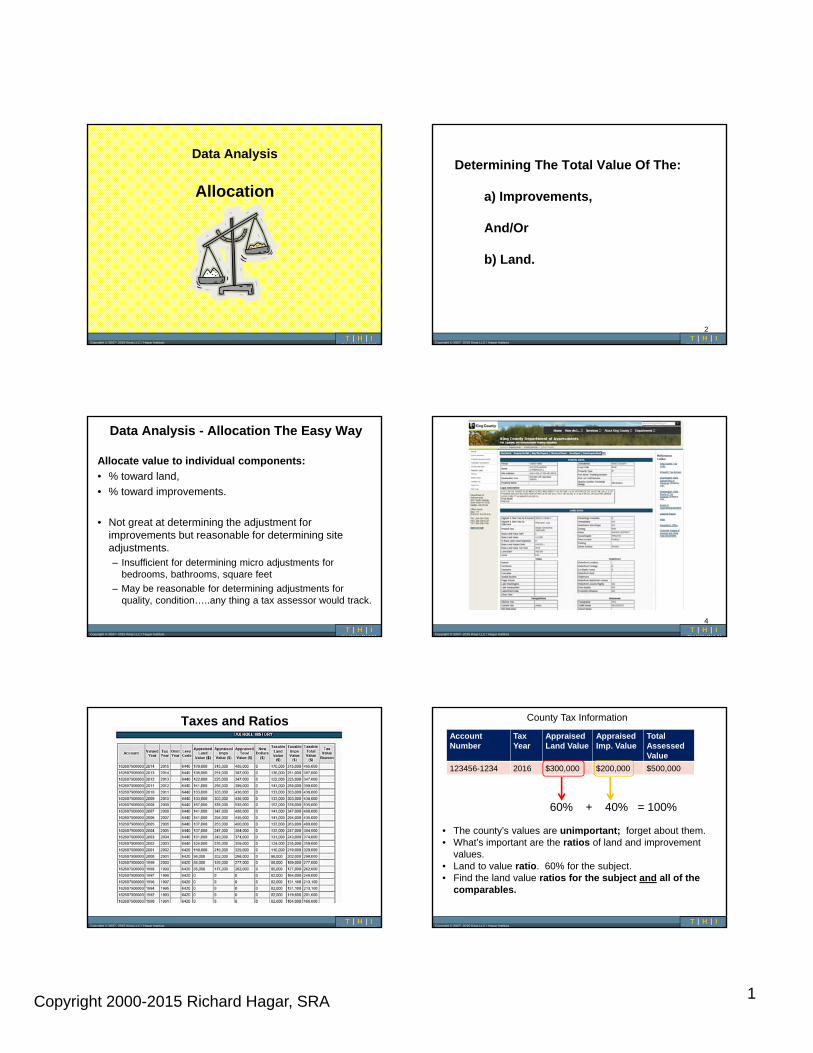
Copyright 2000-2015 Richard Hagar, SRA 1
Copyright © 2007- 2015 Kinja LLC / Hagar Institute
Data Analysis
Allocation
Copyright © 2007- 2015 Kinja LLC / Hagar Institute
Determining The Total Value Of The:
a) Improvements,
And/Or
b) Land.
2
Copyright © 2007- 2015 Kinja LLC / Hagar Institute
Data Analysis - Allocation The Easy Way
Allocate value to individual components:
• % toward land,
• % toward improvements.
• Not great at determining the adjustment for improvements but reasonable for determining site adjustments.– Insufficient for determining micro adjustments for
bedrooms, bathrooms, square feet
– May be reasonable for determining adjustments for quality, condition…..any thing a tax assessor would track.
Copyright © 2007- 2015 Kinja LLC / Hagar Institute
4
Copyright © 2007- 2015 Kinja LLC / Hagar Institute
Taxes and Ratios
Copyright © 2007- 2015 Kinja LLC / Hagar Institute
Account Number
TaxYear
Appraised Land Value
Appraised Imp. Value
Total Assessed Value
123456-1234 2016 $300,000 $200,000 $500,000
60% + 40% = 100%
County Tax Information
• The county’s values are unimportant; forget about them.• What’s important are the ratios of land and improvement
values.• Land to value ratio. 60% for the subject.• Find the land value ratios for the subject and all of the
comparables.
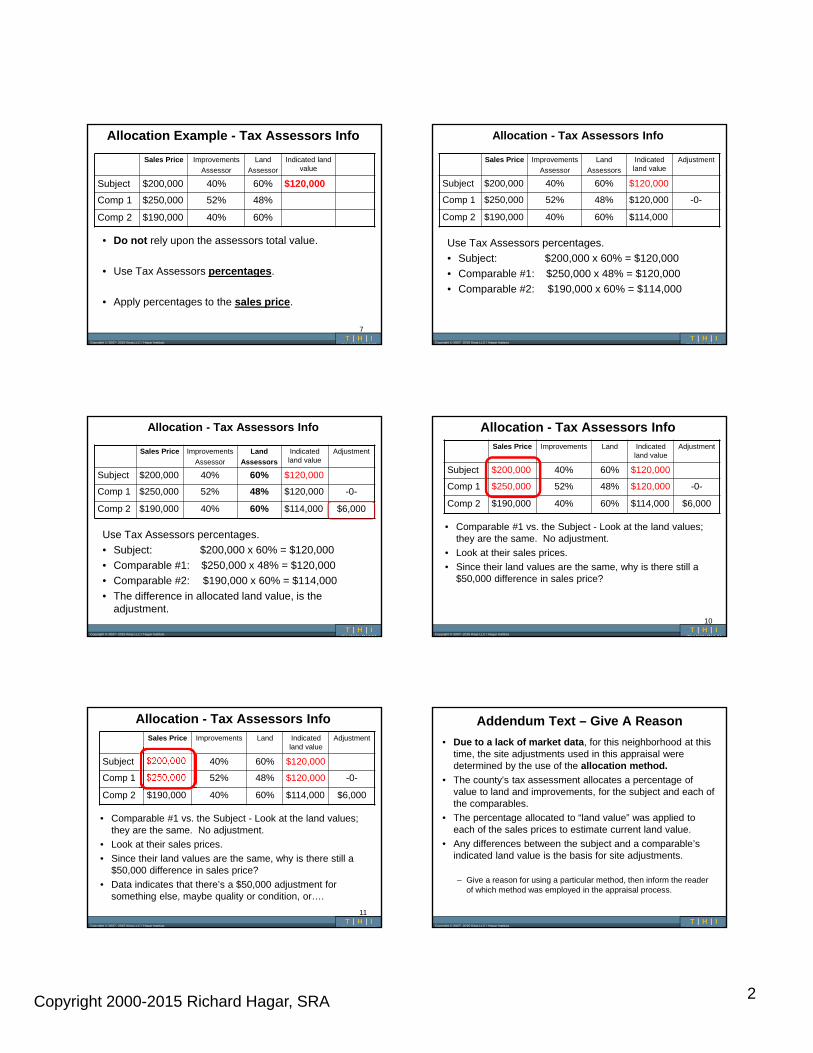
Copyright 2000-2015 Richard Hagar, SRA 2
Copyright © 2007- 2015 Kinja LLC / Hagar Institute
Allocation Example - Tax Assessors Info
• Do not rely upon the assessors total value.
• Use Tax Assessors percentages.
• Apply percentages to the sales price.
Sales Price Improvements
Assessor
Land
Assessor
Indicated land value
Subject $200,000 40% 60% $120,000
Comp 1 $250,000 52% 48%
Comp 2 $190,000 40% 60%
7
Copyright © 2007- 2015 Kinja LLC / Hagar Institute
Allocation - Tax Assessors Info
Use Tax Assessors percentages.
• Subject: $200,000 x 60% = $120,000
• Comparable #1: $250,000 x 48% = $120,000
• Comparable #2: $190,000 x 60% = $114,000
Sales Price Improvements
Assessor
Land
Assessors
Indicated land value
Adjustment
Subject $200,000 40% 60% $120,000
Comp 1 $250,000 52% 48% $120,000 -0-
Comp 2 $190,000 40% 60% $114,000
Copyright © 2007- 2015 Kinja LLC / Hagar Institute
Allocation - Tax Assessors Info
Use Tax Assessors percentages.
• Subject: $200,000 x 60% = $120,000
• Comparable #1: $250,000 x 48% = $120,000
• Comparable #2: $190,000 x 60% = $114,000
• The difference in allocated land value, is the adjustment.
Sales Price Improvements
Assessor
Land
Assessors
Indicated land value
Adjustment
Subject $200,000 40% 60% $120,000
Comp 1 $250,000 52% 48% $120,000 -0-
Comp 2 $190,000 40% 60% $114,000 $6,000
Copyright © 2007- 2015 Kinja LLC / Hagar Institute
Allocation - Tax Assessors Info
• Comparable #1 vs. the Subject - Look at the land values; they are the same. No adjustment.
• Look at their sales prices.
• Since their land values are the same, why is there still a $50,000 difference in sales price?
Sales Price Improvements Land Indicated land value
Adjustment
Subject $200,000 40% 60% $120,000
Comp 1 $250,000 52% 48% $120,000 -0-
Comp 2 $190,000 40% 60% $114,000 $6,000
10
Copyright © 2007- 2015 Kinja LLC / Hagar Institute
Allocation - Tax Assessors Info
• Comparable #1 vs. the Subject - Look at the land values; they are the same. No adjustment.
• Look at their sales prices.
• Since their land values are the same, why is there still a $50,000 difference in sales price?
• Data indicates that there’s a $50,000 adjustment for something else, maybe quality or condition, or….
Sales Price Improvements Land Indicated land value
Adjustment
Subject $200,000 40% 60% $120,000
Comp 1 $250,000 52% 48% $120,000 -0-
Comp 2 $190,000 40% 60% $114,000 $6,000
11
Copyright © 2007- 2015 Kinja LLC / Hagar Institute
Addendum Text – Give A Reason
• Due to a lack of market data, for this neighborhood at this time, the site adjustments used in this appraisal were determined by the use of the allocation method.
• The county’s tax assessment allocates a percentage of value to land and improvements, for the subject and each of the comparables.
• The percentage allocated to “land value” was applied to each of the sales prices to estimate current land value.
• Any differences between the subject and a comparable’s indicated land value is the basis for site adjustments.
– Give a reason for using a particular method, then inform the reader of which method was employed in the appraisal process.
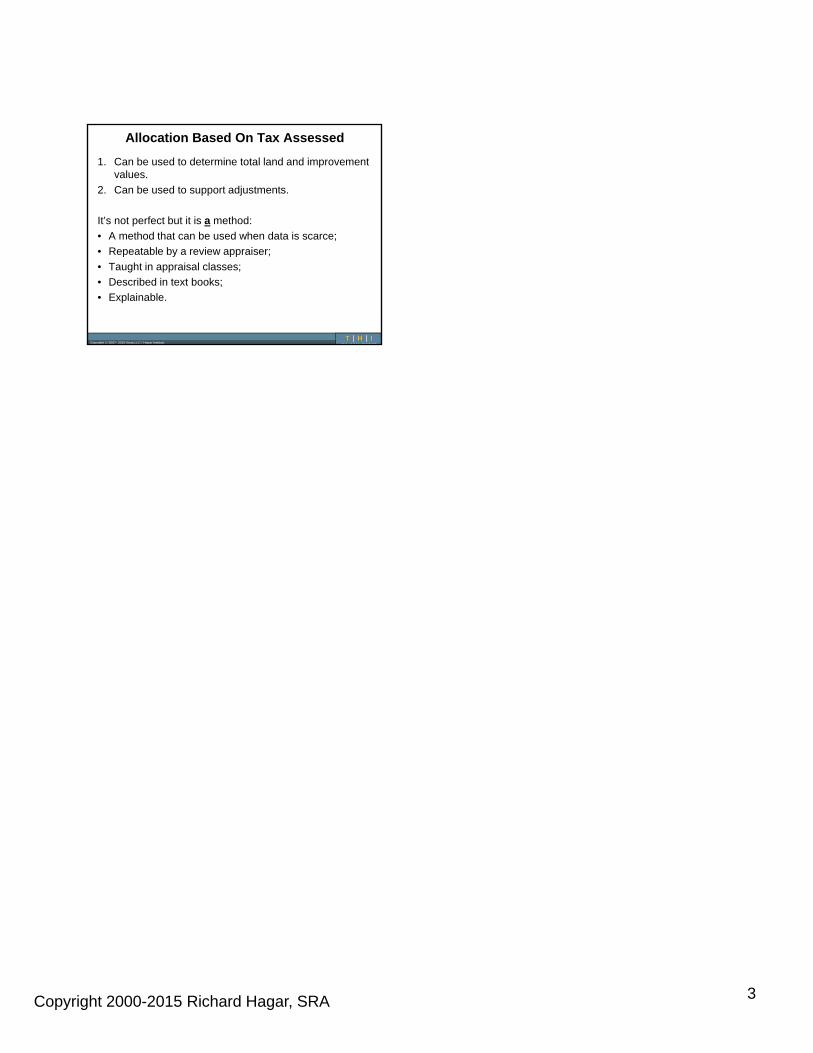
Copyright 2000-2015 Richard Hagar, SRA 3
Copyright © 2007- 2015 Kinja LLC / Hagar Institute
Allocation Based On Tax Assessed
1. Can be used to determine total land and improvement values.
2. Can be used to support adjustments.
It’s not perfect but it is a method:
• A method that can be used when data is scarce;
• Repeatable by a review appraiser;
• Taught in appraisal classes;
• Described in text books;
• Explainable.
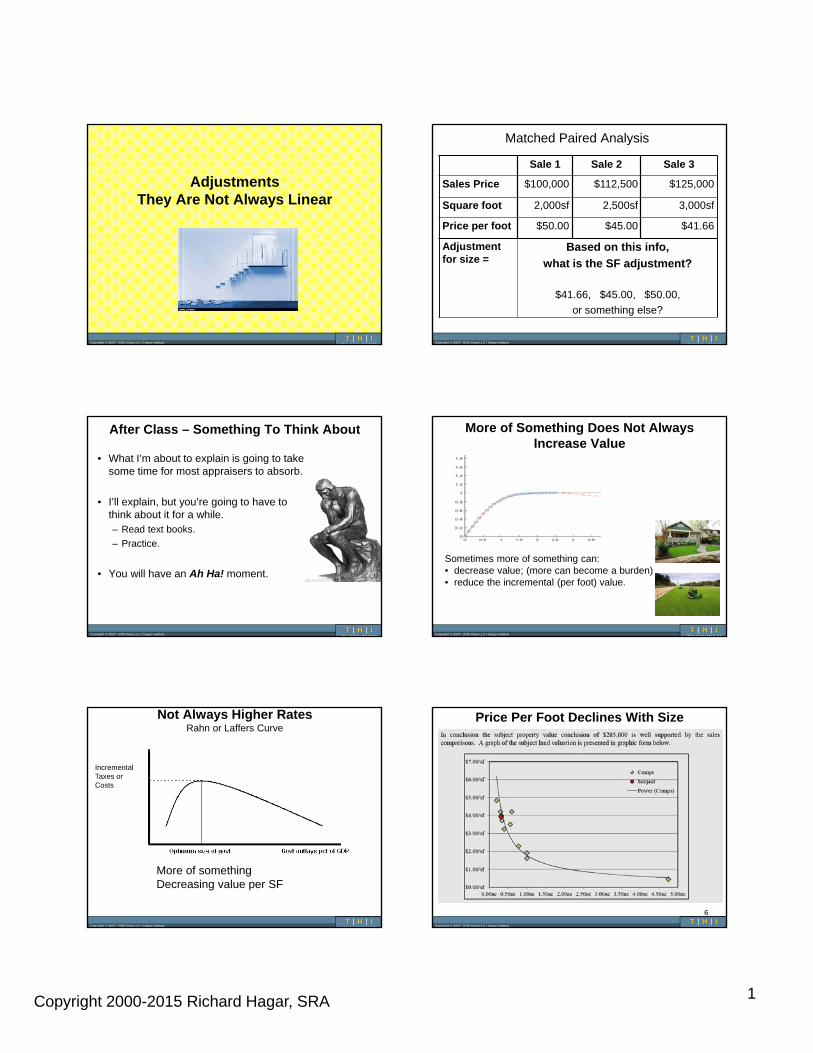
Copyright 2000-2015 Richard Hagar, SRA 1
Copyright © 2007- 2015 Kinja LLC / Hagar Institute
AdjustmentsThey Are Not Always Linear
Copyright © 2007- 2015 Kinja LLC / Hagar Institute
Matched Paired Analysis
Sale 1 Sale 2 Sale 3
Sales Price $100,000 $112,500 $125,000
Square foot 2,000sf 2,500sf 3,000sf
Price per foot $50.00 $45.00 $41.66
Adjustment for size =
Based on this info,
what is the SF adjustment?
$41.66, $45.00, $50.00,
or something else?
Copyright © 2007- 2015 Kinja LLC / Hagar Institute
After Class – Something To Think About
• What I’m about to explain is going to take some time for most appraisers to absorb.
• I’ll explain, but you’re going to have to think about it for a while.– Read text books.
– Practice.
• You will have an Ah Ha! moment.
Copyright © 2007- 2015 Kinja LLC / Hagar Institute
More of Something Does Not Always Increase Value
Sometimes more of something can:• decrease value; (more can become a burden)• reduce the incremental (per foot) value.
Copyright © 2007- 2015 Kinja LLC / Hagar Institute
Not Always Higher RatesRahn or Laffers Curve
Incremental Taxes or Costs
More of somethingDecreasing value per SF
Copyright © 2007- 2015 Kinja LLC / Hagar Institute
Price Per Foot Declines With Size
6
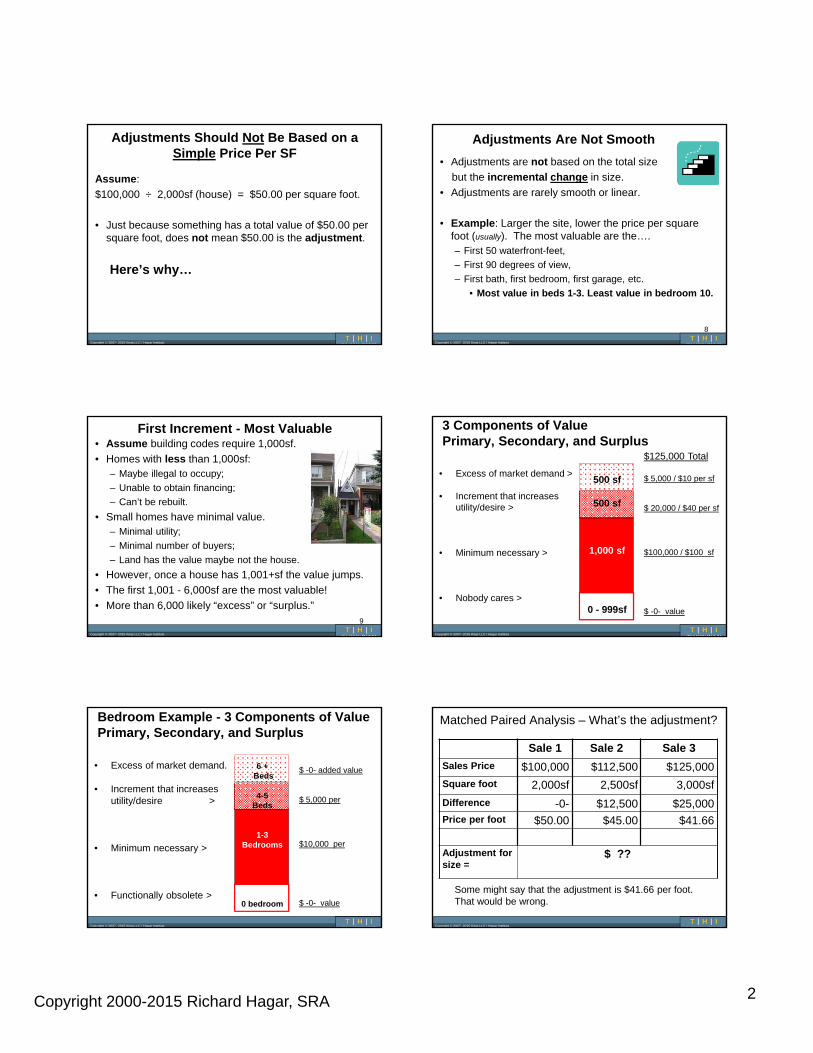
Copyright 2000-2015 Richard Hagar, SRA 2
Copyright © 2007- 2015 Kinja LLC / Hagar Institute
Adjustments Should Not Be Based on a Simple Price Per SF
Assume:
$100,000 ÷ 2,000sf (house) = $50.00 per square foot.
• Just because something has a total value of $50.00 per square foot, does not mean $50.00 is the adjustment.
Here’s why…
Copyright © 2007- 2015 Kinja LLC / Hagar Institute
Adjustments Are Not Smooth
• Adjustments are not based on the total size
but the incremental change in size.
• Adjustments are rarely smooth or linear.
• Example: Larger the site, lower the price per square foot (usually). The most valuable are the….– First 50 waterfront-feet,
– First 90 degrees of view,
– First bath, first bedroom, first garage, etc.
• Most value in beds 1-3. Least value in bedroom 10.
8
Copyright © 2007- 2015 Kinja LLC / Hagar Institute
First Increment - Most Valuable• Assume building codes require 1,000sf.
• Homes with less than 1,000sf:– Maybe illegal to occupy;
– Unable to obtain financing;
– Can’t be rebuilt.
• Small homes have minimal value.– Minimal utility;
– Minimal number of buyers;
– Land has the value maybe not the house.
• However, once a house has 1,001+sf the value jumps.
• The first 1,001 - 6,000sf are the most valuable!
• More than 6,000 likely “excess” or “surplus.”9
Copyright © 2007- 2015 Kinja LLC / Hagar Institute
3 Components of ValuePrimary, Secondary, and Surplus
$ 5,000 / $10 per sf
$ 20,000 / $40 per sf
$100,000 / $100 sf
$ -0- value
$125,000 Total
• Excess of market demand >
• Increment that increases utility/desire >
• Minimum necessary >
• Nobody cares >
500 sf
500 sf
1,000 sf
0 - 999sf
Copyright © 2007- 2015 Kinja LLC / Hagar Institute
Bedroom Example - 3 Components of ValuePrimary, Secondary, and Surplus
$ -0- added value
$ 5,000 per
$10,000 per
$ -0- value
• Excess of market demand.
• Increment that increases utility/desire >
• Minimum necessary >
• Functionally obsolete >
6 +Beds
4-5Beds
1-3Bedrooms
0 bedroom
Copyright © 2007- 2015 Kinja LLC / Hagar Institute
Matched Paired Analysis – What’s the adjustment?
Sale 1 Sale 2 Sale 3
Sales Price $100,000 $112,500 $125,000
Square foot 2,000sf 2,500sf 3,000sf
Difference -0- $12,500 $25,000Price per foot $50.00 $45.00 $41.66
Adjustment for size =
$ ??
Some might say that the adjustment is $41.66 per foot.That would be wrong.
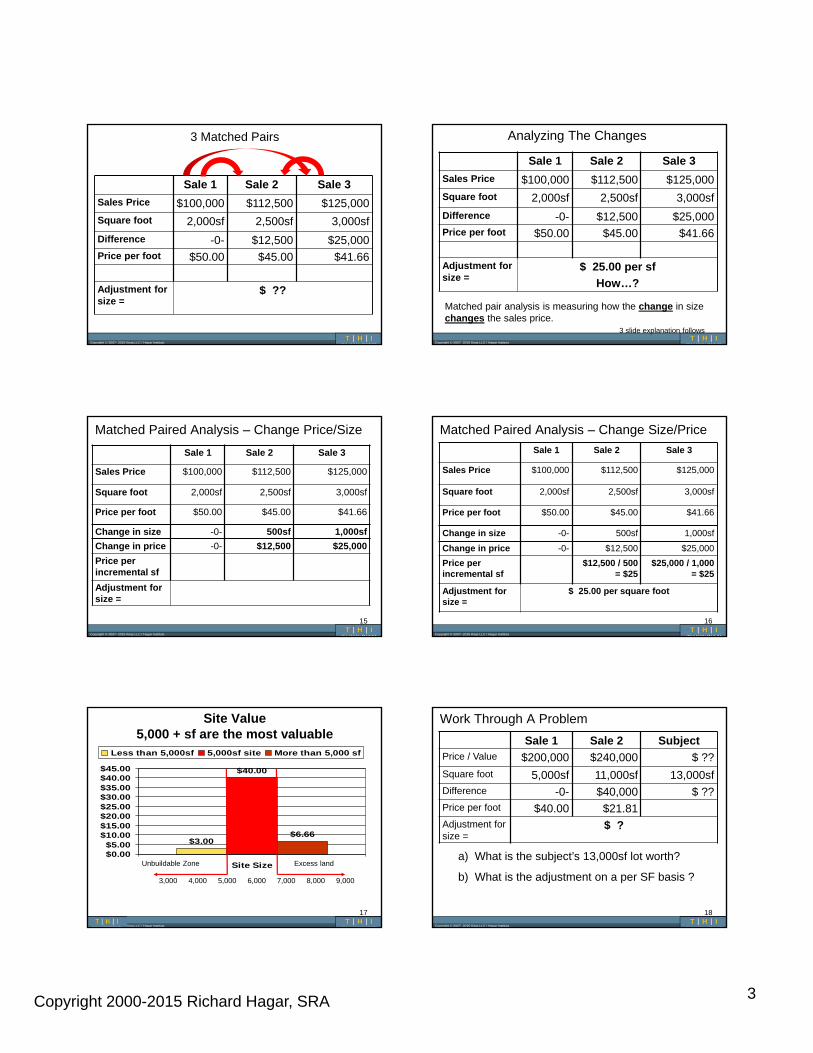
Copyright 2000-2015 Richard Hagar, SRA 3
Copyright © 2007- 2015 Kinja LLC / Hagar Institute
3 Matched Pairs
Sale 1 Sale 2 Sale 3
Sales Price $100,000 $112,500 $125,000
Square foot 2,000sf 2,500sf 3,000sf
Difference -0- $12,500 $25,000Price per foot $50.00 $45.00 $41.66
Adjustment for size =
$ ??
Copyright © 2007- 2015 Kinja LLC / Hagar Institute
Analyzing The Changes
Sale 1 Sale 2 Sale 3
Sales Price $100,000 $112,500 $125,000
Square foot 2,000sf 2,500sf 3,000sf
Difference -0- $12,500 $25,000Price per foot $50.00 $45.00 $41.66
Adjustment for size =
$ 25.00 per sf
How…?
3 slide explanation follows
Matched pair analysis is measuring how the change in size changes the sales price.
Copyright © 2007- 2015 Kinja LLC / Hagar Institute
Matched Paired Analysis – Change Price/Size
Sale 1 Sale 2 Sale 3
Sales Price $100,000 $112,500 $125,000
Square foot 2,000sf 2,500sf 3,000sf
Price per foot $50.00 $45.00 $41.66
Change in size -0- 500sf 1,000sf
Change in price -0- $12,500 $25,000
Price per incremental sf
Adjustment for size =
15
Copyright © 2007- 2015 Kinja LLC / Hagar Institute
Matched Paired Analysis – Change Size/Price
Sale 1 Sale 2 Sale 3
Sales Price $100,000 $112,500 $125,000
Square foot 2,000sf 2,500sf 3,000sf
Price per foot $50.00 $45.00 $41.66
Change in size -0- 500sf 1,000sf
Change in price -0- $12,500 $25,000
Price per incremental sf
$12,500 / 500 = $25
$25,000 / 1,000 = $25
Adjustment for size =
$ 25.00 per square foot
16
Copyright © 2007- 2015 Kinja LLC / Hagar Institute
Site Value5,000 + sf are the most valuable
$3.00
$40.00
$6.66
$0.00$5.00
$10.00$15.00$20.00$25.00$30.00$35.00$40.00$45.00
Site Size
Less than 5,000sf 5,000sf site More than 5,000 sf
3,000 4,000 5,000 6,000 7,000 8,000 9,000
Unbuildable Zone
17
Excess land
Copyright © 2007- 2015 Kinja LLC / Hagar Institute
Work Through A Problem
Sale 1 Sale 2 SubjectPrice / Value $200,000 $240,000 $ ??
Square foot 5,000sf 11,000sf 13,000sfDifference -0- $40,000 $ ??Price per foot $40.00 $21.81Adjustment for size =
$ ?
a) What is the subject’s 13,000sf lot worth?
b) What is the adjustment on a per SF basis ?
18
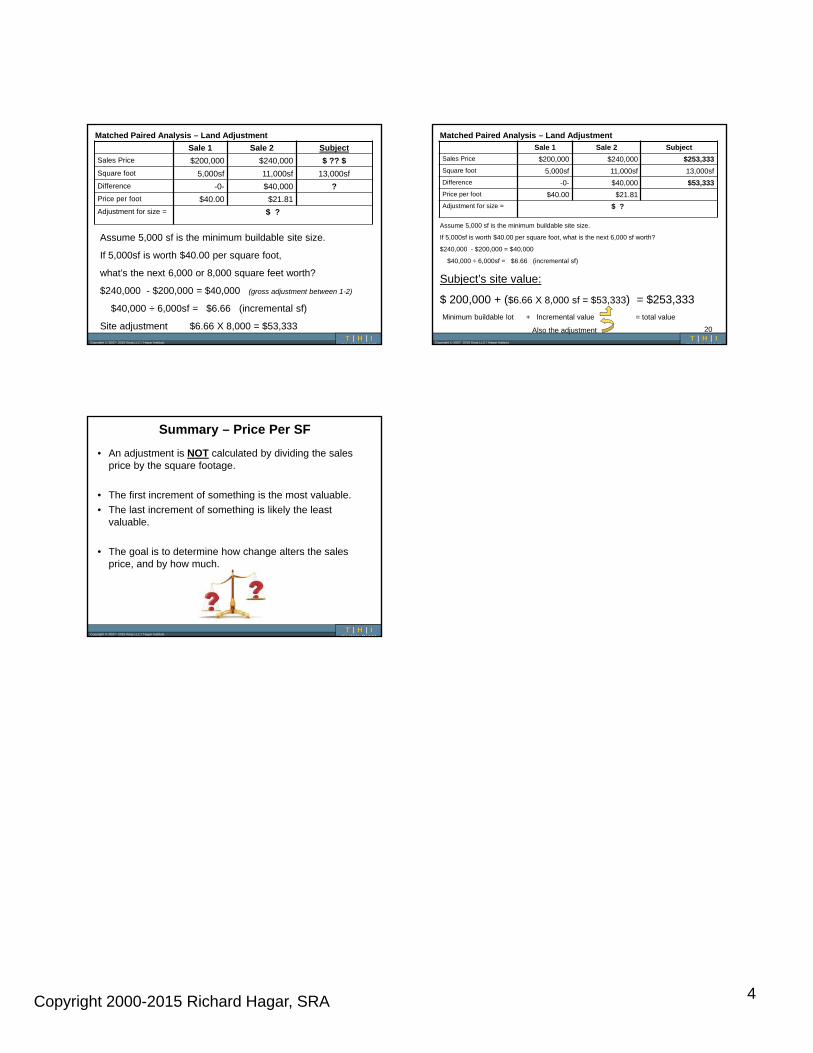
Copyright 2000-2015 Richard Hagar, SRA 4
Copyright © 2007- 2015 Kinja LLC / Hagar Institute
Matched Paired Analysis – Land Adjustment
Sale 1 Sale 2 Subject
Sales Price $200,000 $240,000 $ ?? $
Square foot 5,000sf 11,000sf 13,000sf
Difference -0- $40,000 ?
Price per foot $40.00 $21.81
Adjustment for size = $ ?
Assume 5,000 sf is the minimum buildable site size.
If 5,000sf is worth $40.00 per square foot,
what’s the next 6,000 or 8,000 square feet worth?
$240,000 - $200,000 = $40,000 (gross adjustment between 1-2)
$40,000 ÷ 6,000sf = $6.66 (incremental sf)
Site adjustment $6.66 X 8,000 = $53,333
Copyright © 2007- 2015 Kinja LLC / Hagar Institute
Matched Paired Analysis – Land Adjustment
Sale 1 Sale 2 Subject
Sales Price $200,000 $240,000 $253,333
Square foot 5,000sf 11,000sf 13,000sf
Difference -0- $40,000 $53,333
Price per foot $40.00 $21.81
Adjustment for size = $ ?
Assume 5,000 sf is the minimum buildable site size.
If 5,000sf is worth $40.00 per square foot, what is the next 6,000 sf worth?
$240,000 - $200,000 = $40,000
$40,000 ÷ 6,000sf = $6.66 (incremental sf)
Subject’s site value:
$ 200,000 + ($6.66 X 8,000 sf = $53,333) = $253,333
Minimum buildable lot + Incremental value = total value
Also the adjustment 20
Copyright © 2007- 2015 Kinja LLC / Hagar Institute
Summary – Price Per SF
• An adjustment is NOT calculated by dividing the sales price by the square footage.
• The first increment of something is the most valuable.
• The last increment of something is likely the least valuable.
• The goal is to determine how change alters the sales price, and by how much.
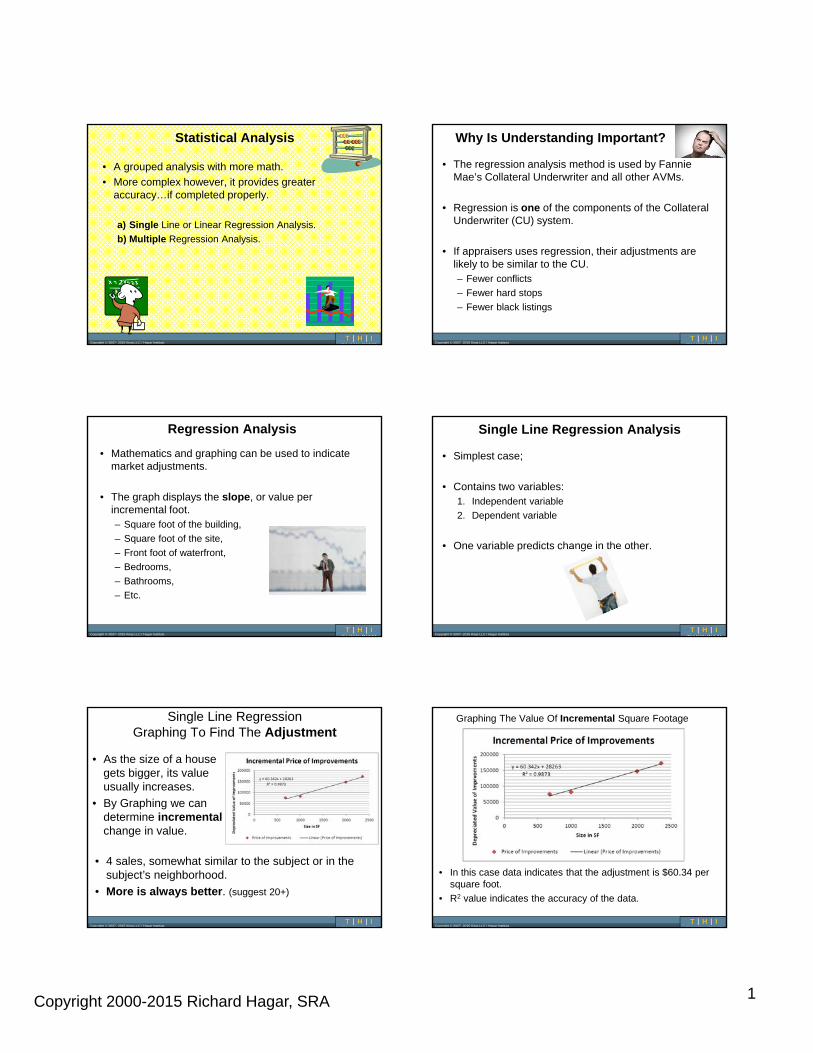
Copyright 2000-2015 Richard Hagar, SRA 1
Copyright © 2007- 2015 Kinja LLC / Hagar Institute
Statistical Analysis
• A grouped analysis with more math.
• More complex however, it provides greater accuracy…if completed properly.
a) Single Line or Linear Regression Analysis.
b) Multiple Regression Analysis.
Copyright © 2007- 2015 Kinja LLC / Hagar Institute
Why Is Understanding Important?
• The regression analysis method is used by Fannie Mae’s Collateral Underwriter and all other AVMs.
• Regression is one of the components of the Collateral Underwriter (CU) system.
• If appraisers uses regression, their adjustments are likely to be similar to the CU.– Fewer conflicts
– Fewer hard stops
– Fewer black listings
Copyright © 2007- 2015 Kinja LLC / Hagar Institute
Regression Analysis
• Mathematics and graphing can be used to indicate market adjustments.
• The graph displays the slope, or value per incremental foot.– Square foot of the building,
– Square foot of the site,
– Front foot of waterfront,
– Bedrooms,
– Bathrooms,
– Etc.
Copyright © 2007- 2015 Kinja LLC / Hagar Institute
Single Line Regression Analysis
• Simplest case;
• Contains two variables:1. Independent variable
2. Dependent variable
• One variable predicts change in the other.
Copyright © 2007- 2015 Kinja LLC / Hagar Institute
Single Line RegressionGraphing To Find The Adjustment
• As the size of a house gets bigger, its value usually increases.
• By Graphing we can determine incrementalchange in value.
• 4 sales, somewhat similar to the subject or in the subject’s neighborhood.
• More is always better. (suggest 20+)
Copyright © 2007- 2015 Kinja LLC / Hagar Institute
Graphing The Value Of Incremental Square Footage
• In this case data indicates that the adjustment is $60.34 per square foot.
• R2 value indicates the accuracy of the data.
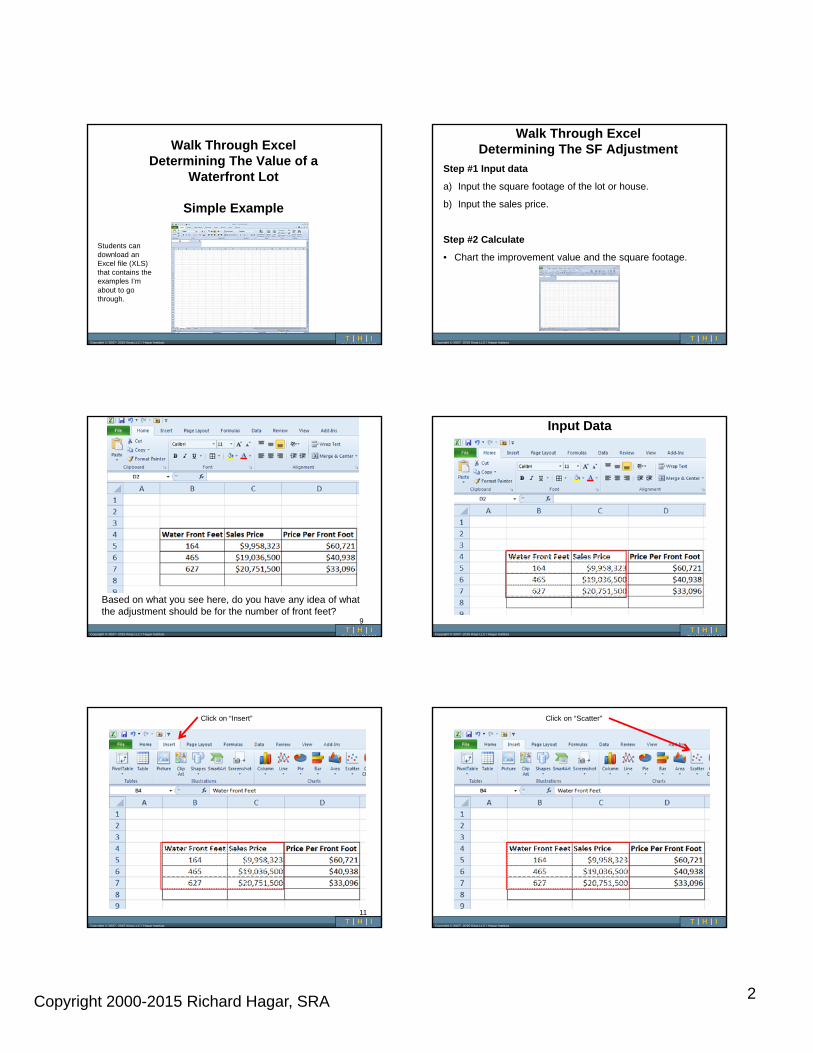
Copyright 2000-2015 Richard Hagar, SRA 2
Copyright © 2007- 2015 Kinja LLC / Hagar Institute
Walk Through ExcelDetermining The Value of a
Waterfront Lot
Simple Example
Students can download an Excel file (XLS) that contains the examples I’m about to go through.
Copyright © 2007- 2015 Kinja LLC / Hagar Institute
Walk Through ExcelDetermining The SF Adjustment
Step #1 Input data
a) Input the square footage of the lot or house.
b) Input the sales price.
Step #2 Calculate
• Chart the improvement value and the square footage.
Copyright © 2007- 2015 Kinja LLC / Hagar Institute
Based on what you see here, do you have any idea of what the adjustment should be for the number of front feet?
9
Copyright © 2007- 2015 Kinja LLC / Hagar Institute
Input Data
Copyright © 2007- 2015 Kinja LLC / Hagar Institute
Click on “Insert”
11
Copyright © 2007- 2015 Kinja LLC / Hagar Institute
Click on “Scatter”
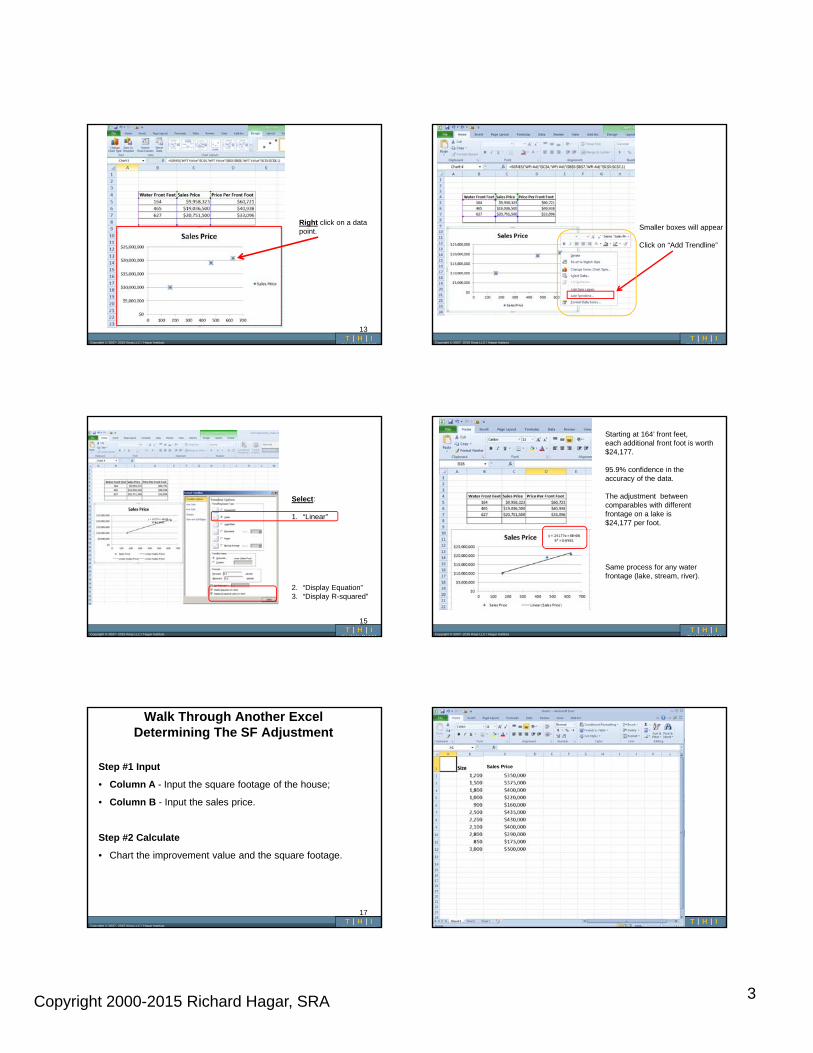
Copyright 2000-2015 Richard Hagar, SRA 3
Copyright © 2007- 2015 Kinja LLC / Hagar Institute
Right click on a data point.
13
Copyright © 2007- 2015 Kinja LLC / Hagar Institute
Smaller boxes will appear
Click on “Add Trendline”
Copyright © 2007- 2015 Kinja LLC / Hagar Institute
Select:
1. “Linear”
2. “Display Equation”3. “Display R-squared”
15
Copyright © 2007- 2015 Kinja LLC / Hagar Institute
Starting at 164’ front feet,each additional front foot is worth $24,177.
95.9% confidence in the accuracy of the data.
The adjustment between comparables with different frontage on a lake is$24,177 per foot.
Same process for any water frontage (lake, stream, river).
Copyright © 2007- 2015 Kinja LLC / Hagar Institute
Walk Through Another ExcelDetermining The SF Adjustment
Step #1 Input
• Column A - Input the square footage of the house;
• Column B - Input the sales price.
Step #2 Calculate
• Chart the improvement value and the square footage.
17
Copyright © 2007- 2015 Kinja LLC / Hagar Institute
Sales Price
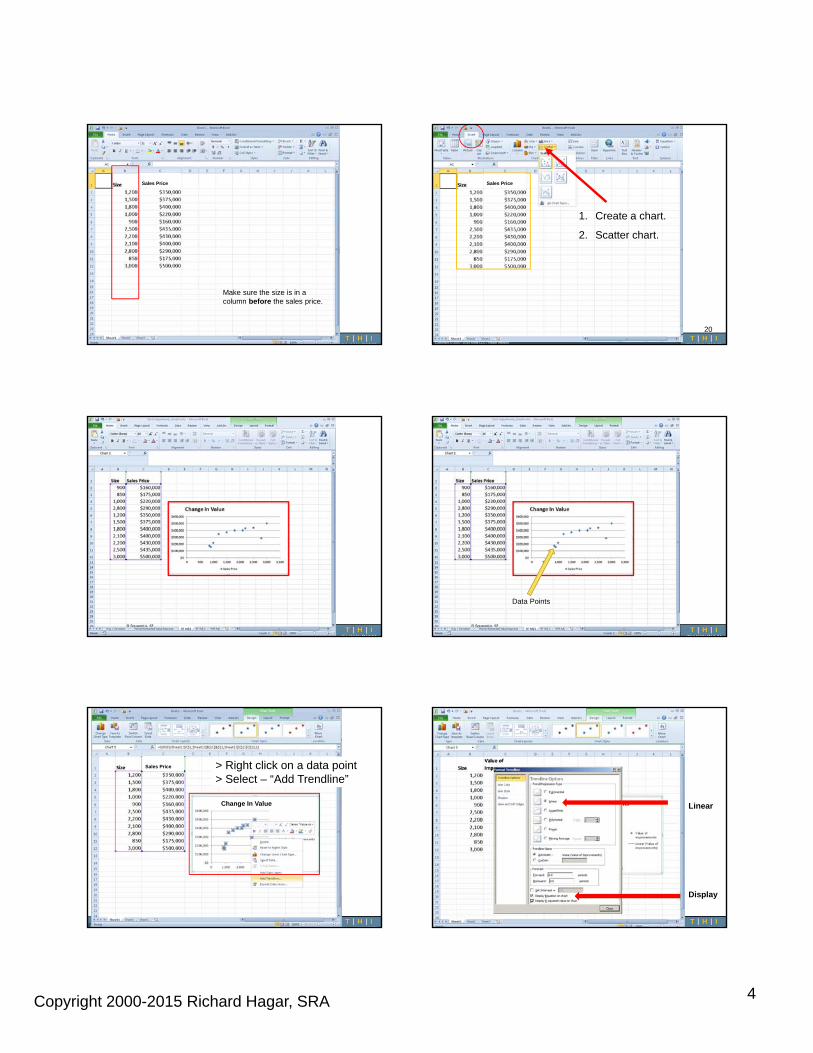
Copyright 2000-2015 Richard Hagar, SRA 4
Copyright © 2007- 2015 Kinja LLC / Hagar Institute
Sales Price
Make sure the size is in a column before the sales price.
Copyright © 2007- 2015 Kinja LLC / Hagar Institute
1. Create a chart.
2. Scatter chart.
Sales Price
20
Copyright © 2007- 2015 Kinja LLC / Hagar Institute Copyright © 2007- 2015 Kinja LLC / Hagar Institute
Data Points
Copyright © 2007- 2015 Kinja LLC / Hagar Institute
> Right click on a data point> Select – “Add Trendline”
Sales Price
Change In Value
Copyright © 2007- 2015 Kinja LLC / Hagar Institute
Linear
Display
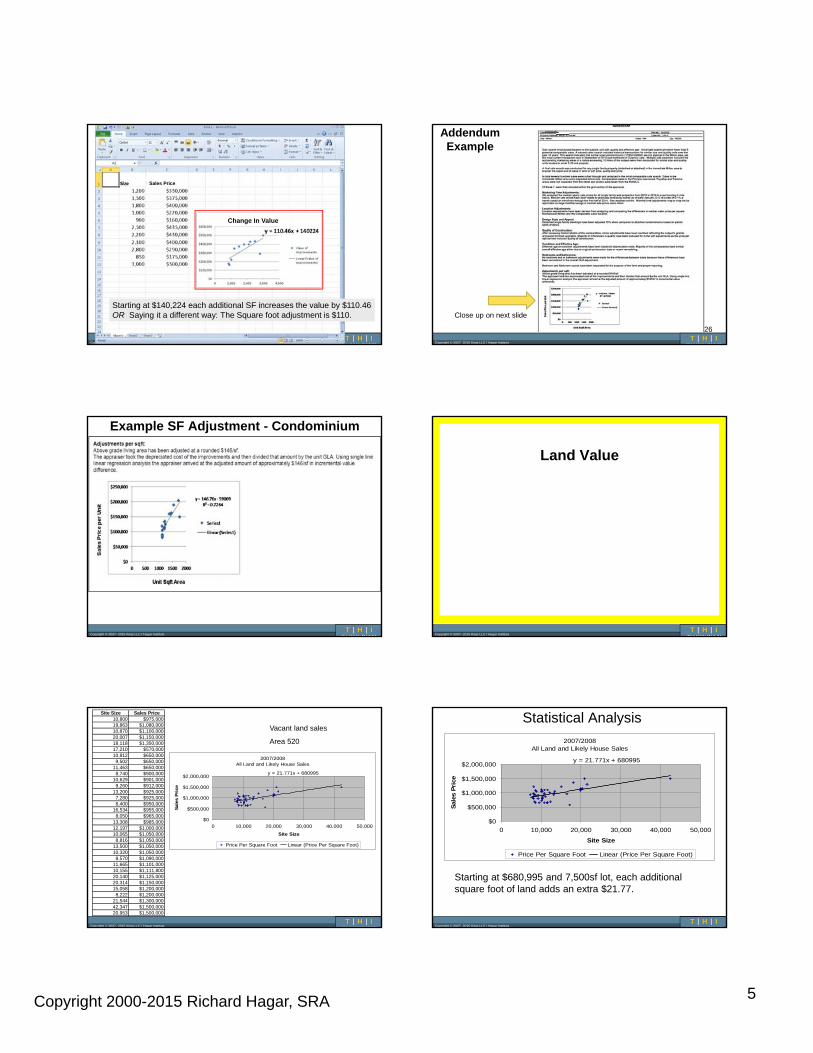
Copyright 2000-2015 Richard Hagar, SRA 5
Copyright © 2007- 2015 Kinja LLC / Hagar Institute
Sales Price
Change In Value
Starting at $140,224 each additional SF increases the value by $110.46 OR Saying it a different way: The Square foot adjustment is $110.
Copyright © 2007- 2015 Kinja LLC / Hagar Institute
Addendum Example
Close up on next slide
26
Copyright © 2007- 2015 Kinja LLC / Hagar Institute
Example SF Adjustment - Condominium
Copyright © 2007- 2015 Kinja LLC / Hagar Institute
Land Value
Copyright © 2007- 2015 Kinja LLC / Hagar Institute
Site Size Sales Price10,800 $975,00019,863 $1,080,00010,870 $1,100,00020,007 $1,150,00018,118 $1,350,00017,210 $570,00010,812 $650,0009,502 $650,000
11,463 $650,0008,740 $900,000
10,629 $901,0009,260 $912,000
13,200 $925,0007,280 $925,0008,400 $950,000
16,534 $955,0008,050 $965,000
13,308 $985,00012,197 $1,000,00010,065 $1,050,0008,816 $1,050,000
13,500 $1,050,00010,320 $1,050,0008,570 $1,090,000
11,665 $1,101,00010,155 $1,111,80020,140 $1,125,00020,314 $1,150,00015,058 $1,200,0008,222 $1,200,000
21,544 $1,300,00042,347 $1,500,00020,953 $1,500,000
2007/2008All Land and Likely House Sales
y = 21.771x + 680995
$0
$500,000
$1,000,000
$1,500,000
$2,000,000
0 10,000 20,000 30,000 40,000 50,000
Site Size
Sal
es P
rice
Price Per Square Foot Linear (Price Per Square Foot)
Vacant land sales
Area 520
Copyright © 2007- 2015 Kinja LLC / Hagar Institute
Statistical Analysis
2007/2008All Land and Likely House Sales
y = 21.771x + 680995
$0
$500,000
$1,000,000
$1,500,000
$2,000,000
0 10,000 20,000 30,000 40,000 50,000
Site Size
Sale
s P
rice
Price Per Square Foot Linear (Price Per Square Foot)
Starting at $680,995 and 7,500sf lot, each additional square foot of land adds an extra $21.77.
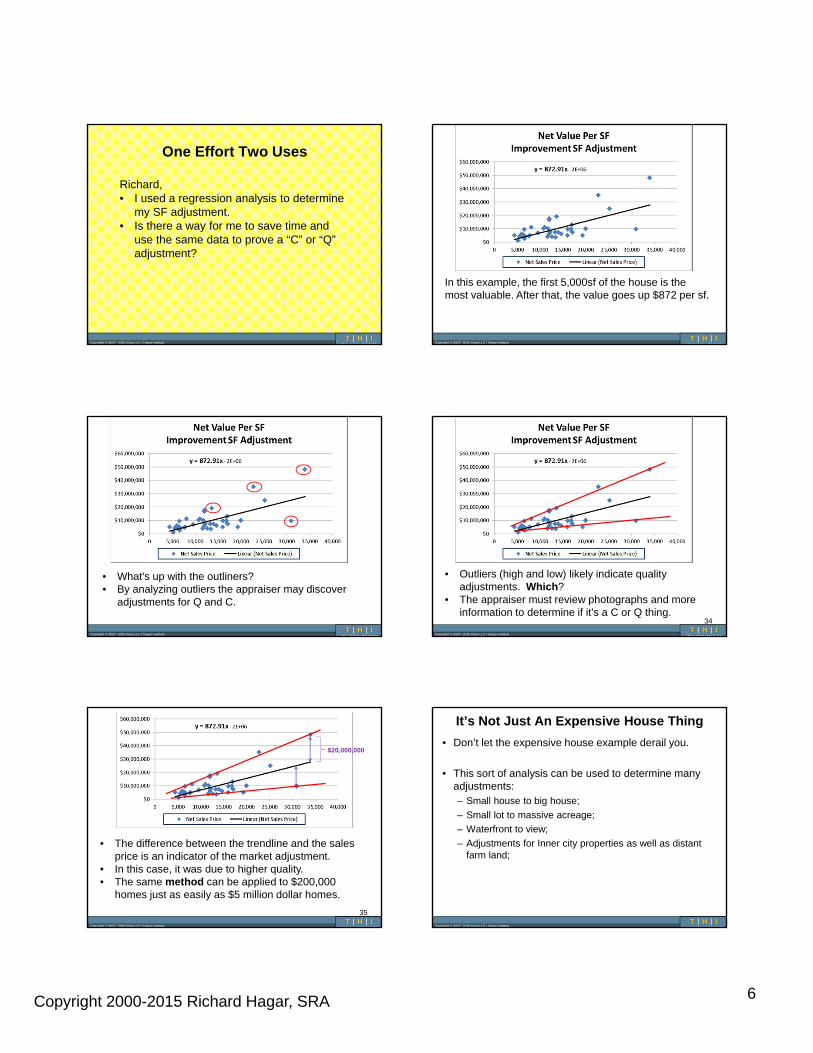
Copyright 2000-2015 Richard Hagar, SRA 6
Copyright © 2007- 2015 Kinja LLC / Hagar Institute
One Effort Two Uses
Richard,• I used a regression analysis to determine
my SF adjustment.• Is there a way for me to save time and
use the same data to prove a “C” or “Q” adjustment?
Copyright © 2007- 2015 Kinja LLC / Hagar Institute
In this example, the first 5,000sf of the house is the most valuable. After that, the value goes up $872 per sf.
Copyright © 2007- 2015 Kinja LLC / Hagar Institute
• What’s up with the outliners?• By analyzing outliers the appraiser may discover
adjustments for Q and C.
Copyright © 2007- 2015 Kinja LLC / Hagar Institute
• Outliers (high and low) likely indicate quality adjustments. Which?
• The appraiser must review photographs and more information to determine if it’s a C or Q thing.
34
Copyright © 2007- 2015 Kinja LLC / Hagar Institute
• The difference between the trendline and the sales price is an indicator of the market adjustment.
• In this case, it was due to higher quality.• The same method can be applied to $200,000
homes just as easily as $5 million dollar homes.
35
$20,000,000
Copyright © 2007- 2015 Kinja LLC / Hagar Institute
It’s Not Just An Expensive House Thing
• Don’t let the expensive house example derail you.
• This sort of analysis can be used to determine many adjustments:– Small house to big house;
– Small lot to massive acreage;
– Waterfront to view;
– Adjustments for Inner city properties as well as distant farm land;
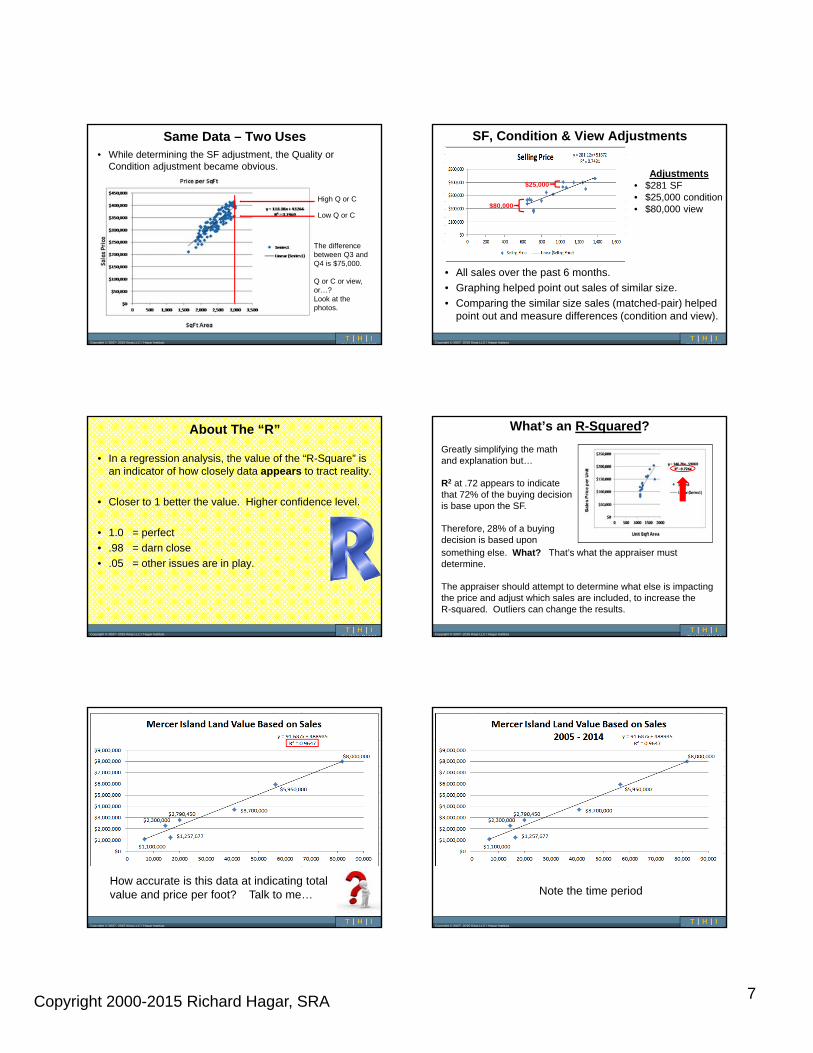
Copyright 2000-2015 Richard Hagar, SRA 7
Copyright © 2007- 2015 Kinja LLC / Hagar Institute
Same Data – Two Uses• While determining the SF adjustment, the Quality or
Condition adjustment became obvious.
High Q or C
Low Q or C
The difference between Q3 and Q4 is $75,000.
Q or C or view, or…?Look at the photos.
Copyright © 2007- 2015 Kinja LLC / Hagar Institute
SF, Condition & View Adjustments
• All sales over the past 6 months.
• Graphing helped point out sales of similar size.
• Comparing the similar size sales (matched-pair) helped point out and measure differences (condition and view).
$80,000
$25,000
Adjustments• $281 SF• $25,000 condition• $80,000 view
Copyright © 2007- 2015 Kinja LLC / Hagar Institute
About The “R”
• In a regression analysis, the value of the “R-Square” is an indicator of how closely data appears to tract reality.
• Closer to 1 better the value. Higher confidence level.
• 1.0 = perfect
• .98 = darn close
• .05 = other issues are in play.
Copyright © 2007- 2015 Kinja LLC / Hagar Institute
What’s an R-Squared?
Greatly simplifying the math and explanation but…
R2 at .72 appears to indicate that 72% of the buying decision is base upon the SF.
Therefore, 28% of a buying decision is based uponsomething else. What? That’s what the appraiser must determine.
The appraiser should attempt to determine what else is impacting the price and adjust which sales are included, to increase the R-squared. Outliers can change the results.
Copyright © 2007- 2015 Kinja LLC / Hagar Institute
How accurate is this data at indicating total value and price per foot? Talk to me…
Copyright © 2007- 2015 Kinja LLC / Hagar Institute
Note the time period
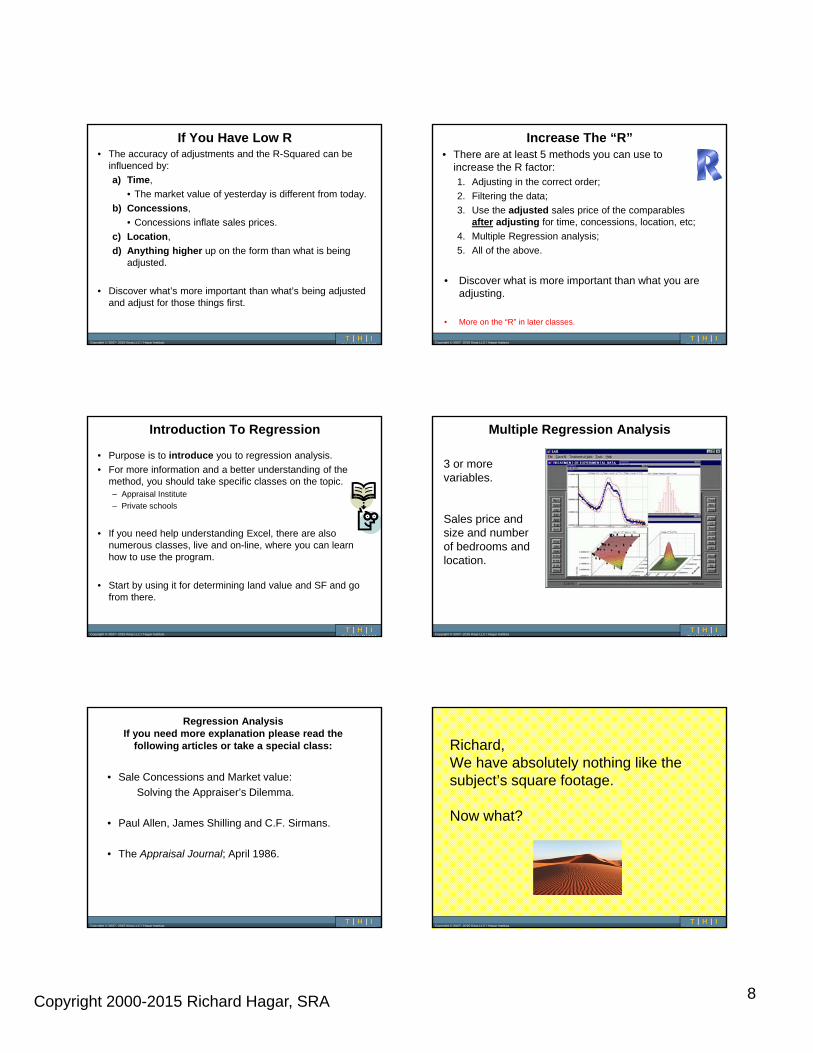
Copyright 2000-2015 Richard Hagar, SRA 8
Copyright © 2007- 2015 Kinja LLC / Hagar Institute
If You Have Low R• The accuracy of adjustments and the R-Squared can be
influenced by:
a) Time,
• The market value of yesterday is different from today.
b) Concessions,
• Concessions inflate sales prices.
c) Location,
d) Anything higher up on the form than what is being adjusted.
• Discover what’s more important than what’s being adjusted and adjust for those things first.
Copyright © 2007- 2015 Kinja LLC / Hagar Institute
Increase The “R”• There are at least 5 methods you can use to
increase the R factor:1. Adjusting in the correct order;
2. Filtering the data;
3. Use the adjusted sales price of the comparables after adjusting for time, concessions, location, etc;
4. Multiple Regression analysis;
5. All of the above.
• Discover what is more important than what you are adjusting.
• More on the “R” in later classes.
Copyright © 2007- 2015 Kinja LLC / Hagar Institute
Introduction To Regression
• Purpose is to introduce you to regression analysis.
• For more information and a better understanding of the method, you should take specific classes on the topic.– Appraisal Institute
– Private schools
• If you need help understanding Excel, there are also numerous classes, live and on-line, where you can learn how to use the program.
• Start by using it for determining land value and SF and go from there.
Copyright © 2007- 2015 Kinja LLC / Hagar Institute
Multiple Regression Analysis
3 or more variables.
Sales price and size and number of bedrooms and location.
Copyright © 2007- 2015 Kinja LLC / Hagar Institute
Regression AnalysisIf you need more explanation please read the
following articles or take a special class:
• Sale Concessions and Market value:
Solving the Appraiser’s Dilemma.
• Paul Allen, James Shilling and C.F. Sirmans.
• The Appraisal Journal; April 1986.
Copyright © 2007- 2015 Kinja LLC / Hagar Institute
Richard,We have absolutely nothing like the subject’s square footage.
Now what?
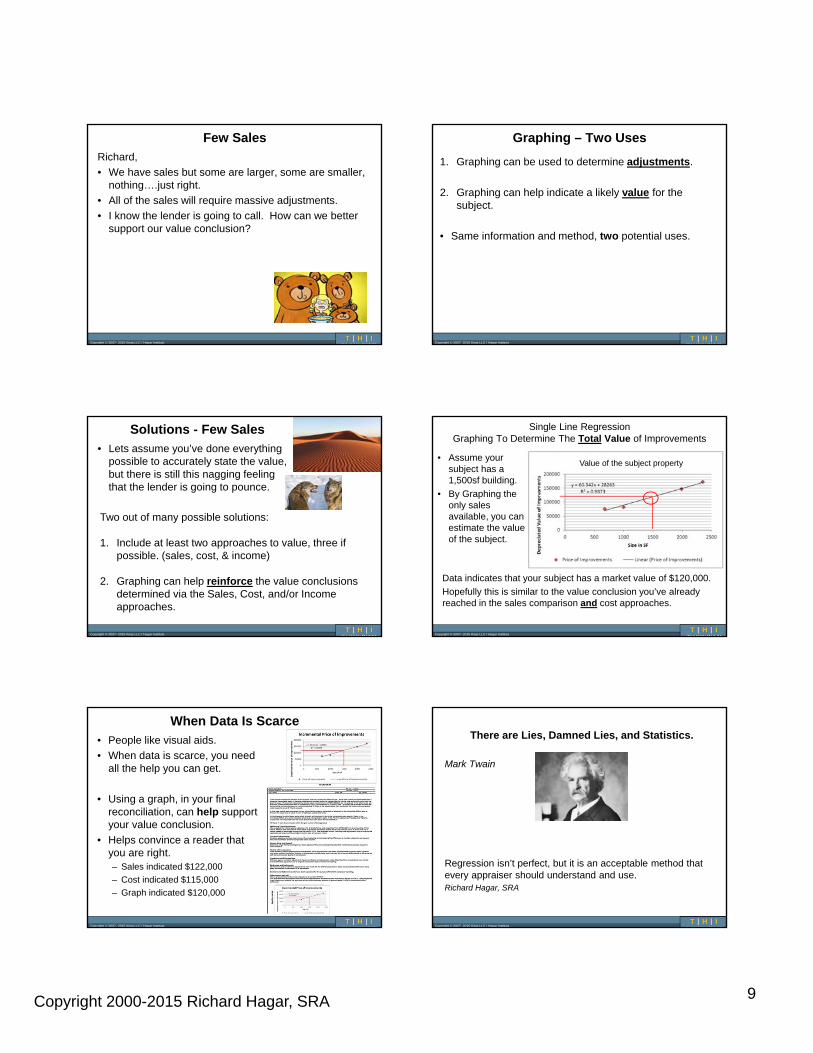
Copyright 2000-2015 Richard Hagar, SRA 9
Copyright © 2007- 2015 Kinja LLC / Hagar Institute
Few Sales
Richard,
• We have sales but some are larger, some are smaller, nothing….just right.
• All of the sales will require massive adjustments.
• I know the lender is going to call. How can we better support our value conclusion?
Copyright © 2007- 2015 Kinja LLC / Hagar Institute
Graphing – Two Uses
1. Graphing can be used to determine adjustments.
2. Graphing can help indicate a likely value for the subject.
• Same information and method, two potential uses.
Copyright © 2007- 2015 Kinja LLC / Hagar Institute
Solutions - Few Sales
• Lets assume you’ve done everything possible to accurately state the value, but there is still this nagging feeling that the lender is going to pounce.
Two out of many possible solutions:
1. Include at least two approaches to value, three if possible. (sales, cost, & income)
2. Graphing can help reinforce the value conclusions determined via the Sales, Cost, and/or Income approaches.
Copyright © 2007- 2015 Kinja LLC / Hagar Institute
Single Line RegressionGraphing To Determine The Total Value of Improvements
• Assume your subject has a 1,500sf building.
• By Graphing the only sales available, you can estimate the value of the subject.
Data indicates that your subject has a market value of $120,000.
Hopefully this is similar to the value conclusion you’ve already reached in the sales comparison and cost approaches.
Value of the subject property
Copyright © 2007- 2015 Kinja LLC / Hagar Institute
When Data Is Scarce
• People like visual aids.
• When data is scarce, you need all the help you can get.
• Using a graph, in your final reconciliation, can help support your value conclusion.
• Helps convince a reader that you are right.– Sales indicated $122,000
– Cost indicated $115,000
– Graph indicated $120,000
Copyright © 2007- 2015 Kinja LLC / Hagar Institute
There are Lies, Damned Lies, and Statistics.
Mark Twain
Regression isn’t perfect, but it is an acceptable method that every appraiser should understand and use.Richard Hagar, SRA
Copyright 2000-2015 Richard Hagar, SRA 10
Copyright © 2007- 2015 Kinja LLC / Hagar Institute
Regression Isn’t
• Regression analysis isn’t the end all – be all, it’s simply “A” method that you can use.
Other methods including:
• Matched-Pair analysis,
• Income Approach,
• Big Data, etc.
• The more methods that you can master, the better your reports will become and higher the fees.
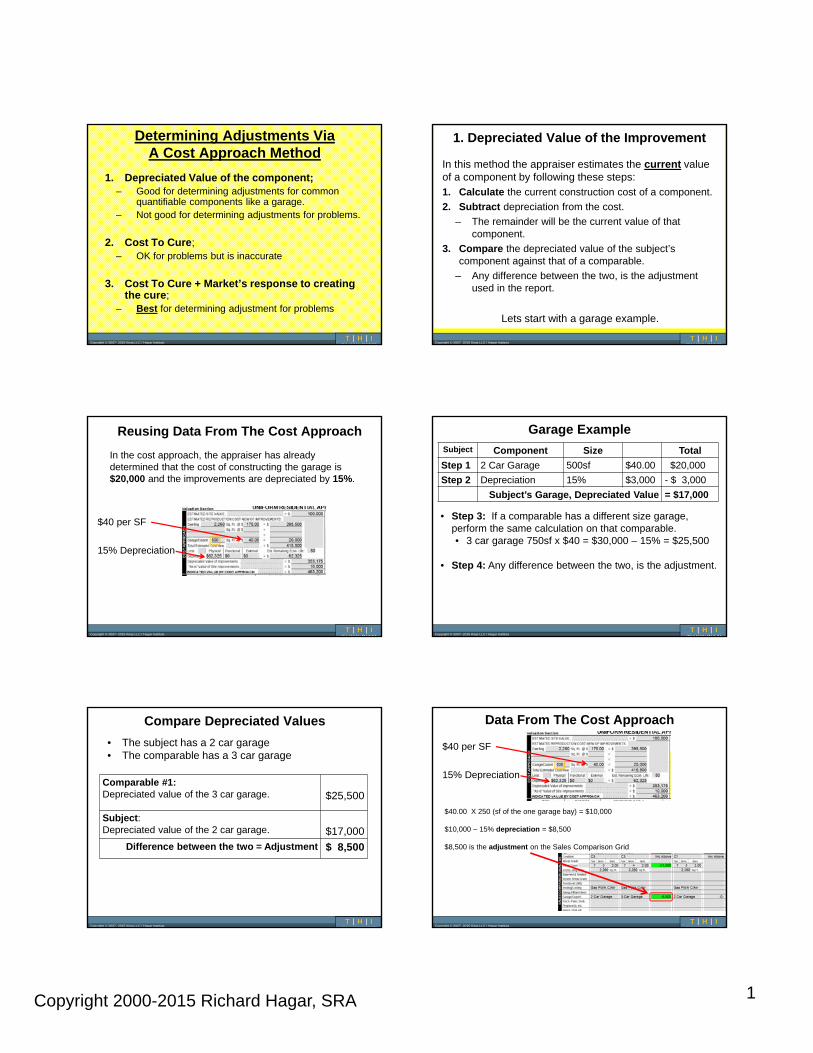
Copyright 2000-2015 Richard Hagar, SRA 1
Copyright © 2007- 2015 Kinja LLC / Hagar Institute
Determining Adjustments ViaA Cost Approach Method
1. Depreciated Value of the component;– Good for determining adjustments for common
quantifiable components like a garage. – Not good for determining adjustments for problems.
2. Cost To Cure; – OK for problems but is inaccurate
3. Cost To Cure + Market’s response to creating the cure;
– Best for determining adjustment for problems
Copyright © 2007- 2015 Kinja LLC / Hagar Institute
1. Depreciated Value of the Improvement
In this method the appraiser estimates the current value of a component by following these steps:1. Calculate the current construction cost of a component.
2. Subtract depreciation from the cost.
– The remainder will be the current value of that component.
3. Compare the depreciated value of the subject’s component against that of a comparable.
– Any difference between the two, is the adjustment used in the report.
Lets start with a garage example.
Copyright © 2007- 2015 Kinja LLC / Hagar Institute
Reusing Data From The Cost Approach
$40 per SF
15% Depreciation
In the cost approach, the appraiser has already determined that the cost of constructing the garage is $20,000 and the improvements are depreciated by 15%.
Copyright © 2007- 2015 Kinja LLC / Hagar Institute
Garage Example
Subject Component Size Total
Step 1 2 Car Garage 500sf $40.00 $20,000
Step 2 Depreciation 15% $3,000 - $ 3,000
Subject’s Garage, Depreciated Value = $17,000
• Step 3: If a comparable has a different size garage, perform the same calculation on that comparable.• 3 car garage 750sf x $40 = $30,000 – 15% = $25,500
• Step 4: Any difference between the two, is the adjustment.
Copyright © 2007- 2015 Kinja LLC / Hagar Institute
Compare Depreciated Values
Comparable #1: Depreciated value of the 3 car garage. $25,500
Subject: Depreciated value of the 2 car garage. $17,000
Difference between the two = Adjustment $ 8,500
• The subject has a 2 car garage• The comparable has a 3 car garage
Copyright © 2007- 2015 Kinja LLC / Hagar Institute
Data From The Cost Approach
$40 per SF
15% Depreciation
$40.00 X 250 (sf of the one garage bay) = $10,000
$10,000 – 15% depreciation = $8,500
$8,500 is the adjustment on the Sales Comparison Grid

Copyright 2000-2015 Richard Hagar, SRA 2
Copyright © 2007- 2015 Kinja LLC / Hagar Institute
Depreciated Cost
• A valid method.
• Taught in books.
• Requires the appraiser to have factual figures on construction costs and accurately calculate depreciation– Guessing or backing into a figure will not due.
• Requires the appraiser to perform a similar calculation for a comparable.
• Good sources of cost data, math, and notes are very important.
Copyright © 2007- 2015 Kinja LLC / Hagar Institute
2. Cost to Cure
• Determining the cost to repair a component that has curable physical or functional problems.
• Appraisers often, and incorrectly, use the Cost to Cure as the adjustment (condition or functional) in the sales comparison approach.
Problems:a) Applicable to deficiencies not differences (bedrooms).b) Difficulty in obtaining accurate repair costs.c) Cost rarely equals value or the adjustment.
– Costs have minimal relationship to the adjustment.– Swimming pool
Copyright © 2007- 2015 Kinja LLC / Hagar Institute
Cost to Cure – Limits
• Only indicates the bottom end of a potential adjustment.
• Often, appraisers fail to account for all related costs.– Time, permits, holding costs, waiting for repairs, personal
time, management, etc.
• Fails to take into account the market’s response to spending time, making, and paying for the cure.
Copyright © 2007- 2015 Kinja LLC / Hagar Institute
Cost to Cure – Limits
• Only applies to curable physical or functional issues.– Costs alone do not not solve for incurable issues.
• Not applicable to incurable, external, or stigma issues.– Incurable = Costs exceed increase in value
• Does not work for major problems:– Items would preclude normal bank financing;
– Potential for hidden problems;
– Mold, structural failures, landslide, fire, etc.
Do not use this method for external problems!
Copyright © 2007- 2015 Kinja LLC / Hagar Institute
Cost To Cure?? External?• How could an appraiser apply a Cost to Cure for a landslide
that’s external to the site? You can’t!
Copyright © 2007- 2015 Kinja LLC / Hagar Institute
Cost To Cure?? Major• Home never had building permits or a functioning septic tank
system.
• County will likely require the home to be torn down.
• How will the Cost to Cure indicate an adjustment?
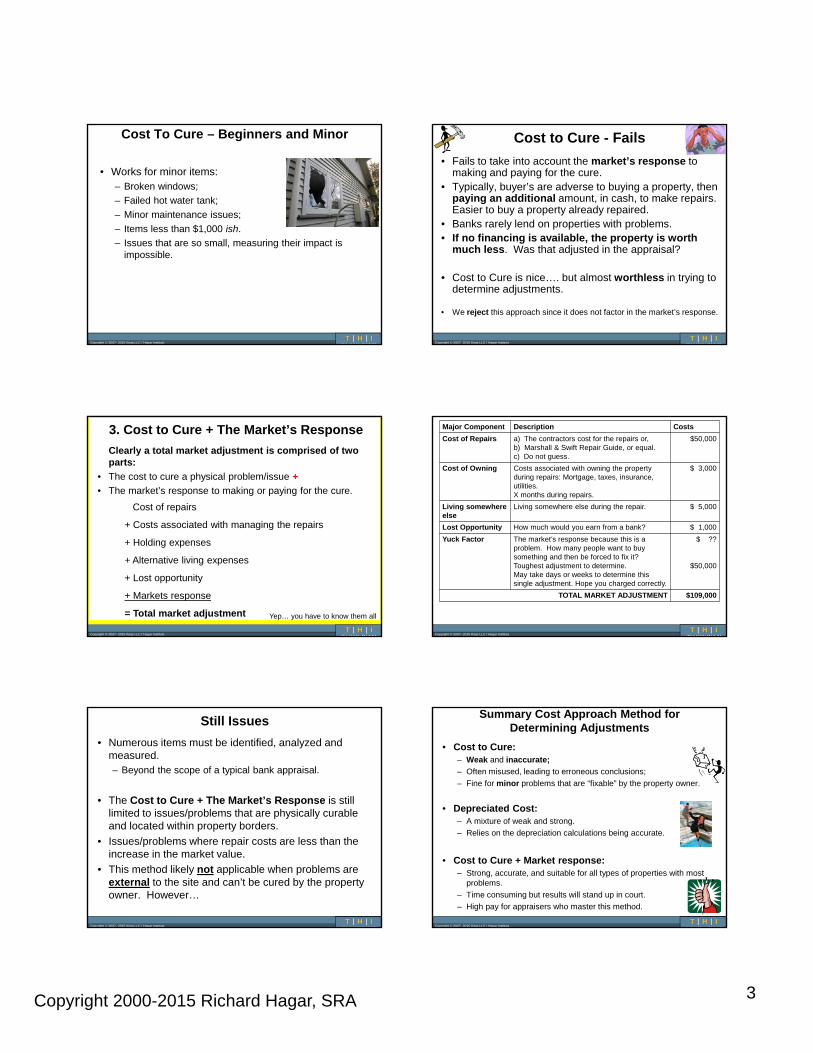
Copyright 2000-2015 Richard Hagar, SRA 3
Copyright © 2007- 2015 Kinja LLC / Hagar Institute
Cost To Cure – Beginners and Minor
• Works for minor items:– Broken windows;
– Failed hot water tank;
– Minor maintenance issues;
– Items less than $1,000 ish.
– Issues that are so small, measuring their impact is impossible.
Copyright © 2007- 2015 Kinja LLC / Hagar Institute
Cost to Cure - Fails
• Fails to take into account the market’s response to making and paying for the cure.
• Typically, buyer’s are adverse to buying a property, then paying an additional amount, in cash, to make repairs. Easier to buy a property already repaired.
• Banks rarely lend on properties with problems.• If no financing is available, the property is worth
much less. Was that adjusted in the appraisal?
• Cost to Cure is nice…. but almost worthless in trying to determine adjustments.
• We reject this approach since it does not factor in the market’s response.
Copyright © 2007- 2015 Kinja LLC / Hagar Institute
3. Cost to Cure + The Market’s Response
Clearly a total market adjustment is comprised of two parts:
• The cost to cure a physical problem/issue +
• The market’s response to making or paying for the cure.
Cost of repairs
+ Costs associated with managing the repairs
+ Holding expenses
+ Alternative living expenses
+ Lost opportunity
+ Markets response
= Total market adjustment Yep… you have to know them all
Copyright © 2007- 2015 Kinja LLC / Hagar Institute
Major Component Description Costs
Cost of Repairs a) The contractors cost for the repairs or,b) Marshall & Swift Repair Guide, or equal.c) Do not guess.
$50,000
Cost of Owning Costs associated with owning the property during repairs: Mortgage, taxes, insurance, utilities.X months during repairs.
$ 3,000
Living somewhere else
Living somewhere else during the repair. $ 5,000
Lost Opportunity How much would you earn from a bank? $ 1,000
Yuck Factor The market’s response because this is a problem. How many people want to buy something and then be forced to fix it?Toughest adjustment to determine.May take days or weeks to determine this single adjustment. Hope you charged correctly.
$ ??
$50,000
TOTAL MARKET ADJUSTMENT $109,000
Copyright © 2007- 2015 Kinja LLC / Hagar Institute
Still Issues
• Numerous items must be identified, analyzed and measured.– Beyond the scope of a typical bank appraisal.
• The Cost to Cure + The Market’s Response is still limited to issues/problems that are physically curable and located within property borders.
• Issues/problems where repair costs are less than the increase in the market value.
• This method likely not applicable when problems are external to the site and can’t be cured by the property owner. However…
Copyright © 2007- 2015 Kinja LLC / Hagar Institute
Summary Cost Approach Method for Determining Adjustments
• Cost to Cure:– Weak and inaccurate;
– Often misused, leading to erroneous conclusions;
– Fine for minor problems that are “fixable” by the property owner.
• Depreciated Cost:– A mixture of weak and strong.
– Relies on the depreciation calculations being accurate.
• Cost to Cure + Market response:– Strong, accurate, and suitable for all types of properties with most
problems.
– Time consuming but results will stand up in court.
– High pay for appraisers who master this method.
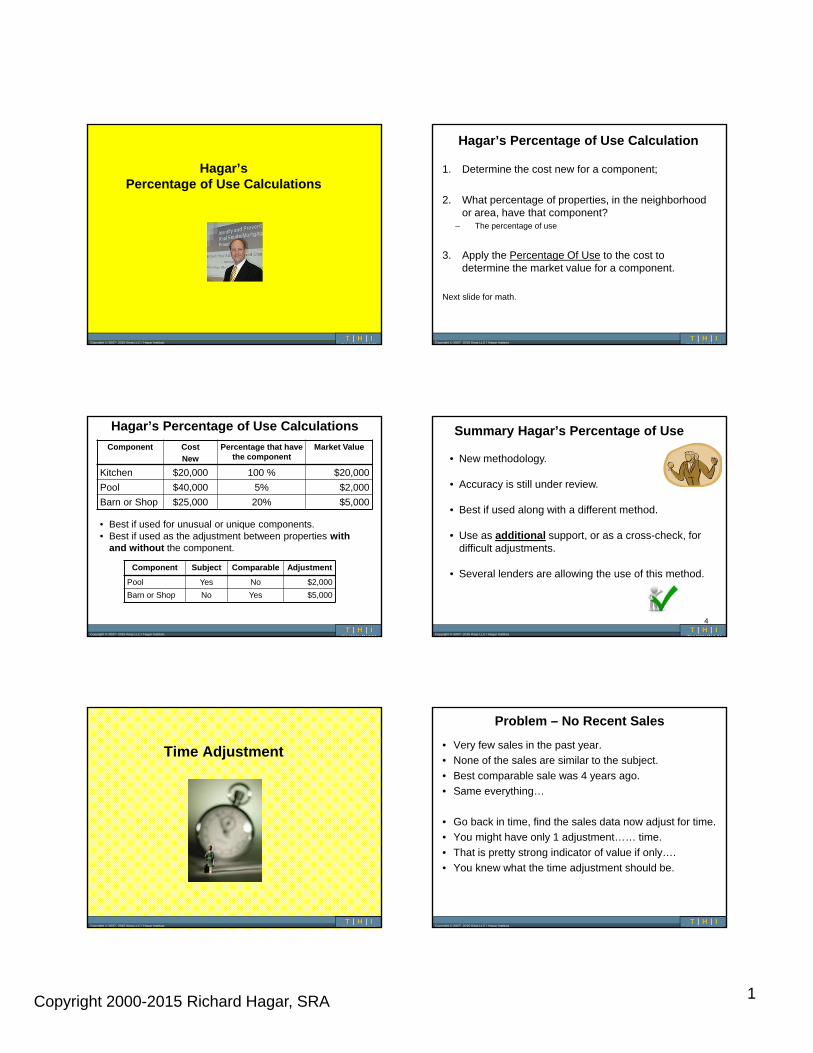
Copyright 2000-2015 Richard Hagar, SRA 1
Copyright © 2007- 2015 Kinja LLC / Hagar Institute
Hagar’sPercentage of Use Calculations
Copyright © 2007- 2015 Kinja LLC / Hagar Institute
Hagar’s Percentage of Use Calculation
1. Determine the cost new for a component;
2. What percentage of properties, in the neighborhood or area, have that component?
– The percentage of use
3. Apply the Percentage Of Use to the cost to determine the market value for a component.
Next slide for math.
Copyright © 2007- 2015 Kinja LLC / Hagar Institute
Hagar’s Percentage of Use Calculations
Component Cost
New
Percentage that have the component
Market Value
Kitchen $20,000 100 % $20,000
Pool $40,000 5% $2,000
Barn or Shop $25,000 20% $5,000
• Best if used for unusual or unique components.• Best if used as the adjustment between properties with
and without the component.
Component Subject Comparable Adjustment
Pool Yes No $2,000
Barn or Shop No Yes $5,000
Copyright © 2007- 2015 Kinja LLC / Hagar Institute
Summary Hagar’s Percentage of Use
4
• New methodology.
• Accuracy is still under review.
• Best if used along with a different method.
• Use as additional support, or as a cross-check, for difficult adjustments.
• Several lenders are allowing the use of this method.
Copyright © 2007- 2015 Kinja LLC / Hagar Institute
Time Adjustment
Copyright © 2007- 2015 Kinja LLC / Hagar Institute
Problem – No Recent Sales
• Very few sales in the past year.
• None of the sales are similar to the subject.
• Best comparable sale was 4 years ago.
• Same everything…
• Go back in time, find the sales data now adjust for time.
• You might have only 1 adjustment…… time.
• That is pretty strong indicator of value if only….
• You knew what the time adjustment should be.
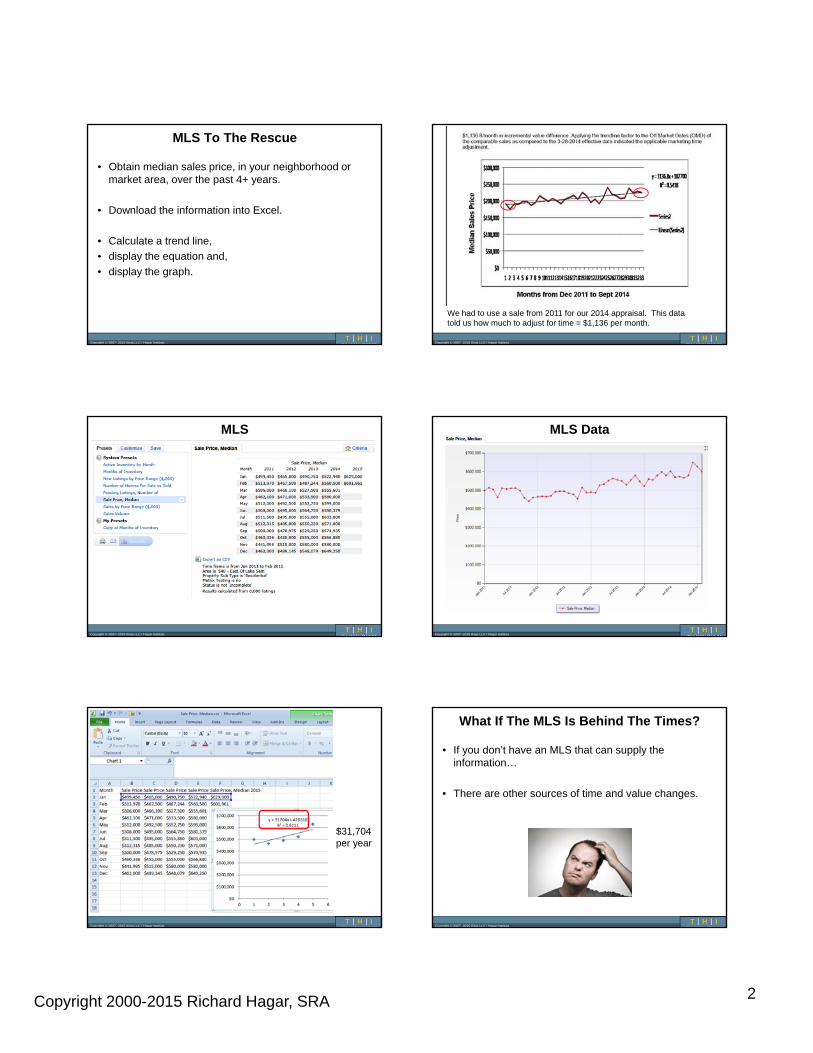
Copyright 2000-2015 Richard Hagar, SRA 2
Copyright © 2007- 2015 Kinja LLC / Hagar Institute
MLS To The Rescue
• Obtain median sales price, in your neighborhood or market area, over the past 4+ years.
• Download the information into Excel.
• Calculate a trend line,
• display the equation and,
• display the graph.
Copyright © 2007- 2015 Kinja LLC / Hagar Institute
We had to use a sale from 2011 for our 2014 appraisal. This data told us how much to adjust for time = $1,136 per month.
Copyright © 2007- 2015 Kinja LLC / Hagar Institute
MLS
Copyright © 2007- 2015 Kinja LLC / Hagar Institute
MLS Data
Copyright © 2007- 2015 Kinja LLC / Hagar Institute
$31,704 per year
Copyright © 2007- 2015 Kinja LLC / Hagar Institute
What If The MLS Is Behind The Times?
• If you don’t have an MLS that can supply the information…
• There are other sources of time and value changes.
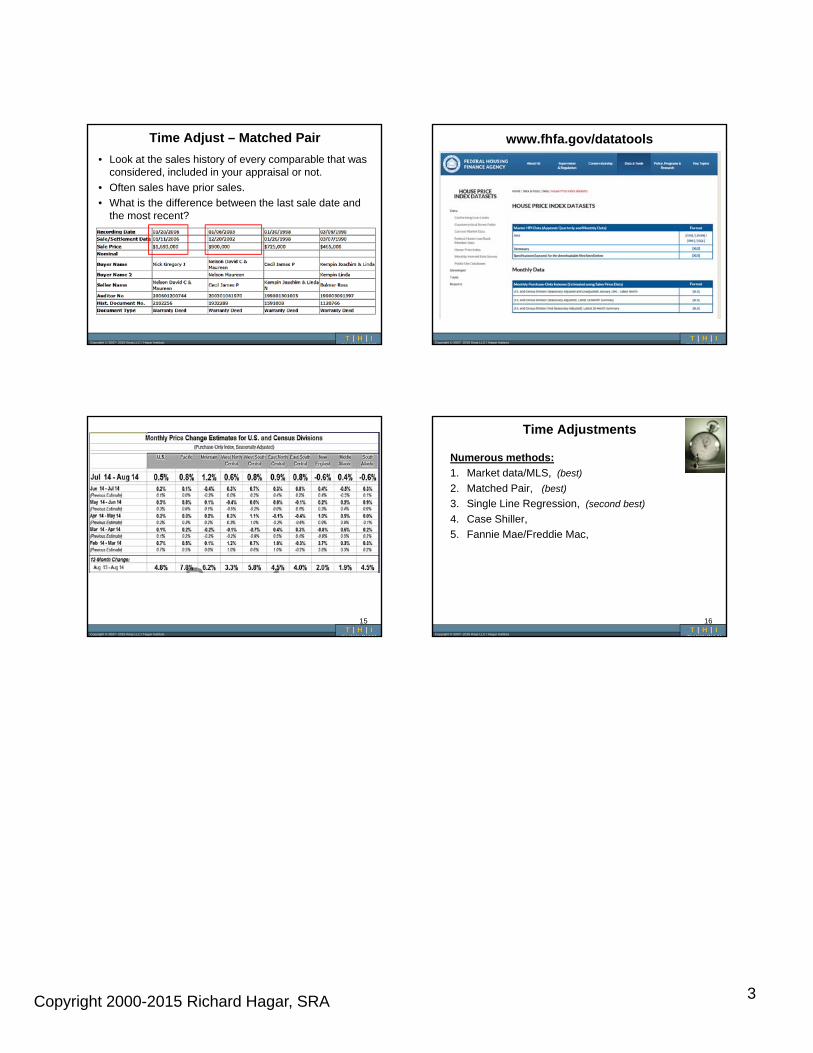
Copyright 2000-2015 Richard Hagar, SRA 3
Copyright © 2007- 2015 Kinja LLC / Hagar Institute
Time Adjust – Matched Pair
• Look at the sales history of every comparable that was considered, included in your appraisal or not.
• Often sales have prior sales.
• What is the difference between the last sale date and the most recent?
Copyright © 2007- 2015 Kinja LLC / Hagar Institute
www.fhfa.gov/datatools
Copyright © 2007- 2015 Kinja LLC / Hagar Institute
15
Copyright © 2007- 2015 Kinja LLC / Hagar Institute
Time Adjustments
Numerous methods:
1. Market data/MLS, (best)
2. Matched Pair, (best)
3. Single Line Regression, (second best)
4. Case Shiller,
5. Fannie Mae/Freddie Mac,
16
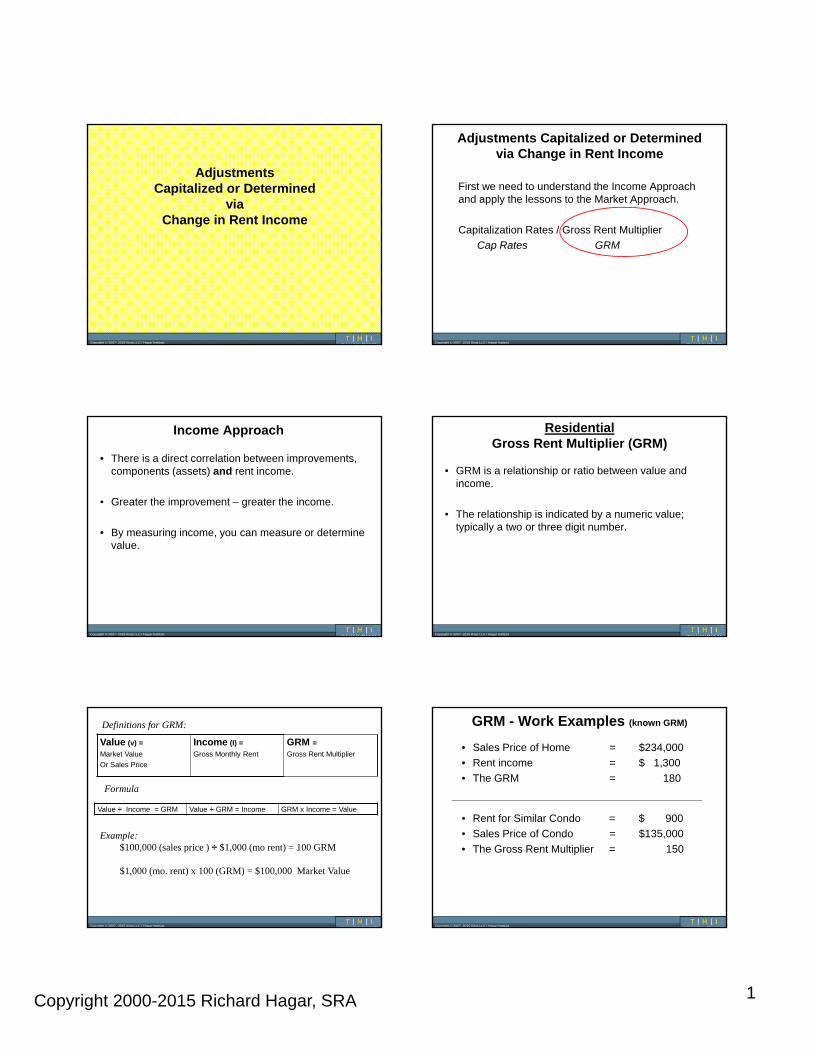
Copyright 2000-2015 Richard Hagar, SRA 1
Copyright © 2007- 2015 Kinja LLC / Hagar Institute
AdjustmentsCapitalized or Determined
viaChange in Rent Income
Copyright © 2007- 2015 Kinja LLC / Hagar Institute
Adjustments Capitalized or Determined via Change in Rent Income
First we need to understand the Income Approach and apply the lessons to the Market Approach.
Capitalization Rates / Gross Rent Multiplier
Cap Rates GRM
Copyright © 2007- 2015 Kinja LLC / Hagar Institute
Income Approach
• There is a direct correlation between improvements, components (assets) and rent income.
• Greater the improvement – greater the income.
• By measuring income, you can measure or determine value.
Copyright © 2007- 2015 Kinja LLC / Hagar Institute
ResidentialGross Rent Multiplier (GRM)
• GRM is a relationship or ratio between value and income.
• The relationship is indicated by a numeric value; typically a two or three digit number.
Copyright © 2007- 2015 Kinja LLC / Hagar Institute
Value (v) =
Market Value
Or Sales Price
Income (I) =
Gross Monthly Rent
GRM =Gross Rent Multiplier
Definitions for GRM:
Formula
Value ÷ Income = GRM Value ÷ GRM = Income GRM x Income = Value
Example:$100,000 (sales price ) ÷ $1,000 (mo rent) = 100 GRM
$1,000 (mo. rent) x 100 (GRM) = $100,000 Market Value
Copyright © 2007- 2015 Kinja LLC / Hagar Institute
GRM - Work Examples (known GRM)
• Sales Price of Home = $234,000
• Rent income = $ 1,300
• The GRM = 180
• Rent for Similar Condo = $ 900
• Sales Price of Condo = $135,000
• The Gross Rent Multiplier = 150
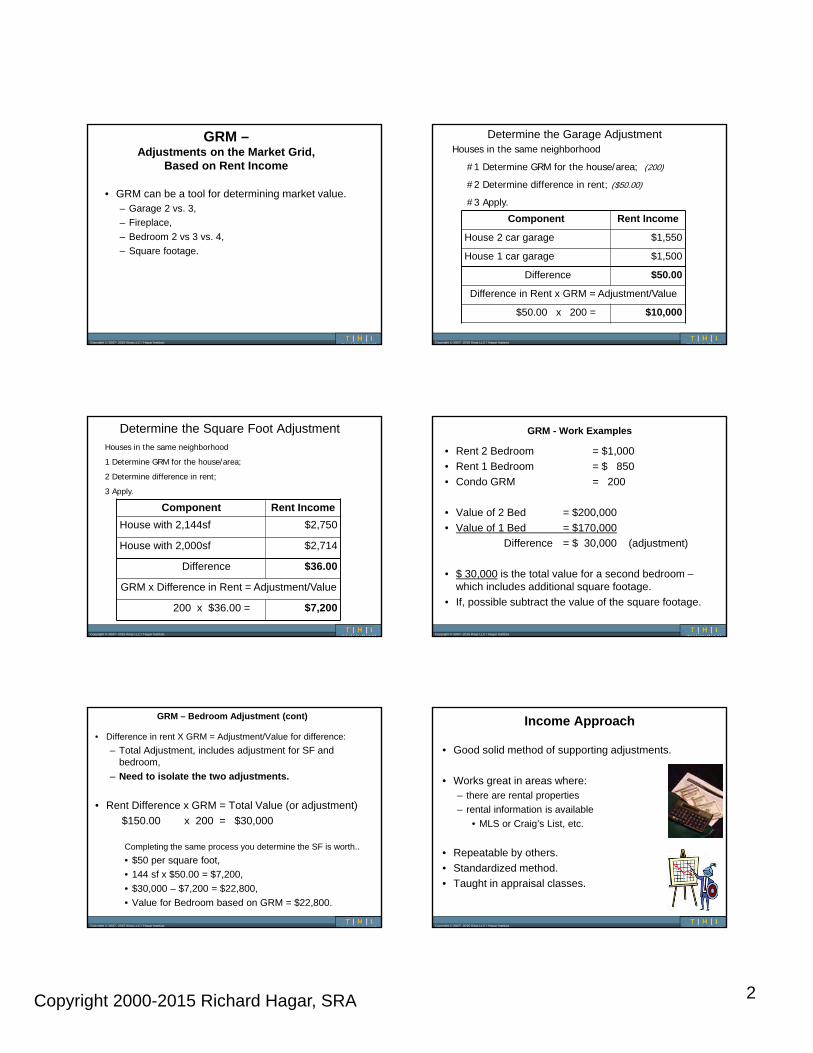
Copyright 2000-2015 Richard Hagar, SRA 2
Copyright © 2007- 2015 Kinja LLC / Hagar Institute
GRM –Adjustments on the Market Grid,
Based on Rent Income
• GRM can be a tool for determining market value.– Garage 2 vs. 3,
– Fireplace,
– Bedroom 2 vs 3 vs. 4,
– Square footage.
Copyright © 2007- 2015 Kinja LLC / Hagar Institute
Determine the Garage Adjustment
Component Rent Income
House 2 car garage $1,550
House 1 car garage $1,500
Difference $50.00
Difference in Rent x GRM = Adjustment/Value
$50.00 x 200 = $10,000
Houses in the same neighborhood
#1 Determine GRM for the house/area; (200)
#2 Determine difference in rent; ($50.00)
#3 Apply.
Copyright © 2007- 2015 Kinja LLC / Hagar Institute
Determine the Square Foot Adjustment
Component Rent Income
House with 2,144sf $2,750
House with 2,000sf $2,714
Difference $36.00
GRM x Difference in Rent = Adjustment/Value
200 x $36.00 = $7,200
Houses in the same neighborhood
1 Determine GRM for the house/area;
2 Determine difference in rent;
3 Apply.
Copyright © 2007- 2015 Kinja LLC / Hagar Institute
GRM - Work Examples
• Rent 2 Bedroom = $1,000
• Rent 1 Bedroom = $ 850
• Condo GRM = 200
• Value of 2 Bed = $200,000
• Value of 1 Bed = $170,000
Difference = $ 30,000 (adjustment)
• $ 30,000 is the total value for a second bedroom –which includes additional square footage.
• If, possible subtract the value of the square footage.
Copyright © 2007- 2015 Kinja LLC / Hagar Institute
GRM – Bedroom Adjustment (cont)
• Difference in rent X GRM = Adjustment/Value for difference:
– Total Adjustment, includes adjustment for SF and bedroom,
– Need to isolate the two adjustments.
• Rent Difference x GRM = Total Value (or adjustment)
$150.00 x 200 = $30,000
Completing the same process you determine the SF is worth..
• $50 per square foot,
• 144 sf x $50.00 = $7,200,
• $30,000 – $7,200 = $22,800,
• Value for Bedroom based on GRM = $22,800.
Copyright © 2007- 2015 Kinja LLC / Hagar Institute
Income Approach
• Good solid method of supporting adjustments.
• Works great in areas where:– there are rental properties
– rental information is available
• MLS or Craig’s List, etc.
• Repeatable by others.
• Standardized method.
• Taught in appraisal classes.

Copyright 2000-2015 Richard Hagar, SRA 3
Copyright © 2007- 2015 Kinja LLC / Hagar Institute
Market Studies
Blame it on someone else.
Copyright © 2007- 2015 Kinja LLC / Hagar Institute
Numerous Studies Available
• Appraisal Institute,– Lum Library
• NAIFA,
• Fannie Mae,
• Fed Government,
• Etc.
Copyright © 2007- 2015 Kinja LLC / Hagar Institute
County Assessor’s Reports
The Assessor may have what you are looking for:– DATA;
– Comparisons;
– Analysis;
– Adjustments;
– Allocation between land and improvements.
• They have access to every recorded sale within their tax district (city, county, state).
• Required, by law, to be accurate.
Copyright © 2007- 2015 Kinja LLC / Hagar Institute
Real Property Assessors• Provides a base line value for a “typical” property then add
percentages for location, EO, view, waterfront, quality, condition, SF, etc. The adjustments
• Property assessors determine property value by using closed sales and applying various methodologies:• Mass appraisal techniques;• Multi-Regression Analysis;• Single-Line Regression Analysis;• Matched-Pair Analysis;• Income and Cost Approaches.
• Many produce reports are available to the public.• But you have to look for them.
Copyright © 2007- 2015 Kinja LLC / Hagar Institute Copyright © 2007- 2015 Kinja LLC / Hagar Institute

Copyright 2000-2015 Richard Hagar, SRA 4
Copyright © 2007- 2015 Kinja LLC / Hagar Institute Copyright © 2007- 2015 Kinja LLC / Hagar Institute
Copyright © 2007- 2015 Kinja LLC / Hagar Institute
www.kingcounty.gov/depts/assessor/Reports/area-reports.aspx
Copyright © 2007- 2015 Kinja LLC / Hagar Institute
Interview Market Participants
The last gasp of desperation but….
it’s better than guessing.
Copyright © 2007- 2015 Kinja LLC / Hagar Institute
Interview Market Participants
• Personal interviews can reveal the opinions of knowledgeable individuals participating in the subject’s market.
• Interviews are considered “secondary” indicators.
• It should only be used to help confirm data supplied by other methods, or as a last resort.
• If you use this method, you must note person, place, time, questions asked and the answers.
• Do not use general terms, ask specific questions and keep track.
Copyright © 2007- 2015 Kinja LLC / Hagar Institute
Interviews
Common “market participants” that can help:
• Real estate agents,
• Buyers,
• Sellers,
• Property owners who own a portion of the market:– An owner/corporation owns a dozen buildings,
• Lenders.
• “When you thinking of buying this property, did you consider the price per square foot or units per site?”
• Etc.

Copyright 2000-2015 Richard Hagar, SRA 5
Copyright © 2007- 2015 Kinja LLC / Hagar Institute
Summary
Copyright © 2007- 2015 Kinja LLC / Hagar Institute
Summary - Adjustments for Bed Room
• Method #1– Average Sales price 2 vs. 3 bed home = $23,000.
• Method #2– Matched Paired analysis bedroom = $20,000.
• Method #3– Depreciated value of bedroom space = $21,420.
• Method #4– Capitalized rent (GRM ) = $22,800.
Copyright © 2007- 2015 Kinja LLC / Hagar Institute
Summary of methods for determining adjustments:
1. Data Analysis.
2. Statistical Analysis.
3. Cost.
4. Hagar’s “Percentage of Use Calculations.”
5. Capitalized via Change in Rent Income.
6. Personal interviews.
Copyright © 2007- 2015 Kinja LLC / Hagar Institute
“Support, Evidence, Proof”
Support:
• the truth of;
• synonyms: verify, prove, validate, substantiate, back up, corroborate, confirm, attest to, authenticate.
Proof:
• evidence sufficient to establish a thing as true.
• the act of testing or making trial of anything.
– You can’t test “feelings” or “your experience”
– Don’t Guess – Support - Prove
Webster’s Dictionary
Copyright © 2007- 2015 Kinja LLC / Hagar Institute
This Just In
• While I was preparing this class for CE/Webinar credit, the State of Washington’s Appraisal Board posted this:
Copyright © 2007- 2015 Kinja LLC / Hagar Institute
I’m Trying To Keep You Safe
• This is a new appraisal world.
• State disciplinary actions and computer reviews are everywhere.
• Not everybody will survive.
– People providing poor appraisals will be eliminated.
• Understand what they will be looking for and make sure appraisals are completed properly.
• Stop complaining… do the job right and, increase your rates to compensate for your time.
• The appraisers that do the job right…
…will survive the purge and make money!

Copyright 2000-2015 Richard Hagar, SRA 6
Copyright © 2007- 2015 Kinja LLC / Hagar Institute
Richard Hagar SRA