Embed Size (px)
Citation preview
571Politická ekonomie, 2021, 69 (5), 571–594, https://doi.org/10.18267/j.polek.1327
REAL CONVERGENCE IN EU: IS THERE A DIFFERENCE BE T WEEN THE EFFEC TS OF THE PANDEMIC AND THE GLOBAL ECONOMIC CRISIS?
Aleksandra Fedajeva , Magdalena Radulescub , Ana-Gabriela Babuceac , Vladimir Mihajlovicd 1
AbstractThis paper aims to shed some light on the real convergence process among EU economies in the context of the COVID-19 pandemic crisis in comparison to the real convergence in 2008, when the last financial crisis erupted. According to entropy method results, the most pronounced difference between effects of the current pandemic and the global financial crisis are registered in the unemployment rate, while the difference in the current account balance and GDP per capita are much less noticeable. The results of the entropy method also suggest that the greatest difference among EU economies in 2020 is registered in the current account deficits; a slightly lower difference is registered in the unemployment rate, while the divergence in GDP is much less pronounced. To explain the results of the entropy method, a hierarchical cluster analysis is performed and three clusters are derived. Based on the identified characteristics of the derived clusters, some policy recommendations for overcoming the current crisis are defined.
Keywords: Pandemic crisis, convergence, EU, entropy method, cluster analysisJEL Classification: R12, E61, E63, H12
Introduction
The global economic and financial crisis, which began on the US financial market in 2007 and quickly spread around the world in 2008, had a significant negative impact on EU
a University of Belgrade, Technical Faculty in Bor, Republic of Serbia E-mail: [email protected] University of Pitesti, Faculty of Economic Sciences, Romania E-mail: [email protected] and “Lucian Blaga” University of Sibiu, Romaniac Constantin Brancusi University of Targu Jiu, Faculty of Economics, Romania E-mail: [email protected] (corresponding author)d University of Kragujevac, Faculty of Economics, Republic of Serbia E-mail: [email protected] Conflict of interest statement: On behalf of all the authors, the corresponding author states that
there is no conflict of interest.
572 Politická ekonomie, 2021, 69 (5), 571–594, https://doi.org/10.18267/j.polek.1327
economies, especially on the then New Members States (NMS), such as the Central and Eastern European (CEE) countries and the Baltic States. The circumstances of the eco-nomic crisis that followed were diff erent across EU countries, resulting in real divergence in the EU after the signifi cant catching-up process of the NMS. In contrast to the global downturn in 2008, which mostly aff ected underdeveloped and developing countries, the pandemic mainly aff ected developed countries. Accordingly, it is expected that the EU’s most developed economies will diverge as a result of the current crisis (Bis-ciari et al., 2020). While a structural shock generated by the crisis on the fi nancial mar-kets in 2008, which spilt over into the real sector, the current pandemic crisis represents a sudden stop of economic activity and represents both a supply chain disruption crisis and a crisis caused by a demand shock.
The current pandemic crisis caused a remarkable drop in economic activity, employ-ment and trade fl ow due to its comprehensiveness (considering that it impacted all EU economies), its dynamics (in a few weeks, millions of employees had been fi red), and its intensity (it hit all EU economies with an unprecedented economic downturn) (Arce et al., 2020). The diff erences in economic structure, available resources, economic heritage and other specifi cities resulted in increased divergence in economic growth across EU econ-omies. The highly open economies, relying more on tourism, faced a greater drop in eco-nomic activity in 2020 (König and Winkler, 2020). In addition to a signifi cant decline in economic activity, the lockdown and the travel restrictions resulted in a temporary clo-sure of many jobs. As the diversity of labour markets across EU economies is still present, the unemployment rates are expected to be considerably diff erent across EU economies in the future. The pandemic crisis is also characterized by tight restrictions on foreign trade and movement of goods, services, capital, labour, technology, data and information, and it is expected that these restrictions will be present for a long time. Such a situation is present especially in the pharmaceutical, medical equipment and food sectors, where governments impose export restrictions and other protectionist measures in response to the crisis. As the COVID-19 pandemic has mostly aff ected developed economies and is mainly a demand shock, imports will fall mostly in those countries. Considering that the pandemic crisis has aff ected three main aspects of real convergence (economic growth, employment, and trade fl ows), it is expected to have a severe eff ect on real convergence in the EU.
Since ensuring real convergence is a key precondition for achieving the long-term sustainability of the EU, this paper aims to present a comprehensive analysis of real con-vergence among EU countries based on three most commonly used real convergence indicators (GDP per capita PPP, unemployment rate and current account balance) at two moments that have infl uenced the EU convergence greatly: 2008 (when the global fi nancial
573Politická ekonomie, 2021, 69 (5), 571–594, https://doi.org/10.18267/j.polek.1327
and economic crisis spilt over all EU economies) and 2020 (when the COVID-19 pan-demic crisis induced a sudden and dramatic stop in economic activities). The combined analysis methods primarily represent this paper‘s novelty – both entropy method and cluster analysis were employed to investigate the real convergence among EU countries. In contrast to other real convergence research based on one indicator, diff erent aspects of real convergence are considered in this paper, considering that three indicators are used for real convergence measurement. Finally, this is one of the rare studies that compare the eff ects of the global fi nancial crisis and the current pandemic crisis on real conver-gence in the EU.
1. Literature Review
The survival of the EU relies on responding to the serious fi nancial problems caused by the COVID-19 pandemic and resolving the long-term structural issues that have led to growing disparities among its members. This is why research of real convergence occu-pies a special place in the literature on the development of European integration. Most of the papers in this area have focused on the analysis of one real convergence indicator (Simionescu-Bratu, 2014; Albu, 2012; Alcidi et al., 2018). However, after the emergence of the global fi nancial crisis, the number of papers dealing with real convergence issues has been growing.
After the global fi nancial crisis, most of the papers have focused on the catching-up process of NMS and especially CEE and SEE countries. Cieslik and Wcislik (2020) inves-tigated the real GDP per capita convergence between the CEE-8 and their catching-up with the old EU-15. They did not fi nd clear evidence for catching-up of the CEE-8 econ-omies with the EU-15, although the CEE-8 economies had undergone profound changes due to the transition process and EU accession. Their results suggested that there is also a weak, but overall relative convergence within the group of the CEE-8 economies. Młynarzewska-Borowiec (2017) studied the real convergence among the EU countries in 2000–2014 and demonstrated a real convergence of GDP per capita PPP and total labour force for EU-27 (except Croatia). The results pointed out that the convergence was much stronger among the NMS than for the EU-27 as a whole, while less developed countries (Southern European countries) did not manage to catch up with the advanced European countries. They concluded that the technological channel, increase in technology levels, and intensive technology transfer between countries are the driving force of the converg-ing process in the European Union.
Durkalic et al. (2019) analysedanalysed the real convergence among EU-28 countries in 2004–2016 using the entropy method. Their results showed that the greatest diff erences
574 Politická ekonomie, 2021, 69 (5), 571–594, https://doi.org/10.18267/j.polek.1327
among EU members exist in labour productivity (expressed as GDP per worker). After the global economic crisis, the divergence in the unemployment rate increased due to the diff erent impacts of the crisis across EU economies and implementation of diff erent measures. The crisis indicated that signifi cant imbalances are still present on the labour market, both in the NMS and in some OMS. The CEE economies lacked capacities for successful implementation of labour policy due to their inheritance from real social-ism. Some OMS, such as Greece, Spain, Italy and Portugal, had problems overcoming the eff ects of the crisis on their labour markets. The diff erences in GDP per capita PPP did not change a lot as a result of the crisis.
A number of papers dealing with the convergence process within a group of EMU countries were published after the sovereign debt crisis. So, Ferreiro et al. (2017) detected a signifi cant divergence process in real GDP per capita and the balance on current trans-actions, thus exacerbating the diff erences present before the formation of the EMU. They also emphasized that the global fi nancial crisis resulted in increased divergence in many macroeconomic performance indicators, generating the risk of a higher diversity among EMU members if the crisis became chronic/endemic or caused structural imbalances.
Diaz del Hoyo et al. (2017) pointed out that although the promoters of the single currency area had expected that joining the Eurozone would enhance the convergence among the member countries, this goal was not accomplished. Moreover, some countries with low incomes did not succeed in reducing the disparities or even started to diverge, such as Spain and Greece. Mayer and Schnabl (2020) emphasized that the coronavirus crisis had caused new distress in the EMU, as the southern EMU countries had been hit harder than the northern countries. Southern EMU members rely signifi cantly on tourism and have a higher share of small and medium-sized enterprises than the northern ones, their competitiveness declining even further. Thus, the gap in real GDP between northern and southern countries, exemplifi ed by Germany and Italy, increased signifi cantly in 2020.
The results obtained by Coutinho and Turrini (2020) indicated that the global fi nan-cial crisis in 2008 was followed by a reappraisal of risk and a sudden withdrawal of cap-ital from the periphery of the EMU. The contraction in domestic demand was caused by sudden stops in current accounts resulting in a reversal in the convergence process. They suggest that countries that had been the fi rst to adopt the euro had exhibited rela-tively weak convergence even before the global fi nancial crisis. The divergence among those countries could be partly explained by relatively low dispersion in GDP per capita across this group of countries and partly by existing diff erences in total factor productivity. They also emphasize that macroeconomic imbalances accumulated during the pre-crisis period, such as high private and government debt and strong growth in the non-tradable sector, resulted in lower convergence, especially in the EMU.
575Politická ekonomie, 2021, 69 (5), 571–594, https://doi.org/10.18267/j.polek.1327
Malliaris and Malliaris (2020) focused on the fi rst 20 years after the introduction of the euro, from 1999 to 2019, and they divided that period into two approximate decades to analyse the trend of three indicators: the real GDP quarterly growth, the real per capita GDP changes and unemployment. They concluded that the underperformance of the EU is more evident during the second decade due to the global fi nancial crisis. Greece, Ireland, Italy, Portugal and Spain borrowed heavily in the period 2000–2007 from banks in Ger-many, France and the Netherlands, which hampered their growth with the emergence of a great fi nancial crisis, and their economic imbalances are still present.
Boltho (2020) concluded that the EMU had not reduced GDP per capita PPP dispar-ities among the 12 Western European economies. GDP per capita PPP between South-ern and Northern Eurozone members has diverged since the Eurozone was created. He then investigated whether something similar had occurred in the fi ve Eastern European countries, Estonia, Latvia, Lithuania, Slovakia and Slovenia. The results pointed out that the overall developments in Eastern Europe were diff erent and led to convergence rather than divergence. One of the main factors for such a trend was Eastern Europe‘s relatively high levels of institutional quality, a politically motivated determination to anchor these countries to the West, and, possibly, the heritage from the previous period.
Generally observed, the previous literature has suggested that the global fi nancial crisis has led to some divergence among EU countries. However, diff erences also result from institutional divergence and some inherited factors that are still present and infl uence the current crisis.
2. Data and Methodology
Keeping in mind that the paper aims to investigate the future diff erences among EU coun-tries caused by the COVID-19 pandemic, data on some real convergence indicators have been used. They are analysedanalysed using the entropy method and cluster analysis.
2.1 Data
International institutions have published projections of some indicators for 2020 to give a rough picture of future trends in the pandemic crisis conditions. At the moment, these indicators are the most accurate and realistic (because they are calculated based on the appropriate set of data from national statistical offi ces). One of the international institutions that published its projections for 2020 most recently is the International Monetary Fund. Table 1 presents the IMF indicators of real convergence considered in this paper.
576 Politická ekonomie, 2021, 69 (5), 571–594, https://doi.org/10.18267/j.polek.1327
Table 1: IMF real convergence indicators
Indicator Short name Source
Real convergence indicators
Gross domestic product per
capita, current prices, pur-
chasing power parity (in 000)
GDP per capita (GDP)
World Economic Outlook Database (April 2020 Edition), https://www.imf.org/external/pubs/ft/weo/2020/01/weodata/index.aspx
The unemployment rate,
percent of total labour force
Unemployment (UNEMP)
World Economic Outlook Database (April 2020 Edition), https://www.imf.org/external/pubs/ft/weo/2020/01/weodata/index.aspx
Current account balance,
percent of GDP
Current account balance (CAB)
World Economic Outlook Database (April 2020 Edition), https://www.imf.org/external/pubs/ft/weo/2020/01/weodata/index.aspx
Source: Elaborated by the authors
Although there are more indicators of real convergence in existing literature, such as GDP per worker and gross fi xed capital formation, the considered indicators are now available and represent the most recent update of macroeconomic projections for all EU countries.
2.2 Methodology
In this paper, the entropy method is used to measure diff erences among EU countries according to considered indicators and cluster analysis to identify an appropriate group of EU countries with similar macroeconomic situations.
2.2.1 Entropy method
The real convergence among EU economies in this paper is measured by applying the methodology used by Czyz and Hauke (2015). They used the entropy method to ana-lyse the divergence in the development of regions in Poland in the period 2005–2012. To calculate the diff erences in economic development among Poland’s regions, they applied the Shannon entropy index. Having in mind that the EU represents regional inte-gration focused on achieving harmonized development and cohesion, the authors con-cluded that a similar approach could be applied at the EU level. Identifi cation of gaps in real convergence indicators can improve the information basis for creating effi cient policy implications to prevent the spreading economic crisis caused by the COVID-19 pandemic in the EU and, accordingly, to reduce its impact on the convergence process.
577Politická ekonomie, 2021, 69 (5), 571–594, https://doi.org/10.18267/j.polek.1327
Some adjustments in data on nominal indicators are necessary to apply the entropy method according to the approach of Czyz and Hauke (2015). Taking into account that the current account balance can take negative values and that only a positive real number can be used as a base in a logarithm calculation, which is used in the entropy method, all such negative indicators should be “moved” to the positive area without changing the dif-ferences among EU countries. Also, zero values of indicators should be avoided.
The adjustment was made by adding the appropriate value to data on indicators for all countries. The calculation of that corrective value was performed using the formula:
1minx x , (1)
where:∆x is the corrective value, xmin is the minimum value of the mentioned indicator for all countries in both analysed years.
After these adjustments, the Shannon entropy index is calculated as follows. Firstly, it should be pointed out that the Shannon entropy measures the amount of uncertainty about the event with an appropriate probability distribution. In this paper, mentioned “events” are convergence indicators, and they are marked by x. The information gained from the appearance of a certain event is determined by the monotonically decreasing func-tion with the probability p, which can be represented by log 1 / p = − log p. For a series of events xi with probabilities, pi it can be defi ned that
1
0 1, 1n
i ii
p x p x
(2)
considering that xi represents a certain convergence indicator for the country i, where i = 1, 2 ... n.
The entropy measure H(x) is the expected value of this series that can be presented as:
1
logn
i ii
H x p x p x
(3)
or
21
1( ) ( )log( )
n
iii
H x p xp x
. (4)
It should be emphasized that the use of the logarithm function with base 2 implies the measurement of information in bits.
578 Politická ekonomie, 2021, 69 (5), 571–594, https://doi.org/10.18267/j.polek.1327
According to Czyz & Hauke (2015), the presented formula for calculation of the Shan-non entropy has the following characteristics:
1. H(x) ≥ 0, i.e., it is a positive value;
2. H(x) assumes the value of 0 with p(xi = 1 for chosen i, indicating the absence of uncer-tainty among indicators;
3. H(x) assumes the highest value equal to log2n when all values of p(xi) are equal for i = 1, 2,... n. The maximum value H(x) means a total uncertainty or disorder of a system.
On the basis of the entropy indicator H(x), the Shannon entropy index I(x) is devel-oped and used as a measure of divergence among EU countries according to the consid-ered convergence indicator x. The Shannon entropy index I(x) is calculated as follows:
2 21
1log logn
imaxii
I x H x H x n p xp x
(5)
21
log n
i ii
p x n p x
for 20 logI x n ,
where I(x) = 0 shows the total equality, while I(x) = log2 shows maximum inequality.
2.2.2 Cluster analysis
An agglomerative hierarchical clustering procedure (HCA) was applied to analyse the practical problem comprehensively. The aim was to classify EU countries concerning their “similarity/dissimilarity”. The objects’ similarity (in this case, EU countries) refers to how “closely” they are one to each other in terms of a distance measure (Chen et al., 2009). Ward’s method was applied as an agglomerative algorithm, usually used when interval-scaled variables are considered (Bacher, 2002).
To reduce the impact of some indicators, regarding the negative values or a larger magnitude of variations, on the clustering results with present particular observed data, the three variables included in the study were standardized using the formula:
minmax min
ii i
x Xz x
X X
. (6)

579Politická ekonomie, 2021, 69 (5), 571–594, https://doi.org/10.18267/j.polek.1327
The use of Ward’s method enabled minimizing the total within-cluster variance while between-cluster variance is maximized. The squared Euclidean distance (SED) is used to measure dissimilarity between objects (countries). The complex computational process of the HAC procedure requires performing it by using statistical software. In this respect, IBM SPSS v.20 was used.
One of the fi rst outputs of the IBM SPSS procedure used for examining the conver-gence process among EU countries – the initial dissimilarity matrix of Ward’s method – was used to compare each country’s performances with all the others, with the EU aver-age, or a group of countries too. A high value of the distance between two countries means a high dissimilarity, and it can be interpreted as a high divergence, or, in other words, a low convergence between them.
The dissimilarity matrix consists of all SEDs computed for each pair of countries, computed by the following formula:
2 2
1
,p
i j ij ik jk i jk
d Z Z d z z Z Z
, (7)
where, in our case:i and j are the two diff erent countries, including EU-27 (single-clusters),p – variables Z1, Z2, Z3 are the standardized considered indicators of real convergence,zi1, zi2, zi3 are scores of registered data for the county i, zj1, zj2, zj3 are scores of registered data for the country j.
During the agglomerative process, after every new obtained cluster, all dissimilarities between all of them are re-considered (Bacher, 2002) using the formula:
, 1new
p i pi q i qi i pqp q ip q i
d n n d n n d n dn n n
, (8)
where:
, newp q id is the dissimilarity between the new cluster (p + q) and the cluster i,
dpi is the dissimilarity between the cluster p and the cluster i,dqi is the dissimilarity between the cluster q and the cluster i.
3. Results and Discussion
Use of the presented methodology enabled calculation of the Shannon entropy index for all real convergence indicators in 2008 and 2020. The advantage of this divergence measure is that its calculation considers the number of EU Member States in mentioned years, without infl uence on obtained results. Besides comparative analysis at diff erent points
580 Politická ekonomie, 2021, 69 (5), 571–594, https://doi.org/10.18267/j.polek.1327
of time, the divergence among EU countries should be accompanied by the EU average. Parallel analysis of these two values gives a more detailed picture of convergence pro-cesses because diff erences among countries can decrease due to worsening or improving state in most countries, and it is very important to identify the cause of diff erences. Also, it should be mentioned that the authors took into account that Croatia joined the EU in 2013 and the United Kingdom exited from the EU in 2020 while calculating the Shan-non entropy index in 2020.
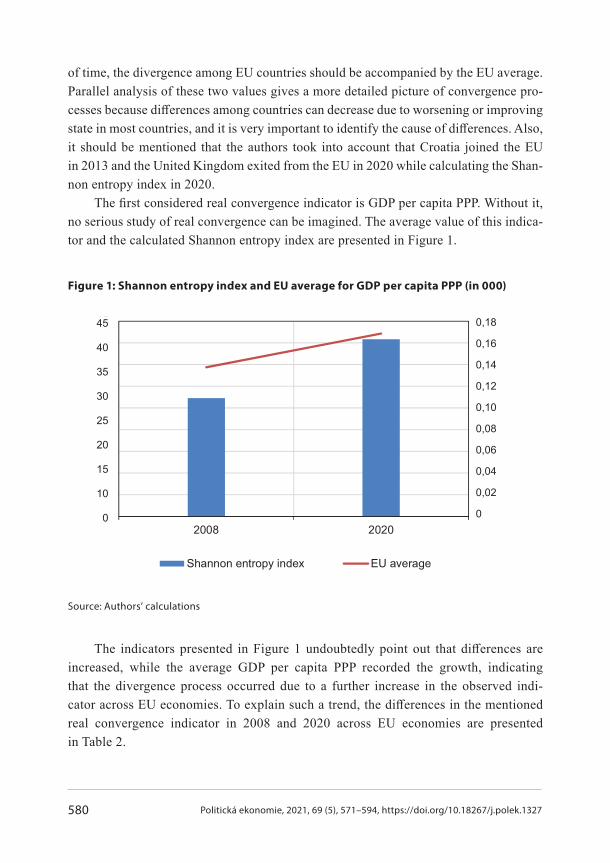
The fi rst considered real convergence indicator is GDP per capita PPP. Without it, no serious study of real convergence can be imagined. The average value of this indica-tor and the calculated Shannon entropy index are presented in Figure 1.
Figure 1: Shannon entropy index and EU average for GDP per capita PPP (in 000)
Source: Authors’ calculations
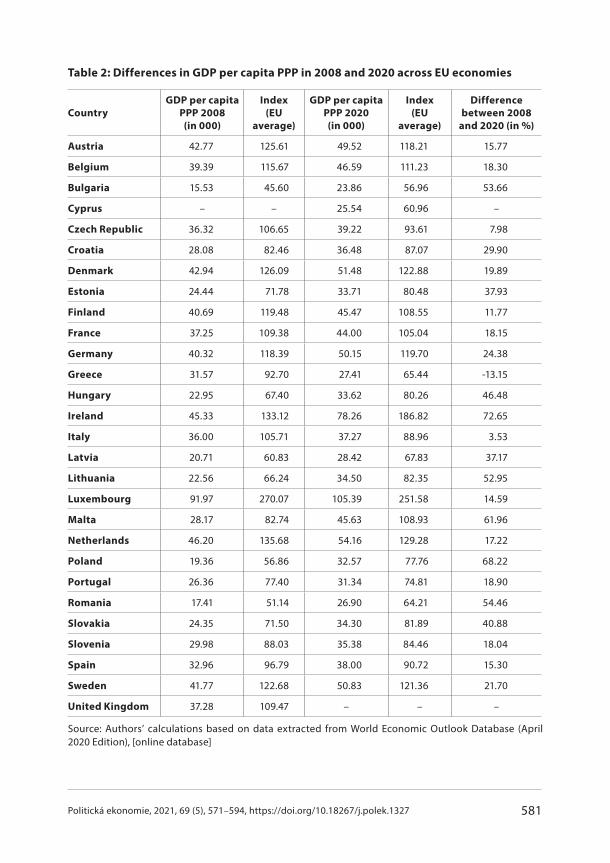
The indicators presented in Figure 1 undoubtedly point out that diff erences are increased, while the average GDP per capita PPP recorded the growth, indicating that the divergence process occurred due to a further increase in the observed indi-cator across EU economies. To explain such a trend, the diff erences in the mentioned real convergence indicator in 2008 and 2020 across EU economies are presented in Table 2.
0,18
0,16
0,14
0,12
0,10
0,08
0,06
0,04
0,02
0
45
40
35
30
25
20
15
10
0
581Politická ekonomie, 2021, 69 (5), 571–594, https://doi.org/10.18267/j.polek.1327
Table 2: Differences in GDP per capita PPP in 2008 and 2020 across EU economies
Country
GDP per capita
PPP 2008
(in 000)
Index
(EU
average)
GDP per capita
PPP 2020
(in 000)
Index
(EU
average)
Difference
between 2008
and 2020 (in %)
Austria 42.77 125.61 49.52 118.21 15.77
Belgium 39.39 115.67 46.59 111.23 18.30
Bulgaria 15.53 45.60 23.86 56.96 53.66
Cyprus – – 25.54 60.96 –
Czech Republic 36.32 106.65 39.22 93.61 7.98
Croatia 28.08 82.46 36.48 87.07 29.90
Denmark 42.94 126.09 51.48 122.88 19.89
Estonia 24.44 71.78 33.71 80.48 37.93
Finland 40.69 119.48 45.47 108.55 11.77
France 37.25 109.38 44.00 105.04 18.15
Germany 40.32 118.39 50.15 119.70 24.38
Greece 31.57 92.70 27.41 65.44 -13.15
Hungary 22.95 67.40 33.62 80.26 46.48
Ireland 45.33 133.12 78.26 186.82 72.65
Italy 36.00 105.71 37.27 88.96 3.53
Latvia 20.71 60.83 28.42 67.83 37.17
Lithuania 22.56 66.24 34.50 82.35 52.95
Luxembourg 91.97 270.07 105.39 251.58 14.59
Malta 28.17 82.74 45.63 108.93 61.96
Netherlands 46.20 135.68 54.16 129.28 17.22
Poland 19.36 56.86 32.57 77.76 68.22
Portugal 26.36 77.40 31.34 74.81 18.90
Romania 17.41 51.14 26.90 64.21 54.46
Slovakia 24.35 71.50 34.30 81.89 40.88
Slovenia 29.98 88.03 35.38 84.46 18.04
Spain 32.96 96.79 38.00 90.72 15.30
Sweden 41.77 122.68 50.83 121.36 21.70
United Kingdom 37.28 109.47 – – –
Source: Authors’ calculations based on data extracted from World Economic Outlook Database (April 2020 Edition), [online database]
582 Politická ekonomie, 2021, 69 (5), 571–594, https://doi.org/10.18267/j.polek.1327
It is interesting to emphasize that, according to data from Table 2, all the countries recorded higher GDP per capita PPP in 2020 than in 2008, except Greece, which was severely hit by the pandemic crisis. This trend explains why the EU average was much higher in 2020 than in 2008. Considering that the rate of increase varied signifi cantly across EU economies, it is not surprising that the results of the entropy method indicated an increase in diff erences in comparison to 2020. It should be noted that Austria, Belgium, Denmark, Finland, France, Germany, Ireland, Luxembourg, the Netherlands and Sweden had above-average GDP per capita PPP in both 2008 and 2020. In 2008, the Czech Repub-lic and Italy had slightly higher GDP per capita PPP than the EU average, but these coun-tries have been hit by the pandemic crisis (especially Italy), resulting in the above-average value of the mentioned indicator in 2020.
On the other hand, Malta had above-average GDP per capita PPP in 2020, although it was not the case in 2008. Although CEE and SEE countries had below-average values of this indicator, the catching-up process to EU average is evident (except in the Czech Republic and Slovenia), since the value of their GDP per capita PPP in 2020 was much closer to the EU average than in 2008. Considering data from Table 2, it could be con-cluded that there is some convergence process within this group of countries, as was sug-gested by Cieslik and Wcislik (2020).
The next real convergence indicator used in this study is the unemployment rate, one of the indicators most commonly used in convergence analysis. The value of the Shannon entropy index and the EU average are presented in Figure 2.
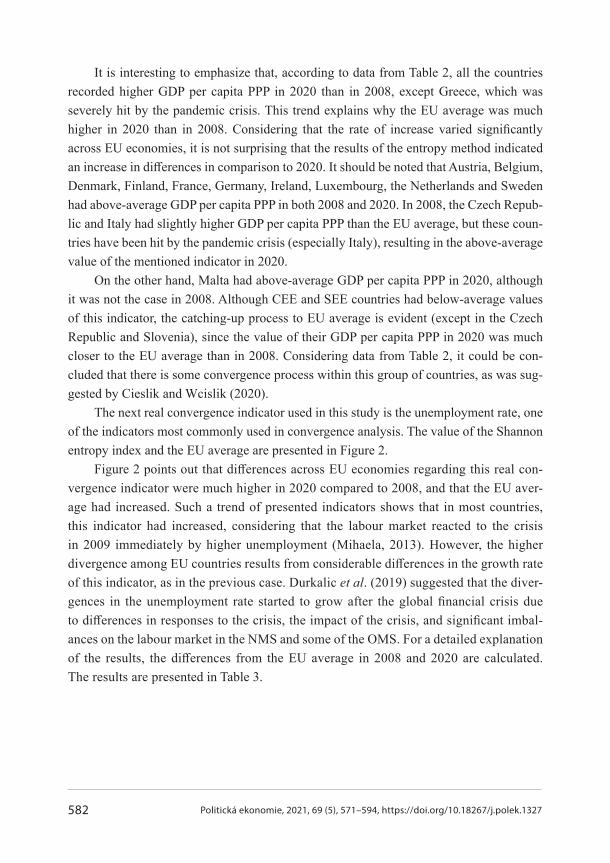
Figure 2 points out that diff erences across EU economies regarding this real con-vergence indicator were much higher in 2020 compared to 2008, and that the EU aver-age had increased. Such a trend of presented indicators shows that in most countries, this indicator had increased, considering that the labour market reacted to the crisis in 2009 immediately by higher unemployment (Mihaela, 2013). However, the higher divergence among EU countries results from considerable diff erences in the growth rate of this indicator, as in the previous case. Durkalic et al. (2019) suggested that the diver-gences in the unemployment rate started to grow after the global fi nancial crisis due to diff erences in responses to the crisis, the impact of the crisis, and signifi cant imbal-ances on the labour market in the NMS and some of the OMS. For a detailed explanation of the results, the diff erences from the EU average in 2008 and 2020 are calculated. The results are presented in Table 3.

583Politická ekonomie, 2021, 69 (5), 571–594, https://doi.org/10.18267/j.polek.1327
Figure 2: Shannon entropy index and EU average for unemployment rate (in %)
Source: Authors’ calculations
The fi rst glance at Table 3 indicates a larger number of countries where the unemploy-ment rate was above the EU average in 2008 than in 2020, and most of them were Western European countries. However, in 2020, several countries, such as Croatia, Greece, Ireland, Italy, Portugal and Spain, had a considerably higher unemployment rate than the EU aver-age, which signifi cantly contributed to the increasing Shannon entropy index. It can be explained, as was suggested by Mayer and Schnabl (2020), by the fact that the Southern EMU countries have been hit stronger by the pandemic crisis than the Northern countries because they rely signifi cantly on tourism and have a higher share of small and medi-um-sized enterprises than the northern ones, their competitiveness declining even further. Besides them, France, Romania and Sweden also recorded a two-digit unemployment rate. It is also interesting to note that some countries succeeded in recording a lower unem-ployment rate in 2020 than in 2008, notably Germany, Hungary, Malta and Slovakia. Hungary recorded the lowest unemployment rate among CEE and SEE countries, while Germany was the best performer in that sense if all EU countries are considered.
The last considered indicator is the current account balance, which is a very impor-tant indicator, especially during crisis times. In that sense, the Shannon entropy index and the EU average for this indicator are presented in Figure 3.
9
8
7
6
5
4
3
2
1
0
0,20
0,18
0,16
0,14
0,12
0,10
0,08
0,06
0,04
0,02
0
584 Politická ekonomie, 2021, 69 (5), 571–594, https://doi.org/10.18267/j.polek.1327
Table 3: Differences in unemployment rate in 2008 and 2020 across EU economies
Country 2008Index (EU
average)2020
Index (EU
average)
Difference
between 2008
and 2020 (in %)
Austria 4.09 65.38 5.50 58.43 34.41
Belgium 6.97 111.31 7.30 77.55 4.78
Bulgaria 5.66 90.49 8.00 84.99 41.24
Croatia – – 11.50 122.17 –
Cyprus 3.65 58.32 8.82 93.74 141.75
Czech Republic 4.38 70.00 7.50 79.67 71.19
Denmark 3.72 59.39 6.50 69.05 74.87
Estonia 5.46 87.15 6.00 63.74 9.99
Finland 6.43 102.65 8.27 87.80 28.64
France 7.46 119.16 10.40 110.46 39.42
Germany 7.38 117.96 3.89 41.28 −47.37
Greece 7.75 123.82 22.33 237.19 188.10
Hungary 7.82 124.88 5.40 57.31 −30.97
Ireland 6.80 108.64 12.11 128.64 78.07
Italy 6.74 107.72 12.70 134.91 88.37
Latvia 7.74 123.69 8.00 84.99 3.33
Lithuania 5.83 93.10 8.90 94.55 52.74
Luxembourg 4.14 66.18 7.72 81.98 86.31
Malta 5.98 95.46 5.00 53.12 −16.32
Netherlands 3.66 58.52 6.50 69.05 77.45
Poland 7.12 113.74 9.92 105.37 39.33
Portugal 7.55 120.66 13.94 148.09 84.59
Romania 5.54 88.58 10.10 107.29 82.18
Slovakia 9.59 153.25 8.02 85.16 −16.43
Slovenia 4.40 70.30 9.00 95.61 104.55
Spain 11.25 179.66 20.80 220.97 84.98
Sweden 6.17 98.53 10.06 106.91 63.19
United Kingdom 5.725 91.47 – – –
Source: Authors‘ calculations based on data extracted from World Economic Outlook Database (April 2020 Edition), [online database]

585Politická ekonomie, 2021, 69 (5), 571–594, https://doi.org/10.18267/j.polek.1327
Figure 3: Shannon entropy index and EU average for current account balance
(% of GDP)
Source: Authors‘ calculations
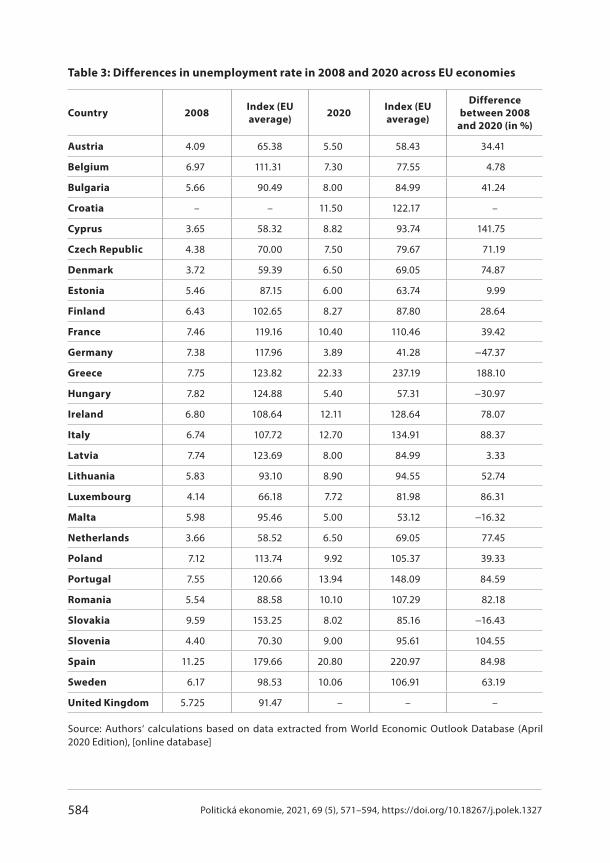
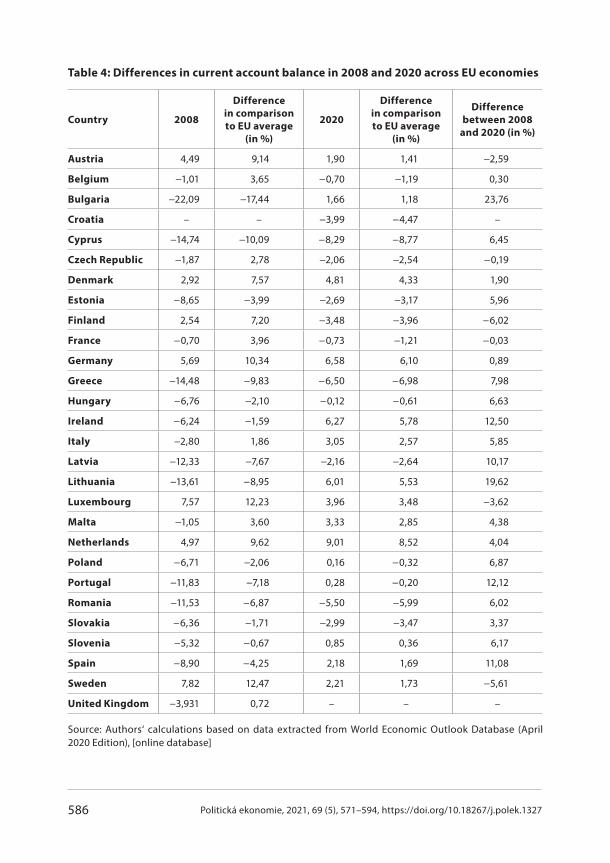
The results presented in Figure 3 indicate that, in contrast to the global fi nancial crisis characterized by a signifi cant average defi cit at the EU level and relatively lower diff erences across EU countries, the pandemic crisis resulted in much more pronounced diff erences and low average surplus. This means that most countries faced with high defi -cits in 2008 had changed their trade position from net importers to net exporters by 2020. However, the value of the current account balance varied considerably across EU mem-bers. Table 4 presents the current account balance in 2008 and 2020 across EU econo-mies and comparisons to the EU average to enable deeper analysis of changes between the emergences of the observed crises.
The data in Table 4 show that many EU economies recorded high current account defi cits, especially Bulgaria, Cyprus, Greece, Latvia, Lithuania, Portugal and Romania, where two-digit defi cits were recorded. On the other hand, Austria, Denmark, Finland, Germany, Luxembourg, the Netherlands and Sweden were the rare countries achiev-ing a current account surplus. It is interesting to note that all CEE and SEE economies recorded current account defi cits. It can be explained by a sudden stop in demand in these countries, which contracted current transactions and a reduced the infl ow of FDI. In con-trast to the global fi nancial crisis, the pandemic crisis had a considerably diff erent eff ect on current account balance across EU economies. Most of them recorded current account surpluses and those that recorded defi cits, did not face defi cits as high as in 2008. Several countries, such as Bulgaria, Ireland, Italy, Lithuania, Malta, Slovenia and Spain, managed to balance their current account or recorded a relatively high surplus in 2020.
2
1
0
–1
2
3
4
5
0,20
0,18
0,16
0,14
0,12
0,10
0,08
0,06
0,04
0,02
0
Shannon entropy index ––– EU average
586 Politická ekonomie, 2021, 69 (5), 571–594, https://doi.org/10.18267/j.polek.1327
Table 4: Differences in current account balance in 2008 and 2020 across EU economies
Country 2008
Difference
in comparison
to EU average
(in %)
2020
Difference
in comparison
to EU average
(in %)
Difference
between 2008
and 2020 (in %)
Austria 4,49 9,14 1,90 1,41 −2,59
Belgium −1,01 3,65 −0,70 −1,19 0,30
Bulgaria −22,09 −17,44 1,66 1,18 23,76
Croatia – – −3,99 −4,47 –
Cyprus −14,74 −10,09 −8,29 −8,77 6,45
Czech Republic −1,87 2,78 −2,06 −2,54 −0,19
Denmark 2,92 7,57 4,81 4,33 1,90
Estonia −8,65 −3,99 −2,69 −3,17 5,96
Finland 2,54 7,20 −3,48 −3,96 −6,02
France −0,70 3,96 −0,73 −1,21 −0,03
Germany 5,69 10,34 6,58 6,10 0,89
Greece −14,48 −9,83 −6,50 −6,98 7,98
Hungary −6,76 −2,10 −0,12 −0,61 6,63
Ireland −6,24 −1,59 6,27 5,78 12,50
Italy −2,80 1,86 3,05 2,57 5,85
Latvia −12,33 −7,67 −2,16 −2,64 10,17
Lithuania −13,61 −8,95 6,01 5,53 19,62
Luxembourg 7,57 12,23 3,96 3,48 −3,62
Malta −1,05 3,60 3,33 2,85 4,38
Netherlands 4,97 9,62 9,01 8,52 4,04
Poland −6,71 −2,06 0,16 −0,32 6,87
Portugal −11,83 −7,18 0,28 −0,20 12,12
Romania −11,53 −6,87 −5,50 −5,99 6,02
Slovakia −6,36 −1,71 −2,99 −3,47 3,37
Slovenia −5,32 −0,67 0,85 0,36 6,17
Spain −8,90 −4,25 2,18 1,69 11,08
Sweden 7,82 12,47 2,21 1,73 −5,61
United Kingdom −3,931 0,72 – – –
Source: Authors‘ calculations based on data extracted from World Economic Outlook Database (April 2020 Edition), [online database]
587Politická ekonomie, 2021, 69 (5), 571–594, https://doi.org/10.18267/j.polek.1327
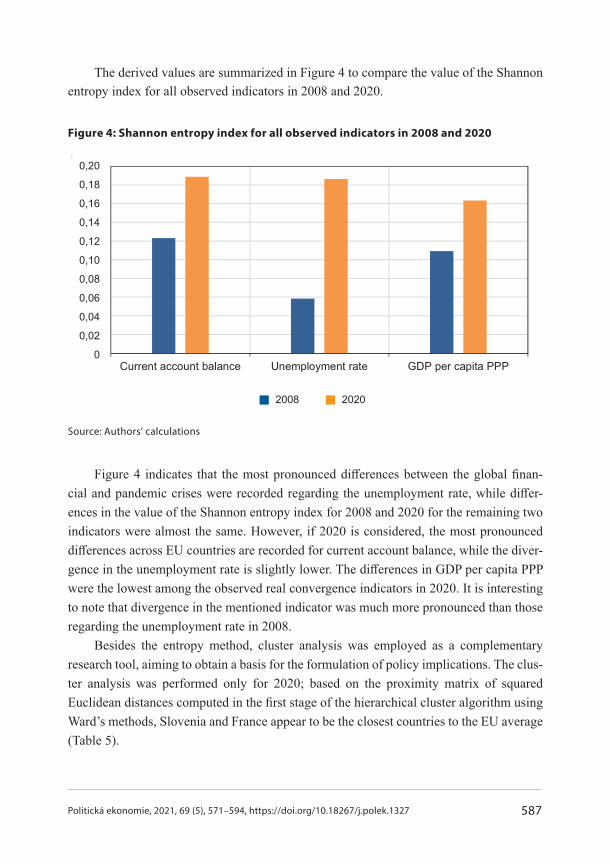
The derived values are summarized in Figure 4 to compare the value of the Shannon entropy index for all observed indicators in 2008 and 2020.
Figure 4: Shannon entropy index for all observed indicators in 2008 and 2020
Source: Authors’ calculations
Figure 4 indicates that the most pronounced diff erences between the global fi nan-cial and pandemic crises were recorded regarding the unemployment rate, while diff er-ences in the value of the Shannon entropy index for 2008 and 2020 for the remaining two indicators were almost the same. However, if 2020 is considered, the most pronounced diff erences across EU countries are recorded for current account balance, while the diver-gence in the unemployment rate is slightly lower. The diff erences in GDP per capita PPP were the lowest among the observed real convergence indicators in 2020. It is interesting to note that divergence in the mentioned indicator was much more pronounced than those regarding the unemployment rate in 2008.
Besides the entropy method, cluster analysis was employed as a complementary research tool, aiming to obtain a basis for the formulation of policy implications. The clus-ter analysis was performed only for 2020; based on the proximity matrix of squared Euclidean distances computed in the fi rst stage of the hierarchical cluster algorithm using Ward’s methods, Slovenia and France appear to be the closest countries to the EU average (Table 5).
0,20
0,18
0,16
0,14
0,12
0,10
0,08
0,06
0,04
0,02
0
2008 2020

588 Politická ekonomie, 2021, 69 (5), 571–594, https://doi.org/10.18267/j.polek.1327
Table 5: Rankings of countries by dissimilarities in comparison to EU average 2020
(initial squared Euclidian distances between countries, rescaled)
Country
Initial squared
Euclidian distances
(EU-27)
Country
Initial squared
Euclidian distances
(EU-27)
Slovenia 0.008 Estonia 0.079
France 0.008 Malta 0.086
Poland 0.015 Denmark 0.100
Belgium 0.021 Lithuania 0.112
Sweden 0.022 Croatia 0.122
Czech Republic 0.037 Romania 0.156
Slovakia 0.055 Germany 0.223
Italy 0.058 Cyprus 0.259
Finland 0.058 Netherlands 0.289
Latvia 0.058 Ireland 0.329
Hungary 0.060 Spain 0.394
Austria 0.060 Luxembourg 0.649
Bulgaria 0.061 Greece 0.687
Portugal 0.078 Median distance 0.078
Source: Elaborated by the authors based on IBM SPSS output
Table 5 also indicates the interesting trend of the real convergence process in the EU regarding the position of the New Member States (NMS) and Old Member States (OMS). Namely, most NMS are near or relatively near the EU average. Seven of them even have an initial squared Euclidian distance lower than the median value. Only Estonia, Malta, Croatia, Romania and Cyprus are relatively far from the EU average, but not as far as the fi ve OMS positioned at the end of the rankings (the Netherlands, Ireland, Spain, Luxemburg and Greece).
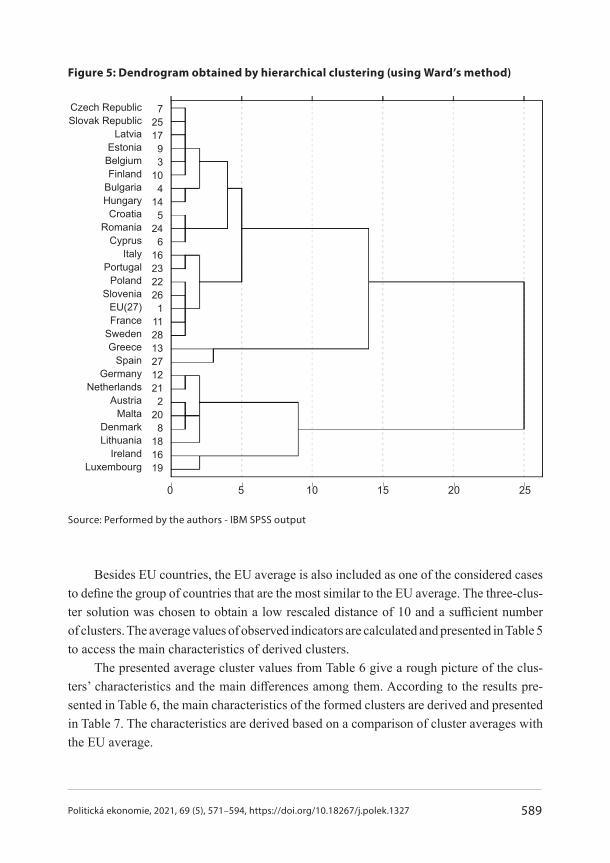
Nevertheless, the data in Table 5 give just the fi rst insight into the position of Member States concerning the EU average. However, for detailed insight into characteristics of EU economies, the cluster analysis was performed using the HAC algorithm with Ward’s method, and the results are presented in Figure 5.
589Politická ekonomie, 2021, 69 (5), 571–594, https://doi.org/10.18267/j.polek.1327
Figure 5: Dendrogram obtained by hierarchical clustering (using Ward’s method)
Source: Performed by the authors - IBM SPSS output
Besides EU countries, the EU average is also included as one of the considered cases to defi ne the group of countries that are the most similar to the EU average. The three-clus-ter solution was chosen to obtain a low rescaled distance of 10 and a suffi cient number of clusters. The average values of observed indicators are calculated and presented in Table 5to access the main characteristics of derived clusters.
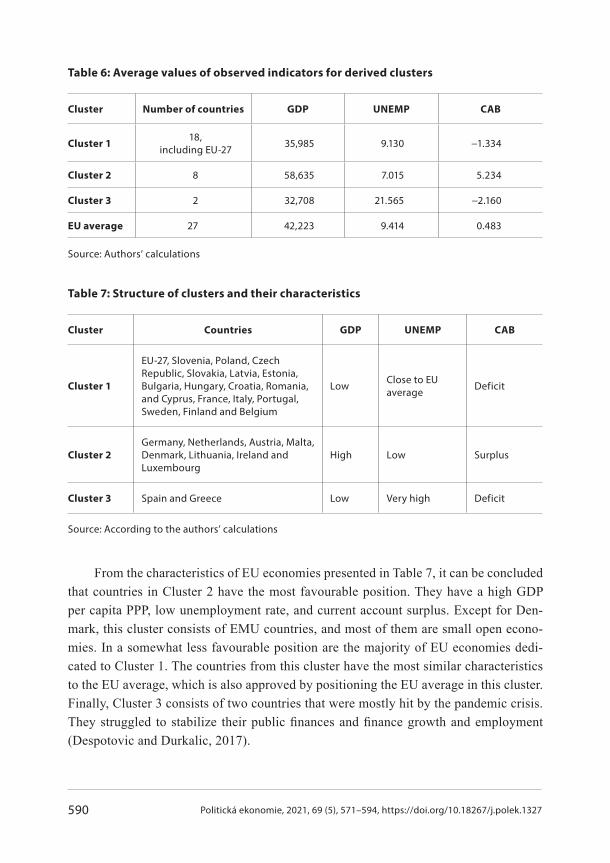
The presented average cluster values from Table 6 give a rough picture of the clus-ters’ characteristics and the main diff erences among them. According to the results pre-sented in Table 6, the main characteristics of the formed clusters are derived and presented in Table 7. The characteristics are derived based on a comparison of cluster averages with the EU average.
72517
93
104
145
246
16232226
1112813271221
220
8181619
Czech RepublicSlovak Republic
LatviaEstoniaBelgiumFinland
BulgariaHungary
CroatiaRomania
CyprusItaly
PortugalPoland
SloveniaEU(27)France
SwedenGreece
SpainGermany
NetherlandsAustria
MaltaDenmarkLithuania
IrelandLuxembourg
0 5 10 15 20 25
590 Politická ekonomie, 2021, 69 (5), 571–594, https://doi.org/10.18267/j.polek.1327
Table 6: Average values of observed indicators for derived clusters
Cluster Number of countries GDP UNEMP CAB
Cluster 118,
including EU-27 35,985 9.130 −1.334
Cluster 2 8 58,635 7.015 5.234
Cluster 3 2 32,708 21.565 −2.160
EU average 27 42,223 9.414 0.483
Source: Authors’ calculations
Table 7: Structure of clusters and their characteristics
Cluster Countries GDP UNEMP CAB
Cluster 1
EU-27, Slovenia, Poland, Czech Republic, Slovakia, Latvia, Estonia, Bulgaria, Hungary, Croatia, Romania, and Cyprus, France, Italy, Portugal, Sweden, Finland and Belgium
Low Close to EU average Deficit
Cluster 2
Germany, Netherlands, Austria, Malta, Denmark, Lithuania, Ireland and Luxembourg
High Low Surplus
Cluster 3 Spain and Greece Low Very high Deficit
Source: According to the authors’ calculations
From the characteristics of EU economies presented in Table 7, it can be concluded that countries in Cluster 2 have the most favourable position. They have a high GDP per capita PPP, low unemployment rate, and current account surplus. Except for Den-mark, this cluster consists of EMU countries, and most of them are small open econo-mies. In a somewhat less favourable position are the majority of EU economies dedi-cated to Cluster 1. The countries from this cluster have the most similar characteristics to the EU average, which is also approved by positioning the EU average in this cluster. Finally, Cluster 3 consists of two countries that were mostly hit by the pandemic crisis. They struggled to stabilize their public fi nances and fi nance growth and employment (Despotovic and Durkalic, 2017).

591Politická ekonomie, 2021, 69 (5), 571–594, https://doi.org/10.18267/j.polek.1327
4. Policy Implications
The results of the empirical analysis suggest a considerably diff erent, cluster-depend-ent approach to economic policy measures. Accordingly, the economies from Cluster 2 demonstrate a high degree of resilience when faced with the negative eff ects of the current pandemic. Like in other countries, although their governments had to undertake large fi scal stimulation packages to prevent much serious economic recession, these measures do not appear to worsen the value of the real convergence indicators. Having relatively stable and favourable economic conditions at the onset of the ongoing crisis, these countries could respond to the shock using much more aggressive stimulation measures. Among many examples, one can mention the state-sponsored work-sharing schemes aimed at saving jobs implemented in Germany (so-called Kurzarbeit). This social insurance programme eff ectively kept employment stable during the 2008 economic crisis, but its importance in times of pandemic seems to be much more profound.
However, it must be stressed that these measures inevitably deteriorate the budget balance and increase government debt. Although these indicators represent the domain of the nominal convergence, they aff ect the employment dynamics and economic growth, as well as the current account balance, suggesting the implementation of a much more complex approach to economic policy management. Of course, pursuing fi scal policies aimed at achieving prudent fi scal positions and debt sustainability is particularly important and should be implemented when economic conditions allow.
The countries in Cluster 3 (Spain and Greece) are faced with signifi cant deterioration of all real convergence indicators. These economies had already been in an unfavourable position due to high unemployment rates and current account defi cits, which are seriously worsened due to the pandemic. Bearing in mind that these countries rely signifi cantly on tourism revenues, implementing eff ective policy measures directed to employ-ment preservation and support of the tourism sector is of utmost importance. The role of employment and social services in supporting workers and employers is very signif-icant and should be based on introducing some forms of fl exicurity. This model could improve the fl exibility of the labour market, but during the pandemic crisis, it should be complemented by programmes aimed at achieving employment security, especially in contact-intensive activities which are particularly hit by the crisis. In the medium term, the combination of diff erent active labour market policies directed to employa-bility improvement should also be used. However, the key limitation for applying these measures lies in the chronic public fi nance misbalance in these countries, narrowing the space for more determined action aimed at unemployment rate reduction.
592 Politická ekonomie, 2021, 69 (5), 571–594, https://doi.org/10.18267/j.polek.1327
Cluster 1 is rather heterogeneous and comprises the New EU Member States (which joined the EU in 2004, 2007 and 2013) and the Old Member States, among which there are several European Monetary Union (EMU) members. The lack of monetary sovereignty in EMU members limits the space for implementing monetary policy measures that could boost economic activity and employment without the risk of overreaching the infl ation targets. This is a markedly serious obstacle in economies severely hit by the pandemic, such as Italy and Belgium. However, independent monetary policies can be implemented in most of the countries in Cluster 1. Given the very low interest rates, central banks in those countries should turn to unconventional monetary policy tools, such as large-scale asset purchases. The key importance of these tools is refl ected in stimulating private investment activity to boost growth in sectors with the largest potential regarding employ-ment promotion.
Bearing in mind the uncertain prospects of the current pandemic crisis, the economic policy approach for all countries should generally be based on expansionary fi scal policy, mainly on a discretionary basis, along with a frequent assessment of the budget balance stance. These measures should tackle aggregate demand, stimulate business activity and boost aggregate supply to prevent a signifi cant decrease in the GDP per capita. Finally, when the pandemic is over, the governments of all the countries, especially in Clusters 1 and 3, should exploit all capacities to boost economic growth to reach the pre-crisis GDP levels as fast as possible. More importantly, that growth should be dynamic enough and sustainable to improve the real convergence process.
Conclusion
The COVID-19 pandemic represents a public health crisis, testing the EU’s collective capac-ity to respond to such a devasting economic shock and ensure convergence among EU econ-omies. The EU leaders fi nd themselves faced with considerable imbalances in the epidemic conditions because the revenues of economic entities operating in EU economies have reg-istered a signifi cant drop. On the other hand, their expenditures regarding communal ser-vices, business premises rent, salaries, taxes and suchlike have remained almost the same. Such a situation can lead, if it is not well handled, to mass bankruptcies, unemployment growth and the occurrence of a sovereign debt crisis. Hence, it is not surprising that the ECB and national central banks have made signifi cant eff orts to add additional liquidity, aiming to support companies and banks to overcome a sharp drop in income and reduce the number of bankruptcies and jobs closed.
The vulnerability of EU economies depends on many factors, such as the GDP structure, the share of workers with permanent contracts in total employment, the level of the shadow economy, stability of public fi nances and ability of governments to implement effi cient

593Politická ekonomie, 2021, 69 (5), 571–594, https://doi.org/10.18267/j.polek.1327
recovery measures. Keeping in mind that the EU Member States are still very diff erent in these respects, it is realistic to expect that the real convergence process, which is a crucial driver of the EU’s sustainable functioning, will be hampered.
The entropy method employed in this study enabled drawing of some general conclu-sions on real convergence processes in the EU. The results pointed out that diff erences in all the observed indicators in 2020 were higher than in 2008. The most pronounced divergence process is recorded regarding the current account balance, followed by the unemployment rate, where diff erences were slightly lower. Finally, the diff erences in GDP per capita PPP were the lowest but still higher than in 2008.
The cluster analysis resulted in 3 clusters. The EU countries in the fi rst cluster (which is the most numerous) have similar performance characteristics as the EU. Those in Cluster 2are the best performers, and those from the third cluster are the most aff ected by the crisis. The diff erences among EU countries are still present, and the European Commission should adjust measures to conditions in each particular group of countries to ensure real conver-gence in the future.
The COVID-19 crisis will raise fundamental questions about how to manage real convergence processes. The current crisis will lead to a deepening of economic diff er-ences between the NMS and OMS and between the Northern and the Southern economies. The Southern EU member states will be more aff ected economically, while the Northern members, especially the old ones, will emerge from the crisis faster and become even stronger economically.
The emergence of the pandemic has put the governments and institutions of the Euro-pean Union into chaos. Each EU country has introduced a diff erent set of recovery meas-ures, which has resulted in mixed economic results. Coordinated and comprehensive action is the essence of the EU future and, according to that, the most effi cient way to overcome the crisis and narrow the gaps among national economies is facing recession together. Taken together, the EU is the strongest economic bloc in the world and can decisively shape eco-nomic policy in the future.
References
Albu, L. L. (2012). Structural Convergence in European Union. Annals-Economy Series, Constantin Brancusi University, Faculty of Economics, 4, 1–10.
Alcidi, C., Núñez Ferrer, J., Di Salvo, M., et al. (2018). Income Convergence in the EU: A Tale of Two Speeds. CEPS Commentary, 9, 1–7.
Arce, Ó., Kataryniuk, I., Marín, P., et al. (2020). Thoughts on the Design of a European Recovery Fund. Madrid Banco de España. Occasional Paper No. 2014, https://doi.org/10.2139/ssrn.3611597
594 Politická ekonomie, 2021, 69 (5), 571–594, https://doi.org/10.18267/j.polek.1327
Bacher, J. (2002). Cluster Analysis. Script. Nuremberg. Available at: https://www.clusteranalyse.net/sonstiges/zaspringseminar2002/lecturenotes.pdf
Bisciari, P., Essers, D., Vincent, E. (2020). Does the EU Convergence Machine Still Work, and How will the Covid-19 Crisis Impact It? SUERF. Policy Note Issue No. 172. Available at: https://www.suerf.org/policynotes/14129/does-the-eu-convergence-machine-still-work-and-how-will-the-covid-19-crisis-impact-it
Cieślik, A., Wciślik, D. R. (2020). Convergence among the CEE-8 Economies and Their Catch-up Towards the EU-15. Structural Change and Economic Dynamics, 55, 39–48, https://doi.org/10.1016/j.strueco.2020.07.006
Coutinho, L., Turrini, A. (2020). Real Convergence Across the Euro Area. Intereconomics, 55(5), 301–311, https://doi.org/10.1007/s10272-020-0920-2
Czyż, T., Hauke, J. (2015). Entropy in Regional Analysis. Quaestiones Geographicae, 34(4), 69–78, https://doi.org/10.1515/quageo-2015-0037
Despotović, D., Durkalić, D. (2017). Analysis of Budget Deficit in the Candidate Countries for EU Membership. Serbian Journal of Management, 12(2), 237–253, https://doi.org/10.5937/sjm12-14122
Diaz del Hoyo, J. L., Dorrucci, E., Heinz, F. F., et al. (2017). Real Convergence in the Euro Area: A Long-term Perspective. Frankfurt European Central Bank. ECB Occasional Paper Series No. 203.
Durkalić, D., Fedajev, A., Furtula, S., et al. (2019). The Measurement of Real Convergence in the EU-28 by Using the Entropy Method 1. Ekonomicky Casopis, 67(7), 698–724.
Ferreiro, J., Gálvez, C., Gómez, C., et al. (2017). Economic Crisis and Convergence in the Eurozone Countries. Panoeconomicus, 64(2), 223–244, https://doi.org/10.2298/pan1702223f
IMF (2020). World Economic Outlook Database (April 2020 Edition). Washington, D.C.: IMF. Available at: https://www.imf.org/external/pubs/ft/weo/2020/01/weodata/index.aspx
König, M., Winkler, A. (2020). COVID-19 and Economic Growth: Does Good Government Performance Pay Off? Intereconomics, 55(4), 224–231, https://doi.org/10.1007/s10272-020-0906-0
Malliaris, A. G., Malliaris, M. (2020). The Impact of the Twin Financial Crises. Journal of Policy Modeling, 42(4), 878–892, https://doi.org/10.1016/j.jpolmod.2020.03.011
Mayer, T., Schnabl, G. (2020). Post-COVID-19 EMU: Economic Distancing by Parallel Currencies. Intereconomics, 55(6), 387–391, https://doi.org/10.1007/s10272-020-0939-4
Mihaela, B. S. (2013). Improvements in Assessing the Forecasts Accuracy-a Case Study for Romanian Macroeconomic Forecasts. Serbian Journal of Management, 8(1), 53–65, https://doi.org/10.5937/sjm8-3235
Młynarzewska-Borowiec, I. (2017). Neoclassical and Technological Catching-up as the Channels of the Real Convergence Process in the European Union. International Journal of Business and Economic Sciences Applied Research (IJBESAR), 10(2), 7–18, https://doi.org/10.25103/ijbesar.102.01
Simionescu-Bratu, M. (2014) The Economic Convergence in European Union Based on Concentration and Entropy Approach. EuroEconomica, 33(1), 31–42.