Embed Size (px)
DESCRIPTION
Study presentation by Dr KABERA René at Tulane University Head Office in Kigali 11th July 2012.Family and Community Medicine-National University of Rwanda
Citation preview

National University of Rwanda Family and Community Medicine
Efficacy of Home Based Management of Malnutrition Using Ready to Use
Therapeutic Food in RwandaMuhanga District
Dr KABERA René Supervisor Prof Munyanshongore Cyprien
Kigali,11 July 2012

Plan
Introduction Objective Justification Methodology Results Conclusion and Recommendations Acknowledgement

Introduction
The Management of severe and moderate malnutrition in emergencies includes setting up Therapeutic Feeding Centers (TFCs) in Hospitals.
Recovery and clinical outcomes in TFCs managed by experienced agencies has been positive.
TFCs are difficult to establish, expensive to operate, and they often have very limited coverage.
Introduction
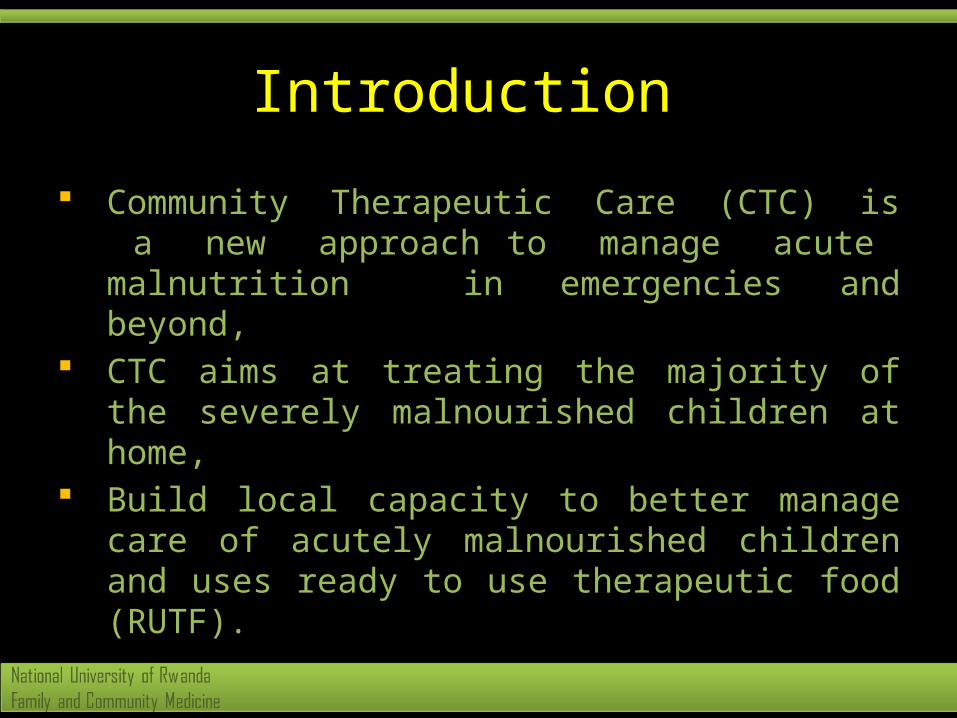
Community Therapeutic Care (CTC) is a new approach to manage acute malnutrition in emergencies and beyond,
CTC aims at treating the majority of the severely malnourished children at home,
Build local capacity to better manage care of acutely malnourished children and uses ready to use therapeutic food (RUTF).
Objective
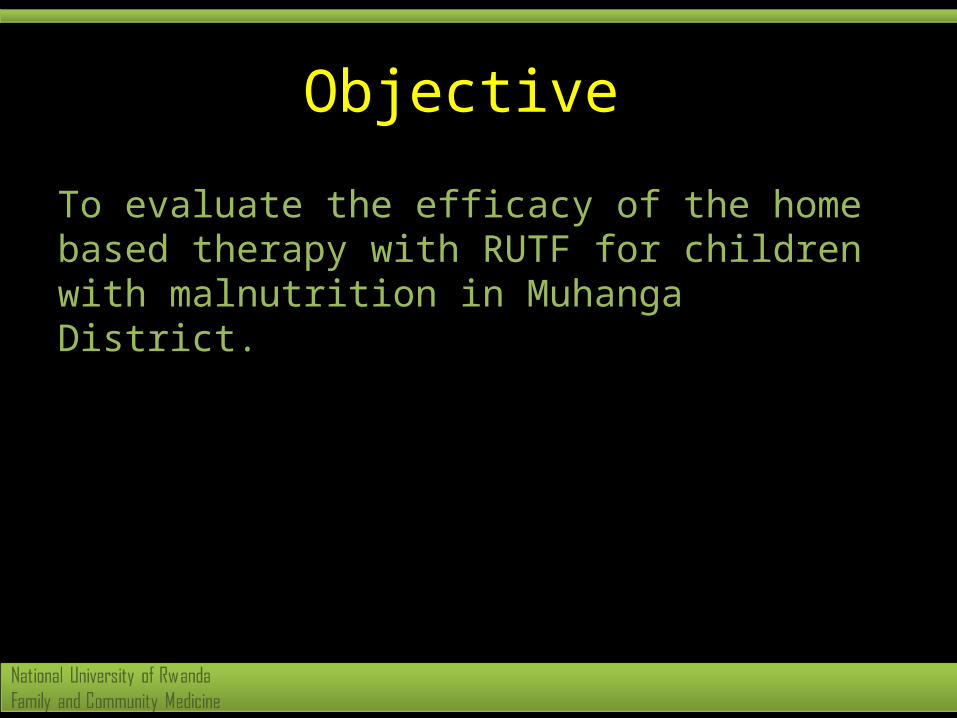
To evaluate the efficacy of the home based therapy with RUTF for children with malnutrition in Muhanga District.
Justification
Malnutrition is among the most common disease condition in our daily medical practice.
Many Health Centers have been using the classic F-75 and F-100 (liquid) for treating malnutrition.
Input from the new management with RUTF has brought to our system.

Methodology
Study design • The study is a controlled, comparative
clinical effectiveness trial • Comparing a group of children (12-60
months) treated with RUTF versus the standard management of malnutrition in TFCs without medical complications.
• From May to October 2011
Methodology
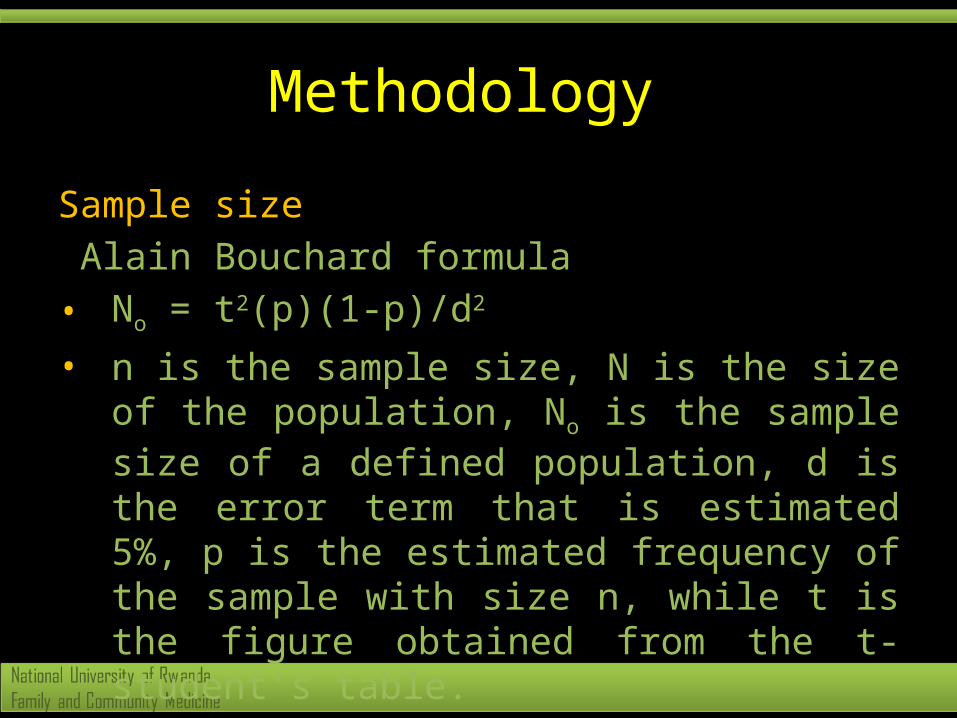
Sample size Alain Bouchard formula • No = t2(p)(1-p)/d2
• n is the sample size, N is the size of the population, No is the sample size of a defined population, d is the error term that is estimated 5%, p is the estimated frequency of the sample with size n, while t is the figure obtained from the t-student's table.
• Our population is 125 children

Table of Alain Bouchard Population
infinie
Précision
90% 95% 99%
Marge
d’erreur
±10% ±5% ±1% ±10% ±5% ±1% ±10% ±5% ±1%
1000000 68 271 6.765 96 384 9.604 166 661 16.589
500000 68 271 6.720 96 384 9.513 166 663 16.589
100 000 68 270 6.336 96 383 8.763 166 659 14.229
50 000 68 269 5.999 95 381 8.057 165 655 12.459
10 000 67 263 4.035 95 370 4.899 165 622 6.239
5 000 67 257 2.875 94 357 3.288 161 586 3.442
1 000 63 313 871 88 278 906 142 399 943
5 00 60 176 281 94 357 328 161 586 344
100 41 73 99 49 80 99 63 87 99
50 29 42 50 33 40 50 39 47 50

Methodology Materials • A Questionnaire • Data entry with Epi-Data 3.1 software• Microsoft Word 2010 for texts • Microsoft Excel 2010 for tables. • SPSS 20 for analysis • WHO Anthro II software for Z Scores • The difference is statistically significant if
p<0.05 for the Pearson test.
Methodology
Utilization of expected findings • Figures from the study will show a clear
image of the Home based management of malnutrition in Muhanga District.
• Stakeholders can utilize our study as tool in making some decisions for improving the system and prepare a study including many sites in Rwanda.

Results
Variables Frequency Percent
Group
F100 58 46.4
RTUF 67 53.6
Total 125 100
Results
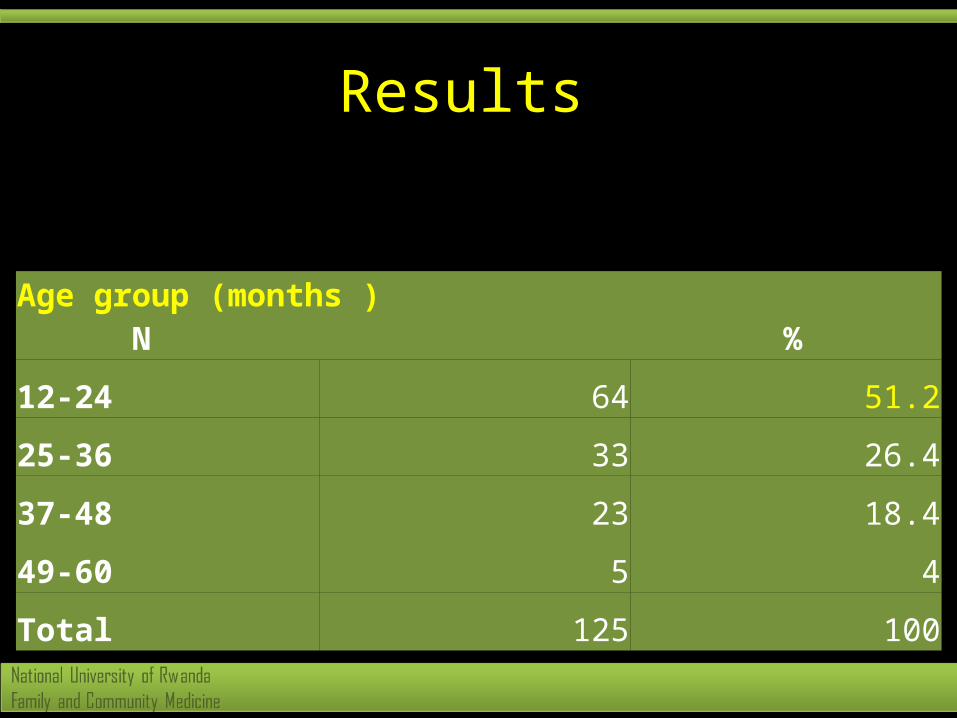
Age group (months ) N %
12-24 64 51.2
25-36 33 26.4
37-48 23 18.4
49-60 5 4
Total 125 100
Results
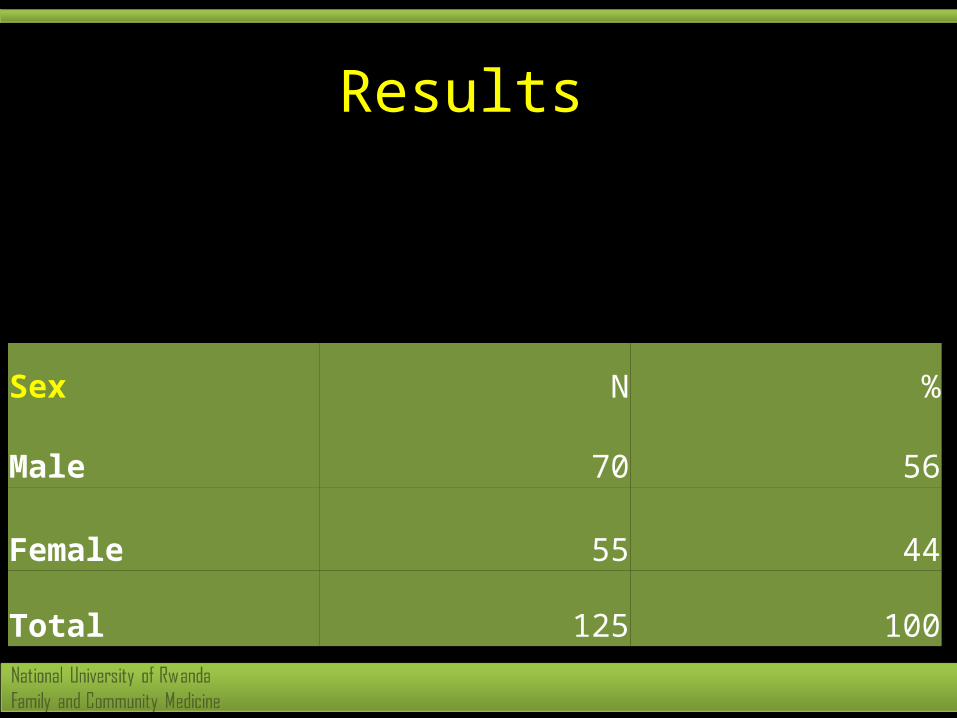
Sex N %
Male 70 56
Female 55 44
Total 125 100
Results
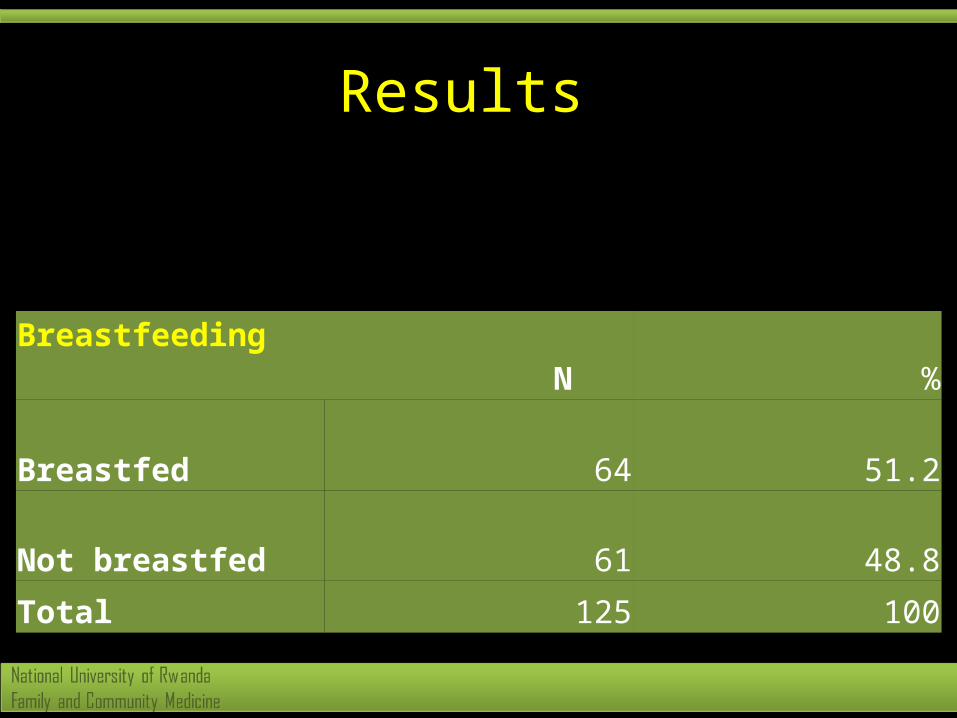
Breastfeeding N %
Breastfed 64 51.2
Not breastfed 61 48.8
Total 125 100

Results
Malnutrition N %
Moderate 62 49.6
Severe 63 50.4
Total 125 100
Results
Outcome
Group population Pearson Chi- square
P value
F100 RUTF
% %
Recovered
Failed
Referred
Dropped out
Total
77.5 (45)
12 (7)
5.1 (3)
5.1 (3)
100 (58)
88 (59)
0 (0)
4.5 (3)
7.5 (5)
100 (67)
8782
100%(125)
0.032
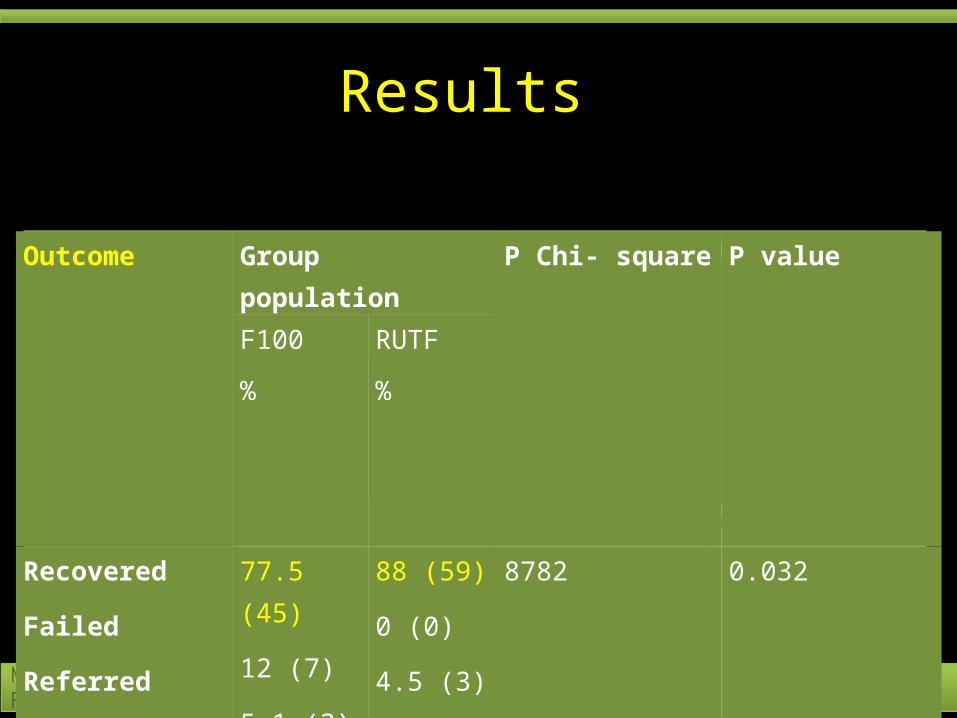
Outcome
Group population
P Chi- square
P value
F100 RUTF
% %
Recovered
Failed
Referred
Dropped out
Total
77.5 (45)
12 (7)
5.1 (3)
5.1 (3)
100 (58)
88 (59)
0 (0)
4.5 (3)
7.5 (5)
100 (67)
8782
100 (125)
0.032

Results
Gp population P Chi-Square P value
F100 RTUFRehab. pd(days)<15
15-30
>30
Total
3
37
12
52
1
58
0
59
17.269
111
0.001
Results
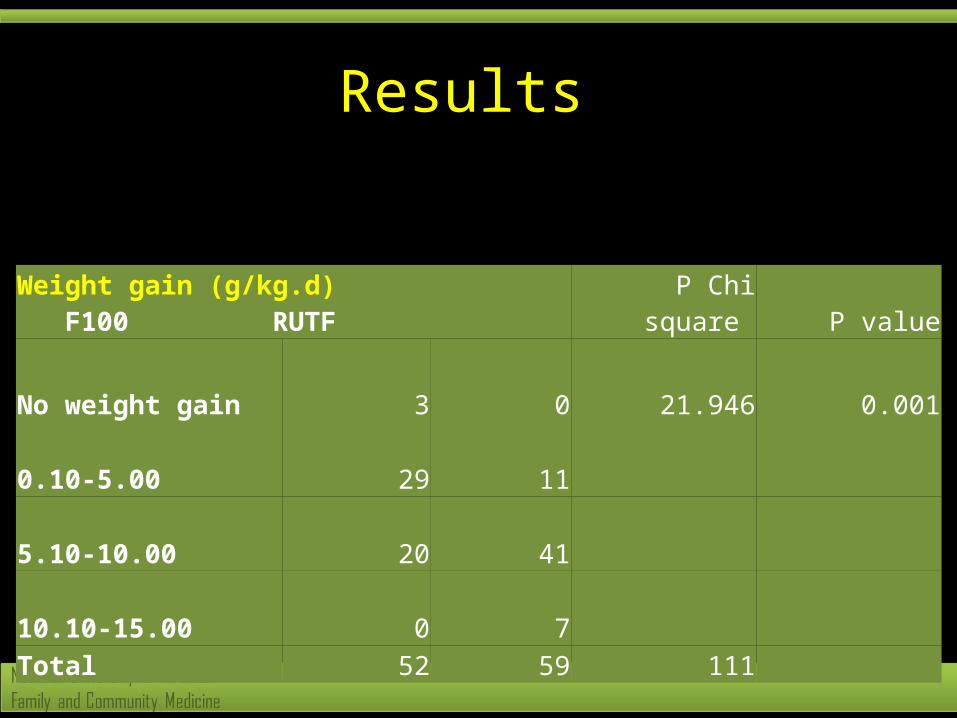
Weight gain (g/kg.d) F100 RUTF P Chi square P value
No weight gain 3 0 21.946 0.001
0.10-5.00 29 11
5.10-10.00 20 41
10.10-15.00 0 7Total 52 59 111

Results
GroupWeight at
entry Weight at
exit Weight
Gain f sign
F100 Mean 8019.231 8876.923 4.3544 38.842 0.001
N 52 52 52
Std. Deviation 1439.232 1534.009 2.07504
Minimum 5400 6300 0
Maximum 11300 12100 9
Range 5900 5800 9
RUTF Mean 8579.661 9710.17 6.9675
N 59 59 59
Std. Deviation 1490.751 1512.898 2.31189
Minimum 6000 7600 3.1
Maximum 12200 13200 12.8
Range 6200 5600 9.7
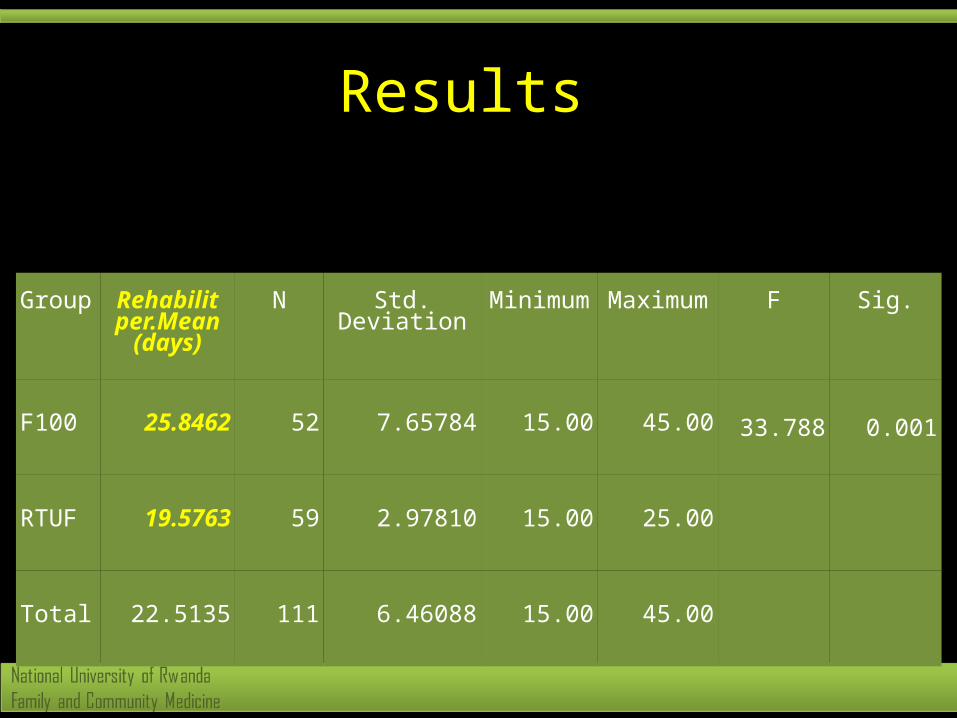
Results
Group Rehabilit per.Mean
(days)
N Std. Deviation
Minimum
Maximum
F Sig.
F100 25.8462 52 7.65784 15.00 45.00 33.788 0.001
RTUF 19.5763 59 2.97810 15.00 25.00
Total 22.5135 111 6.46088 15.00 45.00
Conclusion
• The RUTF is more efficient than the standard management of malnutrition
• RUTF are facing stock out periods
Recommendations
• Use RUTF in countrywide as a home based management
• Make RUTF available in all different health centers.
• Conduct a national survey.• Implementation of Home based treatment
of malnutrition policy.• Teaching and sensitization about food
preparation are needed.

Acknowledgement
• Government of Rwanda• Family and Community Medicine Program• Prof Munyanshongore Cyprien

Thank you