Embed Size (px)
Citation preview

0
Ready Reckoner Snapshot of India’s Oil & Gas data
May, 2015
Petroleum Planning & Analysis Cell (Ministry of Petroleum & Natural Gas)

1
Index of Tables Table Description Page
Highlights 2
1. Selected Indicators of the Indian Economy 3
2. Import Dependency 4
3. Quantity and Value of Crude Oil Imports 5
4. Indigenous Crude Oil Production 5
5. Self Sufficiency in Petroleum Products 6
6. Domestic Oil & Gas Production vis a vis Overseas Production 6
7. Coal Bed Methane (CBM) Gas development in India 6
8. Refineries: Installed Capacity and Crude Oil Processing 7
9. High Sulphur (HS) & Low Sulphur (LS) Crude Oil Processed 8
10. Gross Refining Margins (GRM) of Refineries 9
11. GRM of North East Refineries excluding Excise Duty Benefit 10
12. Natural Gas at a Glance 10
13. Consumption of Petroleum Products 11
14. LPG Monthly report on LPG Consumption 11
15. Industry Marketing Infrastructure 12
16. Pipelines Infrastructure 12
17. Gas Pipelines under execution / construction 13
18. Existing and Expected LNG Terminals as on 30.9.2014 13
19. Status of PNG Connection and CNG Station across the India 14
20. Information on Prices, Taxes and Under-recoveries 16
21. Conversion Factors and Volume Conversion 18

2
Highlights
The fields in South Gujarat contributed maximum in loss of production due to natural decline in brownfield and increasing water cut. The production in Assam field was affected due to natural decline in brownfield and power failure.
The drop has been offset partially by increased condensate production of ONGC at Hazira.
Crude Oil production in PSC regime was affected by under-performance of “Bhagyam Field Wells”. RJ-ON-90/1 accounted for major loss of production.
Planned shutdown of IOC Refineries: Koyali: 23st March, 2015 to 4th May, 2015 - units under shutdown were FCCU, DCU, DHDT, Coker, VGO-HDT; Barauni: CRU under shutdown from 27th April to 22nd May, 2015; Planned Shutdown of BPCL-BORL refinery: all units from 30.3.2015 to 1.5.2015.
Lower availability of BS IV diesel during May, 2015 due to some issues of DHDT unit in IOCL’s Mathura Refinery and BPCL’s Kochi. HPCL’s Mumbai refinery which was under shut down from 25th April to 1st June, 2015 is further extended due to issues in FCCU. HMEL’s CCR unit which was under planned shutdown stabilized during first fortnight of May, 2015.
The consumption of all petroleum products has registered a growth of 2.9 % in May, 2015 as compared to that in May, 2014. Except for LPG, MS, Naphtha, Lubes, Pet coke and ATF, all other products have recorded negative growth.
LPG consumption for the 21st month in a row recorded a positive growth of 6.0% during May 2015 and a cumulative growth of 7.8% for the period April -May 2015.

3
1. Selected Indicators of the Indian Economy
Economic Indicators Unit/Base 2012-13 2013-14 2014-15 2015-16 (P)
1 Population (as on 1st
March 2011) Billion 1.2 - - -
2 GDP at Factor Cost (Constant prices)
Growth % 5.1 6.9 7.3 - (NS) (NS) (PE)
3 Agricultural Production (Food grains)
MMT 257.1 265.04 251.12 -
Final 3nd AE
Growth % -0.8 3.1 -5.3
4 Gross Fiscal Deficit % -4.8 -4.6 -4.1 (RE)
-3.9 (BE)
Economic Indicators Unit/Base 2013-14 2014-15 May April-May
2014 2015 2014 2015
5 Index of Industrial Production@ Growth % -0.1 2.8 1.5 4.1
6 Imports $ Billion 450.2 447.5 39.2 32.8 75.0 65.8
7 Exports $ Billion 314.4 310.5 28.0 22.3 53.6 44.4
8 Trade Balance $ Billion -135.8 -137.0 -11.2 -10.4 -21.3 -21.4
9 Foreign Exchange Reserves $ Billion 303.7 341.4 312.4 352.5
@ IIP is for the month of April 2015 ; NS-New Series; PE-Provisional Estimates ; AE-Advanced Estimates; RE-Revised Estimates; BE-Budget Estimates

4
2. Import Dependency
Petroleum & Natural Gas Sector Unit/Base 2013-14
(P) 2014-15
(P) May April-May
2014 2015 (P) 2014 2015 (P) 1 Crude Oil Production In India MMT 37.8 37.5 3.2 3.2 6.3 6.2
2 Consumption of Petroleum Products MMT 158.4 165.0 14.7 15.1 28.1 29.7
3 Production of Petroleum Products MMT 220.3 220.7 18.4 19.5 35.7 35.9
4 Imports & Exports:
Crude Oil Imports MMT 189.2 189.4 14.9 17.5 31.8 33.0
$ Billion 143.0 112.7 11.3 7.6 24.0 13.8
Petroleum Products (POL) Imports MMT 16.7 20.2 1.6 2.0 3.2 3.9
$ Billion 12.2 11.9 1.2 1.0 2.3 1.9
Gross Petroleum Imports (Crude + POL) MMT 205.9 209.6 16.5 19.5 35.0 36.9
$ Billion 155.2 124.6 12.5 8.6 26.3 15.7
Petroleum Products Exports MMT 67.9 63.7 5.2 4.5 9.7 8.3
$ Billion 60.7 47.1 4.8 2.7 8.9 4.7
5 Petroleum Imports as % of India's Gross Imports
% 34.5 27.8 31.9 26.2 35.1 23.9
6 Petroleum Exports as % of India's Gross Exports
% 19.3 15.2 17.1 12.1 16.6 10.6
7 Import Dependency (On Consumption) % 77.6 78.4 80.4 80.7 80.0 80.8

5
3. Quantity and Value of Crude oil imports
Petroleum & Natural Gas Sector Quantity (MMT) $ Million Rs. Crore 2014-15 (Actuals) 189.43 1,12,748 6,87,369
2015-16 (Estimated) 188.23 88,203 5,48,655 * Note: April-May 2015 imports are based on actuals and for June 2015 to March 2016, the imports are estimated at $65/bbl and Rs.
62/$: Impact of variation in Crude oil price & Exchange rate on Crude oil imports for June 15- March 16:
If Crude prices increases by One $/bbl - Net Import bill increases by Rs. 7,096 crores ($ 1.14 bn)
If Exchange rate of $ increases by Rs. 1/$ - Net Import bill increases by Rs. 7,440 crores ($ 1.18 bn)
4. Indigenous Crude Oil Production (Million Metric Tonne)
Details 2013-14 2014-15
(P)
May April-May
2014 2015 (P) 2014 2015 (P) ONGC 19.2 18.6 1.6 1.6 3.1 3.1
OIL 3.5 3.4 0.3 0.3 0.6 0.6
Private / JVs 12.0 11.7 1.0 1.0 2.0 1.9
Total Crude Oil 34.7 33.8 2.9 2.9 5.7 5.6
Condensate 3.1 3.7 0.3 0.3 0.5 0.6
Total (Crude Oil + Condensate) (MMT) 37.8 37.5 3.2 3.2 6.3 6.2
Total (Crude Oil + Condensate) (Million Barrels) 277.04 274.7 23.2 23.4 46.0 45.5

6
5. Self Sufficiency in Petroleum Products (Million Metric Tonnes)
Details 2013-14
(P) 2014-15
(P)
May April-May
2014 2015 (P) 2014 2015 (P)
1. Indigenous Crude Oil Processing : 33.9 34.3 2.7 2.8 5.4 5.5
a) Products from Indigenous Crude (93.3% of crude oil processed) 31.6 32.0 2.5 2.6 5 5.1
b) Products from Fractionators (Including LPG and Gas) 3.8 3.7 0.3 0.3 0.6 0.6
2. Total Production from Indigenous Crude & Condensate (a + b ) 35.5 35.6 2.9 2.9 5.6 5.7
3. Total Domestic Consumption 158.4 165.0 14.7 15.1 28.1 29.7
% Self Sufficiency (2 / 3) 22.4% 21.6% 19.6% 19.3% 20.0% 19.2%
6. Domestic Oil & Gas Production vis a vis Overseas Production
Year 2013-14 2014-15
(P)
May April-May
2014 2015 (P) 2014 2015 (P) Total Domestic (MMTOE) 73.2 71.2 6.1 6.1 12.0 11.7
Overseas production of OVL (MMTOE) 8.4 8.9 0.8 0.8 1.5 1.5
Overseas Production as % of Domestic 11.4% 12.5% 12.6% 12.8% 12.8% 12.9%
7. Coal Bed Methane (CBM) Gas development in India Prognosticated CBM Resources 92 TCF
Established CBM resources 9.9 TCF
Total available Coal bearing area 26000 Sq. KM
Exploration Initiated 17200 Sq. KM
Blocks Awarded 33 Nos.
Commercial production of CBM gas (April 2015) 29.984 MMSCM

7
8. Refineries: Installed Capacity and Crude Oil Processing (MMTPA / MMT)
Com-pany
Refinery
Installed Capacity (1.4.2015)
Crude Oil Processing
2013-14 (P)
2014-15 (P)
May April-May
2014 2015 (P) 2014 2015 (P) IOCL Barauni (1964) 6.0 6.5 6.0 0.6 0.5 1.1 1.0
Koyali (1965) 13.7 13.0 13.3 1.2 1.2 2.3 1.8
Haldia (1975) 7.5 8.0 7.7 0.7 0.7 1.3 1.3
Mathura (1982) 8.0 6.60 8.5 0.8 0.7 1.5 1.4
Panipat (1998) 15.0 15.1 14.2 0.8 1.4 2.1 2.7
Guwahati (1962) 1.0 1.0 1.0 0.1 0.1 0.2 0.2
Digboi (1901) 0.7 0.7 0.6 0.1 0.1 0.1 0.1
Bongaigaon (1979) 2.4 2.3 2.4 0.2 0.2 0.4 0.5
IOCL TOTAL 54.2 53.1 53.6 4.3 4.8 8.9 8.9
HPCL Mumbai (1954) 6.5 7.7 7.4 0.3 0.4 0.9 1.0
Vizag (1957) 8.3 7.8 8.8 0.6 0.8 1.2 1.5
HMEL Bhatinda (2012) 9.0 9.3 7.3 0.9 0.9 1.7 1.8
HPCL-TOTAL 23.8 24.8 23.5 1.8 2.2 3.8 4.3
BPCL Mumbai (1955) 12.0 12.7 12.8 1.0 1.2 1.8 2.3
Kochi (1966) 9.5 10.3 10.4 0.7 0.9 1.6 1.8
BORL Bina (2011) 6.0 5.4 6.2 0.4 0.6 0.9 0.6
BPCL-TOTAL 27.5 28.4 29.4 2.2 2.7 4.0 4.7
8
Com-pany
Refinery
Installed Capacity (1.4.2015)
Crude Oil Processing
2013-14 (P)
2014-15 (P)
May April-May
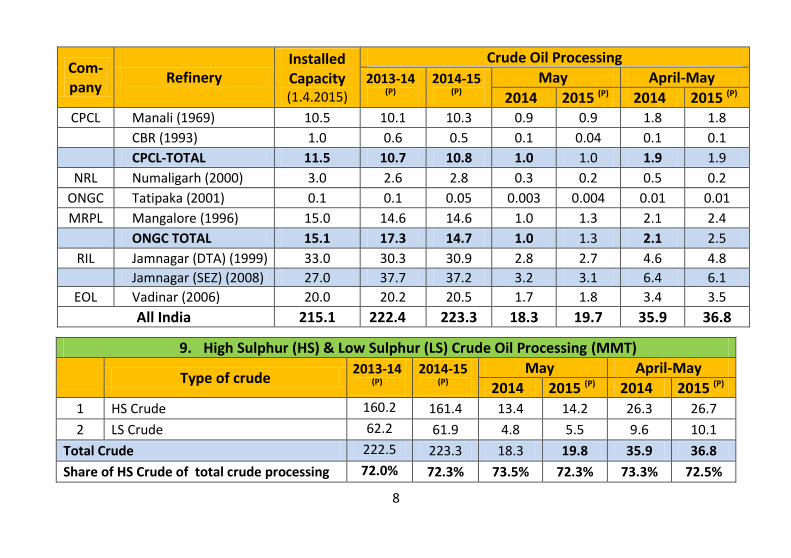
2014 2015 (P) 2014 2015 (P) CPCL Manali (1969) 10.5 10.1 10.3 0.9 0.9 1.8 1.8
CBR (1993) 1.0 0.6 0.5 0.1 0.04 0.1 0.1
CPCL-TOTAL 11.5 10.7 10.8 1.0 1.0 1.9 1.9
NRL Numaligarh (2000) 3.0 2.6 2.8 0.3 0.2 0.5 0.2
ONGC Tatipaka (2001) 0.1 0.1 0.05 0.003 0.004 0.01 0.01
MRPL Mangalore (1996) 15.0 14.6 14.6 1.0 1.3 2.1 2.4
ONGC TOTAL 15.1 17.3 14.7 1.0 1.3 2.1 2.5
RIL Jamnagar (DTA) (1999) 33.0 30.3 30.9 2.8 2.7 4.6 4.8
Jamnagar (SEZ) (2008) 27.0 37.7 37.2 3.2 3.1 6.4 6.1
EOL Vadinar (2006) 20.0 20.2 20.5 1.7 1.8 3.4 3.5
All India 215.1 222.4 223.3 18.3 19.7 35.9 36.8 36.8
9. High Sulphur (HS) & Low Sulphur (LS) Crude Oil Processing (MMT)
Type of crude
2013-14 (P)
2014-15 (P)
May April-May
2014 2015 (P) 2014 2015 (P)
1 HS Crude 160.2 161.4 13.4 14.2 26.3 26.7
2 LS Crude 62.2 61.9 4.8 5.5 9.6 10.1
Total Crude 222.5 223.3 18.3 19.8 35.9 36.8
Share of HS Crude of total crude processing 72.0% 72.3% 73.5% 72.3% 73.3% 72.5%

9
10. Gross Refining Margins (GRM) of Refineries ($/bbl)
Company Refinery 2011-12 2012-13 2013-14 2014-15
IOCL
Barauni 0.39 2.40 6.68 -1.20
Koyali 5.07 4.61 4.52 4.79
Haldia 2.38 0.85 2.84 -1.51
Mathura 0.59 0.55 2.10 -2.19
Panipat 4.39 3.34 3.62 -1.97
Guwahati 11.94 9.52 6.38 8.68
Digboi 14.85 20.81 15.41 13.73
Bongaigaon 6.25 5.26 6.71 -0.26
Average 3.63 3.16 4.24 0.27
BPCL Kochi 3.09 5.36 4.80 3.17
Mumbai 1.73 4.67 3.95 3.97
Average 2.29 4.97 4.33 3.62
HPCL Mumbai 1.74 2.08 5.38 4.88
Visakhapatnam 2.95 2.08 1.50 1.12
Average 2.39 2.08 3.43 2.84
CPCL Chennai 4.16 0.99 4.08 1.97
MRPL Mangalore 5.60 2.45 2.67 -0.64
NRL Numaligarh 12.45 10.52 12.09 16.67
BORL Bina - 7.00 7.70 6.10
RIL Jamnagar 8.60 9.20 8.10 8.60
Essar Vadinar 4.23 7.96 7.98 8.37

10
11. GRM of North East Refineries excluding Excise Duty Benefit ($/bbl)
Company Refinery 2011-12 2012-13 2013-14 2014-15
IOCL
Guwahati 3.73 3.43 0.88 0.96
Digboi 6.41 13.25 8.50 5.42
Bongaigaon 0.56 0.25 2.34 -6.51
NRL Numaligarh 5.80 4.83 6.98 9.46
12. Natural Gas at a Glance
(MMSCM)
2013-14
(P) 2014-15
(P)
May April-May
2014 2015 (P) 2014 2015 (P) Gross Production 35390.99 33662.91 2942.77 2852.21 5713.33 5521.91
Net Production (Excluding Flair Gas) 34554.74 32694.40 2874.04 2756.85 5574.16 5333.37
LNG Import 17727.99 18535.70 1538.20 1451.94 3149.01 2924.62
Total Consumption (Net Production + Import) 52282.73 51230.10 4412.24 4208.79 8723.17 8257.99
Total Consumption (in BCM) 52.28 51.23 4.41 4.20 8.72 8.25
11
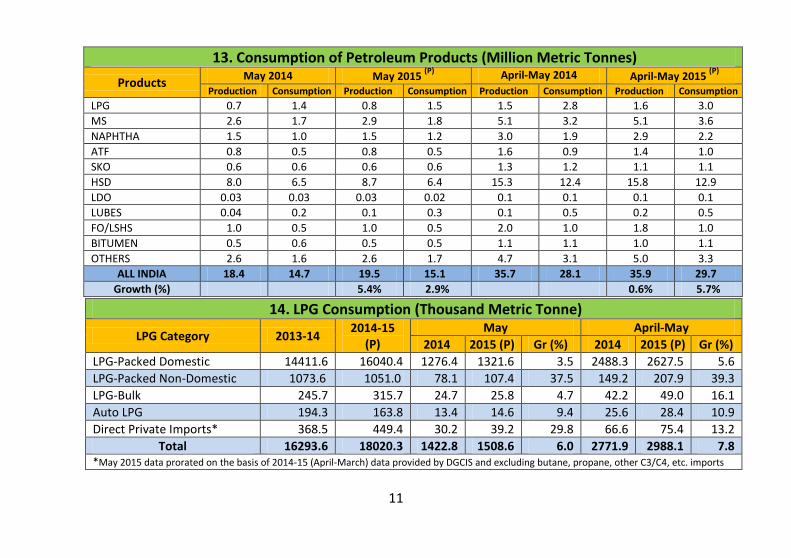
13. Consumption of Petroleum Products (Million Metric Tonnes)
Products May 2014 May 2015
(P) April-May 2014 April-May 2015
(P)
Production Consumption Production Consumption Production Consumption Production Consumption
LPG 0.7 1.4 0.8 1.5 1.5 2.8 1.6 3.0
MS 2.6 1.7 2.9 1.8 5.1 3.2 5.1 3.6
NAPHTHA 1.5 1.0 1.5 1.2 3.0 1.9 2.9 2.2
ATF 0.8 0.5 0.8 0.5 1.6 0.9 1.4 1.0
SKO 0.6 0.6 0.6 0.6 1.3 1.2 1.1 1.1
HSD 8.0 6.5 8.7 6.4 15.3 12.4 15.8 12.9
LDO 0.03 0.03 0.03 0.02 0.1 0.1 0.1 0.1
LUBES 0.04 0.2 0.1 0.3 0.1 0.5 0.2 0.5
FO/LSHS 1.0 0.5 1.0 0.5 2.0 1.0 1.8 1.0
BITUMEN 0.5 0.6 0.5 0.5 1.1 1.1 1.0 1.1
OTHERS 2.6 1.6 2.6 1.7 4.7 3.1 5.0 3.3
ALL INDIA 18.4 14.7 19.5 15.1 35.7 28.1 35.9 29.7
Growth (%) 5.4% 2.9% 0.6% 5.7%
14. LPG Consumption (Thousand Metric Tonne)
LPG Category 2013-14 2014-15
(P)
May April-May
2014 2015 (P) Gr (%) 2014 2015 (P) Gr (%)
LPG-Packed Domestic 14411.6 16040.4 1276.4 1321.6 3.5 2488.3 2627.5 5.6
LPG-Packed Non-Domestic 1073.6 1051.0 78.1 107.4 37.5 149.2 207.9 39.3
LPG-Bulk 245.7 315.7 24.7 25.8 4.7 42.2 49.0 16.1
Auto LPG 194.3 163.8 13.4 14.6 9.4 25.6 28.4 10.9
Direct Private Imports* 368.5 449.4 30.2 39.2 29.8 66.6 75.4 13.2
Total 16293.6 18020.3 1422.8 1508.6 6.0 2771.9 2988.1 7.8 *May 2015 data prorated on the basis of 2014-15 (April-March) data provided by DGCIS and excluding butane, propane, other C3/C4, etc. imports

12
15. Industry Marketing Infrastructure (as on 31.3.2015) (Provisional)
Particulars IOCL BPCL HPCL RIL ESSAR SHELL Others Total Terminal/ Depots (Nos.) 136 83 105 5 1 0 6 336
Aviation Fuel Stations (Nos.) 98 40 35 27 3 0 1 204
Retail Outlets (total) (Nos.) 24405 12809 13233 1400 1491 77 4 53419
LPG Distributors (total) (Nos.) 7934 4044 3952 0 0 0 0 15930
SKO/LDO Agencies (Nos.) 3919 1005 1638 0 0 0 0 6562
LPG Bottling (TMTPA) 7812 3165 3057 0 0 0 10 14044
Rural ROs (Nos.) 6230 2184 2664 108 385 9 0 11580
RGGLVY (Nos.) 2096 1182 1164 0 0 0 0 4442
LPG Consumers (Nos. crore) 8.88 4.58 4.73 0 0 0 0 18.19
16. Major Pipeline network
Nature of Pipeline GAIL Reliance GSPCL AGC IOCL ONGC Total
Natural Gas Length (KM) 10977 1469 2197.7 1000 140.41 24 15808.00
(as on 1.4.2015) Cap (MMSCMD) 206 80 43 6 9.5 6 350.50
ONGC OIL Cairn HMEL IOCL BPCL HPCL Other Total
Crude Oil Length (KM) 1214 1193 670 1017 4448 937 - - 9479
(as on 1.4.2015) Cap (MMTPA) 60.06 8.4 8.7 9 40.4 6 - - 132.56
Products Length (KM) - 654 - - 6633 1935 2514 2687 14423
(as on 1.4.2015) Cap (MMTPA) - 1.7 - - 40.09 14.94 23.57 9.27 89.57 Others include GAIL and Petronet India

13
17. Gas Pipelines under execution / construction Network/ Region Entity Length in KMs Design Capacity (mmscmd) Pipeline Size
Kochi - Kottanad - Banglore - Mangalore GAIL 1104 16 24"/18"/12"
Dabhol -Banglore (DBPL) GAIL 410 16 36"/30"/24"/18"
Surat - Paradip GAIL 2112 75 36"/24"/18"
Jagdishpur- Haldia GAIL 1860 32
Mallavaram - Bhilwada GITL 2035 78.25 36"/30"/24"/18"
Mehsana - Bhatinda GIGL 2052 77.11
Bhatinda -Srinagar GIGL 725 42
Kakinada - Srikakulam APGDC 391 90
Shadol-Phulpur RGPL 312 3.5
Ennore-Nellore KEI-RSOS PEPL 430 36
Total 11397
18. Existing and upcoming LNG Terminals as on 31.03.2015 Existing/ Upcoming Terminals Promotors Capacity (MMTPA) Expected Timelines
Dahej Petronet LNG Ltd (PLL) 15* Existing
Hazira Shell 3.6 Existing
Dabhol RGPPL (GAIL - NTPC JV) 5** Existing
Kochi Petronet LNG Ltd (PLL) 5 Existing
Kakinada East Godavari initially FSRU GAIL + AP Govt. (JV) Proposed 3.5 2016-18
Mundra Adani & GSPC (Proposed) 5 2016-17
Ennore IOCL 10*** 2017-18
Gangavaram (AP) PLL 5 2018-19
Mangalore ONGC + BPCL 2.5 2018-19
Jaigarh (Maharashtra) H-Energy Gateway Pvt. Limited 8 2018-19 * Existing 10 MMTPA to be increased to 15 MMTPA by 2016-17 ; ** 1.25 MMTPA in Phase-1 without break water, to be increased to 5.0 MMTPA; *** 5 MMTPA in Phase - 1 to be increased to 10 MMTPA.

14
19. Status of PNG connections and CNG stations across India (Nos.)
State Entity Operating Geographical Region CNG
Stations PNG
Connections
(as on 31.3.2015) (as on 1.5.2015)
Haryana Haryana City Gas, Adani Gas Limited, Gail Gas Ltd.
Sonepat, Faridabad, Gurgaon 16 23789
Andhra Pradesh, Telangana
Bhagyanagar Gas Ltd
Kakinada, Hyderabad, Vijaywada, Rajamundry
32 3285
Assam Assam Gas Co. Ltd Tinsukia, Dibrugarh, Sibsagar, Jorhat, Golaghat
00 28154
Gujarat
Sabarmati Gas Ltd, GSPC Gas Co. Ltd, Adani Gas Ltd , Vadodara Mahanagar Seva Sadan, GAIL, GAIL Gas, HPCL, Gujarat Gas Co. Ltd, Charotar Gas Sahakari Mandali Ltd
Ghandhinagar, Mehsana, Sabarkantha, Nadiad, Halol, Hazira, Rajkot, Khambhat, Palej, Valsad, Navsari, Surendernagar, Vadodara, Ahmedabad, Surat, Ankeleswar & Bhavnagar, Anand
349 1400132
Madhya Pradesh Avantika Gas Ltd, GAIL Gas Ltd
Dewas, Vijaipur, Indore including Ujjain, Gwalior
20 3297
New Delhi Indraprastha Gas Ltd National Capital Territory of Delhi (Including Noida & Ghaziabad)
326 562332
Rajasthan GAIL Gas Ltd Kota 3 180

15
State Entity Operating Geographical Region CNG
Stations PNG
Connections
(as on 31.3.2015) (as on 1.5.2015)
Maharashtra
Mahanagar Gas Ltd,
Maharashtra Natural Gas
Ltd, GAIL Gas Ltd
Thane & adjoining contiguous
areas including Mira Bhayender,
Navi Mumbai, Thane City,
Ambernath, Bhiwandi, Kalyan,
Dombivily, Badlapur,
Ulhasnagar, Panvel, Kharghar &
Taloja, Pune City including
Pimpri Chinchwad and along
with adjoining contiguous areas
of Chakan, Hinjewadi &
Talegaon GA, Panvel
211 824769
Tripura Tripura Natural Gas Co. Ltd Agartala 5 18252
West Bengal GEECL Kolkata 7 00
Uttar Pradesh
GAIL Gas Ltd, Sanwariya
Gas, Green Gas , Central
U.P. Gas , Siti Energy Ltd
Meerut, Mathura, Agra, Kanpur,
Bareilly, Lucknow, Moradabad,
Ferozabad
40 23511
Total 1009 2887701

16
20. Information on Prices, Taxes and Under-recoveries Sales & profit of Petroleum Sector (Rs. Crores)
Price buildup of Petroleum products (Rs./litre/Cylinder)
2014-15 Turnover PAT
Petrol Diesel
Upstream Companies 147,942 23,282 Price before taxes and dealer comm.
35.57 32.87
Downstream Cos. 880,676 13,091 Central taxes 18.14 10.89
Standalone Refineries 109,163 -1,033 State taxes 11.15 5.91
Private/JVs 471,477 25,087 Dealer comm. 2.07 1.26
Retail Selling Price 66.93 50.93
Customs & Excise Duty rates PDS SKO* Sub. Dom LPG
Customs duty
Excise duty Price before taxes and
dealer comm. 13.55 581.64
Crude oil Nil+Rs.50/MT as NCCD
NIL+Rs.4500/ MT Cess + Rs. 50/ MT NCCD
Central taxes 0 0
Petrol 2.50% Rs.17.46/Ltr State taxes 0.44 0
Diesel 2.50% Rs.10.26/Ltr Dealer comm. 1.15 44.88
PDS SKO Nil NIL Retail Selling Price 15.14 626.50
Non PDS SKO 5% 14% *At Mumbai, other products at Delhi
Sub. Dom LPG Nil Nil
Non Domestic LPG 5% 8% Change in Ex. Rate/ Crude price : Impact on Under-recoveries
Furnace Oil 5% 14% (Rs. Crores) Rs.1/$ Ex. Rate $1/bbl Crude
Naphtha 5% 14%
Impact on Under-recovery
1,210 1,200
ATF NIL 8%

17
20. Information on Prices, Taxes and Under-recoveries
Under-recoveries & Burden Sharing
International Prices/ Exchange rates ($/bbl)
2012-13 2013-14 2014-15
2012-13 2013-14 2014-15
Per unit under-recovery (Rs./litre/Cylinder)
Crude (Indian Basket) 107.97 105.52 84.16
Diesel 11.26 8.39 2.70*
Petrol 118.98 114.31 95.45
PDS SKO 31.16 33.98 27.93
Diesel 121.97 119.41 96.64
Sub. Dom LPG 427.14 499.52 409.72
Kerosene 123.11 118.80 96.98
Total Under-recoveries (Rs. Crores)
LPG ($/MT) 885.20 880.49 683.87
Diesel 92,061 62,837 10,935*
FO ($/MT) 632.52 595.79 471.99
PDS SKO 29,410 30,574 24,799
Naphtha ($/MT) 888.49 881.30 717.44
Sub. Dom LPG 39,558 46,458 36,580
Total 161,029 139,869 72,314
Exchange (Rs./$ ) 54.45 60.50 61.15
Burden Sharing (Rs. Crores)
Borrowings of OMCs (Rs. Crores)
2012-13 2013-14 2014-15 2012-13 2013-14 2014-15
Government 100,000 70,772 27,308 IOCL 80,894 86,263 55,248
Upstream 60,000 67,021 42,822
BPCL 23,839 20,322 13,098
OMCs 1,029 2,076 2,184
HPCL 33,789 32,164 20,335
Petroleum Sector Contribution to Central/State Govt.
Fiscal Subsidy under Govt. Schemes (Rs. Crores)
2012-13 2013-14 Apr-Dec’14
PDS SKO 746 681 **
Central Government 142,626 152,900 108,220
Sub. Dom LPG 2,007 1,920 **
State Governments 136,034 152,460 118,621
* Deregulated w.e.f. 19th
October 2014 **Scheme was extended till 31.3.2015.
Total (Rs. Crores) 278,660 305,360 226,841
Subsidy as a % of GDP
2011-12 2012-13 2013-14
Petroleum Subsidy 1.70 1.75 1.37

18
21. Conversion Factors and Volume Conversion Weight to Volume Conversion Volume Conversion
Product Weight
(MT) Volume
(KL) Barrel (bbl)
From To
LPG 1 1.844 11.60
1 bbl (British Barrel) 159 litres
Petrol (MS) 1 1.4110 8.50
1 bbl (British Barrel) 42 US Gallons
Diesel (HSD) 1 1.2100 7.45
1 US Gallon 3.78 litres
Kerosene (SKO) 1 1.2850 7.90
1 Kilo litre (KL) 6.29 bbl
ATF 1 1.2880 7.90
1 million barrels per day 49.8 MMTPA
Light Diesel Oil (LDO) 1 1.0720 6.75
Energy Conversion
Furnace Oil (FO) 1 1.0424 6.55
1 Kilocalorie (kcal) 4.187 kJ
Crude Oil 1 1.1700 7.33
1 Kilocalorie (kcal) 3.968 Btu
1 Kilowatt-hour (kWh) 860 kcal
Exclusive Economic Zone
1 Kilowatt-hour (kWh) 3412 Btu
200 Nautical Miles 370.4 Kilometers
Natural Gas Conversions
1 Standard Cubic Metre 35.31 Cubic Feet
1 MMBTU 25.2 SCM @10000 kcal/SCM
1 BCM/year of Gas 2.74 MMSCMD
GCV (Gross Calorific Value 10000 kcal/SCM
1 TCF of Gas Reserve 3.88 MMSCMD
NCV (Net Calorific Value) 90% of GCV
1 MMTPA of LNG 3.60 MMSCMD
Gas required for 1 MW power generation
4128 SCM/day
1 MT of LNG 1314 SCM
Power generation from 1 MMSCMD of gas
242 MW