Embed Size (px)
Citation preview

Technical Reports
59English Edition No.49 December 2017
Feature Article
Tip-Enhanced Raman SpectroscopyFinds a Growing Number of Applications in Biology
Marc CHAIGNEAU
Maruda SHANMUGASUNDARAM
Fran ADAR
Tip-enhanced Raman spectroscopy (TERS) combines the high chemical speci-
ficity of Raman scattering with the nanoscale spatial resolution of Scanning
Probe Microscopy (SPM). It enables label-free detection of surface components
in multi-component samples with ultra-high spatial resolution (better than 20 nm).
This article describes how TERS can be applied to study biological systems
ranging from pure components like amino acids to membrane receptors found in
complex environments such as cell surfaces.
Introduction
Despite being able to provide fingerprint information in biology, medicine and other fields, Raman spectroscopy suffers from a signal-to-noise ratio that is limited by the inherent weakness of Raman scattering and a spatial reso-lution that is diffraction-limited (~0.5λ*1). It is often desir-able to advance spatial resolution beyond the diffraction-limit into the nanoscale dimension, which can provide chemical information with potentially single molecule resolution. This spatial resolution enhancement is achiev-able through a technique called Tip-Enhanced Raman Spectroscopy (TERS).[1]
*1: 0.5λ: Half wavelength of radiation
TERS combines the high chemical specificity of Raman scattering with the nanoscale spatial resolution of Scanning Probe Microscopy (SPM). It enables detection of surface components in samples with ultra-high spatial resolution (down to 10 nm), making it suitable for study-ing nanomaterials and nano-objects.[2-6] TERS also offers several benefits in studying biomolecules compared to other spectroscopic and microscopic techniques. For example, it can overcome low signal-to-noise that ham-pers some bioapplications and thus avoid the need to use larger sample volumes. This is because TERS offers enhanced Raman signal similar to Surface Enhanced Raman Spectroscopy (SERS) with the added benefit of nanometer resolution; hence it can target potentially single molecules.Alternative methods to study nanoscale chemical compo-sition such as super-resolution fluorescence based tech-niques or methods to study morphology are available, and conventionally electron microscopy (EM) is used along
with SPM to study particle dimensions on the nanoscale. However, EM, like SPM, gives limited chemical informa-tion and may require heavy metal staining of biological samples. Alternatively, super-resolution fluorescence microscopy techniques have been developed to obtain chemical information beyond the diffraction limit. Such techniques still use fluorescent labels whose broadband signal does not provide detailed molecular information similar to that of Raman spectroscopy. A label-free method can avoid unwanted interaction between the label and the analyte, preserve the analyte’s function and avoid signal from the label itself, thus achieving a high degree of specificity with regard to chemical identity or charac-terization. TERS has this capability to provide nanoscale chemical composition in a label-free manner.This article describes how TERS can be applied to study a number of biological systems such as amino acid and nucleobase monolayers, proteins, macromolecular protein assemblies, nucleic acids, cell surfaces and cell surface interactions.
Bringing Raman and AFM Together
Raman and AFM (Atomic Force Microscope from the SPM family) analysis can be combined on a single micro-scope system; it opens interesting new capabilities and provides new information on sample composition and structure by adding together physical and chemical infor-mation from a sample surface. Indeed, co-localized AFM/Raman measurement is the sequential or simultaneous acquisition of overlapped SPM (Scanning Probe Microscope) and Raman maps. On the one hand, the AFM and other SPM techniques provide topographic, mechanical, thermal, electrical, and magnetic properties down to the molecular resolution (~ nm, over μm2 area),

60 English Edition No.49 December 2017
Feature Article
Tip-Enhanced Raman Spectroscopy
on the other hand the confocal Raman spectroscopy and imaging provides specific chemical information about the material, with a diffraction limited spatial resolution (sub-micron).
With such so-called AFM/Raman system, it’s also possi-ble to bring Raman spectroscopy into nanoscale resolution imaging with Tip Enhanced Raman Spectroscopy (TERS). This technique is based on a metallic tip (generally made of gold or silver) employed to concentrate the incident light field at the apex of the tip, which acts as a nano-source of light and a local field enhancer, greatly improv-ing the Raman sensitivity (factor of 103–107) and reducing the observation area to that localized at the tip.
Two different configurations exist for this coupling: one in transmission and one in reflection, having their own advantages and drawbacks (Figure 1).
The reflection configuration in oblique illumination is designed for TERS experiments for use with a large vari-ety of SPM probes on many kinds of samples (opaque and transparent). The setup integrates a high NA long-working distance objective (up to 0.7 NA) at an optimum angle (60°). It brings the laser beam on the tip with ideal polarization orientation for TERS amplification (p-polarization) and ensures maximum collection efficiency by minimizing shadowing from the scanning probe-tip.
The inverted configuration which provides transmission measurements is ideal for transparent samples, which, of course, includes many biological applications: it allows the use of very high numerical aperture (NA) objectives, including oil immersion objectives (with NA up to 1.45), giving high power density at the focal point and enabling the collection of a high Raman signal level. This configu-ration in transmission also requires an appropriate polar-ization orientation. Radially polarized laser beam is thus mandatory for the plasmonic excitation and the induced enhancement of the electromagnetic field at the tip’s vicinity.
The TERS effect is produced by the strong local enhance-ment of the electromagnetic field at the apex of a sharp noble-metal tip when illuminated with a focused laser beam. The manufacturing of the TERS tips is currently based either on coating standard AFM tips (fully or par-tially) with a metallic layer, or etching all-metal tips (bulky metallic wires) by electrochemistry.[7] These wire tips are used for STM regulation or Normal/Shear-force micros-copy when mounted on the fork of a quartz resonator. The most common method today is the metallization of con-ventional AFM cantilevers with a thin layer of a few tens of nanometers of gold or silver. The coating is usually done by evaporation,[8, 9] sputtering,[10] or electroplat-ing.[11, 12] Etching this layer by focused ion beam (FIB) right after coating could also be used to increase the enhancement of the electromagnetic field.[13] In addition, the tunability of the resonance wavelength plasmon can then be obtained by varying the dimensions of the final apex using FIB nano-machining,[14] which can be also used for etched bulky metallic wires.[15]
Spatial Resolution Down to the Nanometer
TERS is a near-field spectroscopic imaging technique, so in this sense it belongs to the family of scanning probe microscopes by combining the scattering-SNOM tech-nique with a Raman spectrometer. It is nonetheless an optical imaging technique and the concept of resolution must follow the general definition in optics.
Thus, in optics, the strict definition of the resolution is the minimum distance in between two objects that can be imaged; this distance is governed by the Rayleigh crite-rion which states that the resolution can’t be smaller than half the wavelength of the radiation used. In near field optics and consequently with TERS, the resolution must follow that definition. However, the required condition is very rarely satisfied (i. e. the presence of two nanoscale objects close enough to each other on the sample surface) and it is commonly accepted that the spatial resolution in TERS (and other near-field optical imaging techniques) can be quantified via the optical section analysis through a single nano-object.
In the example shown in Figure 2, the TERS image (100 × 100 nm scanning area, acquired with a pixel step size of 1.3 nm, total acquisition time < 9 min, 100 ms integration time per pixel), showed nanoscale chemical imaging of a single carbon nanotube (CNT) with a spatial resolution of 8 nm, confirmed from the section analysis of the intensity of the D band at 1360 cm-1. As a first approximation, this resolution is dependent on the radius of curvature of the TERS tip, i. e. the “8 nm” estimation is a convolution of the actual size with the tip radius and the nanotube. Thus,
Figure 1 Reflection and transmission TERS configurations.

Technical Reports
61English Edition No.49 December 2017
the achievable TERS resolution can be approximated and considered equal to half the radius of curvature of the TERS tip. To go further with the present example in Figure 2, in this TERS map, the intensity of the D band
(white and green pixels) shows the imperfection in the structure of the lattice; in contrast, the areas in red corre-spond to the pure graphitic arrangement of the CNT through the intensity of the 2D band. Close to the local lattice defects, a single step gives rise to noticeable inten-sity of the D peak, showing a chemical sensitivity down to 1.3 nm along the tube.
Applications of TERS in Biology
Initial TERS studies in biology focused on pure compo-nents like nucleobases and amino acids. TER spectra have been reported for all normal nucleobases, showing char-acteristic peaks with enhanced signal compared to the far-field spectrum. The plasmonic enhancement of the Raman signal allows label-free detection of nucleobases in pico-molar quantities.[16] TERS studies also showed that dis-tinct signatures of different nucleobases can be detected
in RNA and DNA, thereby opening up opportunities for a direct, label-free method for nucleic acid sequencing (Figure 3). In principle, this can be used to detect chemi-cal modification in DNA, which may result from environ-mental stress such as UV rays or from a byproduct of metabolism such as free radicals, and hence can provide valuable understanding of DNA repair mechanisms. TER spectra have been obtained from cystine and histidine monolayers, which revealed different ionization states adsorbed on the surface[17] which is relevant to histone formation. A similar degree of chemical specificity has also been demonstrated in proteins. TER spectra obtained from cytochrome c showed not only distinct spectral fea-tures of amino acid and the associated heme moiety but also variations due to different orientations of the mole-cule.[18] This was in contrast to SERS which, despite its high sensitivity, provided ensemble information of the analyte.
Additional studies have applied TERS to surface charac-terization of amyloid fibrils, which are macromolecular protein assemblies implicated in neurodegenerative dis-eases. They have elucidated the fibril surface composition
Figure 2 TERS image of 100 nm × 100 nm (75 × 75 pixels) of a carbon nanotube showing an optical spatial resolution down to 8 nm; total map acquisition time < 9 minutes.
Figure 3 (a) AFM topography of engineered DNA, (b)-(c) corresponding TERS spectral mapping of over 50 × 20 nm2 showing clear differentiation of spec-tral regions of pattern and size consistent with the expected (b) A/T and (c) G/C homopolymeric blocks, (d) horizontally averaged spectral map from the previous TERS maps, showing a good agreement with the (e) original sequence. (Data courtesy of Dr Noah Kolodziejski, Radiation Monitoring Devices.)
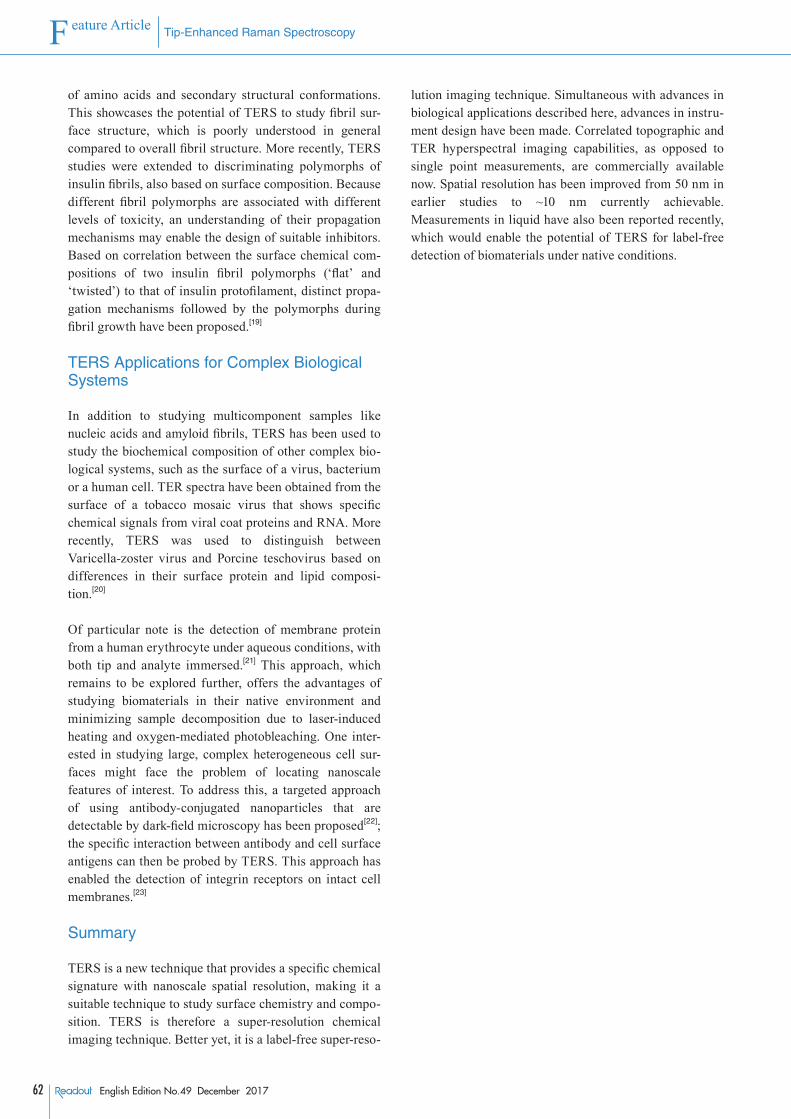
62 English Edition No.49 December 2017
Feature Article
Tip-Enhanced Raman Spectroscopy
of amino acids and secondary structural conformations. This showcases the potential of TERS to study fibril sur-face structure, which is poorly understood in general compared to overall fibril structure. More recently, TERS studies were extended to discriminating polymorphs of insulin fibrils, also based on surface composition. Because different fibril polymorphs are associated with different levels of toxicity, an understanding of their propagation mechanisms may enable the design of suitable inhibitors. Based on correlation between the surface chemical com-positions of two insulin fibril polymorphs (‘flat’ and ‘twisted’) to that of insulin protofilament, distinct propa-gation mechanisms followed by the polymorphs during fibril growth have been proposed.[19]
TERS Applications for Complex Biological Systems
In addition to studying multicomponent samples like nucleic acids and amyloid fibrils, TERS has been used to study the biochemical composition of other complex bio-logical systems, such as the surface of a virus, bacterium or a human cell. TER spectra have been obtained from the surface of a tobacco mosaic virus that shows specific chemical signals from viral coat proteins and RNA. More recently, TERS was used to distinguish between Varicella-zoster virus and Porcine teschovirus based on differences in their surface protein and lipid composi-tion.[20]
Of particular note is the detection of membrane protein from a human erythrocyte under aqueous conditions, with both tip and analyte immersed.[21] This approach, which remains to be explored further, offers the advantages of studying biomaterials in their native environment and minimizing sample decomposition due to laser-induced heating and oxygen-mediated photobleaching. One inter-ested in studying large, complex heterogeneous cell sur-faces might face the problem of locating nanoscale features of interest. To address this, a targeted approach of using antibody-conjugated nanoparticles that are detectable by dark-field microscopy has been proposed[22]; the specific interaction between antibody and cell surface antigens can then be probed by TERS. This approach has enabled the detection of integrin receptors on intact cell membranes.[23]
Summary
TERS is a new technique that provides a specific chemical signature with nanoscale spatial resolution, making it a suitable technique to study surface chemistry and compo-sition. TERS is therefore a super-resolution chemical imaging technique. Better yet, it is a label-free super-reso-
lution imaging technique. Simultaneous with advances in biological applications described here, advances in instru-ment design have been made. Correlated topographic and TER hyperspectral imaging capabilities, as opposed to single point measurements, are commercially available now. Spatial resolution has been improved from 50 nm in earlier studies to ~10 nm currently achievable. Measurements in liquid have also been reported recently, which would enable the potential of TERS for label-free detection of biomaterials under native conditions.

Technical Reports
63English Edition No.49 December 2017
[18] “Tip-enhanced Raman spectroscopy can see more: The case of cyto-chrome C”, B-S. Yeo, S. Mädler, T. Schmid, W. Zhang, and R. Zenobi, J. Phys. Chem. C 112, 4867 (2008).
[19] “Surface characterization of insulin protofi laments and fi bril poly-morphs using tip-enhanced Raman spectroscopy (TERS)”, D. Kurouski, T. Deckert-Gaudig, V. Deckert, and I. K. Lednev, Biophys. J. 106, 263 (2014).
[20] “A manual and an automatic TERS based virus discrimination”, K. Olschewski, E. Kämmer, S. Stöckel, T. Bocklitz, T. Deckert-Gaudig, R. Zell, D. Cialla-May, K. Weber, V. Deckert, and J. Popp, Nanoscale, 7, 4545 (2015).
[21] “Tip-enhanced Raman spectroscopy – Its status, challenges and future directions”, B-S. Yeo, J. Stadler, T. Schmid, R. Zenobi, and W. Zhang, Chem. Phys. Lett. 472, 1 (2009).
[22] “Tip-enhanced Raman detection of antibody conjugated nanoparti-cles on cellular membranes”, K. D. Alexander and Z. D. Schultz, Anal. Chem. 84, 7408 (2012).
[23] “TERS detection of αvβ3 integrins in intact cell membranes”, H. Wang and Z. D. Schultz, Chem. Phys. Chem. 15, 3944 (2014).
Fran ADAR, Ph.D.Raman Principal ScientistHORIBA Instruments Inc.
Maruda SHANMUGASUNDARAMApplication ScientistHORIBA Instruments Inc.
Marc CHAIGNEAU, Ph.D.AFM/Raman Product ManagerSales & Marketing DivisionHORIBA FRANCE SAS
References
[ 1 ] “Nanoscale chemical analysis by tip-enhanced Raman spectroscopy”, R. M. Stöckle, Y. D. Suh, V. Deckert, and R. Zenobi, Chem. Phys. Lett., 318, 131 (2000).
[ 2 ] “Improving resolution in quantum subnanometre-gap tip-enhanced Raman nanoimaging”, Y. Zhang, D. V. Voronine, S. Qiu, A. M. Sinyukov, M. Hamilton, Z. Liege, A. V. Sokolov, Z. Zhang and M. O. Scully, Scientifi c Reports, 6, 25788 (2016).
[ 3 ] “Nanoscale imaging and identifi cation of a four-component carbon sample” E. Sheremet, R. D. Rodriguez, A. L. Agapov, A. P. Sokolov, M. Hietschold, D. R.T. Zahn, Carbon, 96 (2016) 588-593.
[ 4 ] “20-nm-Resolved Stress Profi le in SiGe Nano-stripes Obtained by Tip-Enhanced Raman Spectroscopy”, M. Chaigneau, G. M. Vanacore, M. Bollani, G. Picardi, A. Tagliaferri and R. Ossikovski, Handobook of Enhanced Spectroscopy, Chapter 13, (Pan Stanford Publishing 2014).
[ 5 ] “Simultaneous topographical, electrical and optical microscopy of optoelectronic devices at the nanoscale”, N. Kumar, A. Zoladek-Lemanczyk, A. A. Y. Guilbert, W. Su, S. M. Tuladhar, T. Kirchartz, B. C. Schroeder, I. McCulloch, J. Nelson, D. Roy and F. A. Castro, Nanoscale, 9(8), 2723-2731 (2017).
[ 6 ] “Side-illuminated tip-enhanced Raman study of edge phonon in gra-phene at the electrical breakdown limit”, Y. Okuno, S. Vantasin, I. S. Yang, J. Son, J. Hong, Y. Y. Tanaka, Y. Nakata, Y. Ozaki, N. Naka, Appl. Phys. Lett., 108, 163110 (2016).
[ 7 ] “Preparation of gold tips suitable for tip-enhanced Raman spectros-copy and light emission by electrochemical etching”, B. Ren, G. Picardi, B. Pettinger, Rev. Sci. Instruments., 75, 837-841 (2004).
[ 8 ] “Enhancement of Raman signals with silver-coated tips.”, B. S. Yeo, W. Zhang, C. Vannier, R. Zenobi, Appl. Spectrosc., 60(10), 1142-1147 (2006).
[ 9 ] “Highly reproducible tip-enhanced Raman scattering using an oxi-dized and metallized silicon cantilever tip as a tool for everyone”, N. Hayazawa, T. Yano, S. Kawata, Journal of Raman Spectroscopy, 43(9), 1177-1182 (2012).
[10] “The controlled fabrication of “Tip-On-Tip” TERS probes”, Y. Yang, Z. Y. Li, M. Nogami, M. Tanemura, Z. Huang, RSC Advances, 4(9), 4718-4722 (2014).
[11] “Rational fabrication of a gold-coated AFM TERS tip by pulsed elec-trodeposition”, L. K. Yang, T. X. Huang, Z. C. Zeng, M. H. Li, X. Wang, F. Z. Yang, B. Ren, Nanoscale, 7(43), 18225-18231 (2015).
[12] “Facile Fabrication of Spherical Nanoparticle-Tipped AFM Probes for Plasmonic Applications”, A. Sanders, L. Zhang, R. W. Bowman, L. O. Herrmann, J. J. Baumberg, Particle & Particle Systems Characterization, 32(2), 182-187 (2015).
[13] “Nano-Raman spectroscopy with metallized atomic force microscopy tips on strained silicon structures”, L. Zhu, C. Georgi, M. Hecker, J. Rinderknecht, A. Mai, Y. Ritz and E. Zschech, J. Appl. Phys., 101(10), 104305 (2007).
[14] “Optical antennas for tunable enhancement in tip-enhanced Raman spectroscopy imaging”, I. Maouli, A. Taguchi, Y. Saito, S. Kawata, P. Verma, Applied Physics Express, 8(3), 032401 (2015).
[15] “Tuning Localized Surface Plasmon Resonance in Scanning Near-Field Optical Microscopy Probes”, T. L. Vasconcelos, B. S. Archanjo, B. Fragneaud, B. S. Oliveira, J. Riikonen, C. Li, D. S. Ribeiro, C. Rabelo, W. N. Rodrigues, A. Jorio, C. A. Achete, L. G. Cancado, ACS Nano, 9(6), 6297-6304 (2015).
[16] “Tip-enhanced Raman spectra of picomole quantities of DNA nucleobases at Au(111)”, K. F. Domke, D. Zhang, and B. Pettinger, J. Am. Chem. Soc. 129, 6708 (2007).
[17] “Spectroscopic imaging of biological samples using near-fi eld meth-ods”, L. Langelüddecke, T. Deckert-Gaudig, and V. Deckert, Infrared and Raman Spectroscopic Imaging, Chapter 11, Wiley-VCH, (2014).