Embed Size (px)
Citation preview
Data from the
NATIONAL HEALTH SURVEY
Readingand
Achievement
Series 11Number 136
Arithmetic
Among
Youths12=17 Yearsas Measured by the Wide Range
Achievement Test
United States
Findings from the reading and arithmetic subtests
of the Wide Range Achievement Test, administered
in a national survey of youths in 1966-70.
DHEW Publication No. (HRA) 74-1618
U.S. DEPARTMENT OF HEALTH, EDUCATION, AND WELFARE
Public Health Service
Health Resources Administration
National Center for Health Statistics
Rockville, Md. February 1974
Series 11 reports present findings from the National Health ExaminationSurvey, which obtains data through direct examination, tests, and meas-urements of samples of the U.S. population. Reports 1 through 38 relateto the adult program, Cycle I of the Health Examination Survey. Thepresent report is one of a number of reports of findings from the chil-dren and youth programs, Cycles II and HI of the Health ExaminationSurvey. These latter reports from Cycles II and 111are being publishedin Series 11 but are numbered consecutively beginning with 101. It ishoped this will guide users to the data in which they are interested.
Vital and Health Statistics-Series 1l-No. 136
For SS1Oby the Superintendent of Documents, U.S. Government Printing Office, Washhrgton, D.C. !20402- Prico 65 cents
NATIONAL CENTER FOR HEALTH STATISTICS
EDWARD B. PERRIN, Ph. D., Director
PHILIP S. LAWRENCE, SC.D., Deputy Director
.GAIL. F. FISHER, Assista~t Director for Health Statistics Development
WALT R. SIMMONS, M.A., Assistant Director for Research and Scientific Development
JOHN J. HANLON, M.D., Medical Advisor
JAMES E. KELLY, D.D.S., Dental Advisor
EDWARD E. MINTY, Executive Officer
ALICE HAYWOOD, Information Officer
DIVISION OF HEALTH EXAMINATION STATISTICS
ARTHUR J. McDOWELL, Director
GARRIE J. LOSEE, Deputy Director
PETER V. V. HAMILL, M. D., Medical Advisor, Children and youth Program
HENRY W. MILLER, ChieJ Operations and Quality Control Branch
LINCOLN I. OLIVER, Chief Psychological Statistics Branch
HAROLD J. DUPUY, Ph. D., Psychological Advisor
COOPERATION OF THE BUREAU OF THE CENSUS
In accordance with specifications established by the NationalHealth Survey, the Bureau of the Census, under a contracted
agreement, participated in the design and selection of the sample,
and carried out the first stage of the field interviewing and certainparts of the statistical processing.
Vital and Health Statistics-Series 11 -No. 136
DHEW Publication No. (HRA) 74-1618
Library of Congress CataZog Curd Number 73-600253
CONTENTSPage
Introduction -------------------- ---------- “--------- ------------------
The Wide Range Achievement Test --------------------------------------
Field Testing Procedures -------------------- -------------------- ---.--
Results . “-------- -------------------- -------------------- ------------
Reading Subtest-Raw Scores --------------------------- -------------
Arithmetic Subtest-Raw Scores ------------------ --------------------Percentiles and Standard Scores --------------------------- -----------
Comparison of HES Findings With Other Data . . . . . . -------------------- ---
Summary -.. ---------------------------- -------------------------- .----
References -------------------- -------------------- ---------- _-.------
List of DetailedTables --------------------------------------------------
Appendix I. Definitions -------------------- -------------------- ------
Appendix II. Technical N~tes -.-. . . . . . . . . . . . . . . . . . . . . . . . . . . . . . . . . . . . . -
The Survey Design ------------------ -+ ------- -----------------------Reliability ---------- ---------------------------- ---------------------
Extent of Missing Test Results and Imputation Procedures --------------Sampling and Measurement Error -------------------- -----------------
Hypothesis Testing --------------------------- ----------------------
Small Categories ---------------------------------------------------
Appendix 111. Instructions for Administration of the Wide Range AchievementTest for the Health Examination Survey, Cycle 111------------------------
1
2
4
5588
11
12
13
14
25
26262828293031
32
...Ill
SYMBOLS
Data not available ------------------------
Category not applicable -------------------
Quantity zero ----------------------------
Quantity morethan O but less than 0.05----
Figure doesnot meet standards ofreliabilityor precision ------------------
---
. . .
0.0
*
iv
READING ANDAMONG
ARITHMETIC ACHIEVEMENTYOUTHS 12-17 YEARS
AS MEASURED BY THE
Dale C, Hitchcock and Glenn D.
INTRODUCTION
This report presents information on thelevels achieved in reading and arithmetic, asmeasured by the Wide Range Achievement Test,by U.S. youths aged 12-17. The data were obtainedin the Health Examination Survey that was con-ducted from March 1966 to March 1970 by theNational Center for Health Statistics. Informationpresented here is essentially a continuation ofthat reported in a previous publication for childrenages 6-11.1 The present report is limited topresentation of the findings on adolescents bysex, age, and grade in school (appendix I).
The Health Examination Survey (HES) is anongoing program which collects data by directexamination of representative samples of thenoninstitutionalized population of the UnitedStates. Since 1960 the survey has conducted aseries of separate programs (called “cycles”)concerned with segments of the total populationand focused on certain aspects of the healthof the selected subpopulation. The data in thisreport were obtained during Cycle III, in whichyouths aged 12-17 were examined. That programwas a continuation of the immediately precedingcycle, in which children aged 6-11 years weregiven an examination which focused on healthfactors related to growth and development. De-tails regarding the surveys can be obtained incomprehensive reports on the childrents pro-gram 2 and the youths’ program. 3 Further
WIDE RANGE ACHIEVEMENT TEST
I?inder, Division of Health Examination Statistics
information about the Cycle HI survey designis presented in appendix H.
A standardized single-visit examination wasgiven each youth by an. examining team in aspeciaIly designed mobile unit. Along with ex-aminations by a physician and dentist and avariety of tests and measurements performed bytechnicians, a 70-minute psychological test bat-tery was given by a psychologist. The batteryincluded the following procedures, which wereadministered in the order listed: Wide RangeAchievement Test, arithmetic and reading sec-tions; Wechsler Intelligence Scale for Children,vocabulary and block design subtests; a five-card, tape- recorded version of the ThematicApperception Test; a modified version of theGoodenough-Harris Drawing Test; the Brief Testof Literacy; and a self-administered questionnaireconcerning the youth’s attitude and behaviorrelating to certain aspects of health. A criticalevaluation of most of the psychological tests usedin the survey, including a literature review ofprevious research and evaluations, was made byS. B. Sells of Texas Christian University. Theresults of the evaluation were published in theCenter’s methodological reports series.q
Before sample youths were examined, in-formation was obtained from their parents. Theinformation included demographic and socio-economic data on household members as wellas a medical history and behavioral data aboutthe sample youth. Information regarding per-
1
formance and adjustment was requested in aquestionnaire sent to the youth’s school. Allinformation was collected under a guarantee ofstrict confidentiality.
Of the 7,514 youths composing the sample,6,768 (90 percent) were examined. Because of thesample design, adjustment for nonresponse, andweighting procedures, examination results can beconsidered representative of the approximately23 million noninstitutionalized youths 12-17 yearsof age in the Uhited States at the time of thesurvey. Sampling errors associated with es-timates in this report are presented in appendix L
THE WIDE RANGEACHIEVEMENT TEST
When plans were made to conduct a healthsurvey of the U.S. population from ages 6 through17, it was decided that an assessment of educa-tional achievement would be relevant since manydevelopmental and psychological problems firstcome to the attention of teachers, physicians,parents, and others as “learning” or “school”problems. Although less widely known and usedthan some comprehensive achievement test bat-teries, the Wide Range Achievement Test (WRAT)met the survey’s requirements of both brevityand applicability to the entire age range of thetarget population, The choice was supported by
published data and by the opinions of someclinicians to the effect that the WRAT could beaccepted as a good predictor of performanceon the more traditional achievement tests. 4
The WRAT was developed in 1936 by Jastakand Bijou as a tool for studying achievement inthe basic school subjects of reading (word rec-ognition and pronunciation), written spelling, andarithmetic computation. The first edition and arevision in 19465 had only one scale of achieve-ment, which ranged from kindergarten to collegefor each of the three subtests. The 1965 edition aretained these three subtests, but each was
aIn the previous report on the WRAT findings in the HESchildren’s program, 2 it ~a5 reported that a 1963 revision was
used. This was a provisional edition eventually published as the
1965 revision with only slight changes in the word order of the
reading subtest, The 1963 provisional editions of the readingand arithmetic subtests were used in the survey of youths.
represented by separate scales at two levels. oLevel I was designed for children between theages of 5 years O months and 11 years 11 months,while Level II was intended for persons from 12years O months to adulthood. At both levels, thereading subtest consists of recognizing and namingletters and pronouncing words arranged in orderof increasing difficulty; the spelling sectioninvolves copying marks that resemble letters,writing one’s name, and writing single wordsas they are dictated; and the arithmetic subtestrequires counting, reading number symbols, solv-ing oral problems, and performing written com-putations normally taught in schools. Jastakprovided tables for converting raw scores on thethree subtests to grade equivalents, percentiles,and standard scores.
Because of time limitations, only the readingand arithmetic subtests of the WRAT were givenduring the survey of youths. Further discussionof the WRAT and the survey findings presentedbelow has been limited to those two subtests,
Adequate validity data on the WRAT are notpresented in the manual for the 1965 revision.Findings based on limited study of the 1946version are repeated from the 1946 manual; theysuggest that WIL4T results are closely relatedto scores on the New Stanford Achievement Test,Product-moment coefficients for samples of 7thand 8th graders. are reported as follows: WRATreading with New Stanford Paragraph Reading,.81 (N= 389); WRAT reading with New StanfordWord Reading, .84; WRAT arithmetic with NewStanford Arithmetic, .91 (N= 140). The 1965 man-ual also includes some data on reliability ofthe WRAT.6 From a sample of 200 individualsselected to represent a typical distribution ofachievement, split-half reliability coefficientswere calculated for the reading and arithmeticsubtests. The split-half measures used werescores on the odd-even items arranged in orderof difficulty. Correlations for age groups 12and older for both subtests were all above .95.As a measure of test-retest reliability, Jastak Gcited a study in which a group of 77 retardedpersons, ranging in age from 15 to 17 years,were given the WRAT (along with other tests)five times within a 3-week period. The WMTscores were found to be very stable, showingthe smallest variations of all the tests included.
To further study the use of the WRAT as ameasure of school achievement, the NationalCenter for Health Statistics contracted with K.Warner Schaie of West Virginia University fora special validation study. The complete findingsof that study have been published.~ A summary ofSchaiets findings regarding adolescents with somebrief remarks regarding several other relevantstudies follows.
Schaiets study was designed to assess theadequacy of the WRAT to predict actual gradeplacement and to estimate achievement as meas-ured by another comprehensive battery. LevelII of the WRAT was administered to 314 boysand 319 girls attending secondary schools inMonongalia County, West Virginia. The sampleconsisted of approximately equal numbers ofyouths in grades 7 through 12. To assess thepossibility of regional bias, an additional sampleof 596 subjects was selected from the 7th and10th grades in Milwaukee County, Wisconsin,the 8th and llth grades in Los Angeles, Cali-fornia, and the 9th and 12th grades in FortCollins, Colorado. The Stanford AchievementTest (SAT) was administered to the junior highschool students (grades 7-9) and the MetropolitanAchievement Tests (MAT) were given to studentsin senior high school. In the junior high populationreasonably good concurrent validity was dem-onstrated by the correlation of WRAT scoreswith those on the appropriate subtests of the SAT.Among the three grade levels and the geographicregions the coefficients ranged from .66 to .84for arithmetic and from .47 to .80 for reading.Likewise the high correlation of the appropriatesections of the MAT with the two WRAT subtestsfor the senior high school group further supportedthe validity of the WRAT. These validity coef -ficients ranged from .62 to .82 for arithmeticand from .49 to .82 for reading. Schaie concludedthat, while there is a considerable range in themagnitude of validity coefficients depending onlevel and geographic region involved, there issufficient evidence of substantial correlationwith criterion measures at every age levelinvestigated to consider the WRAT a satisfactorybrief instrument for estimating school achieve-ment. 7
In estimating grade level placement, theWRAT was found to vary considerably, ranging
from close agreement to wide disagreement withthe various criteria applied. Level II tended tounderestimate actual grade level, but it ratheraccurately predicted achievement levels on theSAT and MAT arithmetic-related subtests. TheWRAT Level II reading test overestimated theactual grade level of junior high students butunderestimated that of senior high students.Performance on the SAT was underestimated,while performance on the MAT criterion variableswas overestimated.
The latest edition of Buros’Mentil Measuve-nwtts Yewbook 8 lists 64 references on theWRAT which have been published since it wasfirst issued in 1936. The length of this listattests to a more than narrow or limited interestin the test, but a review of the articles revealsthat many have dealt with applications involvingsmall and special populations. For example, onerecent study g suggests that the WWT and theCalifornia Achievement Tests (CAT) are highlycorrelated when used with preschool childrenand” early elementary school children. A mediancorrelation of .80 among all the subtests, witha high of .89 between WRAT reading and totalCAT score, is reported for a sample of 96children. Another study,lo again comparing theWRAT and CAT, is more relevant to the presentreport because the 98 test subjects were 7thgrade students. Correlation coefficients betweenWRAT and total California reading and arithmeticscores are reported to be .73 and .80, re-spectively. At least 20 of the 64 references citedin Buros dealt with samples of retarded persons.A brief report of a 1962 studyll illustrates theuse of the WRAT in such studies of mentallyretarded subjects. When the WRAT scores andMAT scores of 25 institutionalized boys (ages9-14) were compared, rank order correlationcoefficients were .87 for arithmetic and .76for reading. Another study 12 that illustratesthe wide use of the WRAT with mentally retardedpersons also exemplifies a common procedureinitiated by Jastak, that of comparing WRATscores with intelligence test findings. For thetest results of 72 mentally retarded males aged16-35, correlation of WRAT scores with Stanford-Binet and Wechsler Adult Intelligence Scalescores ranged from .47 to .78.
Although the foregoing comments are not
3
presented as a comprehensive review of theliterature on the WRAT, the studies cited arerepresentative of the evidence that supportsthe reliability and validity of the two WRATsubtests for the purposes of HES Cycle III.
FIELD TESTINGPROCEDURES
The WRAT subtests were administered duringindividual testing sessions conducted by psychol-ogists who had at least a master’s degree andwho had experience in test administration. Therewere two psychologists on the examining teamat all times. The examiners were trained inthe special HES testing procedures and super-vised by the advisory staff of the survey. Duringthe training and supervision, strong emphasiswas placed’ on uniform methods of test adminis-tration, scoring, and recording of data. Through-out this survey of adolescents 12 psychologistsworked in the field.
The arithmetic and reading subtests werethe first procedures administered in each test-ing session. They were given in accordance withthe WRAT Manual for the 1965 revised edition, Gwith certain minor modifications to conform withspecial forms and practices of the survey,Only Level II tests were used, since all sampleyouths were 12 years old or older.
Both tests were printed on the same two-page form in a format identical to Jastak’sstandard form. The arithmetic section was onone page, which contained the 46 probIems of thewritten part and 15 dots and five numbers, Thedots and numbers along with three orally presentedword problems compose the oral arithmetictest, The opposing page had space for computation.The page of arithmetic problems was shown toeach youth, and he or she was asked to workin 10 minutes as many problems as possible. If theyouth did not correctly complete at least sixproblems within the allotted time, the oral partof the subtest was given. In the oral part theyouth was asked to count aloud the 15 dots on theform, to read the five numbers, and to solve threesimple word problems. These tasks were worth10 points, one point for counting five dotscorrectly, another point for counting six through15 dots, one point for reading each number, and
one for solving each problem. If the youth obtaineda score of six or more (one point for each prob-lem) on the written problems, the 10-pointcredit was given for the oral part. The highestpossible raw score for the arithmetic subtest is56 points.
The reading test consists of 13 capital lettersand 76 words which are printed on one page inorder of increasing difficulty. A laminated copyof this sheet was presented to the youth, who wasinstructed to read aloud each of the words in thesequence in which they appeared. On another testform (the one on which the youth had done thearithmetic), the examiner checked off each wordthat was incorrectly pronounced until 12 con-secutive words were missed. On the first mis-pronunciation of any one word, the youth was askedto repeat the word, but from then on the firstresponse or spontaneously changed response wasscored. Approximately 10 seconds were allowedfor each word, with the examiner controllingthe speed by saying “next” or “go on to the nextword.” If the youth failed to score at least sixpoints on the word pronunciation (one point foreach correct word), he or she was asked toread aloud the 13 capital letters and to read thefirst two letters in his or her name after writingit on the test form, The letter reading was wortha total of 15 points. Anyone obtaining a score of .11 or more on the word pronunciation was creditedwith the 15 pojnts for the letters. A possiblemaximum 89 points can be earned on the readingtest. The verbatim instructions used by the ex-aminers for the arithmetic and reading subtestsare included in appendix 111,
The examiner recorded all right and wronganswers on each test in specified spaces on thetest form. Scores were computed and recordedon the front of the form. As part of the com-prehensive quality control practices of the survey,the two psychologists daily exchanged all testforms and checked each other’s work for apparenterrors in administration or recording.
Once a week an entire testing session wasrecorded on tape by each field psychologist. Atranscription of the taped session was reviewedby a psychologist at headquarters, who notederrors, commented on testing procedures ifnecessary, and then returned the transcripts tothe examiners,
4
RESULTS
Reading Subtest-Raw Scores
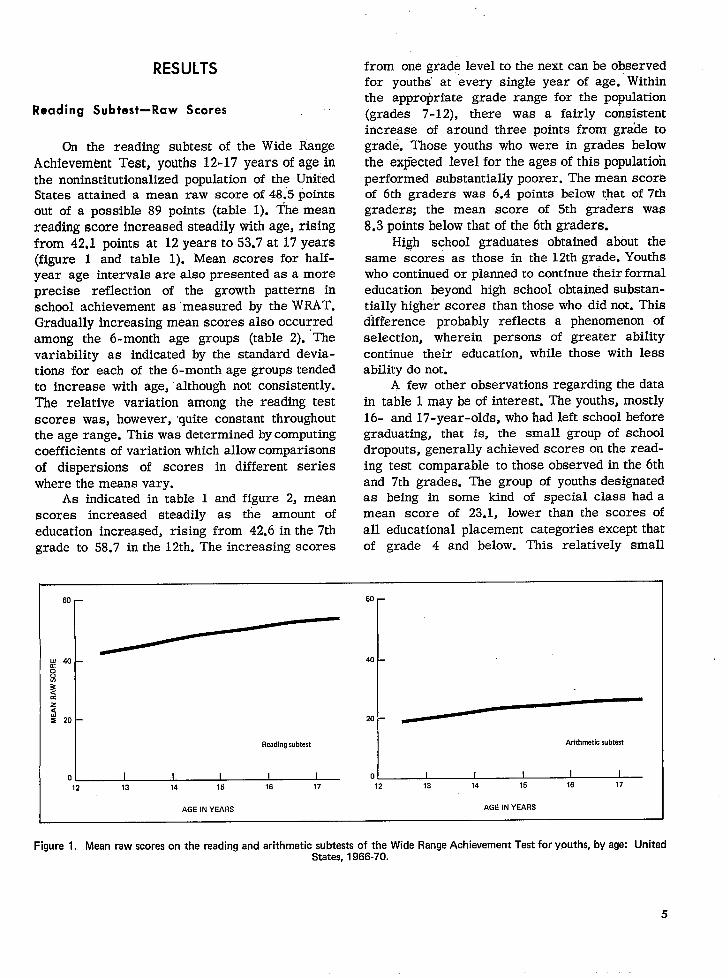
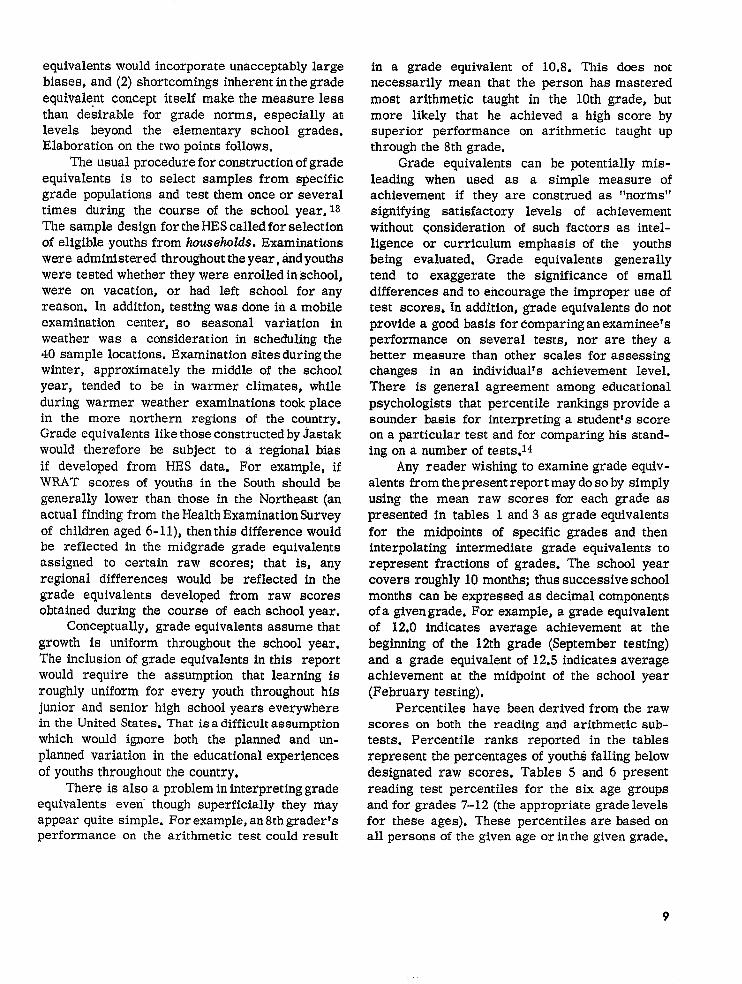
On the reading subtest of the Wide RangeAchievement Test, youths 12-17 years of age inthe noninstitutionalized population of the UnitedStates attained a mean raw score of 48.5 pointsout of a possible 89 points (table 1). fie meanreading score increased steadily with age, risingfrom 42.1 points at 12 years to 53.7 at 17 years(figure 1 and table 1). Mean scores for half-year age intervals are also presented as a moreprecise reflection of the growth patterns inschool achievement as ‘measured by the WRAT.Gradually increasing mean scores also occurredamong the 6-month age groups (table 2). ‘Thevariability as indicated by the standard devia-t ions for each of the 6-month age groups tendedto increase with age, although not consistently.The relative variation among the reading testscores was, however, ‘quite constant throughoutthe age range. This was determined by computingcoefficients of variation which allow comparisonsof dispersions of scores in different serieswhere the means vary.
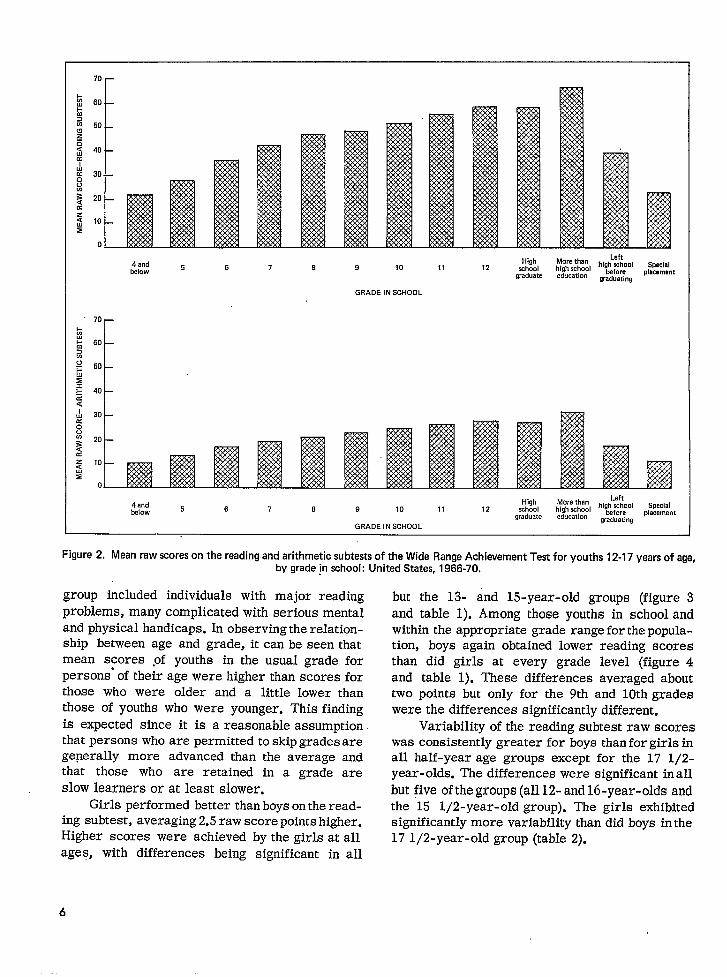
As indicated in table 1 and figure 2, meanscores increased steadily as the amount ofeducation increased, rising from 42.6 in the 7thgrade to 58.7 in the 12th. The increasing scores
from one grade level to the next can be observedfor youths’ at every single year of age. Withinthe appropriate grade range for the population(grades 7-12), there was a fairly consistentincrease of around three points from grade tograde. “Those youths who were in grades belQwthe expected level for the ages of this populationperformed substantially poorer. The mean scoreof 6th graders was 6.4 points below t,hat of 7thgraders; the mean score of 5th graders was8.3 points below that of the 6th graders.
High school graduates obtained about thesame s“cores as those in the 12th grade. Youthswho continued or plamed to continue their formaleducation beyond high school obtained substan-tially higher scores than those who did not. Thisdifference probably reflects a phenomenon ofselection, wherein persons of greater abilitycontinue their education, while those with lessability do not.
A few other observations regarding the datain table 1 may be of interest. The youths, mostly16- and 17- year- olds, who had left school beforegraduating, that is, the small group of schooldropouts, generally achieved scores on the read-ing test comparable to those observed in the 6thand 7th grades. The group of youths designatedas being in some kind of special class had amean score of 23.1, lower than the scores ofall educational placement categories except thatof grade 4 and below. This relatively small
60 —
.~”g 40 40 –
$i~K
3!= 20 - 20 –
Readingsubtest Arithmetm sub:est
o I I I I I o I I I I I12 13 14 15 16 17 12 13 14 15 16 17
AGE IN YEARS AGE IN YEARS
Figure 1. Mean raw scores on the reading and arithmetic subtests of the Wide Range Achievement Test for ymsths, by age: UnitedStatas, 1966-70.
5
4 andHigh
Left
below 5 6 7 8 9 10 11 12 #$&l hl&&mlschool
special
graduate educationplacmment
graduating
GRADE IN SCHOOL
4 andHigh Left
below 5 6 7 8 9 10 11 12 school #:fl;::l hlg~d);:l special
graduate educationplacement
GRADE IN SCHOOLgraduating
Figure 2, Mean raw scores on the reading and arithmetic subtests of the Wide Range Achievement Test for youths 12-17 years of age,by grade@ school: United States, 1966-70.
group included individuals with major readingproblems, many complicated with serious mentaland physical handicaps. In observing the relation-ship between age and grade, it can be seen thatmean scores *of youths in the usual grade forpersons” of their age were higher than scores forthose who were older and a little lower thanthose of youths who were younger. This findingis expected since it is a reasonable assumptionthat persons who are permitted to skip grades aregenerally more advanced than the average andthat those who are retained in a grade areslow learners or at least slower.
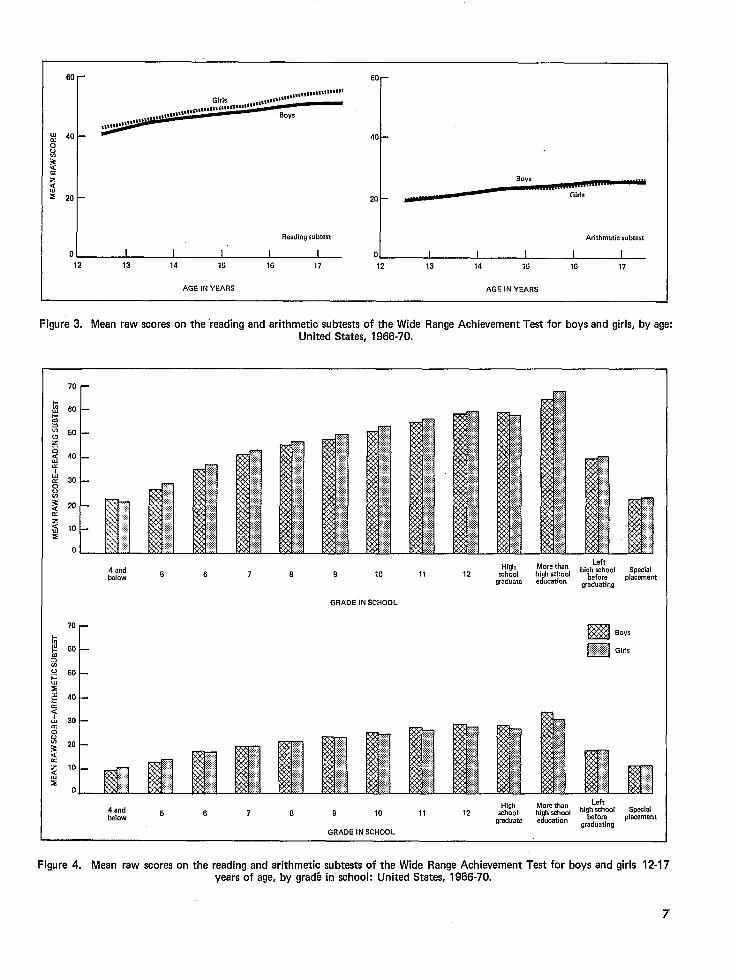
Girls performed better than boys on the read-ing subtest, averaging 2.5 raw score points higher.Higher scores were achieved by the girls at allages, with differences being significant in all
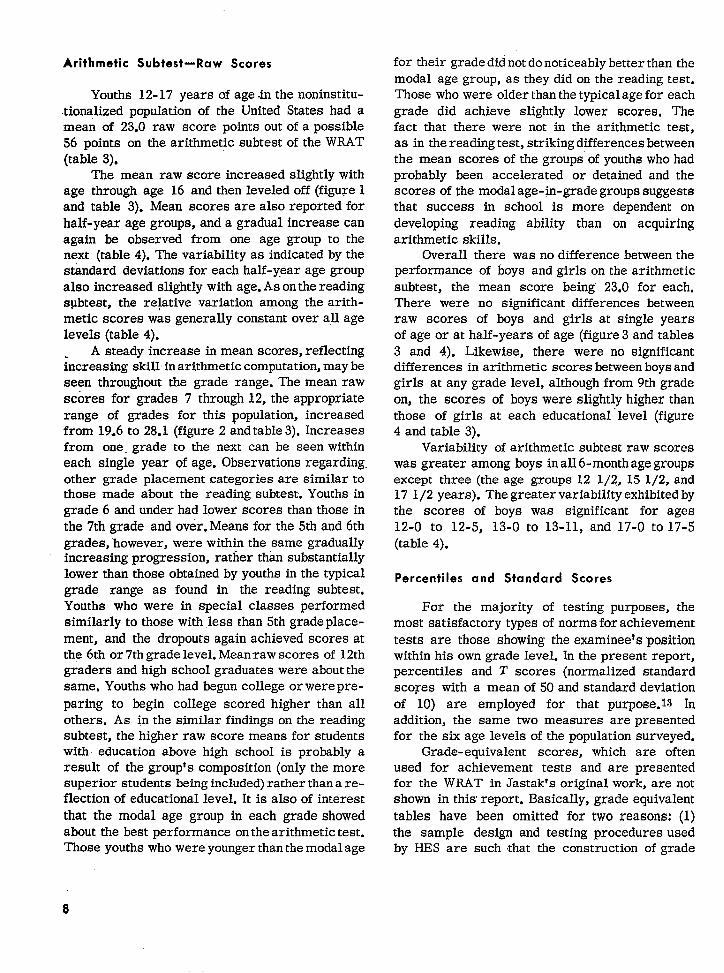
but the 13- and 15- year-old groups (figure 3and table 1). Among those youths in school andwithin the appropriate grade range for the popula-tion, boys again obtained lower reading scoresthan did girls at every grade level (figure 4and table 1). These differences averaged abouttwo points but only for the 9th and 10th gradeswere the differences significantly different.
Variability of the reading subtest raw scoreswas consistently greater for boys than for girls inall half- year age groups except for the 17 l/2-year-olds. The differences were significant in allbut five of the groups (all 12- and 16- year-olds andthe 15 1/2-year-old group). The girls exhibitedsignificantly more variability than did boys in the17 l/2-year-old group (table 2).
6
60 - 60-
Girls
# 40 - 40 -~
~~
j ~.
Boys
20 — Girls
Reading subtest Arithmetic subtesi
o I I I I I o I I I I I12 13 14 15 16 17 12 13 14 15 16 17
AGE IN YEARS AGE IN YEARS
Figure 3, Mean raw scores on the “readingand arithmetic subtests of the Wide Renge Achievement Test for boys and girls, by age:United States, 1966-70.
7n ,_
4 and High More thanLeft
below 5 6 7 6 9 10 11 12~gh ~hool high school Special
sshool beforegraduate education
placementgraduating
GRADE IN SCHOOL
4 andHigh More than Left
below5 6 7 8 9 10 11 12 school ~gh ~hool high school Special
beforegraduate education
placementgraduating
GRADE IN SCHOOL
Figure 4, Mean raw scores on the reading and arithmetic subtests of the Wide Range Achievement Test for boys and girls 12-17years of age, by gradd in school: United States, 1966-70.
7
Arithmetic Subtest-Raw Scores
Youths 12-17 years of age -in the noninstitu-.ticmalized population of the United States had amean of 23.0 raw score points out of a possible56 points on the arithmetic subtest of the WRAT(table 3).
The mean raw score increased slightly withage through age 16 and then leveled off (figure 1and table 3). Mean scores are also reported forhalf-year age groups, and a gradual increase canagain be observed from one age group to thenext (table 4). The variability as indicated by thestandard deviations for each half-year age groupalso increased slightly with age. As on the readingspbtest, the relative variation among the arith-metic scores was generally constant over all agelevels (table 4).
A steady increase in mean scores, reflectingincreasing skill in arithmetic computation, maybeseen throughout the grade range. The mean rawscores for grades 7 through 12, the appropriaterange of grades for this population, increasedfrom 19.6 to 28.1 (figure 2 and table 3). Increasesfrom one. grade to the next can be seen withineach single year of age. Observations regarding.other grade placement categories are similar tothose made about the reading subtest. Youths ingrade 6 and under had lower scores than those inthe 7th grade and over. Means for the 5th and 6thgrades, however, were within the same graduallyincreasing progression, rather than substantiallylower than those obtained by youths in the typicalgrade range as found in the reading subtest.Youths who were in special classes performedsimilarly to those with less than 5th grade place-ment, and the dropouts again achieved scores atthe 6th or 7th grade level, Mean raw scores of 12thgraders and high school graduates were about thesame, Youths who had begun college or were pre-paring to begin college scored higher than allothers. As in the similar findings on the readingsubtest, the higher raw score means for studentswith education above high school is probably aresult of the group’s composition (only the moresuperior students being included) rather than a re-flection of educational level. It is also of interestthat the modal age group in each grade showedabout the best performance on the arithmetic test.Those youths who were younger than the modal age
for their grade did not do noticeably better than themodal age group, as they did on the reading test.Those who were older than the typical age for eachgrade did achieve slightly lower scores. Thefact that there were not in the arithmetic test,as in the reading test, striking differences betweenthe mean scores of the groups of youths who hadprobably been accelerated or detained and thescores of the modal age-@ grade groups suggeststhat success in school is more dependent ondeveloping reading ability than on acquiringarithmetic skills.
Overall there was no difference between theperformance of boys and girls on the arithmeticsubtest, the mean score being 23.0 for each.There were no significant differences betweenraw scores of boys and girls at single yearsof age or at half-years of age (figure 3 and tables3 and 4). Likewise, there were no significantdifferences in arithmetic scores between boys andgirls at any grade level, although from 9th gradeon, the scores of boys were slightly higher thanthose of girls at each educational” level (figure4 and table 3).
Variability of arithmetic subtest raw scoreswas greater among boys in all 6-month age groupsexcept three (the age groups 12 1/2, 15 1/2, and17 1/2 years). The greater variability exhibited bythe scores of boys was significant for ages12-0 to 12-5, 13-0 to 13-11, and 17-0 to 17-5(table 4).
Percentiles and Standard Scores
For the majority of testing purposes, themost satisfactory types of norms for achievementtests are those showing the examinee’s positionwithin his own grade level. In the present report,percentiles and T scores (normalized standardscoyes with a mean of 50 and standard deviationof 10) are employed for that purpose. Is Inaddition, the same two measures are presentedfor the six age levels of the population surveyed.
Grade-equivalent scores, which are oftenused for achievement tests and are presentedfor the WRAT in Jastak’s original work, are notshown in this report. Basically, grade equivalenttables havethe sampleby HES are
been omitted for two reasons: (1)design and testing procedures usedsuch that the construction of grade
8
equivalents would incorporate unacceptably largebiases, and (2) shortcomings inherent in the gradeequivalent concept itself make the measure lessthan desirable for grade norms, especially atlevels beyond the elementary school grades.Elaboration on the two points follows.
The usual procedure for construction of gradeequivalents is to select samples from specificgrade populations and test them once or severaltimes during the course of the school year, IsThe sample design for the HES called for selectionof eligible youths from households. Examinationswere administered throughout the year, imd youthswere tested whether they were enrolled in school,were on vacation, or had left school for anyreason. In addition, testing was done in a mobileexamination center, so seasonal variation inweather was a consideration in scheduling the40 sample locations. Examination sites during thewinter, approximately the middle of the schoolyear, tended to be in warmer climates, whileduring warmer weather examinations took placein the more northern regions of the country.Grade equivalents like those constructed by Jastakwould therefore be subject to a regional biasif developed from HES data. For example, ifWRAT scores of youths in the South should begenerally lower than those in the Northeast (anactual finding from the Health Examination Surveyof children aged 6-11), then this difference wouldbe reflected in the midgrade grade equivalentsassigned to certain raw scores; that is, anyregional differences would be reflected in thegrade equivalents developed from raw scoresobtained during the course of each school year,
Conceptually, grade equivalents assume thatgrowth is uniform throughout the school year.The inclusion of grade equivalents in this reportwould require the assumption that learning isroughly uniform for every youth throughout hisjunior and senior high school years everywherein the United States. That is a difficult assumption
which would ignore both the planned and un-planned variation in the educational experiencesof youths throughout the country,
There is also a problem in interpreting gradeequivalents even” though superficially they mayappear quite simple. For example, an 8th grader’sperformance on the arithmetic test could result
in a grade equivalent of 10.8. This does notnecessarily mean that the person has masteredmost arithmetic taught in the 10th grade, butmore likely that he achieved a high score bysuperior performance on arithmetic taught upthrough the 8th grade.
Grade equivalents can be potentially mis-leading when used as a simple measure ofachievement if they are construed as “norms”signifying satisfactory levels of achievementwithout consideration of such factors as intel-ligence or curriculum emphasis of the youthsbeing evaluated. Grade equivalents generallytend to exaggerate the significance of smalldifferences and to encourage the improper use oftest scores. In addition, grade equivalents do notprovide a good basis for Comparing an examineetsperformance on several tests, nor are they abetter measure than other scales for assessingchanges in an individual’s achievement level.There is general agreement among educationalpsychologists that percentile rankings provide asounder basis for interpreting a student~s scoreon a particular test and for comparing his stand-ing on a number of tests.11
Any reader wishing to examine grade equiv-alents from the present report may do so by simplyusing the mean raw scores for each grade aspresented in tables 1 and 3 as grade equivalentsfor the midpoints of specific grades and theninterpolating intermediate grade equivalents torepresent fractions of grades. The school yearcovers roughly 10 months; thus successive schoolmonths can be expressed as decimal componentsof a given grade. For example, a grade equivalentof 12,0 indicates average achievement at thebeginning of the 12th grade (September testing)and a grade equivalent of 12.5 indicates averageachievement at the midpoint of the school year(February testing).
Percentiles have been derived from the rawscores on both the reading and arithmetic sub-tests. Percentile ranks reported in the tablesrepresent the percentages of youths falling belowdesignated raw scores. Tables 5 and 6 presentreading test percentiles for the six age groupsand for grades 7-12 (the appropriate grade levelsfor these ages). These percentiles are based onall persons of the given age or in the given grade.
9
Similarpercentilesfor the arithmeticsubtestare presentedforageandgradegroupsintables7 and8,respectively.
Comparison of the two subtestswitheachother,withothermeasures ofacademicachieve-ment, or withotherpsychologicaland physicalmeasures may bemisleadingifbasedonpercentile
ranks.Percentilesreflectboththerangeoftestscores obtainedand the distributionof thosescoreswithinanycategoryreported,inthiscaseage and grade levels.Completelysimilardis-
tributionsof scores may not occur for eachsubsample.Indeed,therangeofitemsattemptedon a testliketheW RAT would be expectedtoincreaseover the successiveages and gradesinthepopulationunderdiscussion.
lnviewoftheprecedingdiscussion,thenorm
tablesin thisreportpresentstandardscorescomputedfrom therawscoredistributionsofeachsubtest.The standardscoreequivalentsof rawscores are based on a common scalewithamean of 50 and a standarddeviationof 10
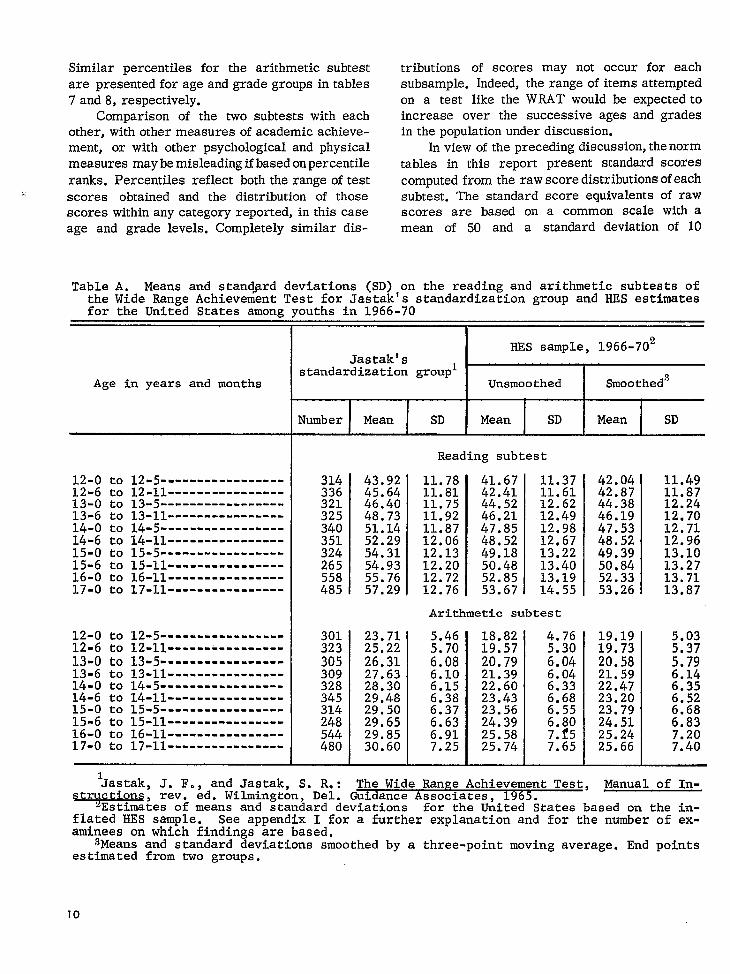
Table A. Means and stand~rd deviations (SD) on the reading and arithmetic subtests ofthe Wide Ramze Achievement Test for Jastak’s standardizationgroup and HES estimatesfor the Unit&d States among
Age in years and months
12-0 to12-6 to13-0 to13-6 to14-0 to14-6 to15-0 to15-6 to16-0 to17-0 to
12-0 to12-6 to13-0 to13-6 to14-0 to14-6 to15-0 to15-6 to16-0 to17-0 to
12-5-----------------12-11----------------13-5-----------------13-11----------------14-5-----------------14-11----------------15-5-----------------15-11----------------16-11----------------17-11----------------
12-5-----------------12-11----------------13-5-----------------13-11----------------14-5-----------------14-11----------------15-5-----------------15-11----------------16-11----------------17-11----------------
-.ouths in 1966-70
HES sample, 1966-702Jastak’s
standardizationgrouplUnsrnoothed Smootheds
Number MeanI
SD Mean SD Mean SD
Reading subtest
314336321325340351324265558485
301323305309328345314248544480
43.9245.6446.4048.7351.1452.2954.3154.9355.7657.29
23.7125.2226.3127.6328.3029.4829.5029.6529.8530.60
11.7811.8111.7511.9211.8712.0612.1312.2012.72
41.6742.4144.5246.2147.8548.5249.1850.4852.85
11.3711.6112.6212.4912.9812.6713.2213.4013.19
42.0442.8744.3846.1947.5348.5249.3950.8452.33
12.761 53.671 14.551 53.26
Arithmetic subtest
5.465.706.086.106.156.386.376.636.917.25
18.8219.5720.7921.3922.6023.4323.5624.3925.5825.74
4.765.306.046.046.336.686.556.807.f57.65
19.1919.7320.5821.5922.4723.2023.7924.5125.2425.66
11.4911.8712.2412.7012.7112.9613.1013.2713.7113.87
5.035.375.796.146.356.526.686.837.207.40
‘Jastak,J. F., and Jastak, S. R.: The Wide Ran e Achievement Test, Manual of In-Sl@, rev. ed. Wilmington, Del. Guidance Asso~iates, 19rj5
Eslzmates of means and standard deviations for the United ;tates based on the in-flated HES sample. See appendfx I for a further explanation and for the number of ex-aminees on which findings are based.
3Means and standard deviations smoothed by a three-pointmoving average. End pointsestimated from two groups.
10
60r 60Jastak
: 40
,,,,,,t,,,,,,,,,,,,,,,,,,,,,8,,s,,,u''''nn'n'n','sns's,sn,sa's't'n,s':E,r',',,,,',','t
4008$
~ ,020
I Reading wbtw
o~ o12 13 14 15 16 17
AGE IN YEARS
Jastak
,,,,,,, n,n, t,,, "'1`91'ln'';;~1 '11111111'11111n1'##,',,,, *,,,#,,,,*,,,,9 *n19B,~***’””
Arithmxic subtesr
I I I I I13 14 15 16 17
AGE IN YEARS
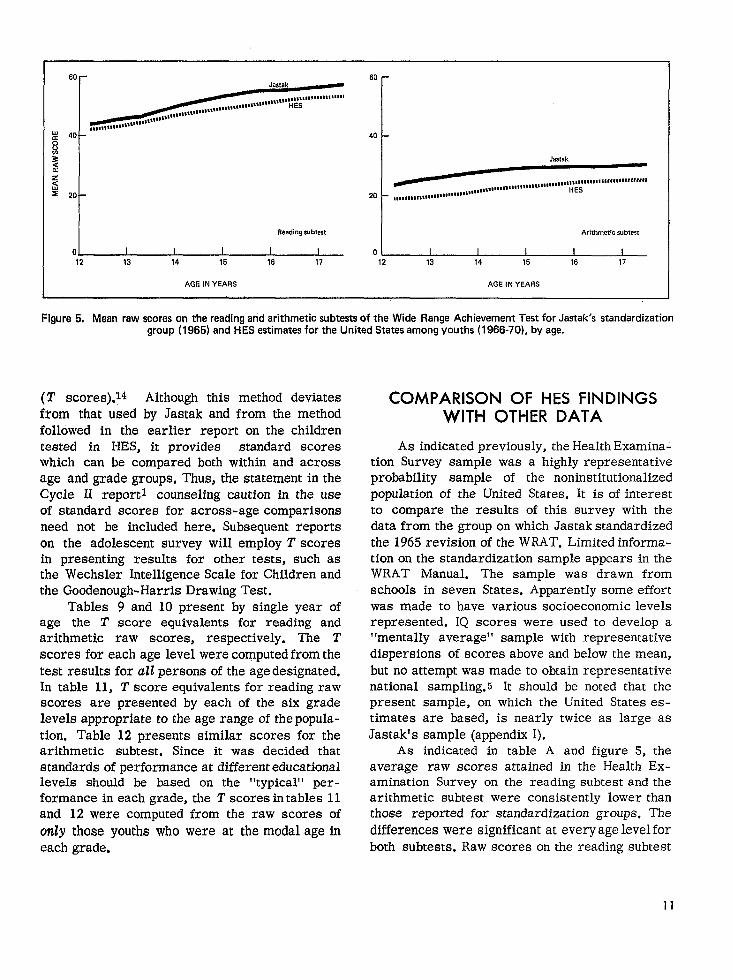
Figure5, Mean rawscores onthereading andarithmetic subtestsofthe Wde Range Achievement Test for Jastak’s standardizationgroup (1965) and HES estimates for the United States among youths (1966-70), by age.
(2’ r3cores).14 Although this method deviatesfrom that used by Jastak and from the methodfollowed in the earlier report on the childrentested in HES, it provides standard scoreswhich can be compared both within and acrossage and grade groups. Thus, the statement in theCycle H reportl counseling caution in the useof standard scores for across-age comparisonsneed not be included here. Subsequent reportson the adolescent survey will employ T scoresin presenting results for other tests, such asthe Wechsler Intelligence Scale for Children andthe Goodenough-Harris Drawing Test.
Tables 9 and 10 present by single year ofage the T score equivalents for reading andarithmetic raw scores, respectively. The T
scores for each age level were computed from thetest results for all persons of the age designated.In table 11, T score equivalents for reading rawscores are presented by each of the six gradelevels appropriate to the age range of the popula-tion. Table 12 presents similar scores for thearithmetic subtest. Since it was decided thatstandards of performance at different educationallevels should be based on the “typical” per-formance in each grade, the T scores in tables 11and 12 were computed from the raw scores ofonly those youths who were at the modal age ineach grade.
COMPARISON OF HES FINDINGSWITH OTHER DATA
As indicated previously, the Health Examina-tion Survey sample was a highly representativeprobability sample of the noninstitutionalizedpopulation of the United States. It is of interestto compare the results of this survey with thedata from the group on which Jastak standardizedthe 1965 revision of the WRAT. Limited informa-tion on the standardization sample appears in theWRAT Manual. The sample was drawn fromschooIs in seven States. Apparently some effortwas made to have various socioeconomic levelsrepresented. IQ scores were used to develop a“mentally average” sample with representativedispersions of scores above and below the mean,but no attempt was made to obtain representativenationalpresentt imatesJastak’s
As
average
sampling. 5 It should be noted that thesample, on which the United States es-are based, is nearly twice as large assample (appendix I).indicated in table A and figure 5, theraw scores attained in the Health Ex-
amination Survey on the reading subtest and thearithmetic subtest were consistently lower thanthose reported for standardization groups. Thedifferences were significant at every age level forboth subtests. Raw scores on the reading subtest
11
of youths in the present study, except for those of12-year-olds, tended to be more variable thanwere the scores of persons in the ,standardizationsample, The HES arithmetic scores were alsomore variable except at ages 12 and 13.
The HES data can also be compared withthose obtained by Schaie in the study summarizedearlier.; In this case there is the opportunity to
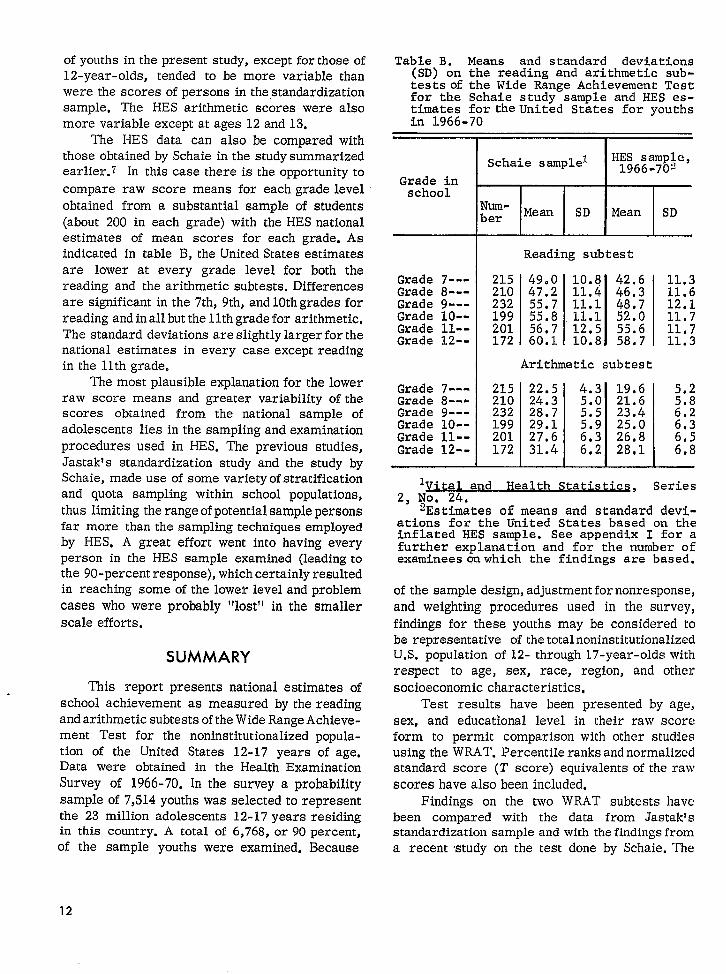
compare raw score means for each grade levelobtained from a substantial sample of students(about 200 in each grade) with the HES nationalestimates of mean scores for each grade. Asindicated in table B, the United States estimatesare lower at every grade level for both thereading and the arithmetic subtests. Differencesare significant in the 7th, 9th, and 10th grades forreading and in all but the 1lth grade for arithmetic,The standard deviations are slightly larger for thenational estimates in every case except readingin the llth grade.
The most plausible explanation for the lowerraw score means and greater variability of thescores obtained from the national sample ofadolescents lies in the sampling and examinationprocedures used in HES, The previous studies,Jastak’s standardization study and the study bySchaie, made use of some variety of stratificationand quota sampling within school populations,thus limiting the range of potential sample personsfar more than the sampling techniques employedby HES. A great effort went into having everyperson in the HES sample examined (leading tothe 90-percent response), which certainly resultedin reaching some of the lower level and problemcases who were probably “lost” in the smallerscale efforts,
SUMMARY
This report presents national estimates ofschool achievement as measured by the readingand arithmetic subtests of the Wide Range Achieve-ment Test for the noninstitutionalized popula-tion of the United States 12-17 years of age.Data were obtained in the Health ExaminationSurvey of 1966-70. In the survey a probabilitysample of 7,514 youths was selected to representthe 23 million adolescents 12-17 years residingin this country. A total of 6,768, or 90 percent,of the sample youths were examined, Because
Table B. Means and standard deviations(SD) on the reading and arithmetic sub-tests of the Wide Range Achievement Testfor the Schaie study sample and HES es-timates for the United States for youthsin 1966-70
Grade inschool
Grade 7---Grade 8---Grade 9---Grade 10--Grade 11--Grade 12--
Grade 7---Grade 8---Grade 9---Grade 10--Grade 11--Grade 12--
Schaie samplel IH;;6;anq#e,--
1
I I Iwnl-~er Mean SD
IMean SD
I I I I
Reading subt es t
215 49.0 10.8 42.6 11.3210 47.2 11.4 46.3 11,6232 55.7 11.1 48.7 12.1199 55,8 11.1 52.0 11*7201 56,7 12.5 55.6 11.7172 6001 10.8 58.7 11.3
Arithmetic subtest
2151 22.51 4.31 19.6 I 5.2210 24.3 5.0 21.6 5.8232 28.7 5.5 23.4 6.2199 29.1 5.9 25.0 6.3201 27.6 6.3 26.8 6,5172 31.4 6.2 28,1 6.8
t I n 1
l~i~al a d Health Statistic, Series2, t’jO. 24.
‘Estimates of means and standard devi-ations for the United States based on theinflated HES sample. See appendix I for afurther explanation and for the number ofexaminees wwhich the findings are based.
of the sample design, adjustment fornonresponse,and weighting procedures used in the survey,findings for these youths may be considered tobe representative of thetotalnoninstitutionalizedU.S. population of 12- through 17-year-olds withrespect to age, sex, race, region, and othersocioeconomic characteristics,
Test results have been presented by age,sex, and educational level in their raw scoreform to permit comparison with other studiesusing the WRAT. Percentile ranks andnormalizedstandard score (T score) equivalents of the rawscores have also been included.
Findings on the two WRAT subtests havebeen compared with the data from Jastaktsstandardization sample and with the findings froma recent study on the test done by Schaie. The
12
HEX estimates of raw score means for age andgrade levels are consistently lower than thoseobtained in the two previous studies.
The Cycle HI HES data demonstrate a con-tinued development of reading and arithmeticskills through the adolescent years and as formaleducation increases. A noteworthy finding is thatgirls in the age range surveyed performed better
than boys on the word recognition and pronuncia-tion task presented by the WRAT. It might bepointed out that a similar finding came from theHES Cycle 11 program when the Level I readingsubtest of the W RAT was administered to children6-11 years old.1 No significant differences betweenboys and girls in arithmetic computational skillswere found in either survey.
—’o 00
REFERENCES
~N:ltiont{l Ct.ntcr for Health Statistics: School achieve-
nwnt uf children 6-11 years as measured by the reading and
arithmetic subtwts of the Wide Range Achievement Test,
United Sr:~tes. I’ital Cd Heakh Statistics. PHS Pub. No.
1~lOtHSwics 1 l-No. 103. Public Health Service.. Washington.
U.S. Gmwrnlncut Printing Office, June 1970.
2Natimml Center for Health Statistics: Plan, operation,
:InLi rcspunw results of a program of children’s examinations.
I ‘it,d aI~d H1,a/t/l St,Itistic.r. PHS Pub. No. 1000-Series l-No. 5.
Public Hc:iltb Service. Washington. U.S. Government Printing
(lflke, Oct. 1967.~NLltiOll:i[ Ccrltcr for Hc:llth Statistics: plan and operation
of n Iluolth cxamirmt ion survc , 0} f U.S. youths 12-17 years of
:Igc. I ‘it,tl {III({ He,IltlI St’~tistics. PHS Pub. No. 1000-Series
1-Nw X, Public Hcakh Service. Washington. U.S. Government
Printing Officu, Sept. 1969.‘iN:lti”n,ll Center for Health Statistics: Evaluation of
Iwychologicol mc:lsurcs used in the Health Examination Survey
of children ages 6-11. Vital at~dHealth Statistics. PHS Pub. No.
1(ltl~LScrics 2-No, 15. public Health Service. Washington. U.S.
Guvcrrtmcnt Printing Office, Mar. 1966.
5 Jwta!i, J, F., and Bijou, S. W,: The Iuide Range Achierre-I)IL+Itt‘l”t~.ft.Wihniugton, Del. C. L. Story Co., 1946.
t~~:lst;tk, J. F., :Ind Jasta!i, S. R.: The Wide Range Ackieve-ItI1,IItTc,st, J1,III1{(I1of” 1}1.strl~ctions,rev. cd. Wilmington, Del.
Guidance Associates, 1965,
7Nation:~l Center for Health Statistics: A study of the
wbicvmcut test used in the Health Examination Surveys of
pcrsuns :Igcd 6-17 years. l’itul and Health Statistics. PHS pub.
No. 1000-Series 2-No. 24. Public Health Service. Washington.
U.S. Gcwernmcnt Printing Office, June 1967.
8 huros, (), K.: The Seuenth Mental Measurements Yeur-hook, Vtd. 1. Highkmd Park, N.J. The Gryphon Press, 1972.
9Washington, E.’ D., and Teska, J. A.: Correlation betw~enthe Wide Range Achievement Test, the California Achievement
Tests, the Stanford-Binet and the Illinois Test of Psycho-
linguistic Abilities. Psyclzol. Rep. 26(1) :291-294, 1970.
10oldridge, O. A.: A congruent validity study of the Wide
Range Achievement Test at grade seven. Ecinc. Psych. Meas.
24(2):415-517, 1964.
11 Reger, R.: Brief tests of intelligence and academic
achievement. Psyclro~. Rep. 1 l(l) :82, 1962.1 Zcochran, M. L., and Pedrini, D. T.: The concurrent
validity of the 1965 WRAT with adult retardates. Am. j. Merit.
De&. 73(4) :654-656, Jan. 1969.
13Anastasi, A.: Psychologkal Testing, 3d ed. New York.
The Macmillan Co., 1968.14Angoff, W. H.: Scales, norms, and equivalent scores, in
R. L. Thorndike, editor, Educatiorral Measwernent, 2d edition.
Washington, D.C. American Council on Education, 1971.15National Center for Health Statistics: Sample design and
estimation procedures for a national health examination survey
of children, Vital and Heakh Statistics. Series 2-No. 43.
DHEW pub. No. (HSM) 72-1005. Health Services and Mental
Health Administration. Washington. U.S. Government Printing
Office, Aug. 1971.,
16National Center for Health Statistics: Replication: An
approach to the analysis of data from complex surveYs. Vitaf andHealth Statistics. PHS pub. No. 1000-Series 2-No. 14. PublicHealth Service. Washington. U.S. Government Printiqg Office,Apr. 1966.
1 7National Center for Health Statistics: pseudo-
replication: Further evaluation and application of the batanced
half-sample technique. Vital and Health Statistics. PHS pub.
No. 1000-Series 2-No. 31. Public Heidth Service. Washington,
U.S. Government Printing Office, Jan. 1969.
13
LIST OF DETAILED TABLES
Page
Table 1. Mean reading raw scores on the Wide Range Achievement Test for youths,by sex, age, and educational level: United States, 1966-70-------------- 15
2. Means, standard deviations (SD), coefficients of variation (SD/mean), andstandard errors (SE) of means for raw scores on the reading subtest ofthe Wide Range Achievement Test for youths,by age and sex:United States,1966-70----------------------------------------------------------------- 15
3. Mean arithmetic raw scores on the Wide Range Achievement Test for youths,by sex, age, and educational level: United States, 1966-70-------------- 16
4. Means, standard deviations (SD),coefficients of variation (SD/mean), andstandard errors (SE) of means for raw scores on the arithmetic subtestof the Wide Range Achievement Test for youths,States, 1966-70
by age and sex: United-------- ---:------------ -------- -------- -------- --------- 16
5. Percentile equivalents of raw scores on the reading subtest of the WideRange Achievement Test for youths, by sex and age: United States, 1966-70------------------.--------------------------------------------------- 17
6. Percentile equivalents of raw scores on the reading subtest of the WideRange Achievement Test for youths 12-17 years,by sex and grade inschool:United States, 1966-70-------------------------------------------------- 18
7. Percentile equivalents of raw scores on the arithmetic subtest of theWb& R#ge Achievement Test for youths, by sex and age: United States,
------- ---------.---- --------------------- ------- ---------------- 19
8. Percentile equivalents of raw scores on the arithmetic subtest of theWide Range Achievement Test for youths 12-17 years, by sex and grade inschool: United States, 1966-70 ------------------------------------------ 20
9. T score equivalents of raw scores on the reading subtest of the WideRange Achievement Test for youths, by age: United States, 1966-70------- 21
10. Tscore equivalents of raw scores on the arithmetic subtest of the WideRange Achievement Test for youths, by age: United States, 1966-70------- 22
11. Tscore equivalents of raw scores on the reading subtest of the WideRange Achievement Test for youths 12-17 years,by grade in school: UnitedStates, 1966-70 --------------------------------------------------------- 23
12. T score equivalents of raw scores on the arithmetic subtest of the WideRange Achievement Test for youths 12-17 years,by grade in school: UnitedStates, 1966-70 -------- ---------------- -------- -------- ---------------- - 24
14
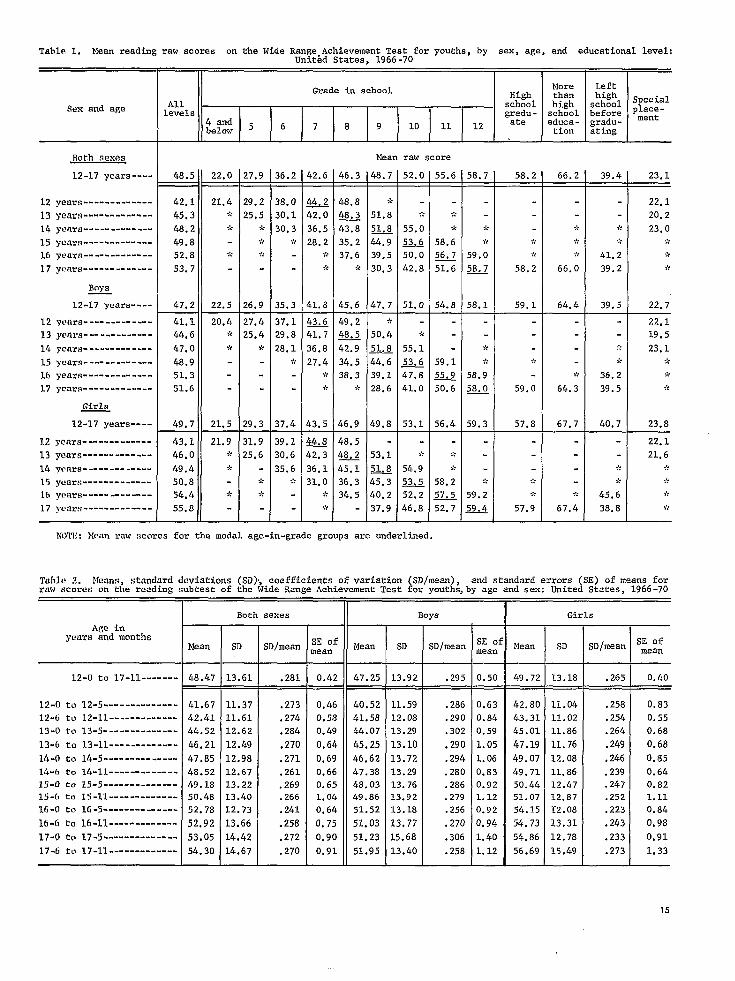
Table 1, Mean reading raw scores on the Wide Range,Achievement Test for youths, by sex, age, and educational level:United States, 1966-7U
Grade in school HighAllLevels
school
4 andgradu-
belaw 5 6 7 8 9 10 11 12 ate
More
thanhighschooleduca-tion
Left Ihighschool Special
before P&+n:-gradu-ating
Sex and age
Both sexes
12-17 years----
12 years-------------
13 years-------------
14 years-------------1~ y~~r~-.-..-------.
16 years-------------17 y(l~~~-.....-.--..--
Boys
12-17 years----
12 years-------------
13 years -------------14 years-------------
15 years-------------
16 years-------------
17 yeare-------------
Girls
12-17 years----
12 years-------------13 yQ~~~..-.-.------
14 ycar9-------------
15 yuars-------------
16 ycvm-s-------------
17 yOars-------------
Mean raw score
48.5 22.0 27,9
42.1 21.4 29.2
45,3 * 25,5
48.2 $: ;~
49.8 - ;’~
52.8 >,? >,<
53,7 - -
47.2 22.5 26.9
41.1 20.4 27.4
44.6 ~’~25,4
47.0 $C ~~
48.9 - -
51,3 - -
51.6 - -
49.7 21.5 29.3
43.1 21.9 31.9
46,0 $~ 25.6
49.4 * -
50.8 - ;’:
54.4 >,? ;,<
55.8 - -,
36.2 42.6 46.3 148.7 52.0 55.6 58.7 58.2 66.2 39.4 23.1
38.0
30,1
30.3.*
35.3
~42.0
36.5
28.2>,<
>!
41.8
48.8 *
~ 51.8
43.8 ~
35.2 44.9
37.6 39.5
$< 30.3
45.6 47.7
22.1
20.2
23.0.,.,.
>,,
>k
22.7
,,,.
55.0
~
50,0
42.8
51.0
>,,.,,:
58.6
56.7
51.6
54.8
.:
.A.
58.2
59.1
>k
.:
>,,
66,0
64.4
37.1
29.8
28.1>?
37.4
39.1
30.6
35.6,,,
43
41.7
36.8
27,4>?
$,
43.5
4-
42.3
36.1
31.0>,:
>,<
:
49.2 >~
~ 50.4
42.9 ~
34.5 44,6
38.3 39.1
~~ 28.6
46.9 49.8
48.5 -
Q._2 53.1
45.1 ~
36.3 45.3
34.5 40.2
- 37.9
22.1
19.5
23.1>,<
,,.,,<
23.8
22.1
21.6
$:
>:-
>,:
,,:
,~
55.1
~
47,8
41.0
53.1
,!..
54.9
~
52.2
46.8
59.1
~
50.6
56.4
;.,
>k
58.2
~
52.7
,,<
59.0
57.8
.:.
.,.>.
57.9
>’(
64.3
67.7
,,>.
67.4
,?>k
36.2
39.5
40,7
>)<
,:-
45.6
38.8
NOTE: Ncan raw scores for the modal age-in-grade groups are underlined.
Tnblo 2, Ffeans,standard deviations (SD)j coefficients of variation (SD/mean), and standard errors (SE) of means forraw scares cm the reading subtest of the Wide Range Achievement Test for vouths.bv age and sex: United States. 1966-70
Age inyears and monthe
Both sexes Boys Girls
SD
13.18
11.04
11.02
11.86
11.76
12.08
11.86
12.4712.87
12.08
13.31
12.78
15.49
SE of IIMeanneanSE o: SE of
meanMean SD SD/mean SD 3D/mean Mean SD/mean
0.42 47.25
0.46 40.52
0.58 41.58
0.49 44.07
0.64 45.25
0.69 46.62
0.66 47.38
0.65 48.031.04 49.86
0.64 51.52
0.75 51.03
0.90 51,23
0.91 51.95
3.2-oto 17-11-------
12-0 ta 12-5--------------
12-6 to 12-Ll-------------
13-0 ta 13-5--------------
13-6 tcl13-11-------------
L4-O tcl14-5--------------
14-G to 14-11-------------
15-0 to 15-5--------------15-6 to 15-11-------------
16-0 to 16-5--------------
16-6 to 16-11-------------
17-0 to 17-5--------------
17-6 to 17-11-------------
48.47 13.61 .281 13.92 .295 0,50 49.72 .265 0.40
41,67
42.41
44.52
46.21
47.85
48.52
49.1850.48
52.78
52,92
53.05
54.30
11.37
11.61
12.62
12.49
12.98
12.67
13.2213.40
12.73
L3.66
14.42
14.67
.273
.274
.284
.270
.271
.261
.269
.266
.241
.258
.272
.270
11.59
12.08
13.29
13.10
13.72
13.29
13.7613.92
13.18
13.77
15.68
13.40
.286
.290
.302
.290
.294
.280
.286
.279
.256
.270
.306
.258
0.63
0.84
0.59
1.05
1.06
0.83
0.921.12
0.92
0.94
1.40
1.12
42.80
43.31
45.01
47.19
49.07
49.71
50.4451.07
54.15
54.73
54.86
56.69
.258
.254
.264
,249
.246
.239
.247
.252
.223
.243
.233
.273
0.83
0.55
0.68
0.68
0.85
0.64
0.821.11
0.84
0,98
0.91
1.33
15
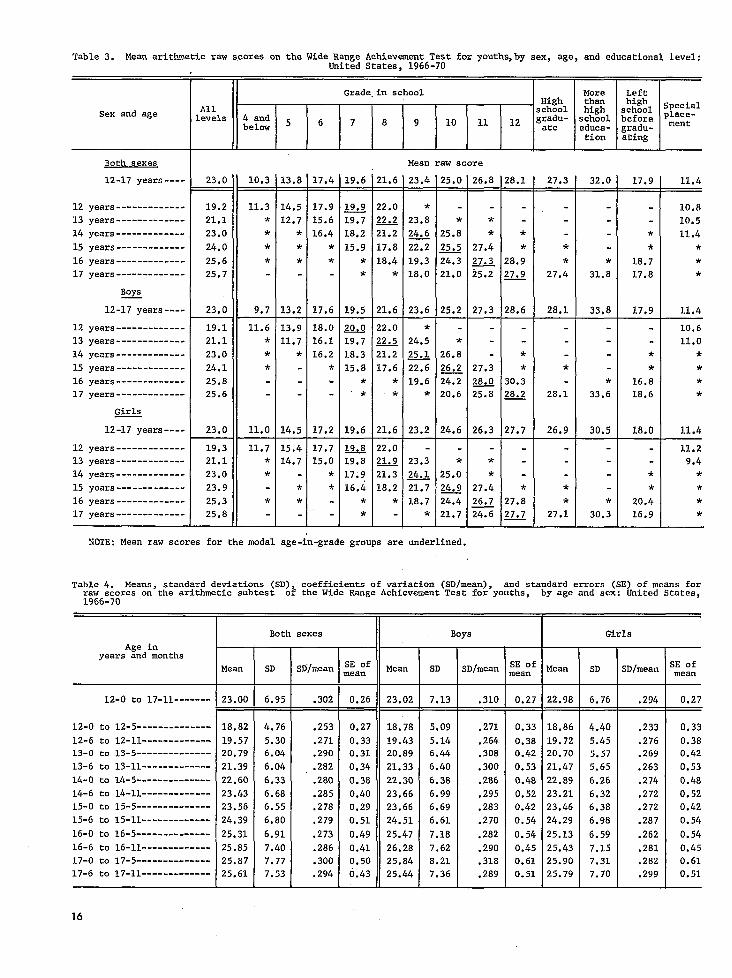
Table 3. Mean arithmetic raw s,coreson the Wide Range Achievement Test for youths,by sex, age, and educational level:United States, 1966-70
Grade.in school More Left
AllHigh than
. . I I I I I I I School h$gh- &$l Special.evels 4 and school before p~n:-
below 5 6 7 8 9 10 11 12gradU-ate educa- gradu-
tion ating
Sex and age
Both sexes
12-17 years----
12 yeara-------------
13 years-------------
14 years-------------
15 years-------------
16 years-------------
17 years-------------
Boys
12-17 yeara----
12 years-------------
13 years-------------
14 years-------------
15 years-------------
16 years-------------
17 years-------------
Girls
12-17 years----
12 years-------------
13 years-------------
14 years-------------
15 years-------------
16 years-------------
17 years-------------
Mean raw score
19.6 121.623.0 10.3
19.2 11.3
21.1 *
23.0 *
24.0 *
25.6 *
25.7
23.0 9.7
19.1 11.6
21.1 *
23.0 *
24.1 *
25.8
25.6
23.0 11.0
19.3 11.7
21.1 *
23.0 *
23.9 -
25.3 *
25.8
13.8 17.4 23.4 125.0 26.8 28.1 27.3 32.0 17.9 11.4
14.5
12.7*
*
*
13.2
17.9
15.6
16.4*
*
17.6
18.0
16.1
16.2*
.
17.2
19.9 22.0
G ~
18.2 21.2
15.9 17.8
* 18.4* *
19.5 21.6
Q& 22.0
19.7 ~
18.3 21.2
15.8 17.6* *
* *
19.6 21.6
lJQ 22.0
19.8 ~
17.9 21.3
16.4 18.2* *
* -
* -23.8 *
24.6 25.8
22.2 25.5
19.3 24.3
18.0 21.0
23.6 25.2
* -
24.5 *
25.1 26.8
z 26.2
19.6 24.2
* 20.6
23.2 24.6
- -
23.3 *
24.1 25.0
G ~
18.7 24.4
* 21.7
10.8
10.5
11.4*
*
*
11.4
**
27.4
~
25.2
27.3
**
28.9
~
28.6
**
27.4
28.1
*31.8
33.8
**
18.7
17,8
17.9
13.9
11.7*
-
14.5
10.6
11.0*
*
*
*
11.4
27.3
2~
25.8
26.3
**
30.3
28.2
27.7
*
28.1
26.9
*33.6
30.5
-
**
16.8
18.6
18.0
15.4
14.7
*
*
17.7
15.0*
*
11.2
9.4*
*
*
*
**
27.4
26.7
%
*27.8
27.7
**
27.1
*30.3
-**
20.4
16.9
NOTE: Mean raw scores for the modal age-in-grade groups are underlined.
Table 4. Means, standard deviations (SD), coefficients of variation (SD/mean), and standard errors (SE) of means forraw scores On the arithmetic subtest of the Wide Range Achievement Test for youths,1966-70
by age and sex: United States,
Both sexes
i=
SE of Meannean
Boys
--t;E of MeanBean
Girls
Age inyears and months
;D/mean
.310
.271
.264
.308
.300
.286
.295
.283
.270
.282
.290
.318
.289
SD
6.76
4.40
5.45
5.57
5.65
6.26
6.32
6.38
6.98
6.59
7.15
7.31
7.70
;E ofmean
0.27
0.33
0.38
0.42
0.53
0.48
0.52
0.42
0.54
0.54
0.45
0.61
0.51
SD
6.95
4.76
5.30
6.04
6.04
6.33
6.68
6.55
6.80
6.91
7.40
7.77
7.53
SDlmeanMean
23.00
SD ;D/mean
.294
.233
.276
.269
.263
.274
,272
.272
.287
.262
.281
.282
.299
0.27 22.98
0.33 18.86
0.38 19.720.42 20.70
0.53 21.47
0.48 22.89
0.52 23.21
0,42 23.46
0.54 24.29
0.54 25,13
0.45 25.43
0.61 25.90
0.51 25.79I0.26 23.02
0.27 18.78
0.33 19.43
0.31 20.89
0.34 21.33
0.38 22.30
0.40 23.66
0.29 23.66
0.51 24.51
0.49 25.47
0.41 26.28
0.50 25.84
0.43 25.44
12-0 to 17-11------- .302 7.13
5.09
5.14
6.44
6.40
6.38
6.99
6.69
6.61
7.18
7.62
8.21
7.36
12-0 to 12-5--------------
12-6 to 12-11-------------
13-0 to 13-5--------------
13-6 to 13-11-------------
14-0 to 14-5--------------
14-6 to 14-11-------------
15-0 to 15-5--------------
15-6 to 15-11-------------
16-0 to 16-5--------------
16-6 to 16-11-------------
17-0 to 17-5--------------
17-6 to 17-11-------------
.253
.271
.290
.282
.280
.285
.278
.279
.273
.286
.300
.294
18.82
19.57
20.79
21.39
22.60
23.43
23.56
24,39
25.31
25.85
25.87
25.61
16
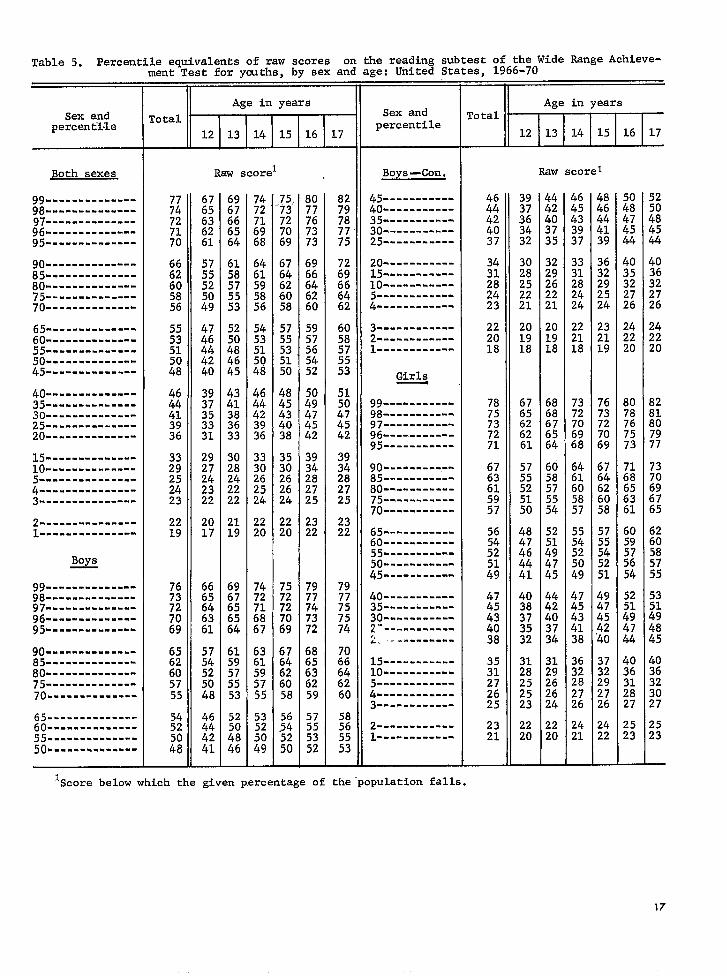
Table 5. Percentileequivalentsof raw scores on the reading subtest of the Wide Range Achieve-ment Test for youths, by sex and age: United States, 1966-70
Sex andpercentile
Both sexes
99--------------98-------------------------..-
%-------------95--------------
90--------------85--------------80--------------75--------------70--------------
--------- -----%--------------55--------------
--------------&-------------
jg------------------------ ----
30--------------25--------------20--------------
--------- -----L---------------------..--:---------------3.......--------
2---------------1......---------
Boys
. . . . . . . . . -..--%--------------97=-------------96--------------95--------------
90--------------85--------------80--------------75--------------70--------------
. . . . . . . . . . . . . .K...---------55--------------50--------------
II
II Age in years
Total
13 14 15 16 17
Raw scorel
7774727170
6662605856
2219
6562605755
67
~~
61
575552
:;
4746444240
3937353331
2927242322
2017
6665646361
5754
%48
::4241
/
%666564
615857
%
%484645
4341383633
3028
;:22
2119
6967656564
6159575553
52
;;46
7472
:$68
6461595856
%
%48
4644423936
3330262524
2220
%
::67
6361595755
53
%49
75:-7372
%
6764
:!58
X535150
:;434038
353026
::
2220
757272
;:
6764626058
;:5250
80;;
7373
69
$J
60
5957565452
::474542
39
%2725
2322
E747372
6865636259
57555352—
Sex andpercentile
Boys-Con.
45-----------40-----------35-----------30-----------25-----------
20----------------------
&----------
3------------2------------1-.----------
Girls
99----------------------
%----------96-----------95-----------
90------------85-----------80-----------75-------.-o.-
65-----------60-----------55-----------50-----------45-----------
40-----------35-----------30-----------2------------2. ,.‘---------
15-----------1o-----------------------
;---------------------...
2------------1------------
rotal
lScorebelow which the given percentageof the”populationfalls.
464442j?
::282423
222018
7875737271
6763615957
56
%
:;
47
::4038
353127
;;
2321
Age in yearsI I I I I
12113114115116117
39
X3432
302825
2;
201918
6765626261
5755525150
4847464441
4038373532
;:
$:23
2220
—
Raw scorel
4442403735
3229262221
201918
68
%6564
605857
;:
52
:;4745
4442403734
31
;:2624
2220
464543
:?
3331282424
222118
7372
;:68
6461605857
555452
;:
4745434138
3632282726
2421
4846
::39
3632292524
232119
767372
;:
6764626058
2<54
;:
4947454240
37
:;;;
2422
—
i!474544
;;
322726
242220
8078767573
:;
X61
6-;
575654
52
:;4744
&
:;27
2523
—
17
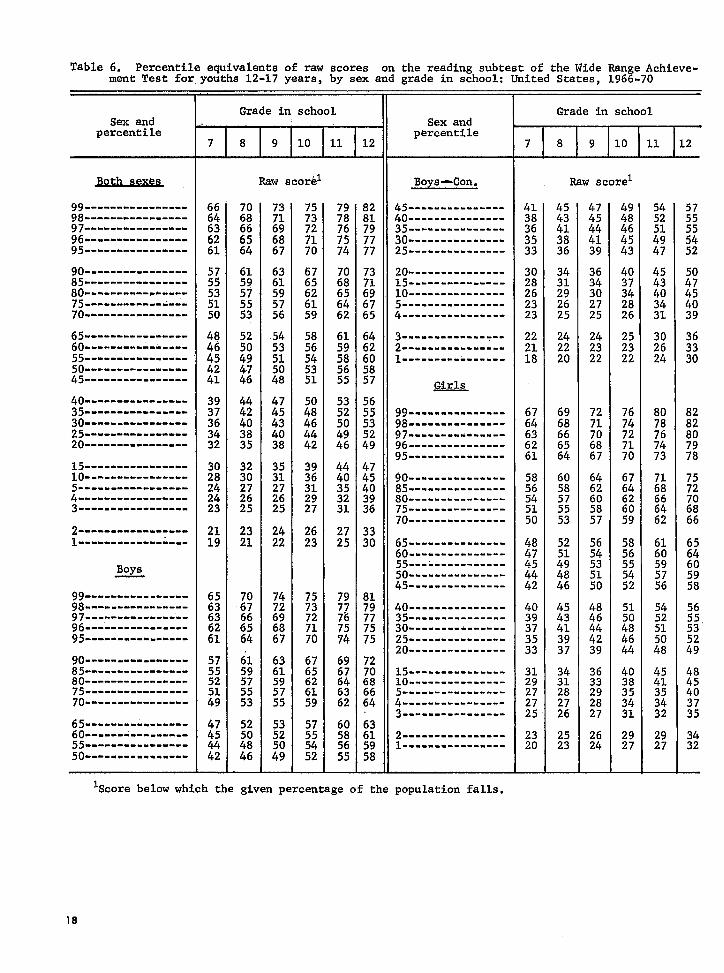
Table 6. Percentileequivalentsof raw scores on the reading subtest of the Wide Range Achieve-ment Test for youths 12-17 years, by sex and grade in school: United States, 1966-70
Sex andpercentile
.BOth s x~se
99----------------98----------------
96----------------95----------------
90----------------
80------------------75----------------70----------------
65----------------60----------------................
%---------------45----------------
40--------*-------35--------------------------------
L------------20----------------
15----------------1o---------------------------------
:-----------------3.......----------
-----------------:----.----.=
Bovs
----------------%---------------97----------------96----------------95----------------
90----------------85----------------;(&-----------------------------
70----------------
65----------------60----------------55----------------50----------------
Grade in school
7 8 9 10 11 12
Raw scorel
6664636261
5755535150
484645
:?
3937363432
302824:~
2119
6563636261
575552
;$
47454442
f%666564
6159
#
52
::4746
4442403835
%27
;;
2321
u
%64
6159575553
52
::46
73
&6867
6361595756
545351
::
474543::
3531
;:25
2422
74
%6867
6361595755
%
::
7573
;:70
6765626159
58
%5351
::46:;
393631
;?
2623
7573727170
:;626159
5755
%
7978767574
::656462
6159585655
53
%
::
4440353231
2725
7977767574
%646362
60585655
8281797777
73
:;6765
6462605857
56
%
i!%
4745$:
36
3330
8179777575
72
:!6664
63615958
Sex andpercentile
Boys-Con.
40---------------35---------------30---------------25---------------
20---------------15---------------1o---------------5......----------
3.......---------2----------------1---------.......
Girls
99---------------98---------------97--------*------
95---------------
90---------------
80---------------75---------------70---------------
65---------------60------------------------------
iL-------------
40-----------------------.-.--.-
%-.--.---d------25---------------20---------------
15---------------1o---------------5........- -------
3----------------2----------------1--------- -------
Grade in school
7 8 9 10 11 12
4138363533
3028262323
22
:;
2;
%61
X!545150
48
:;4442
g
373533
3129
;;25
2320
Raw scorel
4543413836
3431292625
242220
69
%6564
60
2;5553
52
g
46
4543413937
;;
2726
2523
4745444139
3634302725
242322
7271
;:67
6462605857
5654535150
484644$;
:5292827
2624
4948464543
:;
342826
25
;;
7674727170
6764626059
585655
%
51
;:4644
4038353431
2927
5452
:;47
4543403431
302624
8078767473
&666462
6160595756
54
%
::
4541353432
%
5755555452
:;454039
36
%
8282807978
7572
:;66
%605958
56
2:‘
:;
4845403735
3432
%core below which the given percentageof the populationfalls.
18
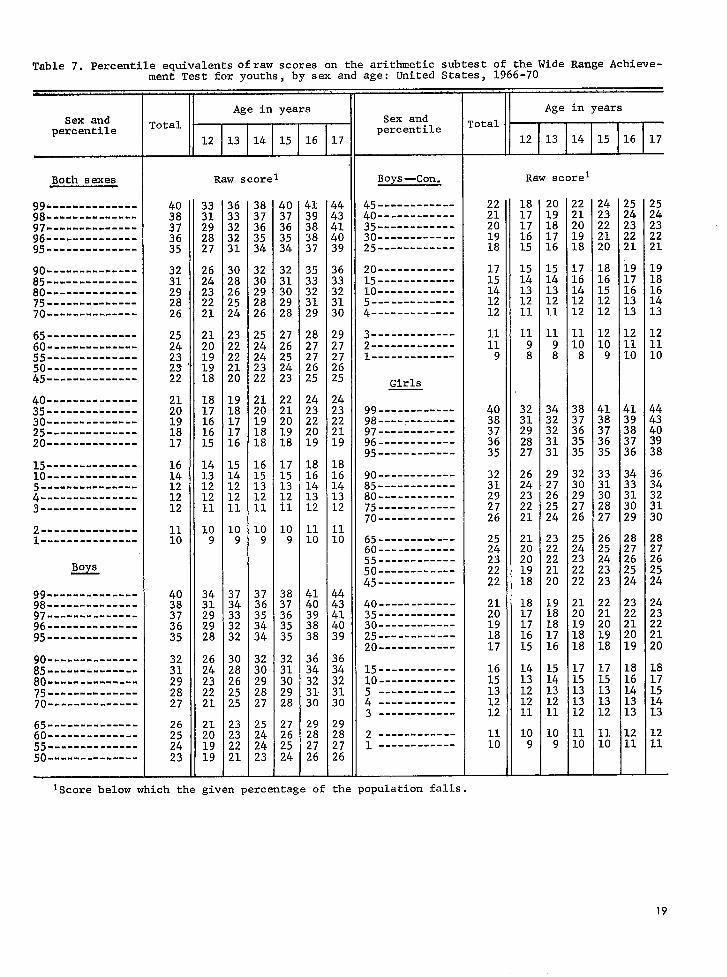
Table 7. Percentile equivalents ofraw scores on the arithmetic subtest of the Wide Range Achieve-ment Test for youths, by sex and age: United States, 1966-70
*
Sex andpercentile
Both sexes
99--------------98--------------97--------------96--------------95--------------
90--” -----------85--------------;y------------
--------- -----70---------”----
65--------------.......-------
%--------”----.-------- -----
:L-------------
&---------------------- --.--
;;------------------------ -----
20--------------
15--------------1o----------------------- .-----
&----------“...-.-... ------
2 --.--,..- .,------1 ---------------
~
99--------------98--------------97--------------96--------------95--------------
.------- ------&------------80--------------75-------”-----”70--------------
65--------------60--------------55------------”-50--------------
II II
4038373635
3231292826
H
;:22
2120191817
1614121212
1110
4038373635
3231
;:27
;;2423
Raw scorel
3331292827
2624232221
2120191918
181716
::
1413121211
109
3431292928
2624232221
21201919
3633323231
3028262524
2322222120
1918171716
1514121211
109
3734333232
3028262525
?3!3!2!l
3837363534
3230292826
2524242322
2120191818
1615131211
109
37
:;3434
3230292827
?5?4i4~3
4037363534
3231302928
2726252423
2221201918
1715131211
109
:;363535
3231302928
?7~6~524
4139383837
3533323129
28
H
$!
2423222019
1816141312
1110
4140393838
3634323130
2928~726
444341g
3633323130
2927
;:25
2423222119
1816141312
1110
:$
414039
3634323130
29282726
Boys—con.
45------------40------------35------------30------------25------------
20------------15------------1o------------5 ------- ------4 --- --- ----- --
3-----.-- -----2---.---- -----1 ------- ------
Girls
99------------98----:-------
------- -----u------------95------------
90------------85------------80------------75------------70------------
65------------60------------
------------H------------45------------
40------------35------------30------------25------------20------------
15------------1o------------5 ---- ..-- -. --4 ---- --- --- --3 -------- ----
2 -------- ----1 -------- ----
naw .L”.c
2221201918
1715
H12
11119
4038373635
3231292726
2524232222
2120191817
H131212
1110
1817171615
1514131211
11
;
323129
:;
2624232221
2120201918
1817171615
1413121211
109
:;181716
1514131211
11
:
3432323131
2927262524
23
H2120
1918181716
15
H
H
LO9
—
:: ~
201918
::
H12
11108
3837363535
3230
::
2524232222
2120191818
1715131312
1110
—
2423222120
1816151212
12109
4138373635
3331302827
2625242323
2221201918
1715131312
1110
2524232221
i917161313
121110
4139383736
::313029
2827262524
23
;:2019
18
i:1313
1211
2524232221
1918
H13
121110
4443;;
38
3634323130
2827262524
2423222120
1817151413
1211
lscore below which the given percentage of the population falls.
19
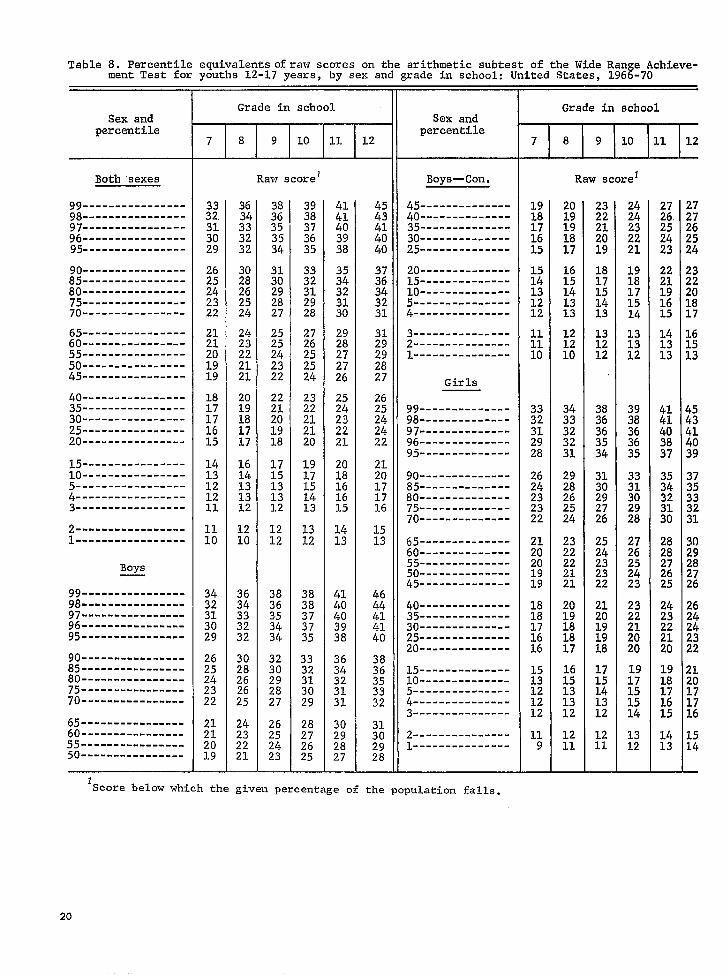
Table 8. Percentilement Test for
Sex andpercentile
Both sexes
99----------------98--------------------------------
K---------------95----------------
-------- --.-----EL---------------80----------------75----------------70----------------
-------- --------%----------------55----------------------.--..-.---
z)---------------
40----------------35----------------30-----------------------------.--
K-------------
-------- --------R---------------5-----------------4-.---------------3-----------------
2--------.--------1-------------.---
Boys
. . . . . . . . . -------;: --------- .--..--97----------------96----------------95----------------
. . . . . . . . . . . . . . . .x----------------80----------------75----------------70----------------
65--------------------------------
k--------------50----------------
equivalentsofraw scores on the arithmeticsubtest of the Wide Ran e Achieve-youths 12-17 years, by sex and grade in school:United States, 196%-70
Grade in school
7 8 9 10 11 12
Raw score’
2313029
2625242322
21
%1919
181717
;:
14
H1211
1110
34
:?3029
x242322
::2019
36
:;3232
3028262524
24
;;2121
2019181717
1614131312
1210
3634333232
302826
;:
24
H21—
::35
:;
313029
%!
2525242322
2221201918
1715
::12
1212
3836353434
3230292827
$:2423—
39
:;3635
3332312928
2726252524
2322212120
19171514L3
1312
%373735
3332313029
H
;;
::g
38
3534323130
292827
;:
2524
%21
2018161615
1413
4140:;
38
363432
;;
3029
$;
4543414040
3736343231
3129
::27
2625
%22
212017
::
1513
46
:;
%
38
x3332
31302928
Sex andpercentile
Boys-Con.
45--------------40--------------35------------------------.-.-
%-------------
-----------..-&-------------1o-----------------------------
2---------------
3---------------2---------------1----.----------
Girls
99----------------------------
;;--------------96--------------95--------------
90----------------------------
R--------------75--------------70--------------
65--------------60--------------55----------------------------
2!i’--------------
40--------------35--------------30----------------------......
%L------------
----.---------R-------------5---------------4.-------------.3-----.---------
---------------:---------------
Grade in school
ZIIEEEE
Raw score]
1918171615
::
:;12
111110
3332312928
262423
;;
212020
:;
H171616
H121212
119
—
20
H1817
H141313
121210
34
;:3231
2928262524
2322222121
20
i:
H
::131312
1211
2322212019
18
H
H
13
?$
38
;:3534
31
%2726
2524232322
2120191918
H14
H
1211
24;2
2221
;;
171514
13
&
:;
363635
3331302928
2726252423
232221
;8
:?151514
1312
2726252423
2221191615
::
13
4141403837
353432
:;
2828272625
242322
;:
1918171615
1413
—1Score below which the given percentageof the population falls.
20
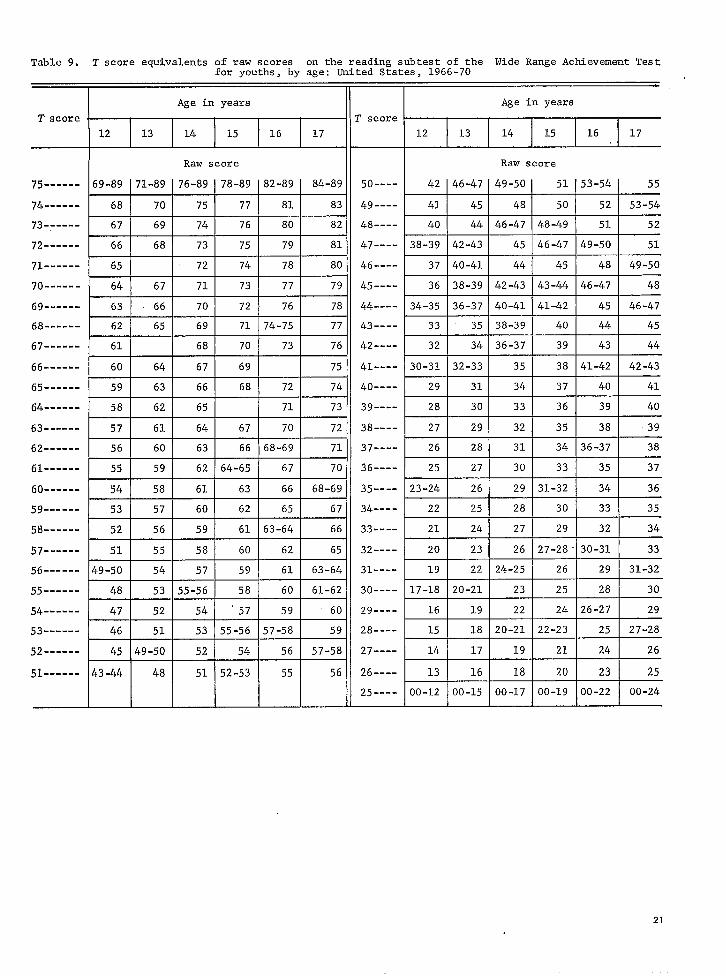
Table 9. T score equivalents of raw scores on the reading snbtest of the Wide Range Achievement Testfor youths, by age: United States, 1966-70
75------
74------
73------
72------
71------
70------
69------
68------
67------
66------
65------
64------
63------
62------
61------
60------
59------
58------
57------
56------
55------
.54------
53------
52------
51------
Raw score
69-89 171-89 176-89 178-89 ]82-89 I 84-89
1 I 1 1 1
65 72 I 74 78 80
64 67 71 73 77 79
63 66 70 72 76 78
62 65 69 71 74-75 77
61 68 70 73 76
60 64 67 69 75
59 63 66 68 72 74
58 62 65 71 73
57 61 64 67 70 72
56 60 63 66 68-69 71
55 59 62 64-65 67 70
.54 58 61 63 66 68-69
53 57 60 62 65 67
52 56 59 61 63-64 66
51 55 58 60 62 65
49-50 54 57 59 61 63-64
48 53 55-56 58 60 61-62
47 52 54 57 59 60
46 51 53 55-56 57-58 59
45 49-50 52 54 56 57-58
43-44 48 51 52-53 55 56
50----
49----
48----
47----
46----
45----
44----
43----
42----
41----
40----
39----
38----
37----
36----
35----
34----
33----
32----
31----
30----
29----
28----
27----
26----
25----
Raw score
42 146-47149-501 51 153-54 I 55
41 45 48 50 52 53-54
40 44 46-47 48-49 51 52
38-39 42-43 45 46-47 49-50 51
37 40-41 44 45 48 49-50
36 38-39 42-43 43-44 46-47 48
34-35 36-37 40-41 41-42 45 46-47
33 35 38-39 40 44 45
32 34 36-37 39 43 44
30-31 32-33 35 38 41-42 42-43
29 31 34 37 40 41
28 30 33 36 39 40
27 29 32 35 38 39
26 28 31 34 36-37 38
25 27 30 33 35 37
23-24 26 29 31-32 34 36
22 25 28 30 33 35
21 24 27 29 32 34
20 23 26 27-28 ‘ 30-31 33
19 22 24-25 26 29 31-32
17-18 20-21 23 25 28 30
16 19 22 24 26-27 29
15 18 20-21 22-23 25 27-28
14 17 19 21 24 26
13 16 18 20 23 25
00-12 00-15 00-17 00-19 00-22 00-24
21
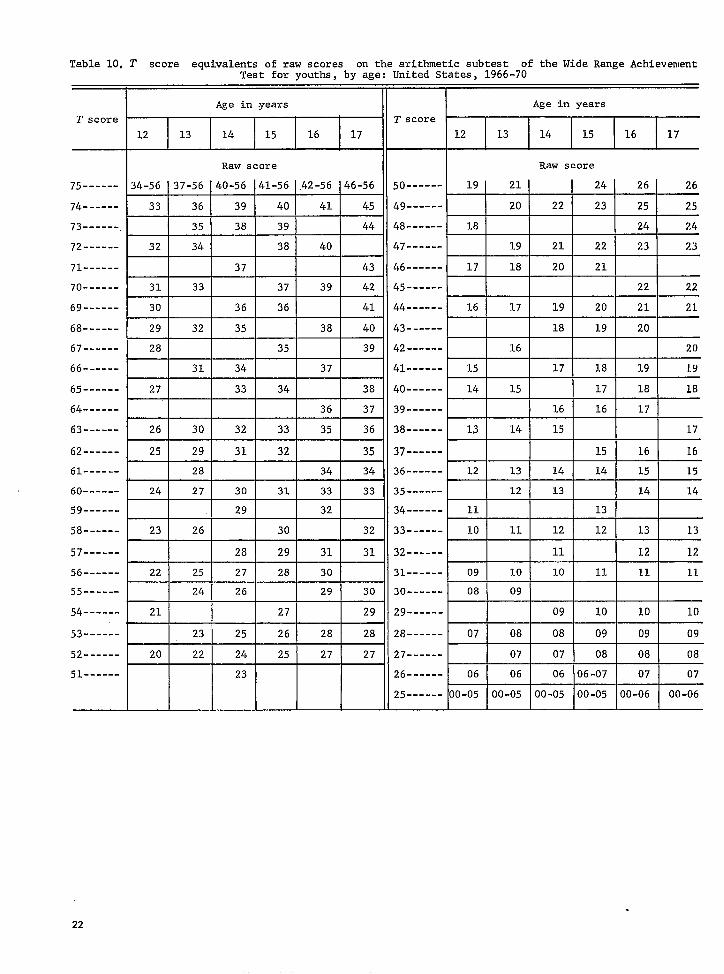
Table 10. T score equivalents of raw scores on the arithmetic subtest of the Wide Range AchievementTest for youths, by age: United States, 1966-70
Age in years
T score
12 13 14 15 16 17
Raw score
75------ 34-56 37-56 40-56 41-56 ,42-56 46-56
74------ 33 36 39 40 41 45
73------- 35 38 39 44
72------ 32 34 38 40
71------- 37 43
70------ 31 33 37 39 42
69------ 30 36 36 41
68------ 29 32 35 38 40
67------ 28 35 39
66------ 31 34 37
65------ 27 33 34 38
64------ 36 37 ~
63------ 26 30 32 33 35 36
62------ 25 29 31 32 35
61------ 28 34 34
60------ 24 27 30 31 33 33
59------ 29 32
58------ 23 26 30 32
57------ 28 29 31 31
56------ 22 25 27 28 30
55------ 24 26 29 30
54------ 21 27 29
53------ I I 231 251 261 281 28/
52------ 20 22 24 25 27 27
51------ 23
I Age in years
T score
12 13 14 15 16 17
I Raw score
50------ 19 2.1 24 26 26
49------ 20 22 23 25 25
48------ 18 24 24
47------ 19 21 22 23 23
46------ 17 18 20 21
45------ 22 22
44------ 16 17 19 20 21 21
43------ 18 19 20
42------ 16 20
41------ 15 17 18 19 19
40------ I 141 151 I 171 181 18
39------ 16 16 17
38------ 13 14 15 17
37------ 15 16 16
36------ 12 13 14 14 15 15
35------ 12 13 14 1.4
34------ 11 13
33------ 10 11 12 12 13 13
32------ 11 12 12
31------ 09 10 10 11 11 11
27------1 I 071 071 081 081 08
26------ I 061 061 06106-07[ 07/ 07
25------ 00-05 00-05 00-05 00-05 00-06 I 00-06
.
22
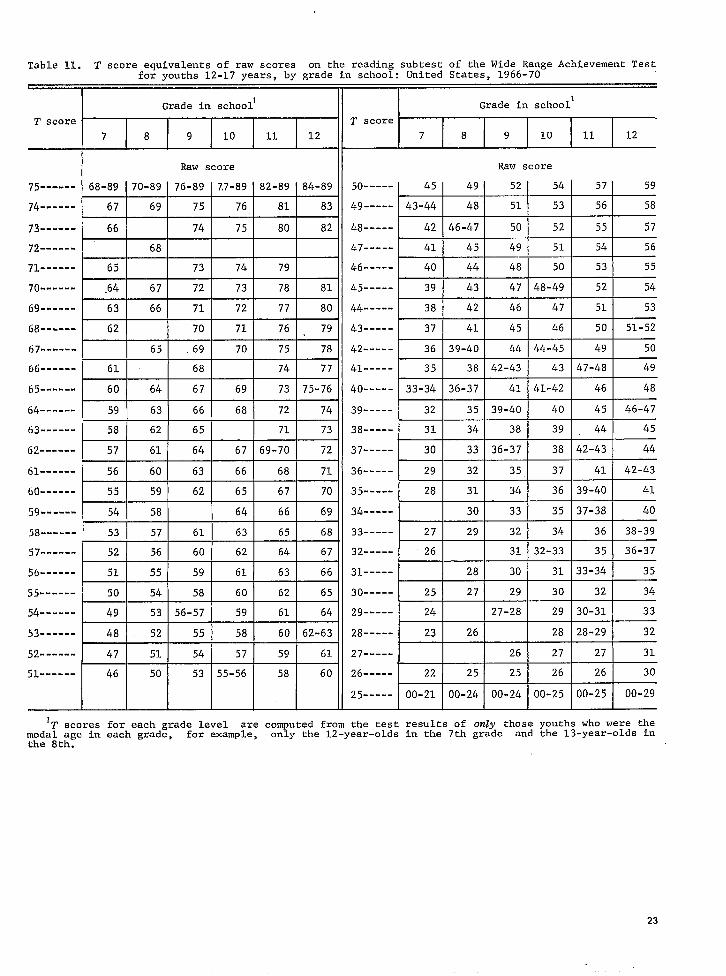
Table 11. T score equivalents of raw scores on the reading subtest of the Wide Range Achievement Testfor youths 12-17 years, by grade in school: United States, 1966-70
Grade in schooll Grade in schooll
T score T score
7 8 9 10 11 12 7 8 9 10 11 12
Raw score Raw score
75------ 68-89 70-89 76-89 7,7-89 82-89 84-89 50----- 45 49 52 54 57 59
74------ 67 69 75 76 81 83 49----- 43-44 48 51 53 56 58
73------ 66 74 75 80 82 48----- 42 46-47 50 52 55 57
72------ 68 47----- 41 45 49 51 54 56
71------ 65 73 74 79 46----- 40 44 48 50 53 55
70------ .64 67 72 73 78 81 45----- 39 43 47 48-49 52 54
69------ 63 66 71 72 77 80 44----- 38 42 46 47 51 53
68------ 62 70 71 76 , 79 43----- 37 41 45 46 50 51-52
67------ 65 69 70 75 78 42----- 36 39-40 44 44-45 49 50
66------ 61 68 74 77 41----- 35 38 42-43 43 47-48 49
65------ 60 64 67 69 73 75-76 40----- 33-34 36-37 41 41-42 46 48
64------ 59 63 66 68 72 74 39----- 32 35 39-40 40 45 46-47
63------ 58 62 65 71 73 38----- 31 34 38 39 44 45
62------ 57 61 64 67 69-70 72 37----- 30 33 36-37 38 42-43 44
61------ 56 60 63 66 68 71 36----- 29 32 35 37 41 42-43
60------ 55 59 62 65 67 70 35----- 28 31 34 36 39-40 41
59------ 54 58 64 66 69 34----- 30 33 35 37-38 40
58------ 53 57 61 63 65 68 33----- 27 29 32 34 36 38-39
57------ 52 56 60 62 64 67 32----- 26 31 32-33 35 36-37
56------ 51 55 59 61 63 66 31----- 28 30 31 33-34 35
55------ 50 54 58 60 62 65 30----- 25 27 29 30 32 34
54------ 49 53 56-57 59 61 64 29----- 24 27-28 29 30-31 33
53------ 48 52 55 58 60 62-63 28----- 23 26 28 28-29 32
52------ 47 51 54 57 59 61 27----- 26 27 27 31
51------ 46 50 53 55-56 58 60 26----- 22 25 25 26 26 30
25----- 00-21 00-24 00-24 00-25 00-25 00-29
lT scores for each grade level are computed from the test results of only those youths who were themodal age in each grade, for example, only the 12-year-olds in the 7th grade and the 13-year-olds inthe 8th.
23
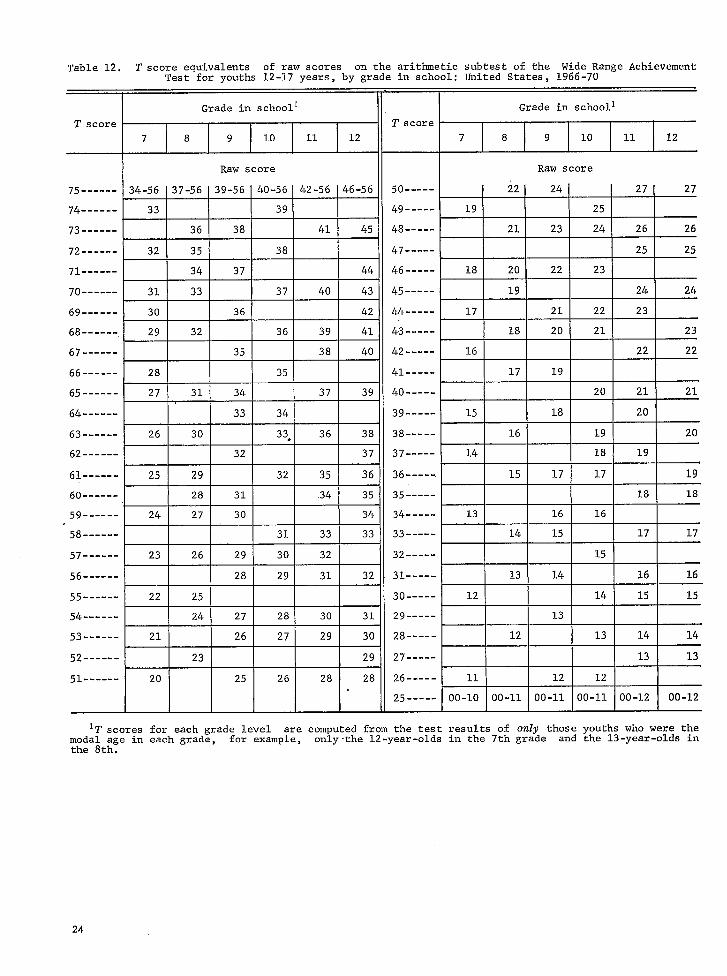
Table 12. T score equivalents of raw scores on the arithmetic subtest of the Wide Range AchievementTest for youths 12-17 years, by grade in school: United States, 1966-70
Grade in schooll
T score
7 8 9 10 11 12
I Raw score
75------ 34-56 137-56 139-56140-561 42-56 146-56, , 1 I
74------ 33 39
73------ 36 38 41 45
72------ 32 35 38
71------ 34 37 44
70------ 31 33 37 40 43
69------ 30 36 42
68------ 29 32 36 39 41
67------ 35 38 40
66------ 28 35
65------ 27 31 34 37 39
64------ 33 34
63------ 26 30 33* 36 38
62------ 32 371 ! , ,
61------ 25 29 I 321 35 36
60------ 28 31 34 35
59------ 24 27 30 34.58------ 31 33 33
57------ 23 26 29 30 32
56------ 28 29 31 32
55------ 22 25
54------ 24 27 28 30 31
53------ 21 26 27 29 30
52------ 23 29
51------ 20 25 26 28 28
Grade in school*
T score
7 8 9 10 11 12
Raw score
50----- 22 24 27 27
49----- 19 25
48----- 21 23 24 26 26
47----- 25 25
46----- 18 20 22 23
45----- 19 24 24
44----- 17 21 22 23
43----- 18 20 21 23
42----- 16 22 22
41----- 17 19
40----- 20 21 21
39----- 15 18 20
38----- 16 19 20
37----- 14 18 19
36----- 15 17 17 19
35----- 18 18
34----- 13 16 16
33----- 14 15 17 17
32----- 15
31----- 13 14 16 16
30----- 12 14 15 15
29----- 13
28----- 12 13 14 14
27----- 13 13
26----- 11 12 12
25----- 00-10 00-11 00-11 00-11 00-12 00-12
IT scores for each grade level are computed from the test results of only those youths who were themodal age in each grade, for example, only-the 12-year-olds in the 7th gradethe 8th.
and the 13-year-olds in
24
APPENDIX I
DEFINITIONS
Age.—The age recorded for each youth was age atlast birthday as of the date of examination. Age was con-firmed by comparison with the date of birth on theyouth’s birth certificate. The age criterion for inclusionin the sample was the age at the time of the first inter-view. Since the examination usually took place 2 to 4weeks after the interview, some youths who were 17years old at the time of interview became 18 years oldby the time of examination. There were 58 such cases.In the adjustment and weighting procedures and in thetmalyai~, these youths were included in the 17-year-old ~OUp.
Gvade. —The grade placement of sample youths wasobtained from the questionnaire sent to the schools theyattended. If educational level was not available from theschool questionnaire, grade placement or the fact ofhaving completed or left school was determined frominformation noted by examiners on one of the psycho-logical test record forms. For youths on summer va-cation, the grade placement recorded was the grade theyouth would enter in the fall. Those included in the “morethan high school education” category are youths whowere enrolled in colleges or training programs beyondhigh school level or youths on summer vacation afterhigh school graduation who planned to continue their ed-ucation in the fall.
—000
25
APPENDIX II
TECHNICAL NOTES
The Survey Design
The sample designs for’the first three programs,Cycles I-III, of the Health Examination Survey wereessentially similar in that each was a multistage,stratified probability sample of clusters of householdsin land-based segments. The successive elements forthis sample design are primary sampling unit (PSU),census enumeration district (ED), segment (a cluster ofhouseholds), household, eligible youth, and finally, thesample youth.
The 40 sample areas and the segments utilized inthe design of Cycle III were the same as those used inCycle II. Previous reports describe in detail the sampledesign used for Cycle II and in addition discuss theproblems and considerations given to other types ofsampling frames anodl~whether or not to control theselection of siblings.”’
Requirements and limitations placed on the designfor Cycle III were similar to those for the design forCycle II.
1. The target population was defined as the civilian,noninstitutionalized population of the UnitedStates (including Alaska and Hawaii) in the agerange of 12-17 years with the special exclusionof children residing on reservation lands of theAmerican Indians, an exclusion adopted as aresult of operational problems encountered onthese lands in Cycle I.
2. The time period of data collection was limitedto about 3 years, and the length of the individualexamination within the specially constructedmobile examination center was between 2 and 3hours.
3. Ancillary data was collected on specially de-signed household, medical history, and schoolquestionnaires and from copies of birth certif-icates.
4. Examination objectives were related primarilyto factors of physical and intellectual growthand development.
5. The sample was sufficiently large to yield re-liable findings within broad geographic regionsand population density groups as well as withinage, sex, and limited socioeconomic groups forthe total sample,
The sample was drawn jointly with the U.S. Bureauof the Census, beginning with the 1960 decennial censuslist of addresses and the nearly 1,900 PSU’S into whichthe entire United States was divided. Each PSU is eithera standard metropolitan statistical arpa, a county, or agroup of two or three contiguous counties. These PSUISwere grouped into 40 strata so that each stratum hadan average size of about 4.5 million persons, and thegrouping was done so as to maximize the degree ofhomogeneity within strata with regard to the populationsize of the PSI-J’S, degree of urbanization, geographicproximity, and degree of industrialization, The 40
strata were then classified into four broad geographicregions of 10 strata each and next cross-classifiedwithin each region by four population density classesand classes of rate of population change from 1950 to1960. Using a modified Goodman-Kish controlled-se-lection technique, one PSU was drawn from each of the40 strata.
Generally, within each PSU, 20 EDIS were selectedwith the probability of selection of a particular EDproportional to its population in the age group 5-9years in the 1960 Census, which by 1966 approximatedthe target population for Cycle III. A similar methodwas used for selecting one segment (a smaller clusterof households) in each ED. Because of the approxi-mately 3-year time interval between Cycle II and CycleIII, the Cycle 111sampling frame was updated for newconstruction and to compensate for segments wherehousing was partially or totally demolished to makeroom for highway construction or urban redevelopment.Each of the resulting 20 segments within a PSU waseither a bounded area or a cluster of households (oraddresses). All the youths in the appropriate age rangewho resided at the address visited were eligible youths,i.e., those eligible for inclusion in the sample. Opera-tional considerations made it necessary to reduce thenumber of prospective examinees at any one location toa maximum of 200. When the number of eligible youths
26
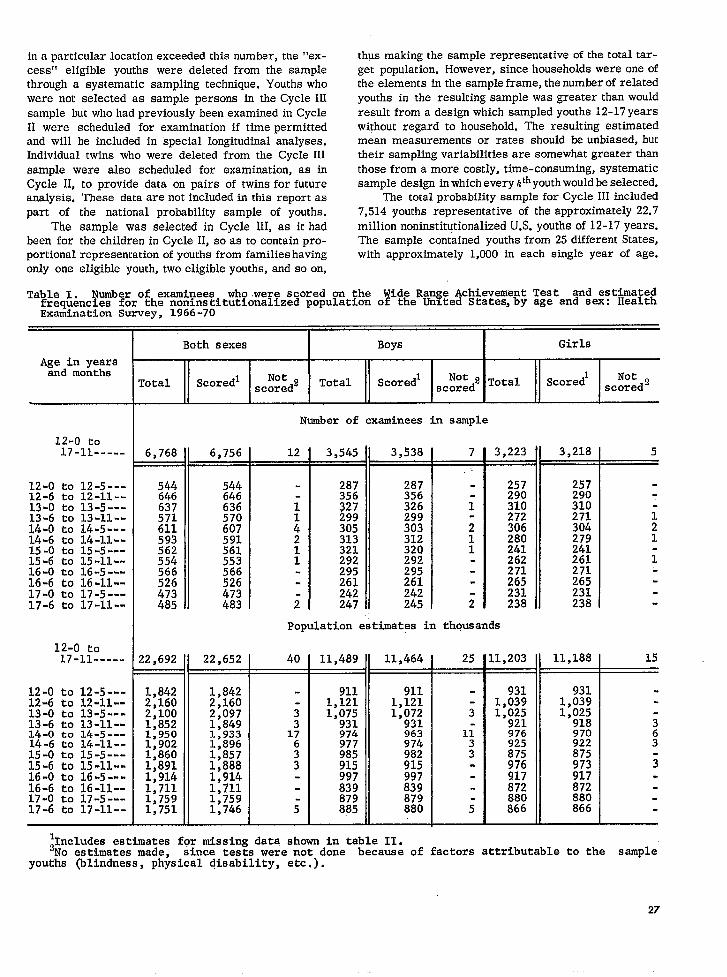
in a particular location exceeded this number, the ‘‘ex-cess” eligible youths were deleted from the samplethrough a systematic sampling technique. Youths whowere not selected as sample persons in the Cycle IIIsample but who had previously been examined in CycleII were scheduled for examination if time permittedand will be included in special longitudinal analyses.Individual twins who were deleted from the Cycle IIIsample were also scheduled for examination, as inCycle 11, to provide data on pairs of twins for futureanalysis. These data are not included in this report aspart of the national probability sample of youths.
The sample was selected in Cycle III, as it hadbeen for the children in Cycle II, so as to contain pro-portional representation of youths from families havingonly one eligible youth, two eligible youth’s, and so on,
thus making the sample representative of the total tar-get population. However, since households were one ofthe elements in the sample frame, the number of relatedyouths in the resulting sample was greater than wouldresult from a design which sampled youths 12-17 yearswithout regard to household. The resulting estimatedmean measurements or rates should be unbiased, buttheir sampling variabilities are somewhat greater thanthose from a more costly, time-consuming, systematicsample design in which every kth youth would be selected.
The total probability sample for Cycle III included7,514 youths representative of the approximately 22.7million noninstitutionalized U.S. youths of 12-17 years.The sample contained youths from 25 different States,with approximately 1,000 in each single year of age.
Table 1. Number of examiqees who were scored on the Wide Ran e Achiev_ent Teat and estimated!?frequencies for the normnstitutionalized population of the Un ted States, by age and sex: Health
Exatninatf.on Survey, 1966-70
Age in yearaand months
12-0 to17-11 -----
12-0 tO 12-5---12-6 to 12-11 --13-0 to 13-5---13-6 to 13-11 --14-0 to 14-5---14-6 to 14-11 --15-0 to 15-5---15-6 tO 15-11 --16-0 to 16-5---16-6 tO 16-11 --17-0 to 17-5---17-6 to 17-11 --
lf;ol:o.----
12-0 tO 12-5---12-6 tO 12-11 --13-0 to 13-5---13-6 to 13-11 --14-0 to 14-5---14-6 tO 14-11 --15-0 to 15-5---15-6 tO 15-11 --16-0 to 16-5---16-6 to 16-11 --17-0 to 17-5---17-6 to 17-11 --
Both sexes I Boya I Girls
Total Scoredl acg:d2 Total Scoredl ‘ot 2 Total Scoredl Notscored scored2
Number of examinees in sample
1‘ ~6,768 6,756 12
::$ ::;
637 636 i571 :;;611 $593 591562 561 1554 553 1566 566526 526473 473485 483 5 1[
3,545 3,538
287 287356 356327 326299 299305 303313 312321 320292 292295 295261 261242 242247 245
257290
i 310272
i 3061 2801 241
262. 271
265231
i 238
51 22’652!40. n,n II . _._l
Population estimates in thousands
1. .34L ! II 1,8422.160 1:2ji60
2,1001,8521,9501,9021,8601,8911,9141,7111,7591,75
-7—..2,0971,8491,9331,8961,8571,8881,9141,7111.759 Ir
11,489 11,464
911 9111,121 1,1211,075 1,072
931 931974 963977 974985 982915 915997 997839 839879 879885 880
3,218
257290310271304279241261271265231238
25 111,203
I 11====-11,188
lIncludea estimates for missing data ahown in table II.2N0 estimates made. since teata were not done because of factors attributable to the sample
youtha (blindness, physical disability, etc.).
27
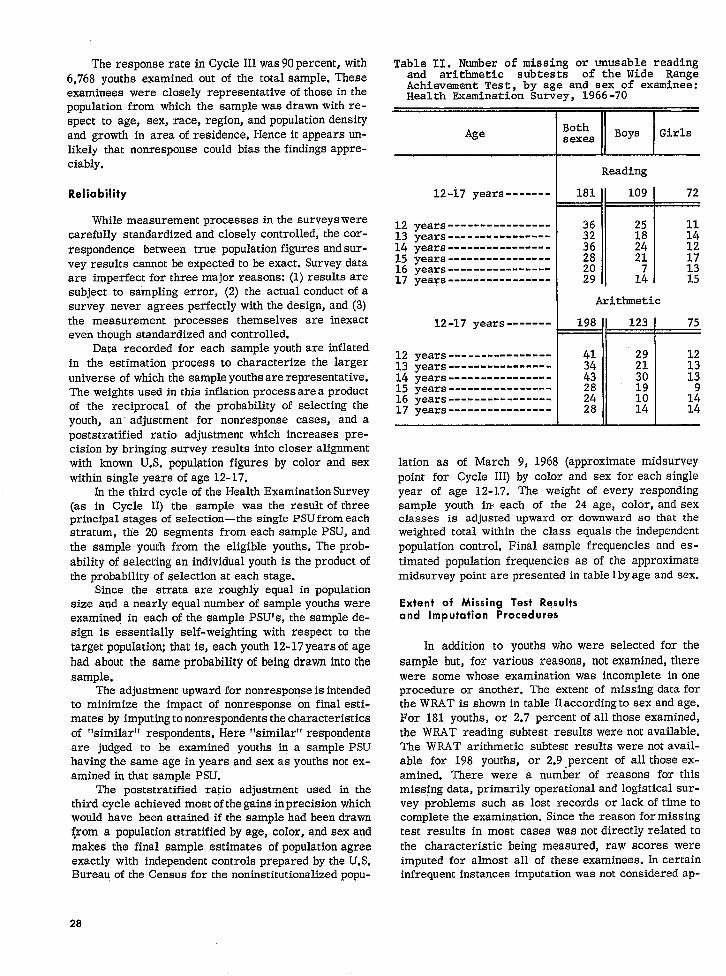
The response rate in Cycle III was 90 percent, with6,768 youths examined out of the total sample. Theseexaminees were closely representative of those in thepopulation from which the sample was drawn with re-spect to age, sex, race, region, and population densityand growth in area of residence, Hence it appears un-likely that nonresponse could bias the findings appre-ciably.
Reliability
While measurement processes in the surveyswerecarefully standardized and closely controlled, the cor-respondence between true population figures andsur-vey results cannot be expected to be exact. Survey dataare imperfect for three major reasons: (1) results aresubject to sampling error, (2) the actual conduct of asurvey never agrees perfectly with the design, and(3)the measurement processes themselves are inexacteven though standardized and controlled.
Data recorded for each sample youth are inflatedin the estimation process to characterize the largeruniverse of which the sample youths are representative.The weights used in this inflation process area prcductof the reciprocal of the probability of selecting theyouth, an’ adjustment for nonresponse cases, and apoststratified ratio adjustment which increases pre-cision by bringing survey results into closer alignmentwith known U.S. population figures by color and sexwithin single years of age 12-17.
In the third cycle of the Health Examination Survey(as in Cycle II) the sample was the result of threeprincipal stages of selection—the single PSU from eachstratum, the 20 segments from each sample PSU, andthe sample youth from the eligible youths. The prob-ability of selecting an individual youth is the product ofthe probability of selection at each stage.
Since the strata are roughly equal in populationsize and a nearly equal number of sample youths wereexamined in each of the sample PSU’s, the sample de-sign is essentially self-weighting with respect to thetarget population; that is, each youth 12-17 years of agehad about the same probability of being drawn into thesample.
The adjustment upward for nonresponse is intendedto minimize the impact of nonresponse on final esti-mates by imputing to nonrespondents the characteristicsof “similar” respondents. Here “similar” respondentsare judged to be examined youths in a sample PSUhaving the same age in years and sex as youths not ex-amined in that sample PSU.
The poststratified ratio adjustment used in thethird cycle achieved most of the gains in precision whichwould have been attained if the sample had been drawn@om a population stratified by age, color, and sex andmakes the final sample estimates of population agreeexactly with independent controls prepared by the U.S.Bureau of the Census for the noninstitutionalized popu-
Table II. Number of missing or unusable readingand arithmetic subtests of the Wide RangeAchievement Test, by age and sex of examinee:Health Examination Survey, 1966-70
Age
12-17 years -------
12 years ----------------13 years ----------------14 years ----------------
15 years ----------------16 years ----------------17 years ----------------
12-17 years -------
12 years ----------------13 years ----------------14 years ----------------15 years ----------------16 years ----------------17 years ----------------
wReading
36 25 1132 18 ;;36 2428 21 1720 1329 1; 15
Arithmetic
I198 123
41 2934 2143 3028 1924 1028 14
75
121313
1214
lation as of March 9, 1968 (approximate midsurveypoint for Cycle III) by color and sex for each singleyear of age 12-17. The weight of every respondingsample youth i~ each of the 24 age, color, and sexclasses is adjusted upward or downward so that theweighted total within the class equals the independentpopulation control. Final sample frequencies and es-timated population frequencies as of the approximatemidsurvey point are presented intableIbyage and sex.
Extent of Missing Test Resultsand Imputation Procedures
In addition to youths who were selected for thesample but, for various reasons, not examined, therewere some whose examination was incomplete inoneprocedure or another. The extent of missing data fortheWRAT is shown in table IIaccordingto sex and age.For 181 youths, or 2.7 percent of all those examined,the WRAT reading subtest results were not available.The WRAT arithmetic subtest results were not avail-able for 198 youths, or 2.9 percent of all those ex-amined. There were a numbr of reasons for thismissing data, primarily operational and logistical sur-vey problems such as lost records or lack of time tocomplete the examination. Since the reason formissingtest results in most cases wasnotdirectly related tothe characteristic being measured, raw scores wereimputed for ahnost all of these examinees. In certaininfrequent instances imputation was not considered ap-
28
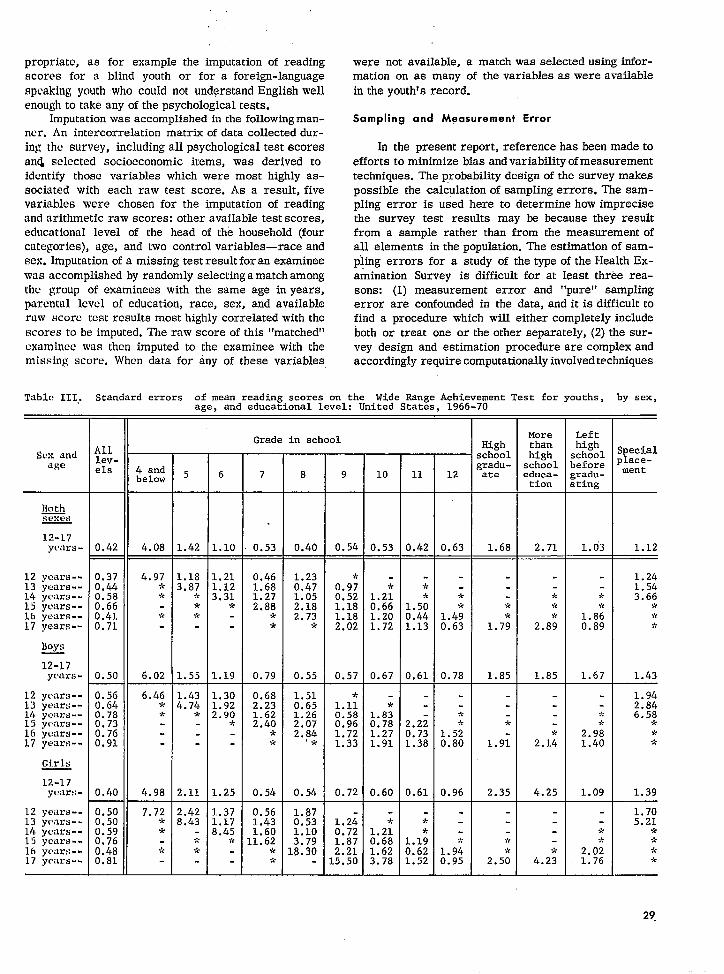
,,
propriate, as for example the imputation of readingscores for a blind youth or for a foreign-languagespeaking youth who could not understand English wellenough to take any of the psychological tests.
Imputation was accomplished in the following man-ner. An intercorrelation niatrix of data collected dur-ing the survey, including all psychological test scoresand selected socioeconomic items, was derived toidentify those variables which were most highly as-sociated with each raw test score. As a result, fivevariables were chosen for the imputation of readingand arithmetic raw scores: other available test scores,educational level of the head of the household (fourcategories), age, and two control variables—race andsex. Imputation of a missing test result for an examineewas accomplished by randomly selecting a match amongthe group of examinees with the same age in years,parental level of education, race, sex, and availableraw score test results most highly correlated with thescores to be imputed. The raw score of this “matched”cxaminee was then imputed to the examinee with themissing score. When data for any of these variables
were not available, a match was selected using infor-mation on as many of the variables as were availablein the youth’s record.
Sampling and Measurement Error
In the present report, reference has been made toefforts to minimize bias and variability of measurementtechniques. The probability design of the survey makespossible the calculation of sampling errors. The sam-pling error is used here to determine how imprecisethe survey test results may be because they resultfrom a sample rather than from the measurement ofall elements in the population. The estimation of sam-pling errors for a study of the type of the Health Ex-amination Survey is difficult for at least three rea-sons: (1) measurement error and “pure” samplingerror are confounded in the data, and it is difficult tofind a procedure which will either completely includeboth or treat one or the other separately, (2) the sur-vey design and estimation procedure are complex andaccordingly require computationally involved techniques
Table 111,. Standard errors of mean reading scores on the Wide Range Achievement Test for youths, by sex,age, and educational level: United States, 1966-70
Morethanhigh
schooleduca -tion
Lefthighschoolbeforegradu-ating
Grade in schoolHighschoolgradu-ate
Alllev-els
;pecial)lace-ment
Sex andage 4 and
below 5 6 7 8 9
0.54
10 11 12
~SCxl?s
12-17years - 0.530.42 4.08 1.42 1.10 0.40 0.53
1.2:0.661.201.72
0.67
0.42 0.63
*
1.4;0.63
0.78
1.68 2.71 1.03 1.12
1.241.543.66
?r>k*
1.43
1.942.846.58
*;k-*
1.39
12 years --13 yuars --14 years--15 ycvms--16 years --17 yctms --
0.370.440.580.660,410,71
0.50
4.97>k>’r
>Y-
6.02
1.183.87
>’r*>k
1.55
L.21L.123.31
*
.
L.19
0.461.681.272.88
>V+$
0.79
1.230.471.052.182.73
*
0.55
0.9;0.521.181.182.02
0.57
*
1.5:0.441.13
0.61
*
1.7;
1.85
*$r
2.8;
1.85
*,,<
1.860.89
1.67
BOVG
12-17years -
12 years --13 years --14 yOars --15 years --16 years --17 years --
0.560.640.780.730.760.91
0.40
6.46%>k
4.98
1.43$.74
*
2.11
L.30L.922.90
?k
L.25
0.682.231.622.40
>k:?
0.54
1.510.651.262.072.84
‘*
0.54
1.1;0.580.961.721.33
0.72
l.zi0.721.872.2115.50
*1.830.781.271.91
0.60
2.2;0.731.38
0.61
*
1.5;0.80
0.96
*
1.9;
2.35
2.1:
4.25
->
2.9;1.40
1.09
Girls
12-17years -
12 years --13 years --14 years --15 ymms --16 years --17 years --
0.500.500.590.760.480.81
7.72:V*
>!
L.37L.173.45
*
0.561.431.60L1.62
*$C
1.870.531.103.79
U3.30
1.705.21
****
29,
1.2;0.681.623.78
*
1.1;0.621.52
1.9i0.95
**
2.50 4.2;
.**
2.021.76
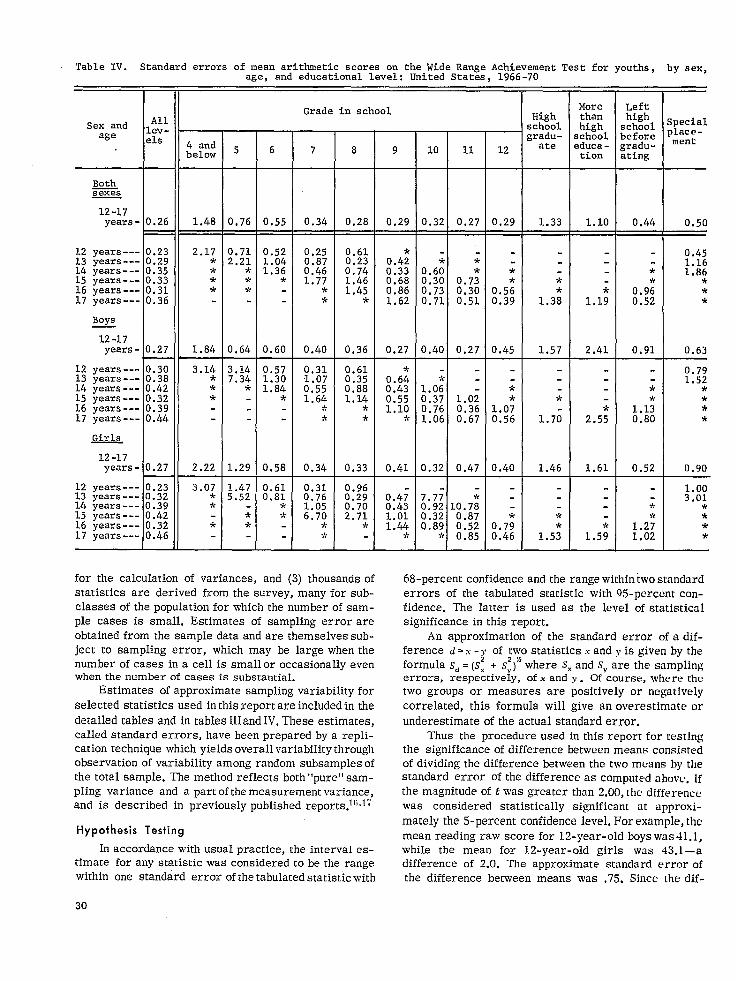
Table IV. Standard errors of mean arithmetic scores on the Wide Range Achievement Test for youths, by sex,age, and educational level: United States, 1966-70
I 11Morethanhigh
]chool:duca -tion
Lefthigh
~chooloefore3radu-s.ting
;pecialjlace -ment
0.50
0.451.161.86
***
0.63
Sex and Allage lev-
els
t--4 andbelow
Grade in school
+
Highschoolgradu-
12 ate
0.29 1.33t
8 9
0.28 0.29
5 6
0.55
7
+
10 11
0.32 0,27
Both=s
12-17
- lJL
years - 0.26 1.48 0,76~
0.712.21
*9r>’r
0.64
3.147.34
*
1.29
0,34 1.10
-
1,1;
2.41
0,44
*
0.9:0,52
0.91
*
0.5:0.39
*
1,3:
12 years --- 0.23 2.1713 years --- 0.29 *14 yeara --- 0.35 *15 years --- 0.33 *16 years --- 0,31 *17 years --- 0.36 -
0.521.041.36
*
0.60
0.571.301.84
*
0.58
0.250.870.461.77
**
0.40
0.311.070.551.64
**
0.34
0.610.23 0.4;p: 0.33
0.681:45 0,86
* 1,62
0,36 0.27
0.610.35 0.6;0.88 0.431,14 0.55
* 1.10* *
0.33 0.41
0.960.29 0.4;0.70 0.432.71 1.01
* 1.44*
L*
0.6;0.30 0,7:0.73 0.300,71 0.51
0.40 0.27
Boys
12-17
‘1
years- 0.27
12 years --- 0.3013 yeara --- 0.3814 years --- 0.4215 years --- 0.3216 years --- 0.3917 years --- 0.44
1.84 0.45 1.57
3.14***
0.791,52
****
0,90
1.0: :0.37 1.020.76 0.361.06 0.67
**
2.5;
1.61
*
1.1:0.80
0.52
1.070.56
12-17
K
years- 0.27 2.22
12 years --- 0.23 3.0713 years --- 0.32 *14 years --- 0.39 *15 years --- 0.42 -16 years --- 0.32 *17 years --- 0.46 - T_
0.32 0.47
7.7;0.92 10.7;0.32 0.870.89 0.52
* 0.85
0.40 1.46
1.475.52
**
0.610.81
**
0.31;.;;
6:70**
1.003.01
****
*
1.5:
*
1.5;
-
*
1.2;1.02
0.790,46
for the calculation of variances, and (3) thousands of 68-percent confidence and the rangewithin twostandardstatistics are derived from the survey, many for sub-classes of the population for which the number of sam -ple cases is small. Estimates of sampling error areobtained from the sample data andare themselves sub-ject to sampling error, which may be large when thenumber of cases in a cell is small or occasionally evenwhen the number of cases is substantial.
Estimates of approximate sampling variability for
selected statistics used in this report are included in the
detailed tables and in tables HIand IV. These estimates,called standard errors, have been prepared bya repli-cation technique which yields overall variability throughobservation of variability among random subsamplesofthe total sample. The method reflects both’’pure’’sam-pling variance and apart of themeasurement variance,and is described in previously published reports.l’; ,17
Hypothesis Testing
In accordance with usual practice, the interval es-timate for any statistic was considered to be the rangewithin one standard error of thetabulated statistic with
30
errors of the tabulated statistic with 95-percent con-fidence. The latter is used as the level of statisticalsignificance in this report.
An approximation of the standard error of a dif-ference d = x - y of two statistics x and y is given by theformula sd = (,s~ + s:)% where SXand S, are the samplingerrors, respectively, of x and y . Of course, where thetwo groups or measures are positively or negativelycorrelated, this formula will give an overestimate or
underestimate of the actual standard error.Thus the procedure used in this report for testing
the significance of difference between means consistedof dividing the difference between the two means by thestandard error of the difference as computed above,. If
the magnitude of t was greater than 2.00, the differencewas considered statistically significant at approxi-
mately the 5-percent confidence level. For example, the
mean reading raw score for 12-year-old boys was 41,1,while the mean for 12-year-old girls was 43.1 —adifference of 2.0. The approximate standard error ofthe difference between means was .75. Since the dif-
ferencc between the means was 2.7 times the standard standard error may exceed .25, a generally accepted
error, the difference was considered significant beyond standard for NCHS publications. Such statistics arethe S-percent confidence level. included in this report along with their corresponding
standard errors in the belief that theinformation, whileSmall Categories not meeting strict standards of precision, may lend an
In some tables averages are shown for cells for overall impression of the survey findings andmaybe ofwhich the sample size is so small that the relative interest to subject matter specialists.
000
31
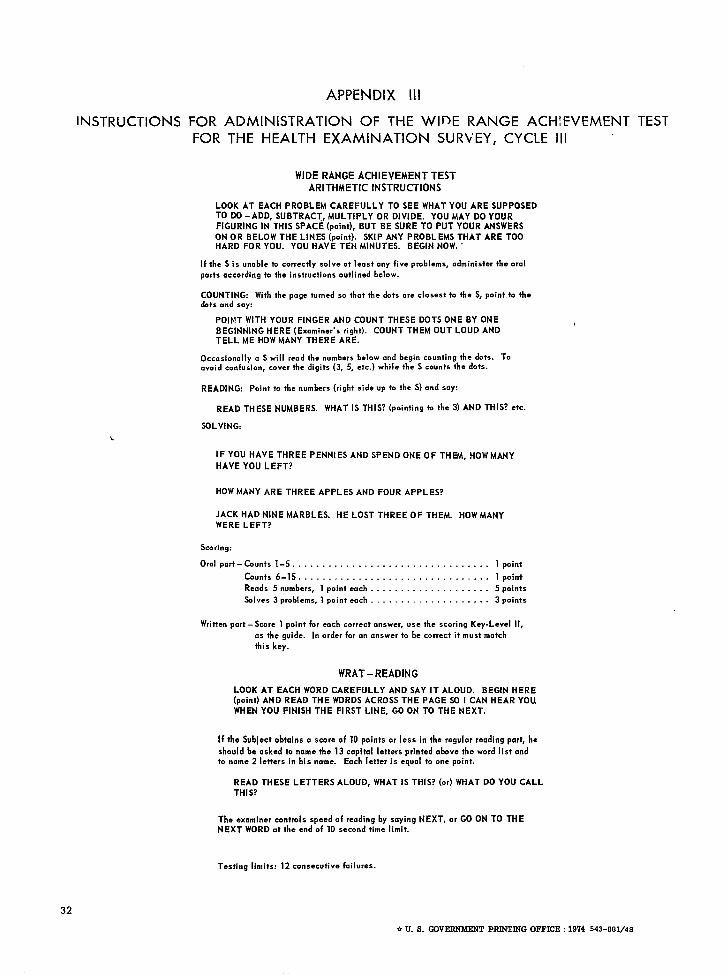
APPENDIX Ill
INSTRUCTIONS FOR ADMINISTRATION OF THE WIDE RANGE ACHIEVEMENT TESTFOR THE HEALTH EXAMINATION SURVEY, CYCLE Ill
WIDE RANGE ACHIEVEMENT TESTARITHMETIC INSTRUCTIONS
LOOK AT EACH PROBLEM CAREFULLY TO SEE WHAT YOU ARE SUPPOSEDTO Ml -ADO, SUBTRACT, MULTIPLY OR DIVIDE. YOU MAY DO YOURFIGURING IN THIS SPACE (point), BUT BE SURE TO PUT YOUR ANSWERS
ON OR BELOW THE LINES (point). SKIP ANY PROBLEMS THAT ARE TOOHARD FOR YOU. YOU HAVE TEN MINUTES. BEGIN NOW. ‘
If the S is unable to correctly solve at least any five problems, administer the oral
parts according to the instructions outlined below.
COUNTING: With the page turned so that the &ts are closest to the S, point.to the&ts and say:
POINT WITH YOUR FINGER AND COUNT THESE DOTS ONE BY ONEBEGINNING HERE (Examiner’s right). COUNT THEM OUT LOUD ANDTELL ME HOW MANY THERE ARE.
Occasionally a S will read the numbers below and begin counting the dots. Toavoid confusion, cover the digits (3, 5, etc.) while the S counts the dots.
READING: Point to the numbers (right side up to the S) and soy:
READ THESE NUMBERS. WHAT IS THIS? (pOinting * the 3) AND THIS? etc.
SOLVING:
IF YOU HAVE THREE PENNIES ANO SPEND ONE OF THEM, HOW MANY
HAVE YOU LEFT?
HOW MANY ARE THREE APPLES AND FOUR APPLES?
JACK HAD NINE MARBLES. HE LOST THREE OF THEM. HOW MANY
WERE LEFT?
Scoring:
Oral port -CO.nts l-5 . . . . . . . . . . . . . . . . . . . . . . . . . . . . . . . ..l point
Counts 6-15 . . . . . . . . . . . . . . . . . . . . . . . . . . . . . . ..l point
Reads 5numbers, lpointeoch . . . . . . . . . . . . . 5 points
Solves 3problems, l point each.. . . . . . . . . . . . . . . 3 points
Written part - Score 1 point for ●ach correct answer, use the scoring Key-Level 11,
as the guide. In order for an answer to be correct it must match
this key.
WRAT - READING
LOOK AT EACH WORD CAREFULLY AND SAY [T ALOUD. BEGIN HERE
(point) AND READ THE WORDS ACROSS THE PAGE SD I CAN HEAR YOU
WHEN YOU FINISH THE FIRST LINE, GO ON TO THE NEXT.
If the Su~ect obtains a score of 10 points or less in the regular reading part, he
should be asked to name the 13 capital letters printed above the word list and
to name 2 letters in his name. Each letter is equal to one point.
READ THESE LETTERS ALOUD, WHAT IS THIS? (or) WHAT DO YOU CALL
THIS?
The examiner controls speed of reading by saying NEXT, or GO ON TO THE
NEXT WORD at the end of 10 second time limit.
32
Testing limits: 12 consecutive failures.
* U. 8. GOV33~ PR7NTJNG OFFICE :1974 543-8 Bl/48
VITAL AND HEALTH STATISTICS PUBLICATION SERIES
Originally Riblic Halth Service I%blication No. 1000
I
I.1
‘1
Series 1.
Series 2.
Series 3.
Series 4.
Series 10.
Series 11.
Series 12.
Sm”es 13.
Series 14.
Serzes 20.
Series 21.
Sm’es 22.
*
Programs and collection #rocedures. —Reports which describe the general programs of the NationalCenter for Health Statistics and its offices and divisions, data collection methods used, definitions,and other material necessary for understanding the data.
Dab evaluation and methods research. —Studfes of new statistical methodology including: experi-mental tests of new survey methods, studies of vital statistics collection methods, new analyticaltechniques, objective evaluations of reliability of collected data, contributions to statistical theory.
Analytical studies. —Reports presenting analytical or interpretive studies based on vital and healthstatistics, carrying the analysis further than the expository types of reports in the other series.
Documents and committee reports. —Final reports of major committees concerned with vitaI andhealth statistics, and dcwuments such as recommended model vital registration laws and revisedbirth and death certificates.
Dati porn the Health Interview Survev.— Statistics on illness, accidental injuries, disability, useof hospital, medical, dental, and other services, and other health-related topics, based on datacollected in a continuing national household interview survey.
Data from the Health Examination Survey. —Data from direct examination, testing, and measure-ment of national samples of the civilian, noninstitutional population provide the basis for two typesof reports: (1) estimates of the medically defined prevalence of specific diseases in the UnitedStates and the distributions of the population with respect to physical, physiological, and psycho-logical characteristics; and (2) analysis of relationships among the various measurements withoutreference to an explicit finite universe of persons.
Data from the Institutional Population Surveys —Statistics relating to the health characteristics ofpersons in institutions, and their medical, nursing, and personal care received, based on nationalsamples of establishments providing these services and samples of the residents or patients.
Data from the Hospital Discharge Survey. —Statistics relating to discharged patients in short-stayhospitals, based on a sample of patient records in a national sample of hospitals.
Da&a on health resources: manpower and facilities. —Statistics on the numbers, geographic distri-bution, and characteristics of health resources including physicians, dentists, nurses, other healthoccupations, hospitals, nursing homes, and outpatient facilities.
Data on mortality. —Various statistics on mortali~ other than as included in regular annual ormonthly reports— special analyses by cause of death, age, and other demographic variables, alsogeographic and time series analyses.
Data on natality, mawiage, and divorce. —Various statistics on natality, marriage, and divorceother than as included in regular annual or monthly reprts+pecial analyses by demographicvariables, also geographic and time series analyses, studies of fertility.
Data from the National Nakdity and Mortality Surveys.— Statistics on characteristics of birthsand deaths not available from the vital records, based on sample surveys stemmfng from theserecords, including such topics as mortality by socioeconomic class, hospital experience in thelast year of life, medical care during pregnancy, health insurance coverage, etc.
For a list of titles of reports published in these series, write to: Off ice of InformationNat ional Center for HeaIth StatisticsPublic Health Service, HRA
Rockville, Md. 20852
/’”
U.S. DEPARTMENT OF HEALTH, EDUCATION, AND WELFAREPUBLIC HEALTH SERVICEHealth Resources Administration5600 Fishers Lane POSTAGE AND FEES PAID
Rockvillc, Maryland 20852 U.S. DEPARTMENT OF HEW
OFFICIAL BUSINESS HEW 390Penalty for Private Use $300
*US.MNL
THIRD CLASSBLK. RT.


![Manipulation of Attention in Children with Reading · 2015. 2. 14. · Reading ability: Wide Range Achievement Test-Fourth Edition [13]. WRAT-4 measures the basic academic skills](https://img.pdfslide.us/doc/110x75/610d6c8125d4df259a20eb85/manipulation-of-attention-in-children-with-2015-2-14-reading-ability-wide.jpg)


![it - ERIC · Poverty, Income and Fall 19 1 WRAT Score. 87.... 0, Matched Sample Cempariso of Experimental and ContrO] Groups in Four er*Projects., 89. Kansas City Summer Prc6ect:](https://img.pdfslide.us/doc/110x75/600162c98b70db2dec72c199/it-eric-poverty-income-and-fall-19-1-wrat-score-87-0-matched-sample-cempariso.jpg)