Embed Size (px)
Citation preview

Reading the entrails of chickens:molecular timescales of evolution andthe illusion of precisionDan Graur1 and William Martin2
1Department of Biology and Biochemistry, University of Houston, Houston, TX 77204-5001, USA2Institut fur Botanik III, Heinrich-Heine Universitat Dusseldorf, Universitatsstraße 1, 40225 Dusseldorf, Germany
For almost a decade now, a team of molecular evolu-
tionists has produced a plethora of seemingly precise
molecular clock estimates for divergence events rang-
ing from the speciation of cats and dogs to lineage
separations that might have occurred ,4 billion years
ago. Because the appearance of accuracy has an irresis-
tible allure, non-specialists frequently treat these esti-
mates as factual. In this article, we show that all of
these divergence-time estimates were generated
through improper methodology on the basis of a single
calibration point that has been unjustly denuded of
error. The illusion of precision was achieved mainly
through the conversion of statistical estimates (which
by definition possess standard errors, ranges and confi-
dence intervals) into errorless numbers. By employing
such techniques successively, the time estimates of
even the most ancient divergence events were made to
look deceptively precise. For example, on the basis of
just 15 genes, the arthropod–nematode divergence
event was ‘calculated’ to have occurred 1167 6 83
million years ago (i.e. within a 95% confidence interval
of ,350 million years). Were calibration and derivation
uncertainties taken into proper consideration, the 95%
confidence interval would have turned out to be at least
40 times larger (,14.2 billion years).
‘We demand rigidly defined areas of doubt anduncertainty.’ Douglas Adams
People have always been fascinated with dating thepast, particularly in the absence of historical records.James Ussher (1581–1656), Archbishop of Armagh andPrimate of All Ireland, is considered the first scholar tohave employed internal (biblical) and external (astronom-ical) evidence to date events that were considered undat-able by his predecessors. In his Annales Veteris Testamenti(Annals of the Old Testament) published in 1650, Ussherestablished the first day of creation as Sunday ‘upon the 23day of the Julian October’ 4004 BC. With similar precision,he dated Adam and Eve’s expulsion from Paradise, thedestruction of Sodom and Gomorra and the landing ofNoah’s ark on Mount Ararat. Generations of scholars were
so captivated by the appearance of precision of these dates,that hardly anyone questioned their veracity.
In a modern rendition of Ussher’s feat, a team ofmolecular evolutionists has inferred ostensibly precisemolecular-clock dates for speciation events ranging fromthe divergence between cats and dogs to the earlydiversification of prokaryotes [1–12]. The findings weresummarized in a Trends in Genetics review [13]. With fewexceptions [14–24], it has escaped the notice of mostreaders that all these divergence-time estimates are basedon a single calibration point and tenuous methodology.In this article, we document the manner in which acalibration point that is both inaccurate and inexact – andin many instances inapplicable and irrelevant – has beenused to produce an exhaustive evolutionary timeline thatis enticing but totally imaginary. We will relate a datingsaga of ballooning inapplicability and snowballing errorthrough which molecular equivalents of the 23rd October4004 BC date have been mass-produced in the mostprestigious biology journals.
Chapter 1: the origin of the primary 310 6 0 million-year
calibration
The saga starts with ‘an accurate calibration point’ forobtaining ‘reliable estimates of divergence times frommolecular data’ [1]. From among the many calibrationpoints available in the paleontological literature, ‘therelatively well-constrained fossil divergence time betweenthe ancestor of birds (diapsid reptiles) and mammals(synapsid reptiles)’ was selected [1]. This divergence timewas said to be 310 million years ago (MYA). As a cali-brating measurement, the 310-MYA value is treated asextremely accurate and extremely precise. That is, thedivergence time estimate between diapsids and synapsidsis used as if it had neither directional nor random errorsaround the mean (i.e. 310 ^ 0 MYA). We note that thisnumber is extremely important because all subsequentdivergence-time estimates are based on it.
In an article by Hedges et al. [1], the 310 ^ 0 MYA datewas said to be derived from Volume 2 of The Fossil Recordedited by M. J. Benton. Because The Fossil Record is a one-volume publication, we assume that the authors intendedto cite the second edition from 1993 [25]. Because nopage numbers were given, we carefully read the relevantportions of the 845-page tome and found no mention ofCorresponding author: William Martin ([email protected]).
Opinion TRENDS in Genetics Vol.20 No.2 February 2004
www.sciencedirect.com 0168-9525/$ - see front matter q 2003 Elsevier Ltd. All rights reserved. doi:10.1016/j.tig.2003.12.003

‘310 MYA’. In fact, in the preface it is written that althoughthe contributing authors ‘were invited to use any strati-graphical scheme that they thought appropriate,’ such arequest ‘involved no consideration of the exact ages inmillion of years.’ Moreover, chronological dates werestrictly avoided throughout the book, apparently as amatter of principle. This practice is reasonable andcommendable because placing a fossil in a stratigraphicalcontext can be done in some cases with relative ease,whereas assigning absolute dates to a stratum can bedifficult and controversial.
There are at least three sources of error that can affectthe 310 ^ 0 MYA calibration point: (i) errors in thetopology of the phylogenetic tree; (ii) errors in thetaxonomic identification of the fossil material; and (iii)errors in the chronological assignment of the geologicalstrata [16,24]. The first of these possible errors (Figure 1)will only affect the dating of misassigned branches; theother two can have more profound effects. The 310-MYAvalue was based on the assumption that Hylonomus fromthe Vereiskian stage of the Carboniferous period is theoldest diapsid, and that Archaeothyris from the Myach-kovskian stage is the oldest synapsid (S. Blair Hedges,pers. commun.). (The type specimens of Hylonomus andArchaeothyris were discovered in Joggins, Nova Scotia andFlorence, Nova Scotia, respectively.) In the geologicalliterature, the time boundaries of the Vereiskian stage aregiven as 311.2–309.2 MYA and those for the Myachkov-skian stage are 305–303 MYA [26].
Because Hylonomus is considered to be the older ofthe two, only its contribution to the dating of the
synapsid–diapsid divergence event needs to be examined.First, it is impossible to state with certainty thatHylonomus is a diapsid [16]. The reason is that, althoughall taxonomically diagnostic characters of synapsids anddiapsids are cranial (i.e. detectable mainly in the post-orbital and squamosal bones; Figure 1), the vast majorityof the relevant fossil specimens are represented byuninformative postcranial fragments [16]. Even ‘thebest-preserved cranial material’ lacks ‘the diagnosticsquamosal and only possesses an incomplete postorbital’’and, in general, ‘the manner of preservation at Jogginsmakes a systematic description of these reptiles difficult’[27,28]. Thus, one should not rely on Hylonomus as the soledeterminant of the calibration point. The earliest undis-puted fossils that are relevant to dating the synapsid–diapsid divergence are from the uppermost Pennsylvanianepoch, ,290 MYA [16,29–31].
Let us now deal with the question of stratigraphicaldating. Is it possible to date the Joggins formation in NovaScotia (or any other stratum) with the precision andaccuracy implied by the errorless 310 ^ 0 MYA value? Theanswer is negative both in principle and in practice. First,no geological dating is without error [32]. Second, theJoggins tetrapods (and formation) have no absolute ageassignment, and the various estimates range from 316.5 to308.0 MYA, with errors of 4.4–10.5 MYA [33]. Thus, givenour present knowledge, a sensible calibration for thesynapsid–diapsid divergence would have to be defined as arange, for example from 338 MYA as the earliest estimate[34] to 288 MYA as the most recent estimate [16]. We notethat at 313 MYA, the mean remains close to the 310 MYAvalue. However, using the mean on its own is misleading.At the very least, the ‘310 ^ 0 MYA’ is bibliographicallymisattributed and spuriously stripped of error.
A solution to the single-calibration conundrum would beto use multiple primary calibrations because such prac-tices yield better results than those obtained by relying ona single point [35–38]. Indeed, it was stated that ‘the use ofmultiple calibration points from the fossil record wouldbe desirable if they were all close to the actual time ofdivergence’ [4]. However, because no calibrations otherthan the 310 ^ 0 MYA value were ever used in this saga,the authors must have concluded that none exists. This isnot true. Moreover, deciding whether a certain fossil is‘close to the actual time of divergence’ presupposes a priorknowledge of the time of divergence, which in turn willmake the fossil superfluous for dating purposes.
The basic methodology for converting calibration datesand comparative protein data into divergence-time esti-mates is outlined in Box 1. By using the 310 ^ 0 MYAcalibration and 19 proteins that were deemed to haveevolved at approximately constant rates, an estimate of97 ^ 12 (mean ^standard error) MYA for the divergenceof avian orders was obtained [1]. The use of standarderrors as error bars is highly misleading [39,40]. A moreappropriate practice is to calculate the 95% or 99%confidence intervals, which in this case turn out to be121–73 MYA and 128–66 MYA, respectively. Even theselarge time ranges are still much narrower than theyshould be because the uncertainties surrounding the310 ^ 0 MYA calibration were not taken into account.
Figure 1. Phylogenetic relationships among amniotes. According to the number of
temporal openings or fenestrae (in red), amniotes are traditionally divided into
anapsids, diapsids and synapsids [47]. In many extant taxa, this schematic division
only holds approximately because openings might have merged, disappeared or
closed during evolution. For example, molecular data indicate that turtles might in
fact be diapsids [50,51], although morphologically they look undoubtedly anapsid.
It is, therefore, possible that synapsids and diapsids are not sister taxa. Owing to
the loss of the quadratojugal (qj) bone, lizards have a single temporal opening
similar to that of synapsids, although there is little doubt as to their diapsid status.
The principal diagnostic characters for classifying amniotes into anapsids, dia-
psids or synapsids are the postorbital (po) and squamosal (sq) bones. In fossil
material, these bones can be absent or incomplete, resulting in uncertain taxo-
nomic assignment.
Synapsid Modified synapsid(mammal)
Modified diapsid(bird)
Modified diapsid(lizard)
Modified anapsid(turtle)
Diapsid
posq
qj AnapsidTRENDS in Genetics
Opinion TRENDS in Genetics Vol.20 No.2 February 2004 81
www.sciencedirect.com

By considering the uncertainties in the primary cali-bration (i.e. 338–288 MYA), the diversification of avianorders can be said to have occurred with 95% confidencewithin the time interval of 132–67 MYA. The divergencetimes between primates and rodents, primates andartiodactyls and artiodactyls and rodents were estimatedoriginally be 95 ^ 7, 90 ^ 8, and 113 ^ 9 MYA, respec-tively [1]. Taking the uncertainties in calibration intoaccount would have yielded 95% confidence intervals of119–74, 117–67 and 145–85 MYA, respectively. Thesevalues do not support the conclusion that the ordinaldiversification of birds and mammals coincided with theMesosoic continental breakup [1]. Of course adding othersources of error, such as the rate variation among lineages,the variation in rates with time, the variation insubstitution rates among sites, in addition to uncertaintiesin orthology assignment, would have increased theintervals even further [41–43].
Chapter 2: the origin of the secondary 110 6 0 million-
year calibration
The second chapter purports to estimate ‘a moleculartimescale for vertebrate evolution’ [3], although what arein fact estimated are divergence times between humansand other organisms. Because of a lack of sufficientmolecular data from chicken, the primary calibrationpoint can not be used for the vast majority of proteincomparisons. Kumar and Hedges [3], thus, opted for asecondary calibration point. (Secondary calibration pointsare divergence-time estimates that have been derived fromone molecular dataset on the basis of a single primaryexternal calibration point, and which are subsequentlydenuded of their variances and used as if they wereindependent calibration points on a second dataset [21]).
It is at this point in the narrative that two momentousalterations were made. First, for unexplained reasons, the
divergence between primates and rodents, which waspreviously 95 ^ 7 MYA, becomes 110 MYA, despite thedifference between 95 ^ 7 MYA and 110 MYA beingstatistically significant. (To add to the confusion, thisnew value is sometimes reported as ‘100 MYA’ [44] or‘112 MYA’ [45].) The second alteration concerns thedisappearance of the uncertainties around the mean ofthe secondary calibration (including those meager uncer-tainties stemming from the use of the erroneouslyerrorless 310 ^ 0 MYA primary calibration. These twoalterations yield a new estimate: 110 ^ 0 MYA for thedivergence between humans and rodents. We confess thatwe can not pinpoint exactly the source of the 110 ^ 0 MYAvalue but are certain that it is neither independent norerrorless. As the saga proceeds, fewer and fewer estimatesare derived from the original synapsid–diapsid calibrationevent and – subtly but surely – more and more are basedon the secondary tertiary and higher-order derivations.
A study examining the 110 ^ 0 MYA point used a‘consistency test’ to assess the appropriateness of thiscalibration [21]. Passing the consistency test entailedmeeting two conditions: (i) the estimates for the divergencebetween birds and mammals had to be larger than theestimates for the divergence between primates androdents (i.e. time reversibility was not allowed); (ii) themean inferred time of divergence between birds andmammals should not differ significantly from 310 MYA(i.e. by using the secondary calibration, a divergencetime that is close to the primary calibration should berecovered). The results indicated that 25% of the homo-logous protein sets in birds and mammals failed the firstpart of the consistency test [21], that is, in one out offour cases the data yielded divergence times betweenrodents and primates that were older than those obtainedfor the divergence between synapsids and diapsids. Oneprotein yielded the absurd estimate of 2333 MYA for the
Box 1. From calibration dates and comparative protein data to divergence-time estimates
From two homologous protein sequences and by assuming a Poisson
process, we can estimate the number of amino acid replacements
between the two sequences as:
d ¼ 2ln 1 2n
L
� �½Eqn 1�
where n is the number of amino acid differences between the aligned
sequences and L is the length of the ungapped alignment. The variance
of d ; V ðdÞ; is given by V ðdÞ ¼ ðn=LÞ=ð½1 2 ðn=LÞ�nÞ: It can become large if
n=L is large or if L is small. Most molecular clock estimates use the mean
d; but V ðdÞ also exists, regardless of how d is calculated [42].
The rate of replacement is:
r ¼d
2T½Eqn 2�
where T ; the time of divergence between the two sequences, is usually
inferred from paleontological data.
Under the assumption that all lineages in a study evolve at the same
rate, and assuming that we know the divergence time between two
taxa (Tcal ¼ calibration time), we can use the number of amino acid
replacements between two sequences from these two taxa (dcal) to
calculate a universal rate as:
rcons ¼dcal
2Tcal
½Eqn 3�
We can, then, take any pair of sequences from any two taxa, estimate d;
and calculate the time of divergence as:
T ¼d
2rconst
½Eqn 4�
Note that the uncertainties associated with T should be large because
they are a composite of the errors associated with all the estimates used
in the calculation of T : If one turns T into a secondary Tcal., then
the errors associated with the estimates from the new Tcal should
be greater than those associated with estimates derived from the
primary Tcal .
Note also that all estimates of T are estimates for the divergence
between the protein sequences used in the calculations. T can be
regarded as an estimate of divergence time, only if the genes are
orthologous (i.e. related by common ancestry). If the genes are
paralogous (i.e. related by gene duplication) and if this duplication
occurred in any of the ancestors of the two taxa from which the proteins
were derived, then the divergence time will be overestimated, and
speciation events will seem more ancient than they actually are [20]. It is
usually difficult to ascertain with confidence whether the sequence
similarity between two proteins is due to orthology or paralogy.
Opinion TRENDS in Genetics Vol.20 No.2 February 200482
www.sciencedirect.com
human–chicken divergence event, and as an extremeoutlier [46] was discarded. For the remaining proteins, themean bird–mammalian divergence estimate was 393 MYAwith a 95% confidence interval of 471–315 MYA. In otherwords, the 310 MYA landmark was not recovered. Becauseneither condition of the consistency test was met, itwas concluded that the use of the secondary calibrationis unjustified.
In the study by Kumar and Hedges [3], 33 divergence-time estimates were produced. The oldest estimate was564 ^ 74.6 MYA for the divergence between jawless fish(Agnatha) and humans. By using these data and by takinginto account the uncertainties associated with the primaryand secondary calibrations, we estimate with 95% confi-dence that the ancestors of humans diverged from theancestors of agnathans 790–232 MYA (i.e. a period of timespanning the upper Precambrian, Cambrian, Ordovican,Silurian, Devonian, Carboniferous, Permian and lowerTriassic). Not surprisingly, the fossil record pinpoints thedivergence events between agnathes and humans to asignificantly narrower range [47].
Chapter 3: transubstantiation of a secondary calibration
into a primary calibration
The reason for the transformation of the secondarycalibration date into a primary one, which is equivalentto blood becoming Cabernet Sauvignon, is purportedlybased on external evidence: ‘Fossil evidence (Archibald1996) also supports an early divergence time (.90 Ma) forthe primate-rodent split’ [4]. Unfortunately, the Sciencearticle by Archibald [48] is entitled Fossil Evidence for aLate Cretaceous Origin of “Hoofed” Mammals, and assuch deals with neither rodents nor humans. Thus, themysterious transformation is founded on a numericalinterpretation of a schematic figure in Ref. [48], in whichrodents and primates are drawn merely as outgroups,although they are neither mentioned in the text norreferenced in the bibliography.
The harvest in this chapter consists of six divergencetime estimates that are as ancient as they are ambitious[4]. Two of the six estimates (i.e. for the fungi–plantdivergence event and for the divergence between nema-todes and arthropods) constitute important precedents inmolecular evolution because the lineages being studieddo not contain the taxa used for the calibration. (Thestandard for such practices was most probably set by aseldom-quoted study in which the evolutionary age ofGalapagos iguanas was inferred on the basis of a ratecalibration involving goats and cattle [49].) The six‘multigene divergence times between animal phyla andamong plants, animals and fungi’ look extremely precise.For example, on the basis of 15 ‘constant-rate’ genes, thearthropod–nematode divergence event is said to haveoccurred 1167 ^ 83 MYA. This estimate translates into a95% confidence interval of ,350 million years around themean. Let us now see what happens if we include thecalibration and derivation uncertainties in the calcu-lations. The 95% interval turns out to span a period of,14.3 billion years (from 14.3 billion to 93 MYA). Ofcourse, to state that the lineages leading to Drosophilamelanogaster and Caenorhabditis elegans diverged
from each other subsequent to the formation of the solarsystem but before the Cretaceous period requires nomolecular data.
Chapter 4: tautological comparison of the 310 6 0 versus
110 6 0 MYA calibrations
An important detour in the saga of assigning precisetimescales to the evolution of everything is found in apaper in which the miracle of transubstantiation attainsfulfillment [5]. In this paper, the 310 ^ 0 MYA and the110 ^ 0 MYA dates are treated as ‘independent’ calibra-tions for purposes of dating avian divergence events. Theresults based on the 310 ^ 0 MYA calibration and theresults based on the 110 ^ 0 MYA calibration are com-pared and discussed. Unsurprisingly, because one datewas derived from the other, the two values yieldedconcordant results. Interestingly, other authors havebeen misled into regarding these two dates as independentcalibrations [44].
Chapter 5: errorless molecular estimates substitute for
fossil evidence
The fifth chapter in the saga marks the emergence of fivetertiary calibration points [6]. That is, five estimates fromWang et al. [4] that were derived from the secondary110 ^ 0 MYA calibration, which in turn was derived fromthe primary 310 ^ 0 MYA calibration, are turned into‘errorless’ (^0) calibrations, from which further molecu-lar-clock estimates are derived. The tertiary calibrationpairs are: plants versus animals, animals versus fungi,plants versus fungi, nematodes versus arthropods andvertebrates, and arthropods versus vertebrates. Interest-ingly, these calibrations are claimed to be ‘derived froman analysis of 75 nuclear proteins calibrated with thevertebrate fossil record’ [6]. A careful reading of Wang et al.[4], however, reveals that the calibrations are based on15–39 proteins, not 75.
The elimination of uncertainties in the new calibrationpoints is rationalized by the need ‘to reduce extrapolationerror’ [6]. This statement is exceedingly odd because allmolecular-time estimates are based on linear regressionanalyses, whereby the time of divergence is calculatedfrom graphs in which the X-axis is the molecular diver-gence between two sequences and the Y-axis is time. Theconfidence limits of a regression line are known to beshaped as a biconcave belt: the further away we are fromthe mean, the less reliable our estimates of divergencetimes will be. In the dating saga before us, the regressionline is derived from the calibration point and the inter-section of the axes in the graph (i.e. the ‘mean’ is theprimary calibration point). Thus, ‘to reduce extrapolationerror’ essentially violates the mathematical basis of theanalysis. The mere fact that the coefficients of variationremain approximately constant or even decrease thefurther we stray from the primary calibration shouldhave been sufficient to invalidate the entire datingexercise. For example, on the basis of 333 sequences, thedivergence time between ferungulates (e.g. cows andhorses) and primates is given as 92 ^ 1.3 MYA [3] (i.e. thecoefficient of variation is 25%). In comparison, on thebasis of only two proteins, the divergence time between
Opinion TRENDS in Genetics Vol.20 No.2 February 2004 83
www.sciencedirect.com
Neocallimasticales and all other fungi is said to be1458 ^ 70 MYA [6] (i.e. the coefficient of variation is 7%).These results are simply incompatible with mathe-matics. The fact that the uncertainties were successivelydiscarded in the process of deriving secondary, tertiary andhigher-order calibrations from the primary human–chicken calibration does not mean that the errors arenot there. Every estimate, regardless of the method used toderive it, has a mean and a variance [41,42], and thevariance neither diminishes nor disappears when onemanipulates the mean.
The tertiary derivatives of the chicken–human com-parison are used to estimate ten ancient divergenceevents, such as mosses versus vascular plants, basidio-mycetes versus ascomycetes and Candida albicans versusSaccharomyces cerevisiae [6]. As expected, the iterativeuse of ^ 0 calibration points results in estimates that areaccompanied by deceptively low standard errors, leavingthe uninitiated reader with a sense of certainty thatis as comforting as it is false. Thus, estimates such as1458 ^ 70 MYA for the divergence between Neocallimas-ticales and all other fungi or 1107 ^ 56 MYA for thedivergence between Mucorales and Blastocladiales versusBasidiomycota and Ascomycota [6] are imaginary. Indeed,if ancient divergence events can be pinpointed so accurately
in a temporal framework, then by using the methodology ofHeckman et al. [6], we will be able to attain parts-per-billionaccuracies in dating less-ancient events. In fact, we mightultimately be able to tell whether the human–chimpanzeedivergence occurred on a Monday or not.
Chapter 6: dating Genesis
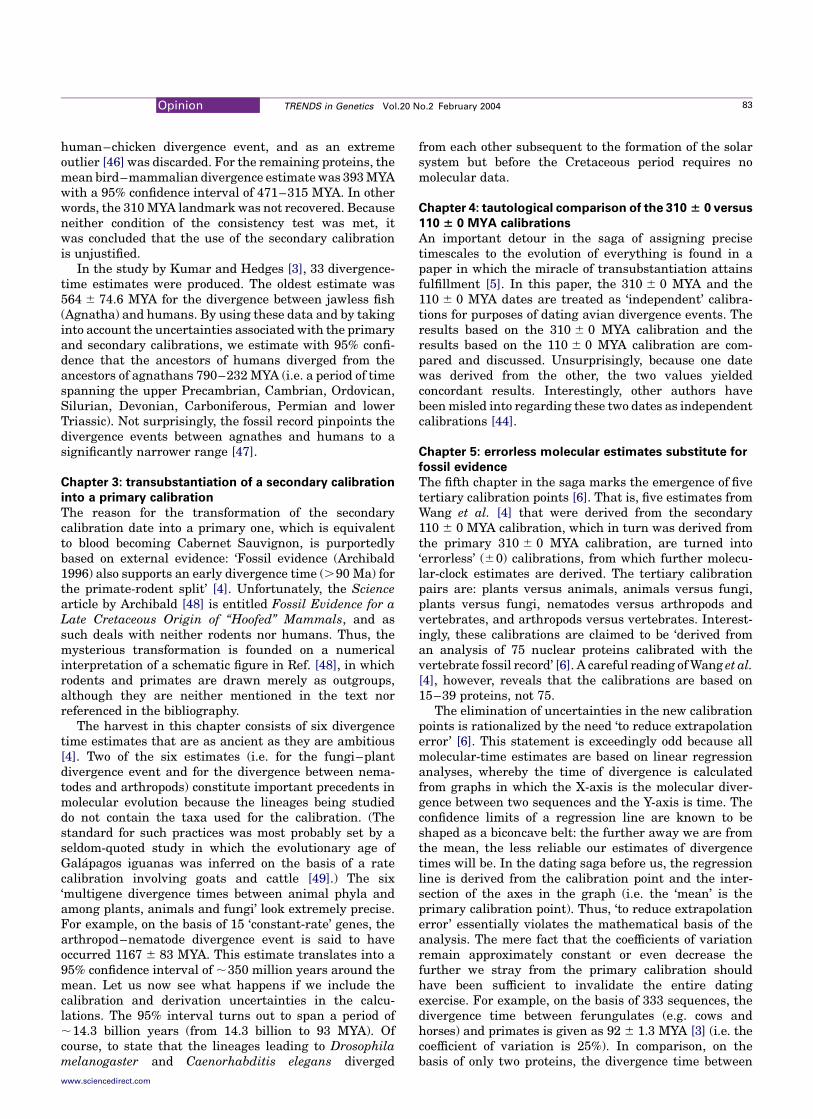
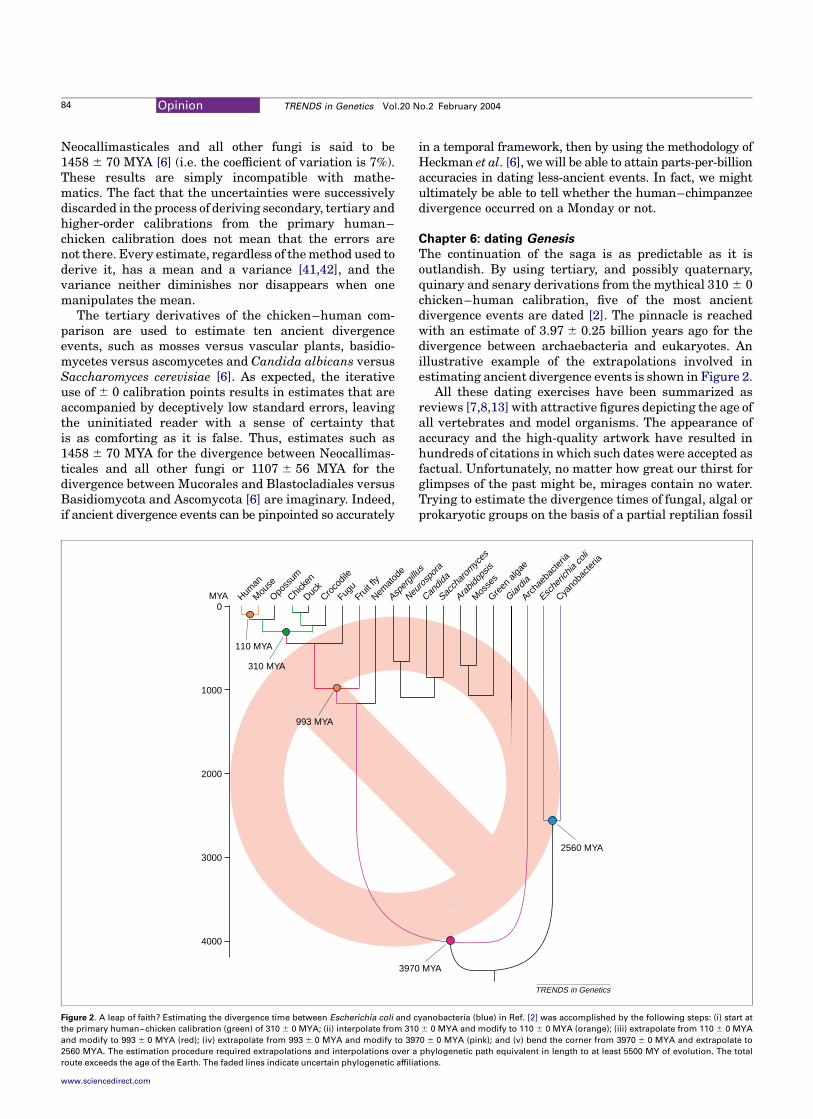
The continuation of the saga is as predictable as it isoutlandish. By using tertiary, and possibly quaternary,quinary and senary derivations from the mythical 310 ^ 0chicken–human calibration, five of the most ancientdivergence events are dated [2]. The pinnacle is reachedwith an estimate of 3.97 ^ 0.25 billion years ago for thedivergence between archaebacteria and eukaryotes. Anillustrative example of the extrapolations involved inestimating ancient divergence events is shown in Figure 2.
All these dating exercises have been summarized asreviews [7,8,13] with attractive figures depicting the age ofall vertebrates and model organisms. The appearance ofaccuracy and the high-quality artwork have resulted inhundreds of citations in which such dates were accepted asfactual. Unfortunately, no matter how great our thirst forglimpses of the past might be, mirages contain no water.Trying to estimate the divergence times of fungal, algal orprokaryotic groups on the basis of a partial reptilian fossil
Figure 2. A leap of faith? Estimating the divergence time between Escherichia coli and cyanobacteria (blue) in Ref. [2] was accomplished by the following steps: (i) start at
the primary human–chicken calibration (green) of 310 ^ 0 MYA; (ii) interpolate from 310 ^ 0 MYA and modify to 110 ^ 0 MYA (orange); (iii) extrapolate from 110 ^ 0 MYA
and modify to 993 ^ 0 MYA (red); (iv) extrapolate from 993 ^ 0 MYA and modify to 3970 ^ 0 MYA (pink); and (v) bend the corner from 3970 ^ 0 MYA and extrapolate to
2560 MYA. The estimation procedure required extrapolations and interpolations over a phylogenetic path equivalent in length to at least 5500 MY of evolution. The total
route exceeds the age of the Earth. The faded lines indicate uncertain phylogenetic affiliations.
TRENDS in Genetics
4000
3000
2000
1000
0MYA Cya
noba
cteria
Esche
richia
coli
Archa
ebac
teria
Mou
se
Human
Oposs
um
Chicke
n
Duck
Croco
dile
Fugu
Fruit
fly
Nemat
ode
Giardia
Green
alga
e
Asper
gillus
Mos
ses
Neuro
spor
a
Arabid
opsis
Candid
a
Sacch
arom
yces
3970 MYA
310 MYA
2560 MYA
110 MYA
993 MYA
Opinion TRENDS in Genetics Vol.20 No.2 February 200484
www.sciencedirect.com

and protein sequences from mice and humans is like tryingto decipher Demotic Egyptian with the help of an odometerand the Oxford English Dictionary. This is not to say thatmolecular estimates of divergence times are flawed per se;on the contrary, they are useful when based on solidstatistical methodology and multiple fossil calibrations.
Postscript: the 110 6 0 MYA calibration dies but its
descendants survive
In what will surely not be the last chapter in this story, arecent review in Trends in Genetics [13] contains fourblood-curdling innovations involving statistical method-ology, taxonomy, physics of time reversal and logic. Thestatistical novelty concerns the primate–artiodactyldivergence time, which was 90 ^ 8 MYA in Hedges at al.[1], whereas in Ref. [13] it is quoted as ‘90–98 million yearsago.’ This change turns the mean into the lower end of therange and reduces by 76% the already-too-narrow confi-dence interval from 34 million years to 8 million years. Thetaxonomic novelty concerns the 3.97 ^ 0.25 billion-years-ago estimate for the divergence between archaebacteriaand eukaryotes [2], which in Ref. [13] is not only stripped oferror but also assigned to a different evolutionary event(i.e. the ‘early divergence among prokaryotes’). The thirdnovelty concerns the claim that two ascomycete fungi(Saccharomyces and Schizosaccharomyces) diverged fromone another (1144 MYA) before their common ancestordiverged from the basidiomycetes (1107 MYA). This claimrequires time to run backwards for ,37 million years.
Notwithstanding the concerns discussed, it is the logicalinnovation in Ref. [13] that is the most extraordinary.In the legend of a figure, Hedges et al. state that all‘divergence times involving rodents’ were essentiallydiscarded ‘because of large differences in publishedmolecular time estimates’ [13]. Normally, a house ofcards topples if the card at the foundation of the structureis pulled out. Miraculously, however, 36 divergence-timeestimates based on the 110 ^ 0 MYA calibration aredeemed worthy of publication [13], whereas the numberon which the calculations were based is not.
Conclusion and recommendation
Despite their allure, we must sadly conclude that alldivergence estimates discussed here [1–13] are withoutmerit. Our advice to the reader is: whenever you see atime estimate in the evolutionary literature, demanduncertainty!
Acknowledgements
We thank John H. Calder, Daniel A. Chamovitz, Or M. Graur, S. BlairHedges, Michael S.-Y. Lee, Michael Ovadia, Robert R. Reisz and ShaulShaul for information.
References
1 Hedges, S.B. et al. (1996) Continental breakup and the ordinaldivergence of birds and mammals. Nature 381, 226–229
2 Hedges, S.B. et al. (2001) A genomic timescale for the origin ofeukaryotes. BMC Evol. Biol. 1441–2148/1/4 (www.biomedcentral.com)
3 Kumar, S. and Hedges, S.B. (1998) A molecular timescale forvertebrate evolution. Nature 392, 917–920
4 Wang, D.Y- et al. (1999) Divergence time estimates for the early historyof animal phyla and the origin of plants, animals and fungi. Proc.R. Soc. Lond. B. Biol. Sci. 266B, 163–171
5 van Tuinen, M. and Hedges, S.B. (2001) Calibration of avian molecularclocks. Mol. Biol. Evol. 18, 206–213
6 Heckman, D.S. et al. (2001) Molecular evidence for the earlycolonization of land by fungi and plants. Science 293, 1129–1133
7 Hedges, S.B. (2002) The origin and evolution of model organisms.Nat. Rev. Genet. 3, 838–849
8 Hedges, S.B. and Kumar, S. (2002) Vertebrate genomes compared.Science 297, 1283–1285
9 Hedges, S.B. and Shah, P. (2003) Comparison of mode estimationmethods and application in molecular clock analysis. BMC Bioinfor-matics 1471–2105/4/31 (www.biomedcentral.com)
10 Stauffer, R.L. et al. (2001) Human and ape molecular clocks andconstraints on paleontological hypotheses. J. Hered. 92, 469–474
11 Tracy, M.R. and Hedges, S.B. (2000) Evolutionary history of theenolase gene family. Gene 259, 129–138
12 Hedges, S.B. and Poling, L.L. (1999) A molecular phylogeny of reptiles.Science 283, 998–1001
13 Hedges, S.B. and Kumar, S. (2003) Genomic clocks and evolutionarytimescales. Trends Genet. 19, 200–206
14 Alroy, J. (1999) The fossil record of North American mammals:evidence for a Paleocene evolutionary radiation. Syst. Biol. 48,107–118
15 Benton, M.J. (1999) Early origins of modern birds and mammals:molecules vs. morphology. BioEssays 21, 1043–1051
16 Lee, M.S.Y. (1999) Molecular clock calibrations and metazoandivergence dates. J. Mol. Evol. 49, 385–391
17 Bromham, L. et al. (2000) The power of relative rates tests depends onthe data. J. Mol. Evol. 50, 296–301
18 Sanderson, M.J. (2002) Estimating absolute rates of molecularevolution and divergence times: a penalized likelihood approach.Mol. Biol. Evol. 19, 101–109
19 Sanderson, M.J. (2003) r8s: inferring absolute rates of molecularevolution and divergence times in the absence of a molecular clock.Bioinformatics 19, 301–302
20 Martin, A.P. and Burg, T.M. (2002) Perils of paralogy: UsingHSP70 genes for inferring organismal phylogenies. Syst. Biol. 51,570–587
21 Shaul, S. and Graur, D. (2002) Playing chicken (Gallus gallus):Methodological inconsistencies of molecular divergence date estimatesdue to secondary calibration points. Gene 300, 59–61
22 Benton, M.J. and Ayala, F.J. (2003) Dating the tree of life. Science 300,1698–1700
23 Bromham, L. and Penny, D. (2003) The modern molecular clock.Nat. Rev. Genet. 4, 216–224
24 Rieppel, O. (1999) Turtle origins. Science 283, 945–94625 Benton, M.J. ed. (1993) The Fossil Record 2, Chapman and Hall26 Harland, W.B. et al. (1989) A Geologic Time Scale, Cambridge
University Press27 Carroll, R.L. (1964) The earliest reptiles. J. Linnean Soc. Zool. 45,
61–8328 Carroll, R.L. (1969) A middle Pennsylvanian captorhinomorph, and
the interrelationships of primitive reptiles. J. Paleontol. 43, 151–17029 Peabody, F.E. (1952) Petrolacosaurus kansensis Lane, a Pennsyl-
vanian reptile from Kansas. Paleontol. Contr. Univ. Kansas 1, 1–4130 Reisz, R.R. (1986) Pelycosauria Encyclopedia of Paleoherpetology
Pt 17A, Verlag Dr Friedrich Pfeil31 Reisz, R.R. (1997) The origin and early evolutionary history of
amniotes. Trends Ecol. Evol. 12, 218–22232 Ayala, F.J. et al. (1998) Origin of the metazoan phyla: molecular clocks
confirm paleontological estimates. Proc. Natl. Acad. Sci. U. S. A. 95,606–611
33 Calder, J.H. (1998) The Carboniferous evolution of Nova Scotia. InLyell: The Past is the Key to the Present (Blundell, D.J. and Scott, A.C.,eds), pp. 261–302, Geological Society, London
34 Smithson, T.R. (1989) The earliest known reptile. Nature 342, 676–67835 Sanderson, M.J. (1997) A nonparametric approach to estimating
divergence times in the absence of rate constancy. Mol. Biol. Evol. 14,1218–1231
36 Arnason, U. et al. (1998) Molecular timing of primate divergencesas estimated by two nonprimate calibration points. J. Mol. Evol. 47,718–727
37 Rambaut, A. and Bromham, L. (1998) Estimating divergence datesfrom molecular sequences. Mol. Biol. Evol. 15, 442–448
Opinion TRENDS in Genetics Vol.20 No.2 February 2004 85
www.sciencedirect.com

38 Springer, M.S. et al. (2003) Placental mammal diversification and theCretaceous-Tertiary boundary. Proc. Natl. Acad. Sci. U. S. A. 100,1056–1061
39 Huff, D. (1954) How to Lie with Statistics, Norton, New York40 Topping, J. (1972) Errors of Observation and their Treatment,
Chapman and Hall41 Nei, M. (1987) Molecular Evolutionary Genetics, Columbia University
Press42 Nei, M. and Kumar, S. (2000) Molecular Evolution and Phylogenetics,
Oxford University Press43 Ota, T. and Nei, M. (1994) Estimation of the number of amino acid
substitutions per site when the substitution rate varies among sites.J. Mol. Evol. 38, 642–643
44 Gu, X. (1998) Early metazoan divergence was about 830 million yearsago. J. Mol. Evol. 47, 369–371
45 Easteal, S. (1999) Molecular evidence for the early divergence ofplacental animals. BioEssays 21, 1052–1058
46 Barnett, V. and Lewis, T. (1994) Outliers in Statistical Data, 3rd edn,Wiley
47 Benton, M.J. (1997) Vertebrate Paleontology, 2nd edn, Chapman andHall
48 Archibald, J.D. (1996) Fossil evidence for a Late Cretaceous origin of‘hoofed’ mammals. Science 272, 1150–1153
49 Rassmann, K. (1997) Evolutionary age of the Galapagos iguanaspredates the age of the present Galapagos Islands. Mol. Phylog. Evol.7, 158–172
50 Cao, Y. et al. (2000) Phylogenetic position of turtles among amniotes:evidence from mitochondrial and nuclear genes. Gene 259, 139–148
51 Zardoya, R. and Meyer, A. (2001) The evolutionary position of turtlesrevised. Naturwissenschaften 88, 193–200
Articles of interest in Trends and Current Opinion journals
Interplay of transcriptomics and proteomics
Priti S. Hegde, Ian R. White and Christine Debouck
Current Opinion in Biotechnology 14, 647–651
Role of evolutionary history on haplotype block structure in the human genome: implications for disease mapping
Sarah A. Tishkoff and Brian C. Verrelli
Current Opinion in Genetics and Development 13, 569–575
Hox gene evolution in nematodes: novelty conserved
Aziz Aboobaker and Mark Blaxter
Current Opinion in Genetics and Development 13, 593–598
Duplicate, decouple, disperse: the evolutionary transience of human centromeric regions
Michael Jackson
Current Opinion in Genetics and Development 13, 629–635
Turning the clock back on ancient genome duplication
Cathal Seoighe
Current Opinion in Genetics and Development 13, 636–643
Gene microarray analysis of multiple sclerosis lesions
Christopher B. Lock and Renu A. Heller
Trends in Molecular Medicine 9, 535–541
Subclinical prion infection
Andrew F. Hill and John Collinge
Trends in Microbiology 11, 578–584
Phylogenetics and sequence analysis - some problems for the unwary
Jamie R. Stevens and Christopher J. Schofield
Trends in Parasitology, 19 582–588
Opinion TRENDS in Genetics Vol.20 No.2 February 200486
www.sciencedirect.com