Embed Size (px)
Citation preview
Atlas of Mental Health and AOD Services for Eastern Melbourne
Reading the Atlas – A Guide
© ConNetica 2018
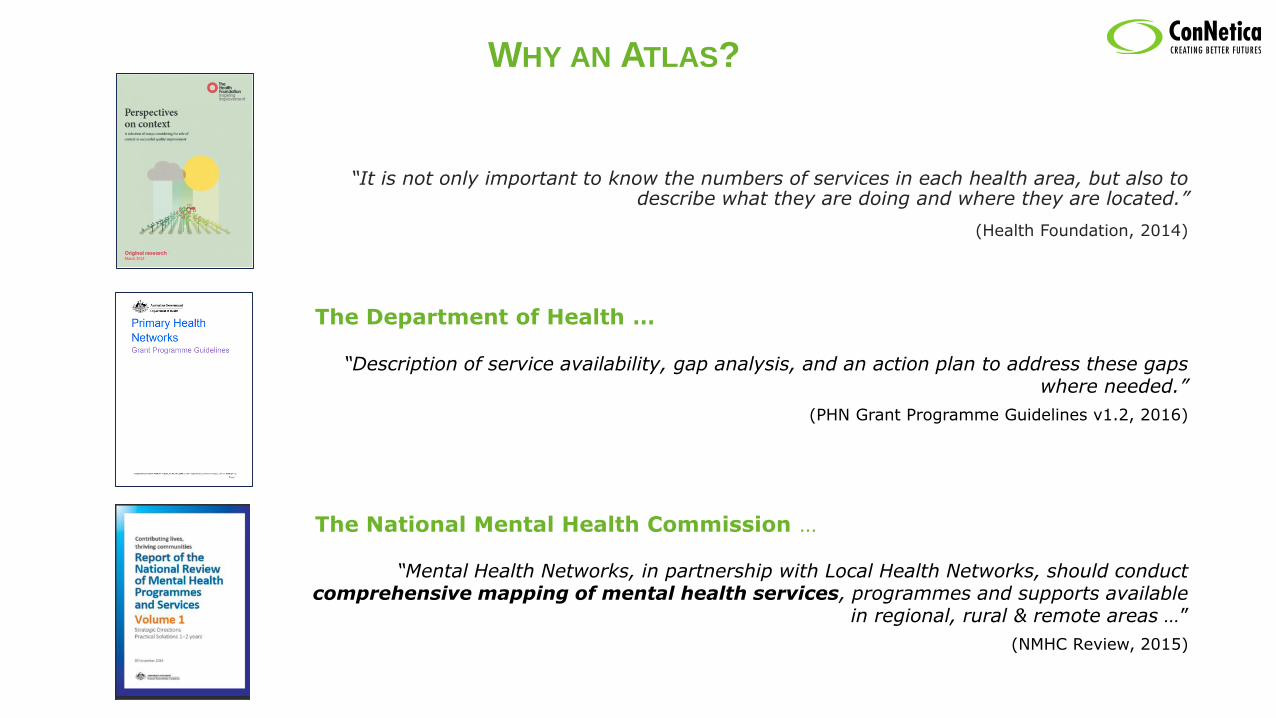
The National Mental Health Commission …
“Mental Health Networks, in partnership with Local Health Networks, should conduct comprehensive mapping of mental health services, programmes and supports available
in regional, rural & remote areas …”
(NMHC Review, 2015)
WHY AN ATLAS?
“It is not only important to know the numbers of services in each health area, but also to describe what they are doing and where they are located.”
(Health Foundation, 2014)
“Description of service availability, gap analysis, and an action plan to address these gaps where needed.”
(PHN Grant Programme Guidelines v1.2, 2016)
The Department of Health …

Executive Summary
Framework
Prevalence & Service Data
Services in Eastern
Melbourne
Population Health & Socio-Demographic
Indicators
Patterns of Care
Executive Summary
• Key Findings
Framework
• What are Integrated Atlases?
• Context and Methodology
• DESDE-LTC Taxonomy
• Inclusion Criteria
• Development process
Summary
Study Limitations
Appendix
EMPHN Catchment
Description of the factors, indicators and regions examined in the Atlas including:
• Demographics
• Social determinants of health
• Socio-economic indicators
• Health and Mortality Indicators
Population Profile
• Statewide analysis in the areas described above
Australian Prevalence
• Mental health
• AOD
Victorian Prevalence
• Mental health
• AOD
Health Services
• Hospitalisations
• MBS funded services
• MHNIP
• ATAPS
• Local Hospital Networks
Mental Health Services in Eastern Melbourne –
• Stakeholders
• Consortia & partnerships
By Main Type of Care & Basic Stable Inputs of Care:
• MTC by age group
• Children & adolescents
• Transition to adulthood
• Adults
• Older Adults
• Health workforce
Patterns of Care –specific PHN represented as spider diagrams
National Comparisons:
• Western Sydney
• Brisbane North
Comparisons of Beds
– beds/100,000 pop’n
International Comparisons
• Helsinki, Finland
• Verona, Italy
• Hampshire, UK
Summary
Limitations
• Organisational engagement
• Data collection in a time of change
References
Appendix
• Services with insufficient information
• DESDE-LTC Taxonomy
• Participation stakeholders
EMPHN ATLAS – FOR COMMENT
STRUCTURE

ATLAS METHODOLOGY
Collect
• Conduct face
to face
interviews
• Conduct
telephone
interviews
• Survey
Analyse
• Determine
eligibility
• Collate
information
• Follow up for
clarity
Code
• Apply DESDE
Code
Map
• Create geo-spatial
maps of services
• Map socio-
demographic
indicators
• Prepare Patterns
of Care graphs
Report
• Key findings
Identify
• Engage
stakeholders
• Identify
organisations
• Invite them to
participate
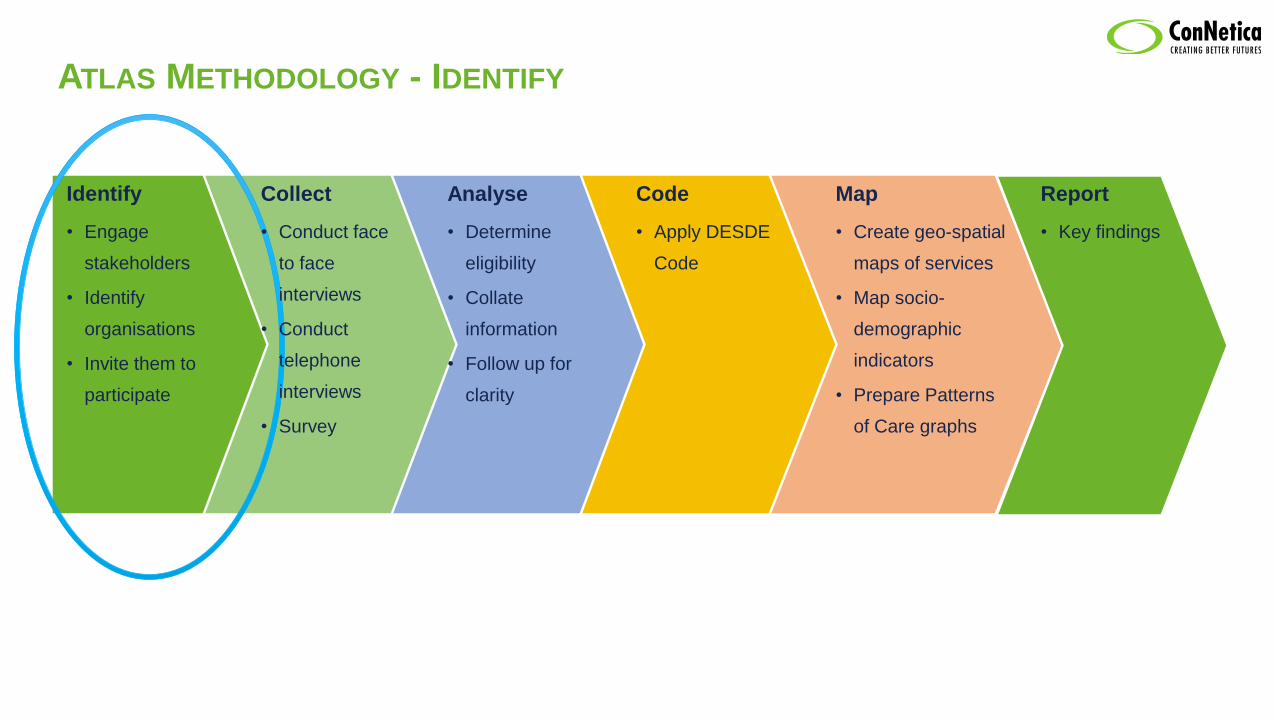
ATLAS METHODOLOGY - IDENTIFY
Code
• Apply DESDE
Code
Map
• Create geo-spatial
maps of services
• Map socio-
demographic
indicators
• Prepare Patterns
of Care graphs
Report
• Key findings
Collect
• Conduct face
to face
interviews
• Conduct
telephone
interviews
• Survey
Analyse
• Determine
eligibility
• Collate
information
• Follow up for
clarity
Identify
• Engage
stakeholders
• Identify
organisations
• Invite them to
participate
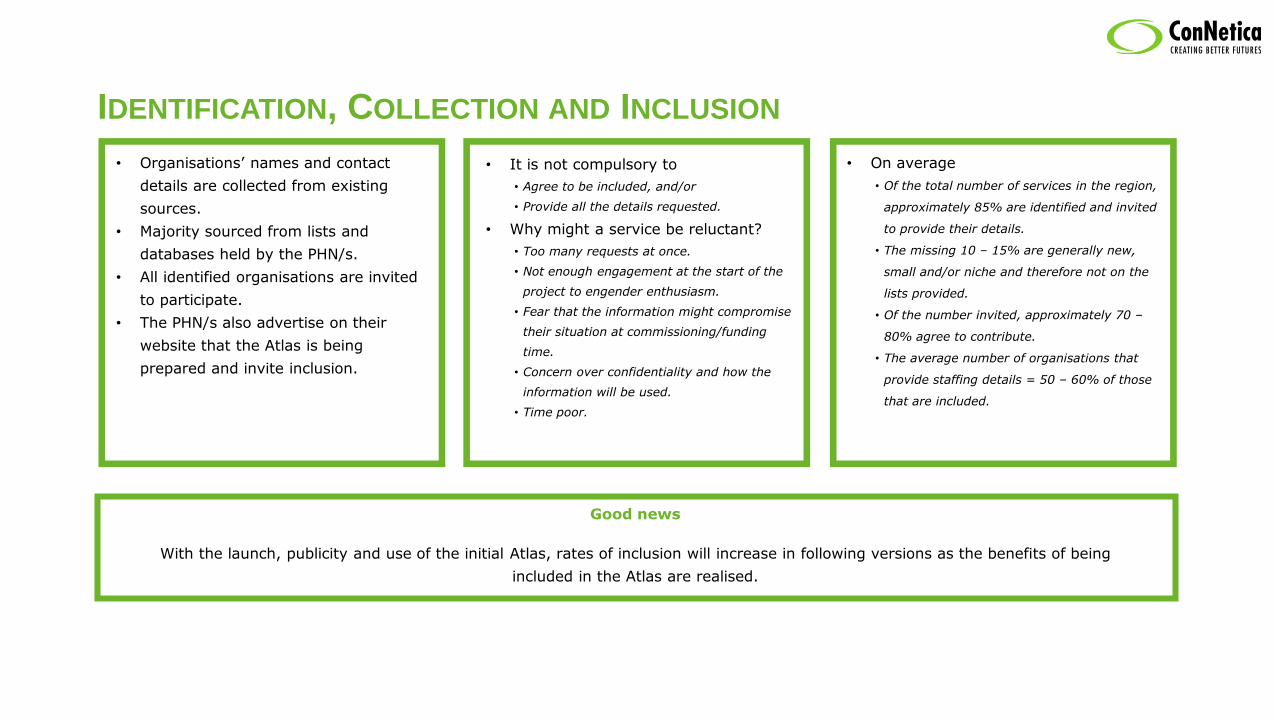
IDENTIFICATION, COLLECTION AND INCLUSION
• Organisations’ names and contact
details are collected from existing
sources.
• Majority sourced from lists and
databases held by the PHN/s.
• All identified organisations are invited
to participate.
• The PHN/s also advertise on their
website that the Atlas is being
prepared and invite inclusion.
• On average
• Of the total number of services in the region,
approximately 85% are identified and invited
to provide their details.
• The missing 10 – 15% are generally new,
small and/or niche and therefore not on the
lists provided.
• Of the number invited, approximately 70 –
80% agree to contribute.
• The average number of organisations that
provide staffing details = 50 – 60% of those
that are included.
• It is not compulsory to
• Agree to be included, and/or
• Provide all the details requested.
• Why might a service be reluctant?
• Too many requests at once.
• Not enough engagement at the start of the
project to engender enthusiasm.
• Fear that the information might compromise
their situation at commissioning/funding
time.
• Concern over confidentiality and how the
information will be used.
• Time poor.
Good news
With the launch, publicity and use of the initial Atlas, rates of inclusion will increase in following versions as the benefits of being
included in the Atlas are realised.

ATLAS METHODOLOGY - ANALYSE
Code
• Apply DESDE
Code
Map
• Create geo-spatial
maps of services
• Map socio-
demographic
indicators
• Prepare Patterns
of Care graphs
Report
• Key findings
Collect
• Conduct face
to face
interviews
• Conduct
telephone
interviews
• Survey
Analyse
• Determine
eligibility
• Collate
information
• Follow up for
clarity
Identify
• Engage
stakeholders
• Identify
organisations
• Invite them to
participate

ELIGIBILITY
• Specialised
• Service must target people with a
lived experience of the condition
being mapped (Mental health and
AOD in the EMPHN Atlases)
• Stable
• Has or will receive funding for three
years unless a specific reason for
inclusion (Code includes “v” qualifier)
• Accessible
• Universally accessible services.
• Do not require payments by the
consumer
WHY?
Because commissioning and planning decisions must be made on the basis of data that is long-term and represents the current and
possibly future state of the region.
• Located within region
• Service must be located within the
region being mapped or provides
services to population within the
region being mapped
• Direct care provision
• The service must provide direct
care/support to consumers
• There must be some level of direct
contact.

ATLAS METHODOLOGY – CODE
Collect
• Conduct face
to face
interviews
• Conduct
telephone
interviews
• Survey
Analyse
• Determine
eligibility
• Collate
information
• Follow up for
clarity
Identify
• Engage
stakeholders
• Identify
organisations
• Invite them to
participate
Code
• Apply DESDE
Code
Map
• Create geo-spatial
maps of services
• Map socio-
demographic
indicators
• Prepare Patterns
of Care graphs
Report
• Key findings

WHY CODE? WHY USE DESDE-LTC? Because there is a problem with nomenclature…
2. What do you see?
• A House?
• Cabin?
• Arrow?
• Rocket?
• Building?
• Pointer?
• 2, 3, 4 Bedrooms?
• 1, 2 Bathrooms?
• Wood, Fibro, Brick?
• On street parking, Single/Double garage?
• Single/Double storey?
• New?? Renovators delight?
• etc…
Let’s say you see a House…
1. Look at this shape 3. Is it….
The example shows that if you do not have the right amount of information you really cannot say what this is
e.g. House? Arrow? Rocket? Size? Location? Purpose?

WHY CODE? WHY USE DESDE-LTC?
Although the description is different – these may all be the same.
Single storey brick house with 2 bedrooms
Home to suit a small family with low maintenance construction and
ease of access
Solid renovators delight with opportunity to add bedrooms to
suit large family
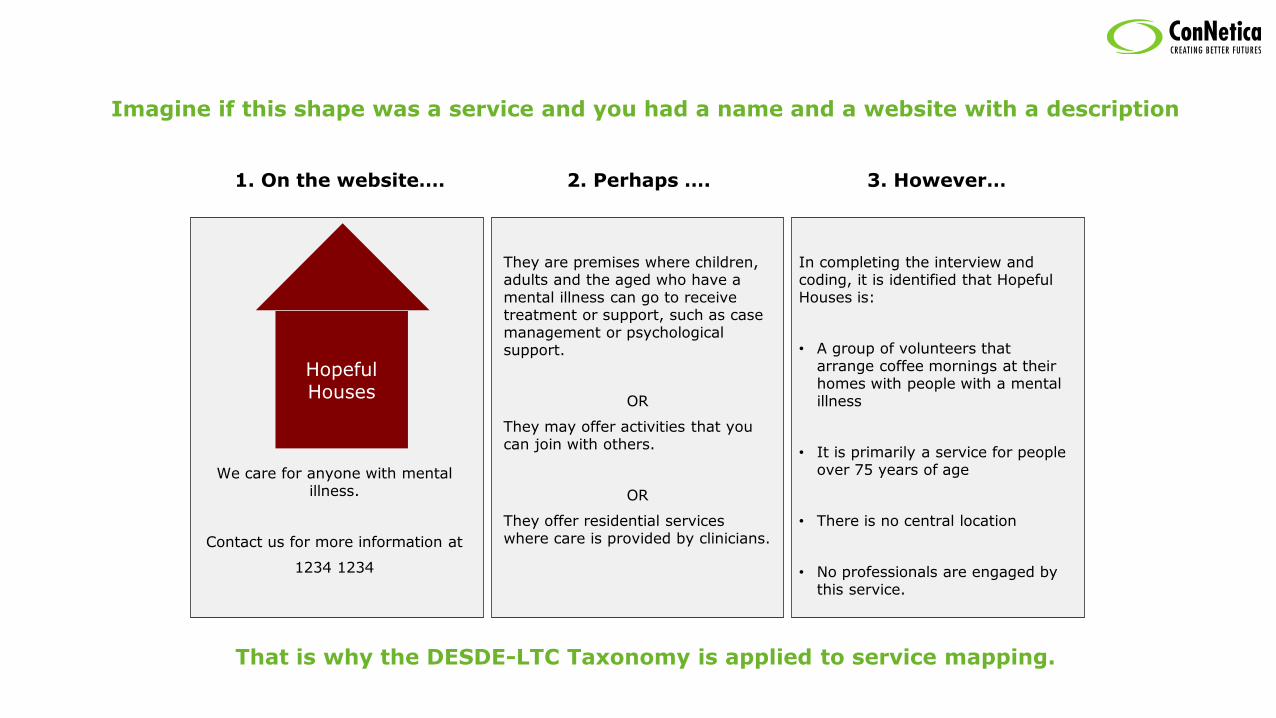
Hopeful Houses
Imagine if this shape was a service and you had a name and a website with a description
We care for anyone with mental illness.
Contact us for more information at
1234 1234
3. However…
They are premises where children, adults and the aged who have a mental illness can go to receive treatment or support, such as case management or psychological support.
OR
They may offer activities that you can join with others.
OR
They offer residential services where care is provided by clinicians.
In completing the interview and coding, it is identified that Hopeful Houses is:
• A group of volunteers that arrange coffee mornings at their homes with people with a mental illness
• It is primarily a service for people over 75 years of age
• There is no central location
• No professionals are engaged by this service.
1. On the website…. 2. Perhaps ….
That is why the DESDE-LTC Taxonomy is applied to service mapping.

THE DESDE-LTC CODE
Description and Evaluation of Services and
Directories in Europe for Long Term Care
• International taxonomy and coding system
• Analyses services based on:
• Teams, and
• Main Types of Care being delivered
• Each team’s main care type is coded
following comprehensive practices to
ensure that patterns of care can be
recognised and the function of the team is
understood.

THE CODE-COMPONENTS
Over 140 individual codes within 6 Main Type of Care
R - RESIDENTIAL
The person sleeps at the facility (e.g. acute unit -hostel)
D - DAY CARE
The person spends the day at the facility (e.g. day hospital or social club)
O – OUTPATIENT
Contact with the person in a limited period of time (e.g. visit with the GP)
A – ACCESSIBILITY
Access to care WITHOUT direct provision of care related to needs (e.g.
access to employment)
I – INFORMATION
Guidance/ information WITHOUT follow up (e.g. information about service
availability)
S - SELF CARE/VOLUNTARY
Non-paid staff (e.g. Alcoholic Anonymous)

MAIN TYPES OF CARE - TAXONOMY
143 codes in total – Listed in the report’s Appendix
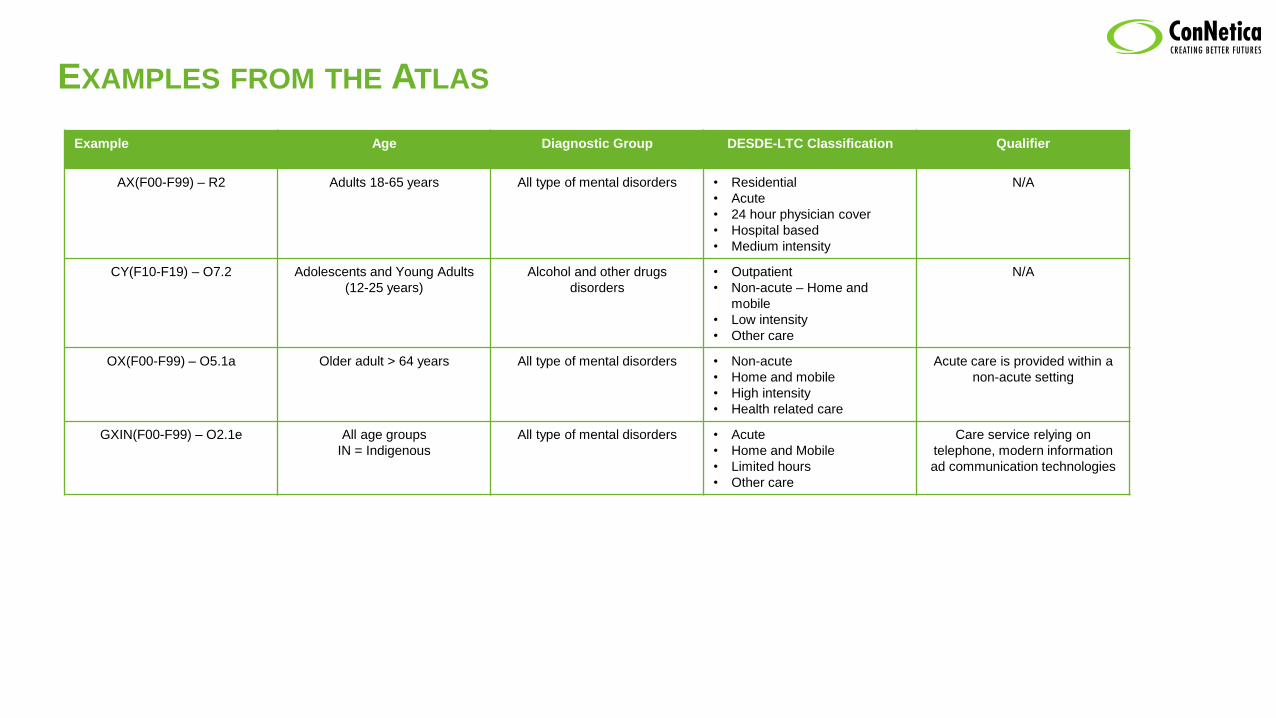
EXAMPLES FROM THE ATLAS
Example Age Diagnostic Group DESDE-LTC Classification Qualifier
AX(F00-F99) – R2 Adults 18-65 years All type of mental disorders • Residential
• Acute
• 24 hour physician cover
• Hospital based
• Medium intensity
N/A
CY(F10-F19) – O7.2 Adolescents and Young Adults
(12-25 years)
Alcohol and other drugs
disorders
• Outpatient
• Non-acute – Home and
mobile
• Low intensity
• Other care
N/A
OX(F00-F99) – O5.1a Older adult > 64 years All type of mental disorders • Non-acute
• Home and mobile
• High intensity
• Health related care
Acute care is provided within a
non-acute setting
GXIN(F00-F99) – O2.1e All age groups
IN = Indigenous
All type of mental disorders • Acute
• Home and Mobile
• Limited hours
• Other care
Care service relying on
telephone, modern information
ad communication technologies
Pro
vid
ers 24
Serv
ice D
eliv
ery
Tea
ms
190
MT
C 215
DE
SD
E C
od
es 49
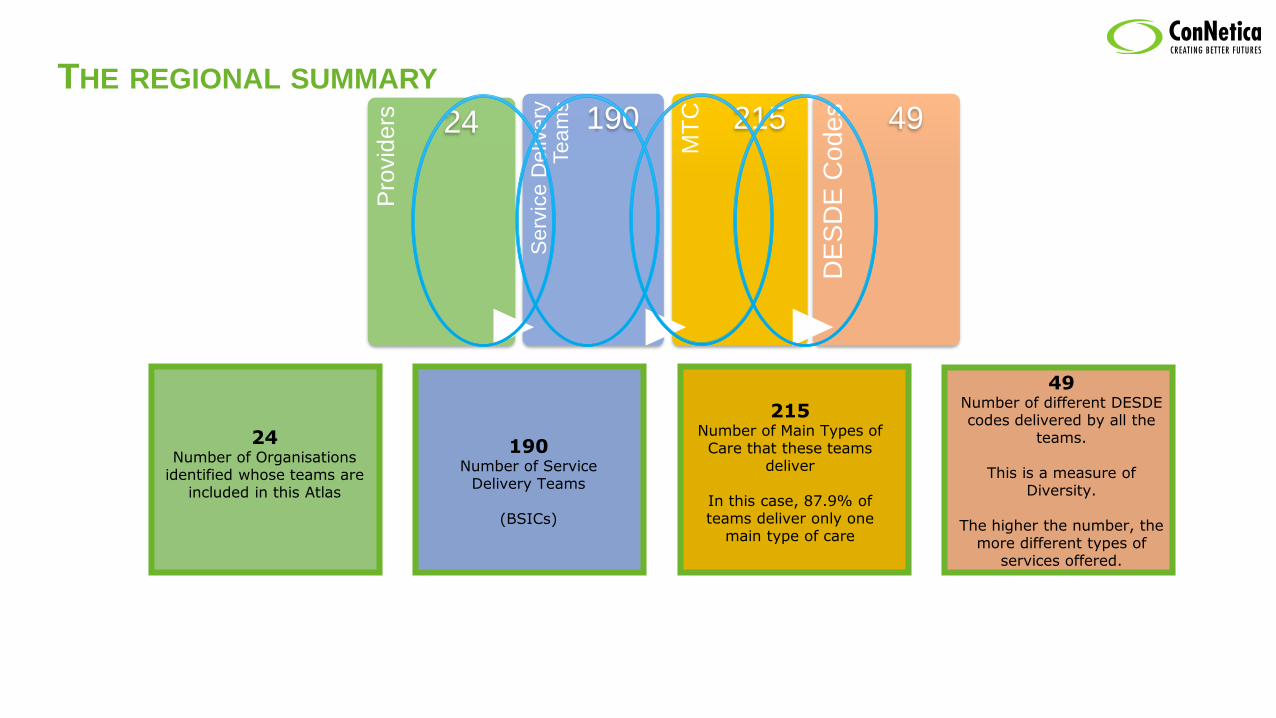
THE REGIONAL SUMMARY
24Number of Organisations
identified whose teams are included in this Atlas
190Number of Service
Delivery Teams
(BSICs)
215Number of Main Types of Care that these teams
deliver
In this case, 87.9% of teams deliver only one
main type of care
49Number of different DESDE codes delivered by all the
teams.
This is a measure of Diversity.
The higher the number, the more different types of
services offered.
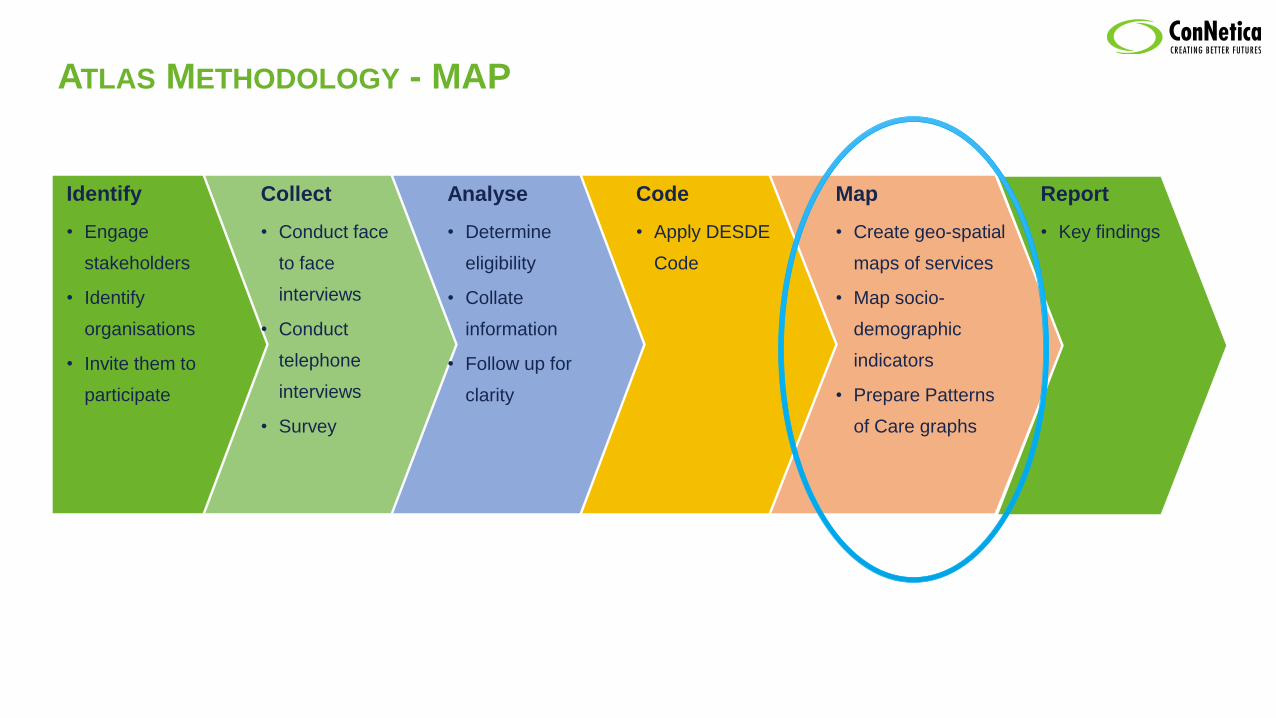
ATLAS METHODOLOGY - MAP
Collect
• Conduct face
to face
interviews
• Conduct
telephone
interviews
• Survey
Analyse
• Determine
eligibility
• Collate
information
• Follow up for
clarity
Code
• Apply DESDE
Code
Map
• Create geo-spatial
maps of services
• Map socio-
demographic
indicators
• Prepare Patterns
of Care graphs
Report
• Key findings
Identify
• Engage
stakeholders
• Identify
organisations
• Invite them to
participate
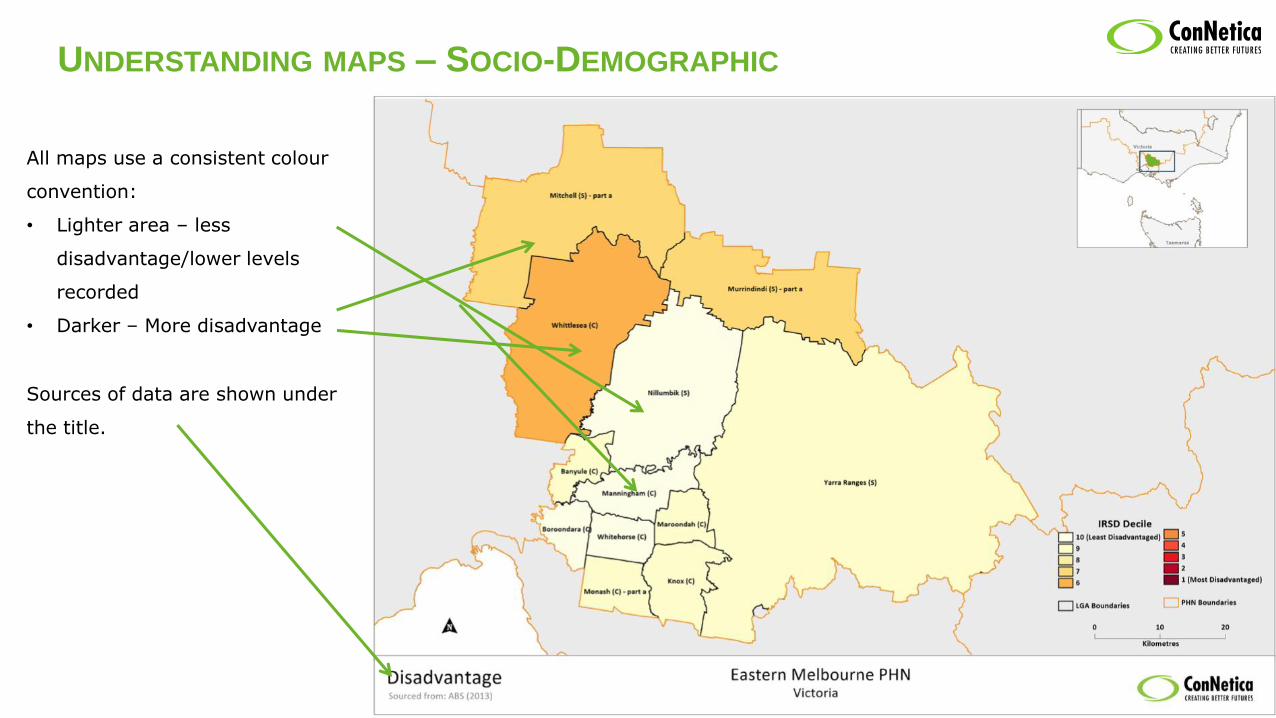
UNDERSTANDING MAPS – SOCIO-DEMOGRAPHIC
All maps use a consistent colour
convention:
• Lighter area – less
disadvantage/lower levels
recorded
• Darker – More disadvantage
Sources of data are shown under
the title.
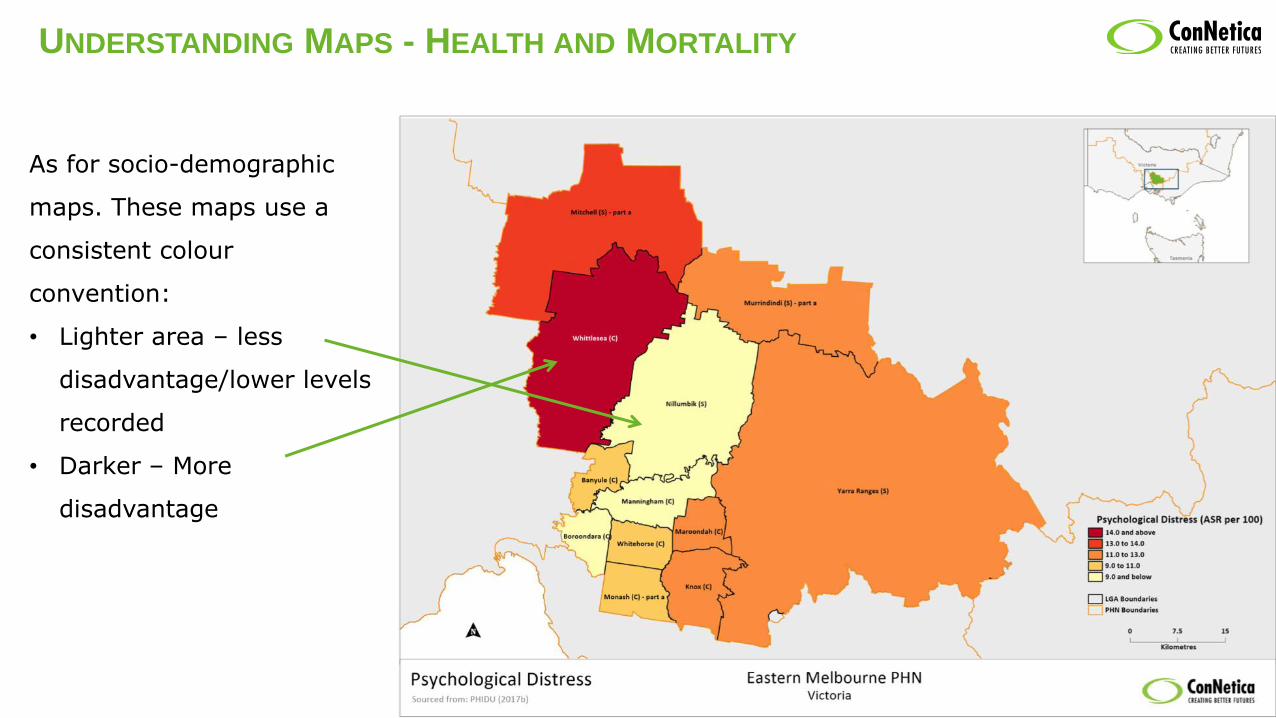
UNDERSTANDING MAPS - HEALTH AND MORTALITY
As for socio-demographic
maps. These maps use a
consistent colour
convention:
• Lighter area – less
disadvantage/lower levels
recorded
• Darker – More
disadvantage

UNDERSTANDING MAPS – SERVICES
Each service is identified as follows:
1. Type in colour:
- Health service (Department of), or
- Other, e.g. NGO, Community, Voluntary
2. Service/Team name
3. Level 2 DESDE code
4. Age group:
• A Adult
• C Child, Youth and Adolescents
• O Older Adults
Each Red Pointer marks the location of the
service
IRSD is represented on this map also to
show where there is disadvantage and the
services to support those with mental
illness.
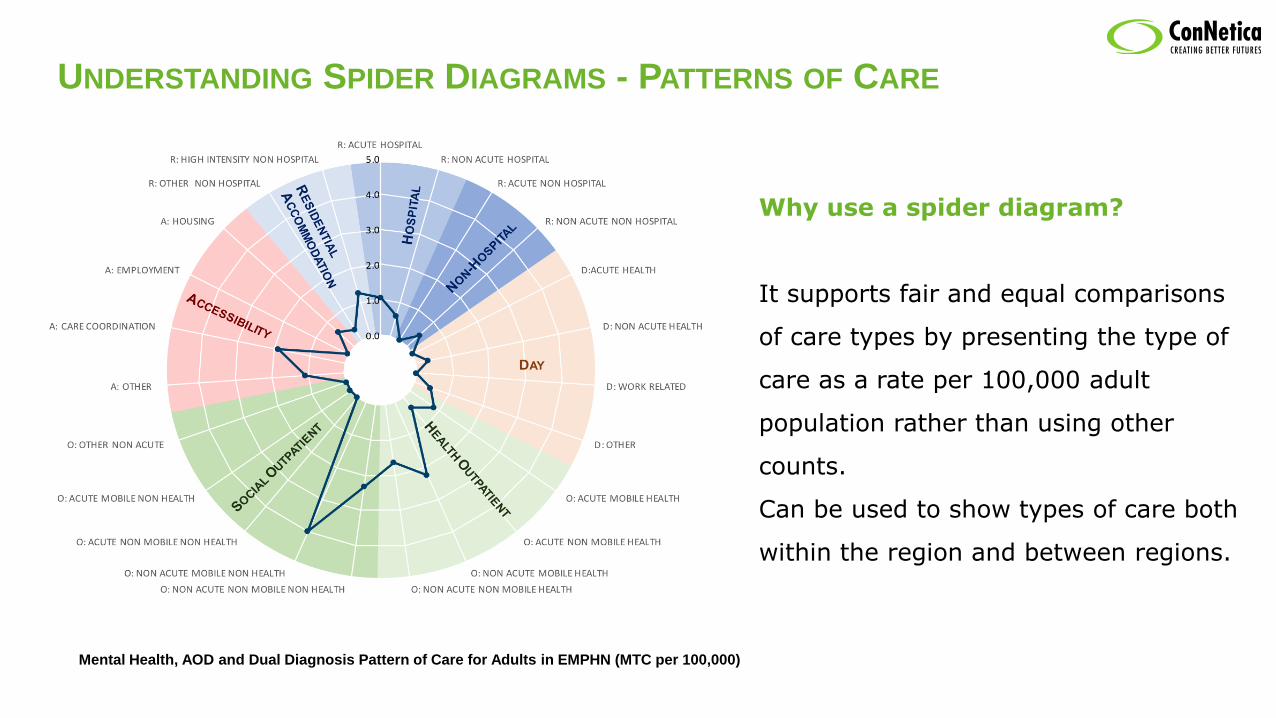
UNDERSTANDING SPIDER DIAGRAMS - PATTERNS OF CARE
Mental Health, AOD and Dual Diagnosis Pattern of Care for Adults in EMPHN (MTC per 100,000)
Why use a spider diagram?
It supports fair and equal comparisons
of care types by presenting the type of
care as a rate per 100,000 adult
population rather than using other
counts.
Can be used to show types of care both
within the region and between regions.

UNDERSTANDING SPIDER DIAGRAMS - PATTERNS OF CARE
PATTERNS OF CARE - EMPHN & BNPHN Name of the spider
Main Types of Care
Levels 1 and 2
Each type of care has a specific colour
Legend
Indicates the areas being compared
Scale
Rate per 100,000 population of each care type
Near the Centre –Less teams/services of that type
Further out – More teams/services of that type

WHAT DOES THIS SPIDER TELL US?
PATTERNS OF CARE FOR MENTAL HEALTH – BNPHN & EMPHN
• Day Care
• Almost no Day Care services identified in both
PHN regions
• Accessibility to Care
• Greater levels of care coordination, housing and
other accessibility services identified in EMPHN
• We are comparing the Patterns of Care in Brisbane
North PHN (Red) with Eastern Melbourne PHN (Blue)
• Residential Care
• Both regions deliver care in Acute Hospital Wards
• Both regions have limited sub-acute and non-
hospital residential care services
• Very low levels of Non Acute & Non Hospital
services
• Outpatient Care
• Highest type of care delivered in the region per
100,000 population
• High delivery of Non Acute, Non Mobile and Mobile
services in both regions

THE ATLAS – CONTEXT
Patterns of care are not right or wrong
– they just are a snapshot of data
reflected as a spider.
The number of teams and types of
care are not right or wrong – they are
also a snapshot.
However it needs to be utilised in
context with other key planning
information such as
• service utilisation
• resource availability
• future trend analysis
• financial analysis and forecasting
• political and organisational priorities,
and most importantly
• Regional outcomes measures.
The Atlas does not provide an answer
– it is a source of information to
inform.
It is a building block in a knowledge
base for planning – toward a decision
support system.
It will inform plans, assessments, other
listings, new models of care and
identification of change over a period
of time.
The Atlas itself is not an opinion piece – it represents a snap shot in time of the services and associated indicators that pertain to a
chosen region.
The terminology used in the Atlas may not perfectly match Australian terminology – this is because of the nature of using an
international coding system.

ANY QUESTIONS?
Please Contact
THANK YOU