Embed Size (px)
Citation preview

7
Reading Mobile Robots and 3D Cognitive Mapping
Hartmut Surmann, Bernd Moeller, Christoph Schaefer and Yan Rudall University of Applied Science of Gelsenkirchen
Fraunhofer IAIS Sankt Augustin Germany
1. Introduction
Cognition and perception forms a central basis for human intelligent behaviour. Humans are capable of building their own environment and adding several artefacts to it. It allows us to detect and localize objects, and based on that to perform tasks or to localize ourselves and furthermore to find persons who work e.g. in offices. Every year, since the last two decades, people have been forecasting breakthroughs of services robots on the service robot market (Siegwart et al., 200, Haegle et al. 2001). Nevertheless the reality is grey. Two of several reasons are a relatively high price and an unintelligent behaviour of the robot systems. At this point the contribution of this chapter starts. We will present a novel approach, on how a mobile robot actively creates a geometric 3D cognitive map with ROS1 and consumer hardware, which forms a basis for further intelligent behaviours.
The 3D maps are created with a mobile robot, in this case a Roomba from iRobot2, a Sick laser scanner LMS 1003 and a Canon standard high resolution digital camera. In the first part of this chapter we present a new approach to create precise, high resolution, 360° 3D point clouds, which are not depending on the surface the robot stands on. Based on the 360° 3D point clouds we extract semantic information like floors, walls, ceilings and room dimensions (Nuechter et. al. 2005). Furthermore the second part of this chapter shows a novel approach on how to solve the localization problem for mobile robots, by reading doorplates as non-artificial font based landmarks in indoor environments. We present an extended OCR version, to recognize doorplates, and a method to detect doorplate candidates, based on reflection values of a 3D point cloud. After the generation of a 3D point cloud, the mobile robot actively drives to the doorplate candidates and takes high resolution images with a consumer digital camera (Lingemann et. al. 2005). The automatically read textual content of the doorplates are added to the doors in a 3D map. Our approach is not a single novel algorithm; it is a collection and intelligent integration of known technologies and approaches with consumer hardware. This makes it possible to keep the total costs for
1 http://www.ros.org/wiki/ 2 www.irobot.com/Roomba 3 http://www.sick.com/group/EN/home/products/product_news/laser_measurement_systems/ Pages/lms100.aspx
www.intechopen.com

Human-Centric Machine Vision
126
the robot low. A certain highly interesting feature for architects and potential tenants is that the robot is able to build up maps which are similar to the maps google streetview creates, but indoors. A home inspection can thus be made quickly online without having to be present.
We have to account several topics to evaluate the state of the art our paper deals with. There are a few algorithms to create 2D and 3D-maps, e.g. Gmapping (Grisetti et. al. 2006, Thrun et. al. 2005), Karto4, 6D-SLAM (Surmann et. al. 2004) and many more. These algorithms can be all put together in one concept called SLAM (Simultaneuos Localization and Mapping). Durrant-Whyte & Bailey gives a very good introduction to SLAM in their survey paper (Durrant-Whyte & Bailey 2006). SLAM includes all methods that work with 2D or 3D sensor data. This sensor data is put together by a comparison method to create a map. Given that the last position of the robot, after the scan is taken, is known, the position of the robot in map is known too. Therefore the position of the robot is calculated by the adjustment of the last measurement. Until now the fastest method to create 3D-Maps, is the continuously updated version of the 6D-SLAM method. An example for a mobile robot, which creates 3D-maps using a two-dimensional laser scanner, is the robot Kurt-3D (Holz et. al. 2010). Our current approach updated the former work in many different ways. At First we built a cheaper robot, by using a cheaper and lighter 2D scanner with better servos (dynamixels). Then secondly, the algorithm to generate 3D scans was optimized (section 4). Furthermore we added OCR techniques to get textual information of indoor environments. There are already some 3D-sensors which are capable of creating 3D-maps e.g. from Riegel5, Leica6 or Zoller&Froehlich7. They are very precise, but also very expensive. Other 3D sensors like the Microsoft-Kinect8 are very cheap and useful for navigation, but also very imprecise and limited in their field of view. But current research tries to overcome these drawbacks. Stereo vision is also useful for robot mapping (Lowe & Little 2001) but cameras have a limited field of view and problems to generate dense 3D point clouds (May et. al. 2007). These approaches are time consuming and have problems in not structured environments e.g. corridors. Nevertheless all of these are used to generate 3D maps. 3D information is not only used to build maps, it is also used to find and classify objects and structures. One possible way to recognize objects in a point-cloud is to use the RANSAC algorithm9. RANSAC stands for Random Sample Consensus and grabs a sample out of the 3D-point-cloud and compares it with a mathematical model e.g. a plane equation. With the help of this algorithm, a route to the found object can be calculated and the robot is driven to the desired position.
It is natural for humans, to use visual information to sense the environment around them. Humans are capable of finding their path, with the help of their eyes. To make this easier in urban environments, there are many landmarks, like signs with street names or house numbers. For indoor environments, there are doorplates, direction signs and floor plans. With all this in mind, it seems logical to give robots the same capabilities of using those landmarks. Unfortunately there is only little work done in this area of robotics. Most work is done in the field of video mining (Weinman 2008). Video mining tries to read textual
4 http://www.ros.org/wiki/karto 5 RIEGL Laser Measurement Systems: http://www.riegl.com 6 Leica Geosystems: http://www.leica-geosystems.com 7 Zoller&Fröhlich: http://www.zf-laser.com 8 http://research.microsoft.com/en-us/um/redmond/projects/kinectsdk/download.aspx 9 http://en.wikipedia.org/wiki/RANSAC
www.intechopen.com

Reading Mobile Robots and 3D Cognitive Mapping
127
Fig. 1. a) Schematic overview of the hardware components and b) mobile robot with the 2D
laser scanner (Sick LMS 100), the consumer camera (Canon Powershot SX 110 IS, 9-
megapixel, 10x optical zoom) and the servo motors by Dynamixel. The scanner is in the start
/ end position. For the 3D scan it is turned perpendicular.
www.intechopen.com

Human-Centric Machine Vision
128
information out of video streams and first approaches are nearly 20 years old. Currently computers have barely reached the reading level accuracy of a second-grade child. Mostly the limited resolution of videos makes it difficult to read its text, but the approaches have interesting methods to detect text areas. A cogent survey of the document image analysis field, as represented by publications in the “Transactions on Pattern Analysis and Machine Intelligence”, is given by Nagy. But why is it so difficult? Standard OCR needs around 300 dpi resolution pictures to achieve good conversion results. A 2-megapixel camera can cover an area of 4x6 inches, which is the size of a doorplate. But for a mobile robot it is difficult to move a camera so near to the object, that a precise picture can be taken. This lets us come to the conclusion that most of the known approaches from books, do not work with real mobile robots. A very time consuming way, to solve the problem, is to patch several images to one high resolution image (Mirmehdi et. al. 2001). Another solution suggests that robots should use a robot arm, to position the camera directly in front of the picture, but this is a very expensive way of solving the problem (Prats et. al. 2005). Other groups implement special techniques to read a couple of letters or numbers to avoid or substitute standard OCR (Baron 2002). Our approach to reading signs is different in a way that we use a real cheap mobile robot ($300) with a cheap consumer digital camera ($150), and combine it with a standard OCR algorithm, so that we have a really cheap and universal approach. The camera has a 10 x optical zoom and 9-megapixel resolution which allow us to focus objects from up to 3 meters distance at different angles. Distortion of the images could be removed because of the high quality and resolution of the images. In the upcoming sections the hardware setup, 3D measurement, tangents classification and the OCR approach will be described.
2. Hardware setup and system design
Special soft- and hardware is required to create 3D-measuremnts and to further process information. Software components are responsible to control the hardware, and in addition to store and process sensor data. Hardware components are used to position the robot and to capture room measurements. The following software represents libraries or algorithms which are used in this work. Some of these libraries and tools are offered by ROS, which stands for robot operating system, and comes with a lot of functionalities e.g. hardware drivers, visualisation tools and many more. Additionally 6D-SLAM is used, which is an extremely efficient SLAM (Simultaneous Localization and Mapping) algorithm to register 3D point-clouds based on ICP (Iterative Closest Point) (Besl & McKay 1992). 6D-SLAM calculates a correction of a transformation of two given 3D point-clouds. Point clouds are processed by the PCL (Point cloud library), which represent a library to process x-dimensional point clouds. To process image information the OpenCV (Open Source Compute-Vision library) is used, which contains over five-hundred algorithms for image processing. The hardware architecture is build up in many different components.
It contains a Roomba which is a vacuum cleaner built by iRobot. All hardware components are installed on the Roomba. A Netbook is used to deal with the huge amount of information processed by the 3D-point-cloud. One of the most important sensors used, is the LMS 100 2D-Laserscanner by Sick. It sends out a quick impulse of a laser beam and calculates the distance by measuring the time it needs to receive the laser beam. The laser scanner is moved by servomotors created by Dynamixel. In this way it is possible to build up 3D-maps by rotating the Roomba and the laser scanner. At last it uses a standard Canon
www.intechopen.com

Reading Mobile Robots and 3D Cognitive Mapping
129
PowerShot SX110 IS digital camera to make an image of a doorplate. Figure 1 shows the setup. A video can be found at YouTube.10
3. 3D-measurement
A laser scan represents a 2D view of a certain area. To create a 3D laser scan, many two-dimensional laser scans have to be put together. To do this, the 2D laser scanner has to rotate over its own axis and record its laser scan continuously. The laser scans, which are in three dimensional spaces, are projected on a plane, which equates the coordinate plane. In ROS all laser scans are projected on a xy plane, at which x is equal to zero degrees. Furthermore each laser scan has a start and an end value, and the angular resolution represents the distance to an object. Afterwards the projected points are transformed into the coordinate system and added to the three dimensional point clouds. One task to solve is how to move the laser scanner to build up a 3D space. A well-established method is to rotate the laser scanner over one of its axis (e.g. Kurt3D). Another method is to align the laser scanner to a plane, from which the perpendicular is not 90 degrees to the direction of motion, because if this happens, the whole area will not be scanned properly. A third method is a combined measurement, where the robot moves and simultaneously the laser scanner is rotated over one of its axis. One huge advantage is that there is not much memory space required and if the surface is uneven, the scan doesn’t have to be adjusted by the laser scanner. The transformation between the different measurements is calculated by the servomotors attached to the laser scanner and by the odometry of the robot. The trouble is that after calibrating the robot on a surface (e.g. carpet) the 3D scan will work correctly, but putting it onto another surface (e.g. wooden floor) will cause irregularities. To solve this problem an online correction has to be done. Here in this work the 3rd method is used. The laser scanner is perpendicular to the floor and the robot rotates. In a first step the orientation of the laser scanner is calculated by its odometry. The Sick LMS 100 laser scanner has a 270 degree opening angle, which leaves the robot not appearing in the scan taken. So how can precise 3D point clouds be acquired, based on imprecise odometry, especially at different surfaces? The trick is a reference measurement at the beginning and at the end of the 3D scan. Therefore the laser scanner will rotate (90 degrees) to take an initial horizontal 2D scan. After the initial scan is taken, the scanner is rotated to its perpendicular position and the robot starts turning. Only a 180° robot turn is necessary to take a complete 360° point cloud since the 2D laser has an open angle of 270°. Nevertheless the robot also turns 360° and acquires a few more perpendicular scans e.g. over a 190° turn and then moves back in its horizontal position. Now the second reference scan is taken and compared via ICP with the initial one. The ICP algorithm matches these two scans and results with the odometry position error during the turn. We estimate that this error is equally distributed during the rotation of the robot and the 3D point cloud is corrected e.g. reduced or enhanced with perpendicular 2D scans. Figure 2 visualizes the procedure and figure 3 shows an acquired 360° point cloud.
In addition to the distance values of the scanner, the reflected values among of light (remission values) are also acquired during the 3D scan. These remission values lead to a black and white panorama image (Figure 4). The remission value panorama image is used to calculate candidate positions of door plates (section OCR).
10 http://www.youtube.com/watch?v=Il_aabmWeW8.
www.intechopen.com

Human-Centric Machine Vision
130
+
Fig. 2. a) Position of the laser scanner while turning the robot (3D scan). b) Start and end position of the laser scanner for pose (turning) error estimation.
Fig. 3. a) Scan results without and with pose correction. b) 3D scan with remission values.
Fig. 4. Top: Panorama view generated with the remission values of the 3D scan. Bottom:
Panorama generated by second turn of the robot with the panorama software hugin.11
11 http://hugin.sourceforge.net/
www.intechopen.com

Reading Mobile Robots and 3D Cognitive Mapping
131
3.1 Classification
The basic classification is done with the tangent segmentation. The tangent segmentation is a method to extract planar surfaces of a 3D point cloud. For each point of the point cloud a neighboring point is determined and the angle between these two points is calculated. For the determination of the neighboring point the original scan order of the scanner is used e.g. the information that the calculation of the 3D point cloud is based out of 2D scans (fig. 2). For a point P1 of a 2D scan plan, a candidate point P2 is a point acquired after P1 and the Euclidean distance between P1 and P2 is larger than 20cm. A minimal distance between P1 and P2 is necessary to avoid angle oscillation since the precision of scan values is around 1 cm.
Fig. 5. a) Semantically labeled 3D point cloud from a single 360° 3D scan in an indoor environment. Green points mark the floor and ceiling, red and blue points mark the different walls, white points are unclassified.
The following formulas define the calculation of the two angles:
∆x = P1x – P2x, ∆y = P1y – P2y, ∆z = P1z – P2z
θ1 = arctan ((∆x2 * ∆y2)1/2/ ∆z), θ2 = arctan (∆x /∆y)
The first angle represents the angle to the z-axis of the coordinate system and the second angle is the angle to the x-axis on the xy plane. Floor and ceiling points belong to angles θ1
around 0° and 180°, walls belong to angles around -90° and 90°. θ2 is used to determine the alignment of walls which allows to detect walls that are perpendicular to each other.
3.2 Histograms
Another important information, are the dimensions between walls or floors and ceilings. A histogram over the z-values has typically two maxima in indoor environments. One maxima represents the floor and the second one the ceiling. Figure 6 shows a typical histogram. Both maxima are used to estimate the height of the room.
www.intechopen.com

Human-Centric Machine Vision
132
Fig. 6. Histogram over the z values of a 3D scan with 2 maxima. The maxima values belong to the floor and ceiling.
The histograms of the x and y axis could not directly be used as the z values since the robot is not aligned to the axis x or y while scanning. To align the walls of the 3D scan along the
axis the maxima of the histogram over the angles θ are used since most angles are at the walls and have to be at -90° or 90°. After the alignment, the length and width could also be calculated by computing the difference of the two maxima in the histogram. Figure 7 shows an example.
4. OCR
Mobile robots have to know exactly where they are in an environment in order to plan where to go next. Therefore self-localization is one field of research in autonomous mobile robotics. Robots that work in outdoor environments have the advantage of using GPS. In indoor environments e.g. office environments humans typically use signs e.g. doorplates to localize themselves. Current mobile robotic approaches are focused on laser based SLAM techniques (section 3) but real applications need to read the visual signs made by humans. A typical order like, “goto Mr. Surmann’s office” can then be executed by the robot. OCR in robotics is used to extract doorplate information and convert this information to text using, OCR engines. In office buildings doorplates are "natural" landmarks (actually doorplates are placed artificially in the environment, but the whole environment of an office, like a building is made by humans). Doorplates are used by humans to find their way through the corridors and rooms in unknown buildings.
Most doorplates contain a room number, which usually refers to a unique identifier for one room. There could be two or more doorplates with the same room number, if one room has more than one door. Often, doorplates contain additional information, like a room description, the name of the person who works in the room, or the name of the department, where the room is located. To detect a doorplate, a typical digital consumer camera is attached to the robot which will take high resolution images of the doorplate (see Fig. 1). This camera as well as many other digital consumer cameras can be completely controlled
www.intechopen.com

Reading Mobile Robots and 3D Cognitive Mapping
133
from the notebook via USB. An additional servomotor is attached to the camera to move it into the correct position. The camera is detached on the robot, and can be placed in several positions. Starting from a very low position (ground), and going up to table height. The camera has to be tilted quite a bit, to precisely read the textual information on the doorplate, at the bottom position.
Fig. 7. Example of the calculation of the space dimensions.
Fig. 8. a) Example of a typical doorplate (size 15 cm x 12 cm). b) View from the robot whereupon the digital camera is mounted at the bottom of the robot.
To localize the robot we developed two different methods. In the first method the robot only uses a digital camera. The robot moves in the environment, stops every two meters and scans for doorplate candidates while rotating the camera. If a doorplate candidate is found the camera focuses on the doorplate with the optical zoom and takes a full resolution image of the doorplate. A video of the approach can be found at YouTube.12
The second method combines a camera with a 3D scanner. First a 360° 3D laser scan is taken. Based on the remission values, the positions of doorplate candidates are extracted. The robot moves to all candidates and takes high resolution images, similar to method one. The
12 http://www.youtube.com/watch?v=HQOBXeHXQ-A
www.intechopen.com

Human-Centric Machine Vision
134
information of the OCR extraction is added to the 3D point cloud. A video of the approach can also be found at YouTube13.
4.1 Candidate search
The first part of the application is the accurate and reliable recognition of doorplates e.g. for a standalone camera based localization. The consumer camera was a Canon Powershot SX 110 IS with a 9-megapixel CCD sensor and 10x optical zoom. The camera has a weight of about 245g and is normally powered with 2 AA-size batteries, but it can also be powered alternatively with an external AC power supply. The camera delivers the display images (viewfinder) with a size of 320x240 (30hz) online. This viewfinder images are used to calculate the doorplate candidates. After that the candidates will be focused and a 9-megapixel image is taken. For robust candidate detection a simple 3 step filter is implemented. First the border color is selected in the YCrCb color space, and then the image is binarized with an adapted threshold, and preprocessed with closing and opening operations.
Fig. 9. Histogram of doorplate borders in YCrCb color space
Second, closed line contours are detected and approximated by simple polygons. Third, the aspect ratio of the contour area is measured. For our doorplates (15cm x 12 cm) the ratio between width and height has to be around 1.25. The filter is implemented with Intels OpenCV library and contains only 30 lines of code which could be easily adapted to other environments. The main advantage of the filter stage is the processing speed and accuracy.
13 http://www.youtube.com/watch?v=Il_aabmWeW8
www.intechopen.com

Reading Mobile Robots and 3D Cognitive Mapping
135
A core duo with 1.5 Ghz processes the filter in real-time (20ms). The false positive (type I error) is 0.01 and the false negative (type II error) is around 0.15 by a true positive of around 0.85 measured at one corridor with 32 doorplates.
Fig. 10. Example of the filtering process. Left original image, middle binaries image and right annotated doorplate.
In contrast to the first part of the application, which deals with view finder images, the second application is different. For the integration of textual information in the 3D point cloud the doorplate candidates are calculated based on the panorama images of the remission values. Since the remission values directly correspond with the x-y-z values, only the region of height, where the doorplates are located is selected. Simple line detections with a Sobel operator and open and closing operations extract the doorplates candidates. A test in the corridor selects 4 out of 5 doorplates, but the number of experiments is not enough for a statistic (fig. 11).
Fig. 11. Selection of doorplates candidates based on 3D scan remission values. The candidates are marked red.
4.2 Doorplate reading
Two methods have been evaluated for reading the content of the doorplate based on the candidate calculation. First the mobile robot, the digital camera and the notebook is used. No laser scanner is detached in this version (cheap approach). The robot drives randomly through the environment, stops every two meters and searches for doorplate candidates as described above. If a candidate is found it is focused with the optical zoom. The size and orientation of the doorplate is calculated based on the 3 step filter (see above). After focusing the doorplate, a full resolution image is taken. The frame of the doorplate is cut out, based on the three stage filter and distorted, based on the hypothesis that the frame should be rectangular (see fig 8, 10, 13). Now the OCR process is started with this image. A topological map with the local position information at the edges of the graph between the doorplates is created (fig 12).
www.intechopen.com
Human-Centric Machine Vision
136
Fig. 12. Topological graph of a corridor based on the first camera only approach. The content of the doorplates is read and set to the squares. The local odometry of the robot is used to mark the edges. If no doorplate is found the square is empty.
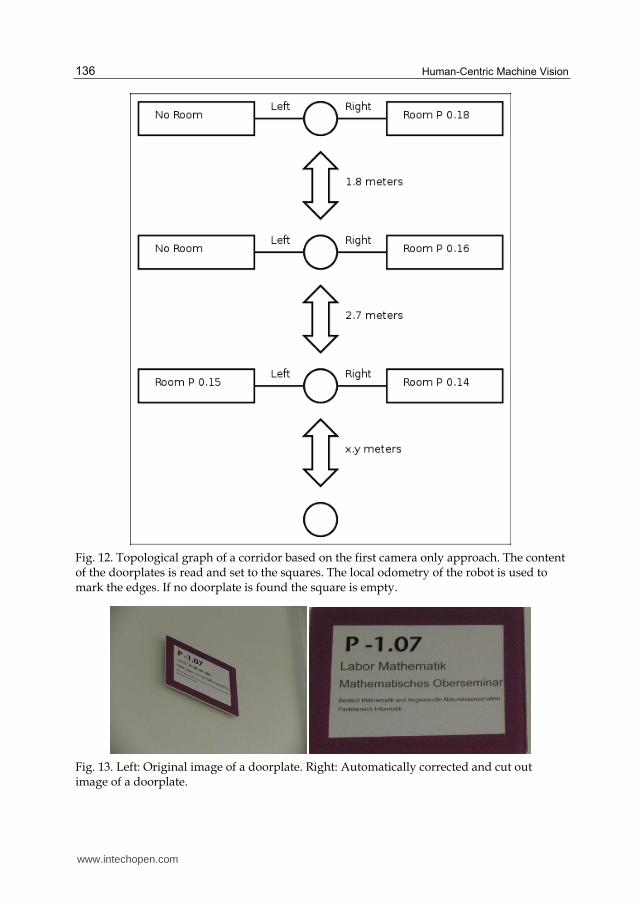
Fig. 13. Left: Original image of a doorplate. Right: Automatically corrected and cut out image of a doorplate.
www.intechopen.com

Reading Mobile Robots and 3D Cognitive Mapping
137
The second method is evaluated with the mobile robot and the 3D laser scanner (fig. 1).
After detecting the candidates in the panorama image, and based on the 3D geometrical
data a good shooting position is calculated e.g. one meter in front of the doorplate. The
mobile robot drives to all of these positions and takes high resolution images similar to
method one.14 The driving controller is a simple point based position controller. The content
of the doorplate is set to the 3D point cloud based on the position of the robot and the 3D
data of the candidate calculation. For the OCR process we evaluated different OCR engines.
4.3 Comparison of OCR engines
A lot of different OCR engines already exist so we define a test set of 46 images to test different engines. All of them can be used with the Linux operation system. The following table presents the timing results of these tests.
OCR Engine Result Time (total) Average Time (per file)
Abbyy Finereader Engine 8 for Linux[1]
73.81% 158s 3.43s
Cuneiform 1.0 for Linux[2] 3.55% 100s 2.17s
GOCR 0.45[3] 22.38% 13s 0.28s
Ocrad 0.17[4] 23.91%* 9s 0.20s
OCRopus 0.3.1[5] 45.53% 43s 0.93s
Tesseract 2.04[6] 49.41%* 22s 0.48s
Table 1. Comparison of different OCR engines. The results of entries marked with an * have been achieved with grayscale images for the OCR process. For these engines, colored images produced lower quality results. The total time of each OCR engine relates to 46 test files, which have been processed in one batch.
The 46 images of the test set were taken autonomously by the robot with the help of a special application. The images have been automatically preprocessed by the application, so the doorplates have been cut out from the larger image and the shearing, which occurs because of the angle at which the camera was pointed at the doorplate, has been corrected.
To understand the results of the test and to evaluate or judge them in the right way, it is crucial to know how the measurement works. If a human reads a misspelled word, or a word with one character missing, he would most probably still understand the meaning of the word, this works, because the person who reads it, knows how it would be spelled correctly. A robot without any prior knowledge (like a dictionary) about the words can't achieve this. Considering this, a relatively strict rule of what is recognized correct and incorrect, was defined. To get some kind of reference data, all the images, which should be tested, have been reviewed and their content has been written into a text file. Words and lines are separated by a blank, in the same order as in the image. The example image as seen in figure 8 have the following reference data:
14 http://www.youtube.com/watch?v=Il_aabmWeW8
www.intechopen.com

Human-Centric Machine Vision
138
P 0.20 Labor Robotik u. Bildverarbeitung Bereich Allgemeine Mikroinformatik Fachbereich Informatik
For this example the output of the OCRopus engine of this image was:
Labor Robotik u. Bildverarbeitun Bereich Allgemeine Nlikroinformatik Fachbereich Informatik
Since it is time consuming to compare each file with its reference by hand, a little program was written to do the evaluation. The files get split up into several tokens, which are separated by blanks or line brakes respectively. Each token of the reference file, will be compared to each token in the OCR output and if it matches one of these, all characters and the blank will be counted as correct characters. If the reference token does not match any of the output tokens, the whole word and the blank will not be counted as correct characters. Table 2 to gives an example.
Reference Token Found / Not found Reason (if not found) Character count
P Not found Missing in output 2
0.20 Not found Missing in output 5
Labor Found 6
Robotik Found 8
u. Found 3
Bildverarbeitung Not found missing 'g' 17
Bereich Found 8
Allgemeine Found 11
Mikroinformatik Not found Wrong characters 16
Fachbereich Found 12
Informatik Found 11
Table 2. Example of an evaluation of a doorplate. As a result 59/99 = 59,6% of the characters are correct.
The result would be 59 found characters of a total of 99 characters, so the output for this one file would be only 59.6 %, although only the P 0.20 was lost and the words “Bildverarbeitung” and “Mikroinformatik” have been misspelled. In general this is not that bad at all, with the rating of only 59.6 % misspelled characters. But overall, it is still a fair rating, because in this example some most probably relevant data, the room number, is lost completely and it is difficult to distinguish between relevant and irrelevant data, before you know the content. Nevertheless a dictionary or word data base or an evaluation based on n-gram will improve the output.
The Cuneiform OCR engine had problems with some files. Therefore it was not possible to process 24 of the 46 images at all, so the whole content of the corresponding reference files
www.intechopen.com

Reading Mobile Robots and 3D Cognitive Mapping
139
could not be found in the OCR output which leads to the bad rating. Cuneiform shows a better performance with manual processed images. The Abbyy OCR engine shows the best performance concerning character recognition accuracy, but it is also the slowest engine. In this test it is the odd man out, because it is the only commercial engine. All the other engines are available for free and are under an open source license. The most promising open source OCR engines seem to be Tesseract and OCRopus. With better preprocessing and image enhancement, those two engines could deliver even better results (which is already implemented in the Abbyy OCR engine). Besides this, both engines are still under development.
Fig. 14. Example of the extracted doorplate text mapped to the 3D point cloud in front of the door (ROS rviz viewer).
5. Conclusion
With a focus to real world indoor robotics we have presented two major things. First we have shown that mobile robots can use the same source of information as humans e.g. doorplates to localize itself. This is remarkable because only a cheap mobile robot (Roomba, $300), a consumer digital camera (Canon, $150) and a notebook (Gigabyte, $300) are needed to build a topological map with the textual information of the doorplates. Also remarkable is the fact that standard software can be used to implement our approach, mainly OpenCV and ROS is used. All modules are available as open source at our svn repository at the ROS website. The robot finds doorplates autonomously in its environment. It takes high resolution images of those doorplates with a camera and the quality of the images meet
www.intechopen.com

Human-Centric Machine Vision
140
the requirements to process them effectively with standard OCR engines to extract the textual information. Unfortunately this process currently needs up to 30 seconds, manly focusing the doorplates, but there is much more potential for further improvements. However, the presented technique is a foundation for visual landmark based SLAM. The extracted data of the doorplates can be easily assembled to maps implemented as graphs. The maps are enhanced with additional geometric data, for example the distance of one doorplate to the other.
For our second contribution we extended the mobile robot with a 2D laser scanner
(+$2000) and implemented an approach to acquire precise 3D scans. Odometry based
position errors are eliminated by two additional horizontal scans at the start and end of
the 3D scan. Comparison of our approach with a $100.000 Riegl VZ-400 laser scanner
shows an average accuracy of 0.4 cm for one 3D scan. The acquired 3D point clouds are
preprocessed to extract walls, ceilings and floors based on the tan segmentation. The OCR
based reading of the doorplates is adapted to the 3D scan acquisition and the textual
information is added to the segmented 3D point cloud. Further preprocessing of the 3D
point clouds like CAD data is necessary. Also the kidnapped robot problem will be
greatly simplified, because the robot needs to only find one doorplate to know its current
position very precisely. Another great potential of this solution is the combination with
e.g. googles search engine. With the help of the Internet, or some kind of local database,
the robot is able to look up found names to get further information. For example if it reads
the name of Mr. Surmann, the robot searches the web and parses the website to double-
check if the read room number is correct or to find a corresponding phone number. For
example afterwards the robot would be able to call Mr. Surmann and inform him about
what is going on at his bureau. Another problem that can benefit from this technique is
the anchoring problem. For example the robot does not need to know the exact form of a
fire distinguisher, if it is red and the robot is able to read "Fire Distinguisher" on it, it
probably is a fire distinguisher. Current work also includes the generation of HDR
panorama images to support the tenants application.
6. Acknowledgment
This work has been funded by the European Commission under contract number FP7-
247870-NIFTI. Furthermore, we would like to thank our current and former colleagues
Sven Behnke, Rainer Worst, Thorsten Linder, Viatcheslav Tretyakov, Benjamin Fabricius,
Benjamin Koenig, Ekkehard Schrey, Gregor Lux, Andreas Nuechter, Stefan May and
Stefan Wilkes.
7. References
Baron W. (2002). Camera-based text detection and OCR, Master thesis,
http://www.ai.rug.nl/nl/colloquia/tooncolloquium.php?
afstudeerder=Wiebe+Baron&datum=26-06-2002.
Besl, P. J. & McKay, N. D. (1992). A Method for Registration of 3-D Shapes, IEEE
Transactions on Pattern Analysis and Machine Intelligence 14(2): 239–256.
www.intechopen.com

Reading Mobile Robots and 3D Cognitive Mapping
141
Clark, P. & Mirmehdi, M. (2002). Recognising text in real scenes, International Journal on
Document Analysis and Recognition, Volume 4, Number 4, pp. 243-257.
Durrant-Whyte, H.; Bailey, T. (2006). Simultaneous Localization and Mapping (SLAM): Part I
The Essential Algorithms. Robotics and Automation Magazine.
Durrant-Whyte, H.; Bailey, T. (2006). Simultaneous localization and mapping (SLAM): part II.
Robotics and Automation Magazine.
Grisetti, G.; Stachniss, C. & Burgard, W. (2006). Improved Techniques for Grid Mapping
with Rao-Blackwellized Particle Filters, IEEE Transactions on Robotics.
Haegele, M., Neugebauer, J. & Schraft, R. (2001). From Robots to Robot Assistants,
Proceedings of the 32nd International Symposium on Robotics (ISR), Seoul, South
Korea, pp. 404–409.
Holz, D.; Droeschel, D.; Behnke, S.; May, S. & Surmann, H. (2010). Fast 3D Perception for
Collision Avoidance and SLAM in Domestic Environments Mobile Robots Navigation,
Alejandra Barrera (Ed.), pp. 53-84, IN-TECH Education and Publishing, Vienna,
Austria.
Lingemann, K., Nüchter, A., Hertzberg, J. & Surmann, H. (2005a). About the Control of High
Speed Mobile Indoor Robots, Proceedings of the Second European Conference on
Mobile Robots (ECMR), Ancona, Italy, pp. 218–223.
Lowe, D. & Little, J. (2001). Vision-based mobile robot localization and mapping using scale-
invariant features. ICRA 2001.
May, S.; Pervoelz, K. & Surmann, H. (2007). 3D Cameras: 3D Computer Vision of wide Scope,
International Journal of Advanced Robotic Systems, pp. 181-202, Vol. 4, Advanced
Robotic Systems (ARS), Vienna.
Mirmehdi, M.; Clark P. & Lam, J. (2001). Extracting Low Resolution Text with an Active Camera
for OCR, Proceedings of the IX Spanish Symposium on Pattern Recognition and
Image Processing.
Nagy, G. (2000). Twenty years of document image analysis in PAMI. IEEE Transactions on
Pattern Analysis and Machine Intelligence 22, 1, 38–62.
Nuechter, A., Lingemann, K., Hertzberg, J., Wulf, O., Wagner, B. & Surmann, H. (2005). 3D
Mapping with Semantic Knowledge, Proceedings of the RoboCup International
Symposium 2005: Robot Soccer World Cup IX, Osaka, Japan, pp. 335–346.
Prats, M.; Sanz, P.J. & del Pobil, A.R. (2005). Model-based tracking and hybrid force/vision control
for the UJI librarian robot. IROS 2005.
Samarabandu, J. & Liu, X. (2002). An Edge-based Text Region Extraction, International Journal
of Signal Processing Volume 3 Number 4.
Siegwart, R., Arras, K. O., Bouabdallah, S., Burnier, D., Froidevaux, G., Greppin, X., Jensen,
B., Lorotte, A., Mayor, L., Meisser, M., Philippsen, R., Piguet, R., Ramel, G., Terrien,
G. & Tomatis, N. (2003). Robox at Expo.02: A large-scale installation of personal robots,
Robotics and Autonomous Systems 42(3-4): 203–222.
Surmann, H.; Nuechter, A; Lingemann, K. & Hertzberg, J. (2004). 6D SLAM - Preliminary
Report on closing the loop in Six Dimensions, Proceedings of the 5th IFAC Symposium
on Intelligent Autonomous Vehicles (IAV '04).
Thrun, S.; Burgard, W. & Fox, D. (2005). Probabilistic Robotics. MIT Press, Cambridge,
MA.
www.intechopen.com

Human-Centric Machine Vision
142
Weinman, J. (2008). Unified detection and recognition for reading text in scene images. PhD.
Thesis, http://www.cs.grinnell.edu/~weinman/pubs/weinman08unified.pdf
www.intechopen.com

Human-Centric Machine VisionEdited by Dr. Fabio Solari
ISBN 978-953-51-0563-3Hard cover, 180 pagesPublisher InTechPublished online 02, May, 2012Published in print edition May, 2012
InTech EuropeUniversity Campus STeP Ri Slavka Krautzeka 83/A 51000 Rijeka, Croatia Phone: +385 (51) 770 447 Fax: +385 (51) 686 166www.intechopen.com
InTech ChinaUnit 405, Office Block, Hotel Equatorial Shanghai No.65, Yan An Road (West), Shanghai, 200040, China
Phone: +86-21-62489820 Fax: +86-21-62489821
Recently, the algorithms for the processing of the visual information have greatly evolved, providing efficientand effective solutions to cope with the variability and the complexity of real-world environments. Theseachievements yield to the development of Machine Vision systems that overcome the typical industrialapplications, where the environments are controlled and the tasks are very specific, towards the use ofinnovative solutions to face with everyday needs of people. The Human-Centric Machine Vision can help tosolve the problems raised by the needs of our society, e.g. security and safety, health care, medical imaging,and human machine interface. In such applications it is necessary to handle changing, unpredictable andcomplex situations, and to take care of the presence of humans.
How to referenceIn order to correctly reference this scholarly work, feel free to copy and paste the following:
Hartmut Surmann, Bernd Moeller, Christoph Schaefer and Yan Rudall (2012). Reading Mobile Robots and 3DCognitive Mapping, Human-Centric Machine Vision, Dr. Fabio Solari (Ed.), ISBN: 978-953-51-0563-3, InTech,Available from: http://www.intechopen.com/books/human-centric-machine-vision/reading-mobile-robots-and-3d-cognitive-mapping

© 2012 The Author(s). Licensee IntechOpen. This is an open access articledistributed under the terms of the Creative Commons Attribution 3.0License, which permits unrestricted use, distribution, and reproduction inany medium, provided the original work is properly cited.